data profilingdata profiling e 5 this paper examines the reasons for and the process of data...
TRANSCRIPT

Data Profiling A Quick Primer on the What and the Why of Data Integration
AUTHORS
Shankar Ganesh R Senior Technical Architect Architecture and Technology Services HCL Technologies, Chennai
Sathish Kumar Srinivasan Enterprise Data Architect Architecture and Technology Services HCL Technologies, Chennai
Subramanyam B S
Lead Researcher ATS-Technical Research HCL Technologies, Chennai

Data Profiling
Pag
e2
Table of Contents
Introduction……………………………………………………………………. ...................... 4
The Need for Data Profiling………………………………….. .................................. 5
Structure Discovery……………………………………………… ................................... 7
Validation with Metadata ................................................................................. 7
Pattern Matching ................................................................................................ 8
Basic Statistics .................................................................................................... 8
Data Discovery……………………………………………………… .................................. 8
Standardization ................................................................................................... 8
Frequency Counts and Outliers ..................................................................... 9
Business Rule Validation ................................................................................. 9
Relationship Discovery…………………………………………. .................................. 9
Data Profiling – Typical Opportunity Areas…………. ................................. 10
Data Profiling Tools………………………………………………. ................................ 11
Data Profiling in Action – the Banking Sector…………. ........................... 12
Conclusion…………………………………………………………….. ................................ 15
Data Profiling
Pag
e3
Title: Data Profiling – A Quick Primer on the What and the Why of Data
Integration
© 2008, HCL Technologies Ltd.
August, 2008

Data Profiling
Pag
e4
Introduction
In today’s economic environment, businesses are facing increasing
pressure to reduce costs. In an effort to remain competitive, companies
are looking at all kinds of solutions Enterprise Resource Planning (ERP),
Customer Relationship Management (CRM), Supply Chain Management
(SCM), Stock Control, Logistics, and Business Intelligence (BI), to name
just a few. However, for any solution to deliver value, the data they
depend on needs to be accurate, complete, and consistent. In the Global
Data Management Survey conducted by Price Waterhouse Coopers, data is
considered the most important asset fundamental to an organization’s
success.1
Despite its importance, most companies do not have detailed information
about their data. As a result, the decision to proceed with a solution like
ERP, CRM, BI or SCM is fraught with the risk of implementation delays,
cost overruns or less than expected return on investment.
The Data Warehousing Institute (TDWI) reports
that 83 per cent of organizations suffer from
problems caused by poor data quality2
A Standish Group report indicates that 88 per
cent of data integration projects will fail, or
overrun their target budgets by 66 per cent3
Companies are also not completely sure of their data quality and in
another TDWI survey, half of the respondents said the quality of their data
is “excellent” or “good,” 44 per cent of respondents said that in reality, the
quality of their data is “worse than everyone thinks.”4 Rather than go by
the perception of the individuals managing the data, companies need to
resort to a data profiling exercise.
1 Price Waterhouse Coopers, P.18, Global Data Management Survey, 2001,http://sirnet.metamatrix.se/material/SIRNET_10/survey_01.pdf [June 2008] -> Date on which the site was accessed. 2 TDWI: BI/DW Education Survey Finds 83 Percent of Organizations Suffering from Poor
Master Data http://vendors.ittoolbox.com/profiles/tdwi-dw-professional-
education/news/survey-finds-83-percent-of-organizations-suffering-from-poor-master-data-
23 [June 2008] 3 Trillium Software, 2004 P.5, Data Integration and Data Quality Management
http://www.trilliumsoftware.com/site/content/resources/library/pdf_detail.asp?id=49&pdfRec
orded=1&type= 4 Ibid, Page 9
83 per cent of
organizations suffer
from problems
caused by poor data
quality. Just 12 per
cent of data
integration projects
are completed
within their target
budgets.

Data Profiling
Pag
e5
This paper examines the reasons for and the process of data profiling. It
also takes a look at data profiling opportunities.
The Need for Data Profiling
A company’s database contains information that touches most aspects of
its business activity market data, customer information, accounting
information, production details, sales records, billing details, collection
details, personnel records, salary records, and so on. This data is utilized
by the company for various business decisions, and it is therefore
imperative that the data in the database be consistent, accurate and
reliable. Figure 1 shows the factors affecting data quality and the effects
of poor data quality.
Figure 1: Causes and Effects of Poor Data Quality
Factors Affecting Data Quality
1. Inadequately articulated requirements
2. Improper data creation process
3. Invalid data structures
4. Duplicate data
5. Redundant data
6. Missing values
7. Incorrect data lengths
8. Data imported from the database of an
acquired company
9. Data imported from databases that belong
to business partners
10. Unusual values
11. Poor acceptance testing
Poor quality data
increases costs,
results in time
delays and loss of
business
Effects of Poor Data Quality
1. Increased transaction rework costs
2. Increased costs incurred in implementing new
systems
3. Time delays in delivering data to decision makers
4. Business and opportunity costs of lost customers
through poor service
5. Costs of lost production through supply chain
problems

Data Profiling
Pag
e6
Since the costs of poor data quality are high, increasingly companies are
“profiling data” to check its quality and suitability for business. Data
profiling uses “analytical techniques to discover the true content,
structure, and quality of data.”5 It is different from data analysis in that it
derives information about the data, and not business information from the
data. The purpose of data profiling is to
Locate instances of inaccurate data
Determine invalid values, structural violations, and data rule
violations
Find the data characteristics that are useful to a business analyst to
determine if the data matches the business intent.
Typically, data profiling is carried out before data integration is performed,
or before business critical software systems are launched. However, data
profiling should be carried out on critical data, at regular intervals, to
ensure the continuing accuracy of information.
Data Profiling
The data profiling process comprises structure discovery, data discovery
and relationship discovery, as shown in Figure 2, and is undertaken before
any data-driven initiatives are executed. Data profiling is performed using
a tool that
Automates the discovery process
Helps uncover the characteristics of the data
Helps uncover the relationships between data sources
5 See: http://etutorials.org/Misc/data+quality/Preface/ [June 2008]

Data Profiling
Pag
e7
Figure 2: Data Profiling Workflow
Structure Discovery
Structure problems are caused by data inconsistencies. Some problems
are also caused by legacy data sources that are still in use or have been
migrated to a new application.
Structure discovery is the process of examining complete columns or
tables of data, and determining whether the data in those columns or
tables is consistent with the expectations for that data. There are three
common structure discovery techniques.
Validation with metadata
Pattern matching
Use of basic statistics
Validation with Metadata
Metadata is defined by Wikipedia as "data about data"6 and describes the
data that is in a table or column. Metadata contains information that
indicates the data type and field length. It also indicates if a field can be
missing or null or if it should be unique. Most data has some associated
metadata or a description of the characteristics of the data.
6 See http://en.wikipedia.org/wiki/Metadata [June 2008]

Data Profiling
Pag
e8
Metadata validation analyzes the data and indicates, for example, whether
or not the field length is appropriate and if there are fields with missing
values. Validation also helps determine if the data collected is as per the
original plan, or if there are deviations.
Pattern Matching
Pattern matching determines if the data values in a field are consistent
across the data source and whether or not the information is in the
expected format.7 Pattern matching also checks for other format-specific
information about the data such as type and length.8
Basic Statistics
Basic statistics provide a snapshot of an entire data field by presenting
statistical information such as minimum and maximum values, mean,
median, mode, and standard deviation, to highlight aberrations from
normal values.9
Data Discovery
The second step in the data profiling process is data discovery. Data
discovery examines the problem areas that are indicated by structure
discovery by examining individual data elements. Data discovery
techniques use
Matching technology to uncover non-standard data
Frequency counts and outlier detection to find data elements that
don’t make sense
Standardization
Data in an organization comes from different sources consumers,
different departments and partners. Standardization helps discover
inconsistencies in the data and then provides a solution to address and fix
7 For example, a valid mobile telephone number, in India, could be entered in the database, in the format (+NN) nnnnnnnnnn, (0) nnnnnnnnnn, nnnnnnnnnn; where NN is the numeric code for the country, and n is a digit between 0 and 9. If a phone number is entered in a different format, the pattern report will indicate that the telephone number did not match a valid telephone number pattern. 8 Dorr, Brett and Herbert, Pat P. 4, Data Profiling: Designing the Blueprint for Improved Data Quality, http://www2.sas.com/proceedings/sugi30/102-30.pdf [June 2008] 9 For example, if customer orders range between 500 and 1000 units, an order of 10000 units would be considered abnormal and validated prior to its being entered into the system.

Data Profiling
Pag
e9
the inconsistency. For example HCL, HCLT, HCL Technologies, and HCL
Tech all represent the same organization.10 Any report that is generated
must account for the way the company is represented to avoid missing
important data points that can affect the output of future processes.
Frequency Counts and Outliers
Frequency count looks at how values are related according to data
occurrences. An outlier is “an observation that is numerically distant from
the rest of the data.”11 Outlier detection examines the data values that are
remarkably different from other values12. In essence, these techniques
eliminate the need to validate the entire data by highlighting the data
values that need further investigation.
Business Rule Validation
A business rule defines or constrains one aspect of your business that is
intended to influence the behavior of your business.13 Data profiling
software do not include business rules, since business rules are specific to
each organization. However, a robust data profiling process must be able
to build, store, and validate against an organization’s unique business
rules.
Relationship Discovery
Relationship discovery is the third part of the data profiling process and
provides information about the ways in which data records inter-relate.
These data records can be multiple records in the same data file, records
across data files or records across databases.14
Relationship discovery
Determines key relationships by using metadata, if available
Checks the relationships for the provision of a unique primary key
or a foreign key
Inspects the records that prevent a key from being unique
Identifies outstanding records that do not adhere to the relationship
10 Ibid 6 11 See http://en.wikipedia.org/wiki/Outlier [June 2008] 12 Outlier Detection http://www.dataflux.com/technology/methodology/data-profiling/outlier-detection.asp [June 2008] 13 Business Rules, http://www.agilemodeling.com/artifacts/businessRule.htm [June 2008] 14 Ibid 8

Data Profiling
Pag
e10
Data Profiling – Typical Opportunity Areas
Many companies still do not have a single view of the customer. Having a
single view enables a company to
Obtain a precise understanding of all the business that the
company is conducting with customers, across multiple units and
product lines
Identify cross-selling opportunities
Create targeted marketing campaigns
Some examples of data profiling are given below.
Example 1
In supply chain management, supply chains are dependent upon effective
procurement processes and accurate procurement information. A single
database that contains details about suppliers and the items that they sell
increases efficiency.
Data profiling is useful in integrating supplier details and information about
the items that they sell to help improve immediate efficiencies and in
facilitating the consolidation and integration of different processes and
systems.
Example 2
Data repetition in data sources is common. For example, in banking,
insurance or retail, an account holder’s name can be recorded
as FirstName MiddleName LastName; FirstName M Lastname; F M
LastName and so on.
Data profiling traces and removes such repetitions to improve data quality
and enhance business intelligence and thereby enable better customer
experience and profitability.
Example 3
Databases provide assorted customer related information, such as the
types of products sold; the product profitability and customer profitability.
Critical business decisions depend on the accuracy of information in these
databases.
Data Profiling
provides a single
view of the
customer. It helps
understand the
gamut of company-
customer
transactions,
identify cross-
selling
opportunities and
then aids in creating
targeted marketing
campaigns.

Data Profiling
Pag
e11
For example a credit card company or a telecom company can use data
profiling to create customer profiles. These customer profiles could help
the company customize products for specific individuals or groups.
Information in the customer profile about the individual’s payment
behavior enables the company to monitor its overall risk portfolio and
enhance an individual’s credit limit.
Data Profiling Tools
Data profiling is generally done by using specific software tools designed
for the purpose rather than using statistical tools. Table 1 compares
statistical tools with data profiling tools and illustrates the advantages of
using data profiling tools.
Statistical Tools Data Profiling Tools
Must formulate a large number of
queries and/or reports in order to test
rules against the data
Addresses all the stages of
data profiling
Execution is slow since rules are
executed serially
Processes a large amount of
data in a short period of time
Cannot discover rules and users do
not understand the actual structure or
content of the data without discovery
Includes discovery processes
Use of validation processes alone will
result in not discovering issues
Includes automatic discovery
and validation processes
Table 1: Statistical Tools vs. Data Profiling Tools
An effective data profiling tool addresses the following three phases15:
Initial profiling and data assessment
Integration of profiling into automated processes
Passing profiling results to data quality and data integration
processes
The data profiling solution16 should also aid in constructing data correction,
validation, and verification routines directly from the profiling reports.
15
P.9, Ibid 8 16
Some well known data profiling tools are Trillium Software from Harte-Hanks, DataFlux
from DataFlux Corporation, Data Insight XI from Business Objects, Information Analyzer from IBM and Data Explorer from Informatica. For more information you can visit http://mediaproducts.gartner.com/reprints/businessobjects/149359.html [August 2008]

Data Profiling
Pag
e12
Data Profiling in Action – the Banking Sector
One of the largest banks in Singapore, with an asset base of about US$93
Billion, needed to compute the amount of capital it required to guard
against financial and operational risks (Basel 2 norms).
Banks make their capital adequacy calculation on information such as
Elapsed days since the last scheduled payment on a loan by a
customer
Customer’s payment behavior, which is based on information in
his/her account
A bank’s capital adequacy assessment should tally with the financial data
submitted to regulatory bodies.
Our client realized that the accuracy of its projections was dependent on
the quality of its source data, and therefore decided to get its source data
profiled.
Solution architects from HCL carried out a two-stage data profiling process
to determine data quality.
I Analysis Stage
Determine if individual values are valid values for a column
Analyze column values to discover problems with uniqueness rules,
unexpected frequencies of specific values
Analyze structure rules that govern functional dependencies,
primary keys, foreign keys, synonyms and duplicate columns
II Validation Stage
Validate data rules to ensure that they hold true for
A row of data
All rows for a single business object
A collection of a business object
Different types of business objects
Case Study

Data Profiling
Pag
e13
As shown in Table 2 HCL architects ran a number of quality checks in the
data profiling process.
Quality Check Example
Domain Checking Gender fields should have a value
of either M or F
Range checking For age, the value should be less
than 125 and greater than 0
Referential integrity If an order shows that a customer
bought product X, then make sure
there actually is a product named X
Basic statistics, frequencies,
ranges and outliers
If a company has products that cost
between $100 and $1,000, flag any
that fall outside this range.
Uniqueness and missing value
validation
If a code is supposed to be unique,
make sure it is not being reused
Key identification If there is a defined primary
key/foreign key relationship across
tables, validate it by looking for
records that do not have their
corresponding related record
Data rule compliance If closed credit accounts must have
a zero balance, make sure there
are no records where the closed
account flag is true and the account
balance is greater than zero
Basic Statistics about the data Minimum Value
Maximum Value
Mean
Mode
Standard Deviation
Minimum field length
Maximum field length
Occurrences of Null values in
key-defined fields
Frequency distribution including
candidate columns for multi-
value compression
Invalid data formats
Table 2: Data Profiling Quality Checks
HCL developed a proof-of-concept to evaluate the advantages of using in-
house tools vis-à-vis third-party data profiling tools, before settling on
Teradata 17 Profiler.
17 Teradata is a registered trademark of Teradata Corporation
Data Profiling
Pag
e14
HCL’s approach to the data profiling process comprised of the following:
Create a data profiling plan for each source system
Formulate the business rules for
Checking data quality
Handling exceptional records
Implement the data profiling plan
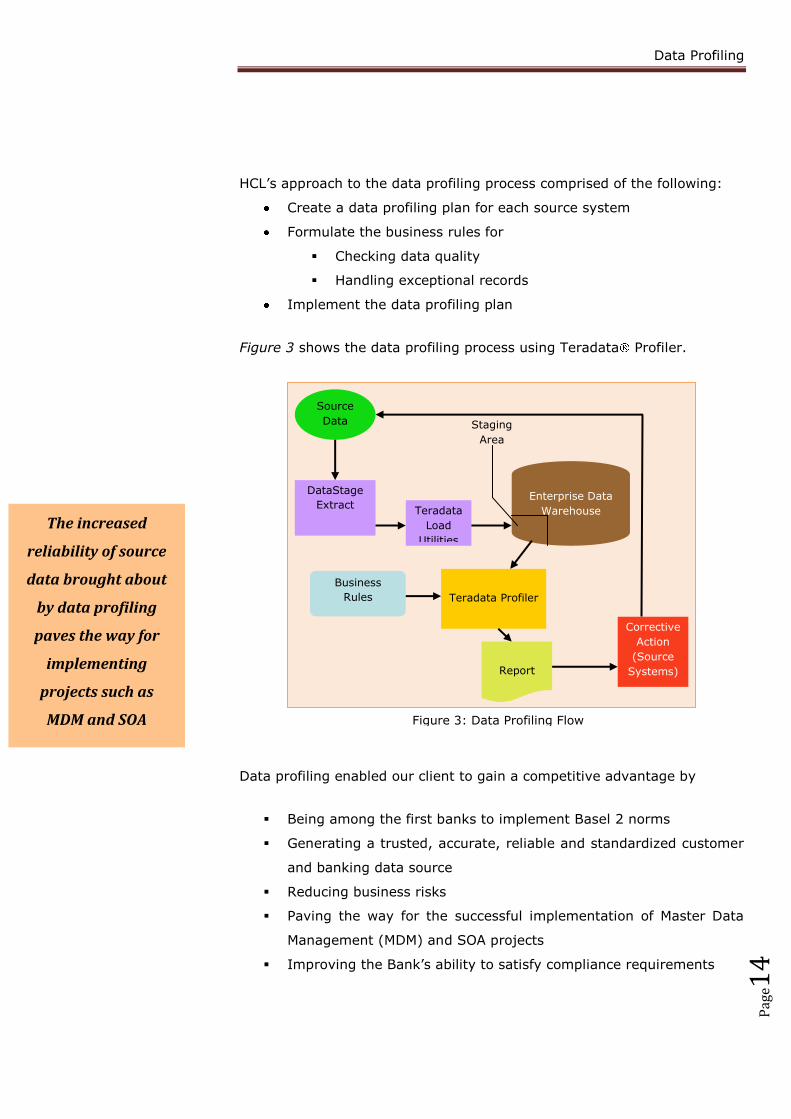
Figure 3 shows the data profiling process using Teradata Profiler.
Data profiling enabled our client to gain a competitive advantage by
Being among the first banks to implement Basel 2 norms
Generating a trusted, accurate, reliable and standardized customer
and banking data source
Reducing business risks
Paving the way for the successful implementation of Master Data
Management (MDM) and SOA projects
Improving the Bank’s ability to satisfy compliance requirements
Source
Data
DataStage
Extract Enterprise Data
Warehouse
Staging
Area
Teradata Profiler
Report
Corrective
Action
(Source
Systems)
Business
Rules
Teradata
Load
Utilities
Figure 3: Data Profiling Flow
The increased
reliability of source
data brought about
by data profiling
paves the way for
implementing
projects such as
MDM and SOA

Data Profiling
Pag
e15
Conclusion
Databases in most companies have evolved in an ad-hoc manner, which
has resulted in information silos. Companies, therefore, do not have a
unified view of their customers, resulting in missed business opportunities
or increased cost of operations. Data integration addresses those issues,
but poses data verification challenges, since the source data are in diverse
databases. Most data integration and migration projects overshoot their
time and cost estimates because of the effort expended to understand the
source data.
Data profiling automates the identification of problematic source data,
inconsistencies, redundancies, and inaccuracies. Data profiling also
provides a factual foundation, based on which data can be cleansed and
then consolidated before integration. Some of the benefits of integrated,
accurate and validated data that is the outcome of data profiling, are:
Enhanced accuracy of account receivables resulting in increased
debt collection
Better customer service
Cross-selling
Focused brand marketing campaigns
Reduced operational costs
Fraud detection
Compliance to regulations
Since these are tangible benefits to a company, irrespective of the sector
in which it operates, data profiling is relevant to companies and
consultants alike.
Data quality
management
initiatives pay for
themselves in
commercial terms.
… some respondents
report up to ten
times payback on
the investment
involved – P. 25,
Price Waterhouse
Cooper Global Data
Management
Survey, 2004