data quality challenges & solution approaches in yahoo!’s massive data
TRANSCRIPT

Data Quality Challenges and Solution Approaches in Yahoo!'s Massive Data Environment
Data Quality Manager: Dan DefendData Quality Architect: Aparna Vani
DataVersity WebinarSeptember 29, 2011
Abstract: By applying industry principles and techniques the Data Quality program has provided proactive and reactive system solutions to Audience data issues and root causes by addressing technical challenges of data quality at scale and engaging and leveraging the rest of the organization in the solution: from product teams all through the data stack (data sourcing, ETL, aggs and analytics) to analysts and sciences teams who consume the data. This methodology is now being scaled to the all data across Yahoo! including Search and Display Advertising. © 2011 Yahoo!. All rights reserved.

2
Unlocking the Power of Data

MEDIATech-
nology
3

The Anatomy of a Yahoo! Web Page
Content
TargetedContent
Buzz
Ads
Apps
Y!links
What Yahoo! Does With Its Data?
Analytics & Business Insights – data-driven decisions• How many people visited Home Page today and what did they click on?• What impact did the Japan tsunami have News and global engagement?
Targeting• What products are you interested in based on your recent web usage?• Advertisers pay a lot of $$ for good targeting.• Targeted content means better user engagement.
Experimentation• “Live user testing”• What layout do users like best? Are most profitable?
5
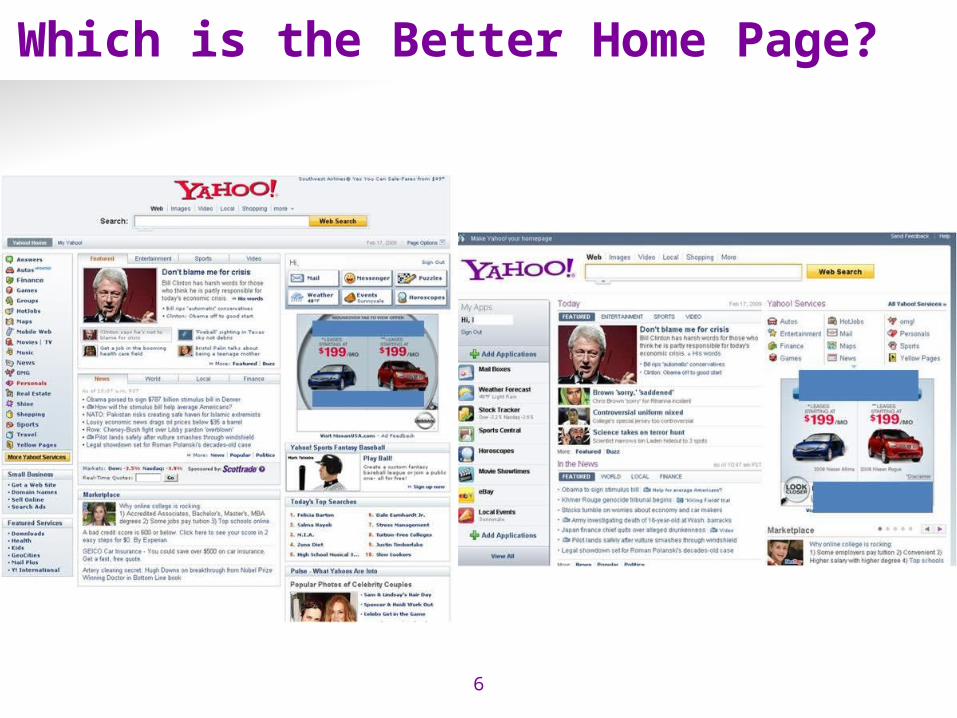
Which is the Better Home Page?
6

Which Ad Position Makes More Money?
7

Yahoo! Has a LOT of Data
Leading Internet Portal and Software Supplier [1]
• Serves 640 MM users or 84.5% of US internet users• Top ranked site in Mail, Messenger, Home Page, and more
Collects over 25 terabytes of behavioral data per day• 2 U.S. Library of Congress equivalents every day
[1] US Yahoo! Audience Measurement Report. comScore, Jan 2011
8

• Audience (web analytics)• Processes data from all Yahoo! properties web server logs
and delivers audience engagement metrics
• Display Advertising• Analytics and billing• Guaranteed and Non-guaranteed delivery ad campaigns• Exchange networks leverage other advertisers and publishers
• Search Advertising• Analytics and billing
9
Overview of Yahoo! Data Pipelines

Yahoo! Data Pipeline
Web Pages
Data Warehouse
Reporting systems
Data Extraction
Σ Ad Servers
BusinessInsights
Targeting
ExtractTransform
Load
` Σ
11
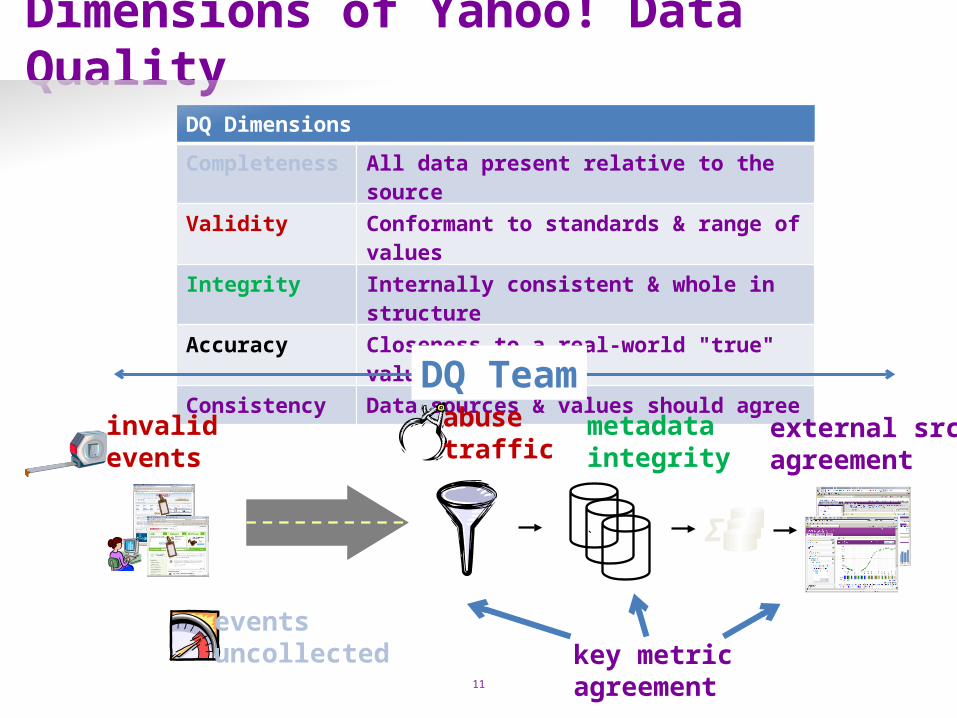
DQ Dimensions
Completeness All data present relative to the source
Validity Conformant to standards & range of values
Integrity Internally consistent & whole in structure
Accuracy Closeness to a real-world "true" value
Consistency Data sources & values should agree
eventsuncollected
invalidevents
abusetraffic
metadataintegrity
external srcagreement
key metricagreement
DQ Team
Dimensions of Yahoo! Data Quality

$$ Loss: Revenue, RefundsWasted resources
• Data investigation and reprocessing• Sciences frustration and attrition (“QA the data”)
Incorrect insights• Wrong decisions• Suboptimal targeting• Credibility loss – customers don’t trust the data
External impact• Loss of competitive ranking
REAL $$!!! … if managed reactively
+
=
12
DATA QUALITY = BUSINESS UPImpacts of poor quality of data to Yahoo!

Audience DQ Solution Path
13
Circa 2007: Significant Opportunities for Improvement in Audience Pipeline
14
• Quality of data largely unmeasured
• Property sourcing: • Is this a page view? No standard• Tagging & server errors• Data dropped in collection system
• Data discrepancies found by customer end of month or quarter
• Abuse and robots skew metrics due to minimal traffic protection
• Data sources that should agree, don’t
• Internal customers don’t trust the data

We Started to Measure It
` Σ
15
Source: ticket volumes and root cause analysis
Key Finding: >80% data issue from the source

Root Causes Differ Per Stage
16
Source: root cause analysis
` Σ
Insights into point fixes and system solutions

Category Solution
Process • Assessment, customer pain points• Issue resolution, root cause analysis
Technology • Detection: Monitoring & Transparency• Tagging and collection validation• Inline checks, data lineage, traffic protection
Standards • Event definitions, Bug severitiesData Semantics • Data Lineage doc
17
SolutionIdentification of issues followed by quick wins and system solutions
Developed DQ Methodology for large data systems

Improvements & Results
18
Issue Area Before After
Property sourcing • Metric inflation• Is this a Page View?
• Inflation fixed• Standards in place• Proactive validation• Proactive monitoring
Data collection • Dropped data • Dropped data fixed• Proactive monitoring
ETL • Suboptimal Robot Filtering • Machine learning filtering in place
Mart & Analytics • Customers not well supported• Multiple differing SoT
• >50 DQ Champions in place
• Trusting the data

19
Central DQ Team Structure
Central ManagerCentral Architect
Display Tech Lead Search Tech Lead Audience Tech LeadDisplay Architect Search Architect Audience Architect
Monitoring, Alerting, Transparency Infrastructure & Tools
DQ Proactive StandardsBuilding Data Quality into Products
20

Property DQ StandardsSourcing and Consuming Clean Data
` Σ
21
Instrumentation validation: PV, URL, CSC
Server setup cookbook and validation
Metric/monitor priorities, pain points
Classification, triage, drive fixes
Proactive Reactive
Data Issues DQ Champs
Customer-Driven

DQ Standards Overview (Proactive)
22
Section Description OwnerData Validation Coverage of customer-oriented end-to-end data use cases
in test plans. Product QE
In-Line DQ Checks
In-production, low-latency verifications to identify serious data quality issues before publishing data.
Product Dev
DQ Stats Statistics used for DQ Monitoring and DQ Transparency. Product Dev, Central DQ
Data Transparency
End-to-end transactional insight of data processed across all stages of e2e data.
Central DQ
Data Lineage Documentation of business logic and processing rules (any merge, removal, addition, or other modification) for each stage of data end to end.
Product Dev
Off-Line DQ Monitors
Higher-latency (compute intensive) verifications done in a separate system after the data is published with strong customer engagement on metric priorities and alert consumption. Based on data volume impact with easy drill-down capability.
Central DQ

Support for DQ in the QE Cycle Data Validation
23
` Σ
`
TestEnvironmentE2E data validation
tests covering major customer use casesin pre-release QE cycle
Note: Specific tools are not currently part of DQ standard but partnership in this area may make sense

Checklist• Coverage from a data perspective taking into account major data input scenarios and major
use cases direct customers of data produced• Compare results from legacy system or previous version of system (with production data)• Suggest organizing per DQ dimensions: completeness, accuracy, validity, consistency,
integrity
Examples• Validity: Check for valid data values per the schema – certain column not null, within
acceptable range or of correct data type• Completeness: Include coverage to validate that the volume sent is the amount of load
received, processed and output.• Accuracy - Test that the data input equals the data output. If data is requested for a specific
day in one time zone but fetched in another the data will not be accurate.
24
Data Validation Coverage in QEChecklist and Examples

Support for DQ in the QE CycleQE Coverage of DQ Features
25
` Σ
Functional test coverage for built-in DQ features, e.g., in-line DQ checks

• New Ad Delivery Engine. Some impression events were partially corrupted leading to failed joins. This led to missing data.
• Problem not discovered for over 2 days. Rollback occurred on the 3rd day.
• A simple/cheap in-line DQ check for % of non-billable clicks would have found the problem before any bad data was published.
26
Data Sourcing Case Study

Answer: In-Line DQ ChecksImmediate Detection of Issues Before Publish
27
` Σ
• Performed in-line with processing before publishing the data.• Designed to catch serious DQ issues needing immediate action.• Cover processing performed in stage as well as sanity checks of upstream data
(e.g. total volume).• Cannot significantly impact SLA of the process. This means that checks generally
be at a course granularity, e.g., at network level.• Owned/implemented by Dev with review input from DQ, QE, PM, Customer
week-over-week statistical, source comparison, def met,…
SE&O

Reported UnreportedInvalid?
Robot TaggingError
ETL Error BackendCall
Non-PV
X Bln/day Y Bln/day
• Valid / invalid traffic improperly classified/reported• Processing and storing billions events/day without knowing why• Profile the data to find out which properties/pages/servers are the biggest
offenders
28
Audience Case Study Let’s Start Looking at ALL Our Data

Answer: Data TransparencyWhere is all the data going?
` Σ
29
• End to end, transactional insight of data processed across all stages of e2e data based on DQ stats
• Facilitates data investigations -- immediate insight into the data processing stage/category with incorrect data
• Provides customers confidence by showing what happened to the data between the beginning of the processing and the final analytics data metrics
• Provides full, end-to-end audit-ability -- event is accounted for in some stage and filtered bucket
• Transparency reporting can be done in the analytic application or in DQ Central

Audience Case StudyWhat’s Going On With This Network Uptrend?
30

Off-Line DQ Monitoring in Audience Case StudyWhat’s Going On With This Network Uptrend?
31
• Alert triggered first week of uptrend indicating instrumentation problem

` Σ
Answer: Off-Line DQ Monitor and AlertingEarly Detection of Issues at a Fine Grain
32
• In-depth checks finer granularity than possible inline based on DQ stats• Customer-driven (“DQ Champion”) metric / dimension priorities and signoff• Sophisticated techniques (time series modeling) to find deeper anomalies• SLA next-day • Sometimes need investigation to avoid false positive alert• Owned by DQ team with review input from PM, Dev, QE, & Customer
week-over-week statistical, source comparison, intra-pipeline…
DQ Central

DQ Central – End to End Audience Data
Features: • Data statistics/trending of audience PVs for property at each
stages of audience pipeline• End to end data transparency per page and server• Critical traffic fluctuation notification for properties and
custom monitoring for any data customers• Data issue investigation and diagnostics• Open/overdue data quality bug tracking
33

DQ Central – DQ Champion Engagement
σ σ
ALERT
1. Data Source Metrics are monitored and an anomaly is found
2. Each alert is registered in the DQ database
3. Email detailing alert/s is sent to DQ Champion
4. DQ Champion manages alert sign-off in DQ Central UI
Reason…. BugID
5. Sign off information is captured for alert in DQ database
6. Explanation overlaid on data
Reason…. BugID
34

DQ ALERT!
DQ ChampionAnalysis Insight
Impact:• suboptimal BT• PV counting error• UU inaccuracy
Fixed same day!!
DQ Central – Case Study
35

• Sciences encounters “missing events”
• Extensive end-to-end analysis of feeds with missing data, upstream feeds and data sources slicing and dicing by interesting dimensions to understand source & cause of issue
• Conclusion: Expected behavior; field of interest was populated according to sampling rates as designed, but known only by Serving teams – not by Sciences customers
• Impact: Dozens of hours of wasted investigation
36
Display Sciences Case Study Seeing a High Percentage of Null Events
Answer: Data LineageCentralized Documentation Consumable by Customers
37
Covers all business logic and filtering rules (any merge, removal, addition, or other modification) as data flows end to end. Lineage answers the question: "How did my data get from A to B to C to D and all the way through Z?” Each stage must provide detail on all major filtering and columns in a form consumable by customers.
• Resides within the metadata system
• Available to all customers and kept up-to-date
• Reduces or removes confusion regarding differences in two seemingly-similar data sets
• There is a close relationship between Data Lineage and Data Transparency: the former describes the processing rules behind the later transactional data.

• Metrics/dimension priorities from customers• End-to-end profiling & DQ assessment
• Start building end-to-end monitoring & transparency
• Core In-line Checks
• Core Data Lineage
• Discover systemic solutions through root-cause analysis• Develop standards around common causes
• Adoption as part of process for all new work
• Dashboard to surface most important DQ success drivers38
DQ Improvement Playbook

Appendix- Reactive Standards- Product Team Roles & Responsibilities- DQ Program Adoption
39

Reactive StandardsDealing with DQ Issues After the Fact
40

DQ Defect Process and Standards
41
• Product DQ keywords and distribution lists
• Triage information template
• Severity definitions according to metric (including revenue) impact
• Root-cause analysis
• Weekly bug scrub
• Goals to resolve DQ bugs faster with central team oversight• Reduce defects bouncing between teams and get assigned to
proper owner• Leverage DQ tools – e2e data transparency• Follow-up on delinquents

Product Team Roles and Responsibilities
42

Roles and ResponsibilitiesArch, PM, Dev, QE, SE Checklists
43
Role Areas CoveredArchitect Data and metadata use from upstream, DQ in
frameworks Product Manager DQ checks, monitors requirements including
thresholds and metrics/dimension priorities Developer Engineering DQ checks, DQ stats and data lineage Quality Engineering Data validation and coverage of DQ checks Service Engineering Server deployment – DQ checklistData Customers Correct data usage per data model/lineage

• Instrumentation methods for data capture for validation
• Inconsistent methods (client vs. server side) and business logic
•Apples-apples data reconciliation• Inconsistent metrics definitions and dimensions
• Influencing partner to use best DQ practices• Different philosophies, organizational approach, etc.
•Validate before use•Joint data issue investigation/escalation
44
Data Quality of Shared Pipeline OwnershipApproach and Inherent Challenges

DQ Program AdoptionAs DQ expands across the company organizational engagement, buy-in and adoption is key
45

• Set clear expectations – methodology, milestones• Paint clear picture of DQ standards and solution
path at the top level to executives• There are many perspectives on DQ based on
product role: • [Product] X [Arch,PM,Dev,QE,SE]• Need focused communication and training
46
Communication Lessons Learned

• Need solid technical value proposition, but it won’t work without strong executive support and relationships with key stakeholders
• Top down and bottoms up• Org-wide shared DQ progress goals and dashboard– has to be
measurable and clear to all
• Solid engagement with the right stakeholders• Respected decision makers• Lot of meetings initially to get on the same page & build
relationship
47
Driving Change in the OrganizationShared Goals and Stakeholders

• DQ consulting model vs. DQ central team does all the work• Product teams have to own DQ – needs some form of consulting model• But DQ has to get hands dirty, demonstrate technical success and drive
progress on the roadmaps – pure consulting & education doesn’t work• DQ standards and checklists have to be specific and as prescriptive as
possible
• Be prepared for pushback when asking for extra dev or QE work• Clarify DQ vs. Product Roles and Responsibilities• Clearly specify anticipated LOE
• Scalability: Portal, Training, Standards, Self-Service Tools• Challenge: How do you have impact without deep technical domain
knowledge?
• Challenge of working with teams with similar charters: Product Support, QE, Tools
48
Driving Change in the OrganizationHow to Get the Engineers to Own DQ

• Product teams who give you resources – importance of communication, setting expectations and measurable progress
• Properly engaging unhappy data customers
• Challenge of dealing with sr. tech/arch who want the perfect technical solution vs. the need to make progress with interim/viable ugly/manual solutions
• No silver bullets
• Just because DQ improvement approach worked in one part of the org…
• Sciences Customer & Partners (Machine Learning)
49
Dealing With Customers and StakeholdersBeware of Hotbuttons and “Help”