data recovery from optical media
TRANSCRIPT

Data Recovery from Optical Media
Tom D. MilsterUniversity of Arizona Optical Sciences Center
1630 East University Blvd., Tucson AZ 85721-0094Phone: +1-520-621-8280 FAX: +1-520-621-4358
E-mail: [email protected]
Presented at the THIC Meeting at the National Center for Atmospheric Research, 1850 Table Mesa Drive, Boulder
CO 80305-5602 July 18, 2006

2
Outline
I. Background
II. Review of Previous Work (THIC 2004)
Microscopic recovery (Kasanavesi)
Dynamic Spin Stand (Milster’s Group)
III. Data Recovery from Various damaged optical media (Li)
Special Defect Detection Circuitry
Knurled Disc
Microwave Disc
Sanded Disc
IV. Wavelet Signal Processing (Kannan)
Introduction to wavelets
Wavelet processing and results
De-noising results
V. Conclusions

3
Background
• Data on a CD are written on a spiral track of alternating “pits” and “lands”
• The pits and lands constitute an RLL data stream with following constraints– Minimum run-length constraint, d = 2 (3T)– Maximum run-length constraint, k = 10 (11T)
1 0 0 1 0 0 0 1 0 0 0 0 0 0 0 0 0 0 1 …
3T pit 4T land11T pit
…
4
EFM
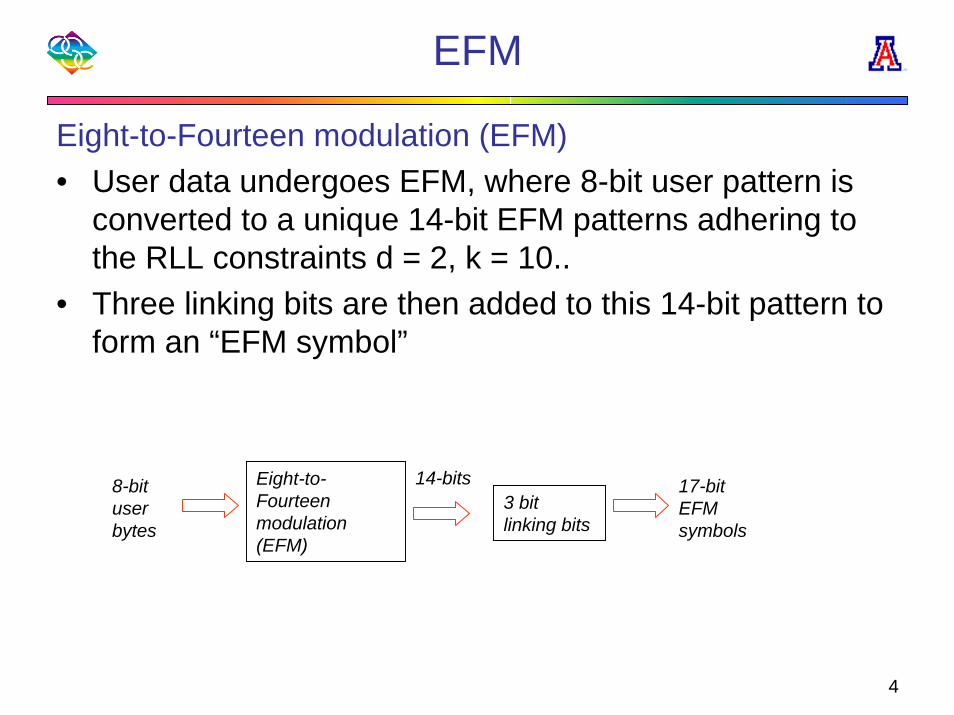
Eight-to-Fourteen modulation (EFM)• User data undergoes EFM, where 8-bit user pattern is
converted to a unique 14-bit EFM patterns adhering to the RLL constraints d = 2, k = 10..
• Three linking bits are then added to this 14-bit pattern to form an “EFM symbol”
Eight-to-Fourteen modulation (EFM)
8-bit user bytes
14-bits 17-bit EFM symbols
3 bit linking bits

5
EFM Frame
Division of data on the CD• A basic unit of information stored on a CD is called an
“EFM channel frame”. It consists ofSynch bits – 27 (11T pit followed by a 11T land)Control and display bits – 17 (1 symbol)User data – 408 (24 symbol)Error correction coding bits – 136 (8 symbols)
27-bit synch pattern 33 EFM symbols
EFM channel frame:
187µm along track
One EFM channel frame – 588 bits (33 symbols + 27 bits)
6
CIRC Encoding
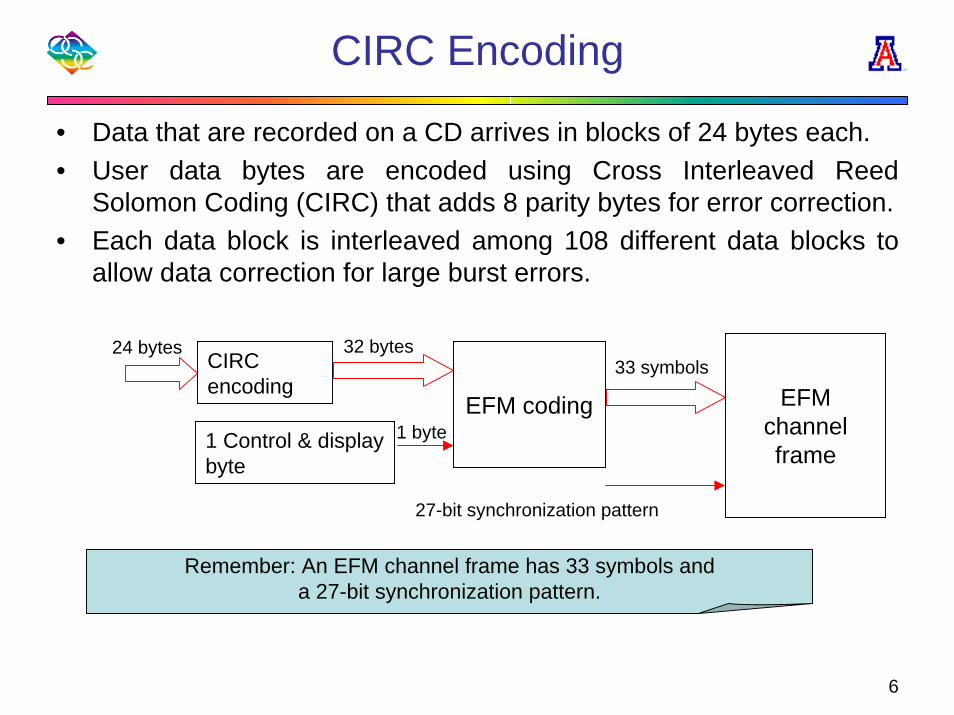
• Data that are recorded on a CD arrives in blocks of 24 bytes each.• User data bytes are encoded using Cross Interleaved Reed
Solomon Coding (CIRC) that adds 8 parity bytes for error correction.• Each data block is interleaved among 108 different data blocks to
allow data correction for large burst errors.
Remember: An EFM channel frame has 33 symbols anda 27-bit synchronization pattern.
CIRC encoding
1 Control & display byte
EFM coding
24 bytes 32 bytes
1 byte
27-bit synchronization pattern
33 symbols
EFM channel frame

7
ATIP Information
Absolute Time In Pre-groove (ATIP)
• ATIP is an imbedded time code that indicates the time elapsed by the laser drive since the beginning of the first EFM channel frame.
• While reading data, the compact disc rotates at a constant linear velocity of 1.2 m/s.
• Exact physical location of the recovered real data bytes can be obtained from the Absolute Time code.
The total length of the helical track is about 5,800m.

8
Review Of Previous Work
Three-step modular approach• Module 1 – Derived signal recovery
Microscopic recovery (Kasanavesi)Dynamic Spin Stand (Milster’s Group)
• Module 2 – Real data recovery from derived signals.• Module 3 – Data descrambling and ATIP recovery from
real data bytes.– Data descrambling is done to recover the user bytes
from the interleaved data bytes. – ATIP information is obtained by decoding control
bytes from 98 consecutive frames.

9
Module 1 - Microscopic Recovery
Image Processing• The "raw" gray scale image frames are converted into binary image
frames using gray-level thresholding and median filtering.• The binary images are integrated in the horizontal direction to
recover information about the track centers.
Gray scale image
Binary image
Integration direction Track
centers
The peaks identify the position of the track centers in the image frame

10
Module 1 - Derived Signal Recovery
Derived electronic signal from a single image frame
Integrationdirection
Thresholding
Derived electronic signal

11
Module 1 - Derived Signal Recovery
Automated stitching of contiguous image frames
Overlap areaElectronic signal frame 1:
Electronic signal frame 2:
Overlap area
Stitch point
Stitched derived electronic signal
Stitching is performed using signals, not images

12
Module 2 - Real Data Recovery
EFM signal recovery• The pit/land lengths of the derived electronic signals are grouped into 9 categories
corresponding to the 9 run lengths of the actual EFM pattern (3T through 11T). • Once all the lengths of the pits and lands are divided into 9 groups, Gaussian fit is
done on the bins to clearly demarcate the bins (Milster).• Each length of the pit/land of the electronic signal is compared with these groups and
appropriate EFM pattern is assigned.
Group Lengths EFM pattern
3T 16-20 1001
10001
100001
1000001
10000001
100000001
1000000001
10000000001
100000000001
4T 21-28
5T 28-34
6T 35-40
7T 40=48
8T 50-54
9T 55-60
10T 60-68
11T 70-74

13
Module 1 - Dynamic Spin Stand Data Recovery
Motivation• Microscope data recovery is mainly acquisition limited.• It takes hundreds of hours to acquire and process image frames using
microscope.• A dynamic spin stand (G3000-II) is developed by the Milster Research
Group to recover data from relatively large fragments of a CD.• The signal is then processed using a simple median filter and
thresholded to recover the derived electronic signal.
Acquired signal from G3000-II
After Thresholding and Median Filtering
Recovered derived electronic signal
14
G3000 System Layout
Feedback Control
FES and TESCustom Servo
Electronics
Ser
vo D
ispl
ay C
ompu
ter
Acqu
isiti
on a
nd C
ontro
l C
ompu
ter
Displays
LAN
Spindle and Linear Slide Controllers
Power Supplies
L
SH
S
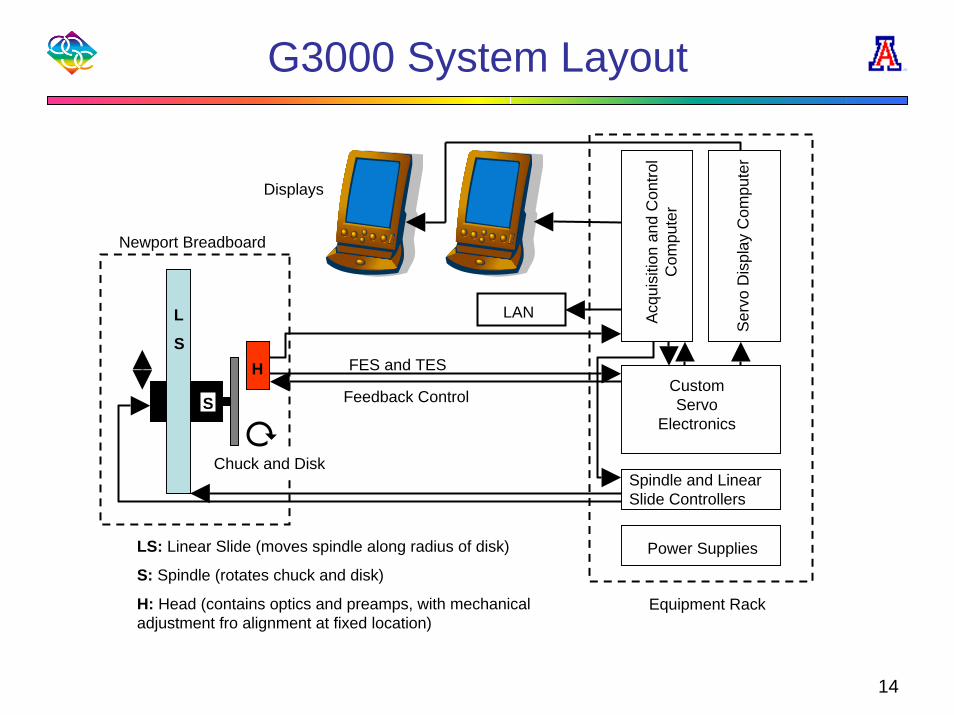
LS: Linear Slide (moves spindle along radius of disk)
S: Spindle (rotates chuck and disk)
H: Head (contains optics and preamps, with mechanical adjustment fro alignment at fixed location)
Chuck and Disk
Equipment Rack
Newport Breadboard
15
Data Recovery From Various Damaged Optical Media
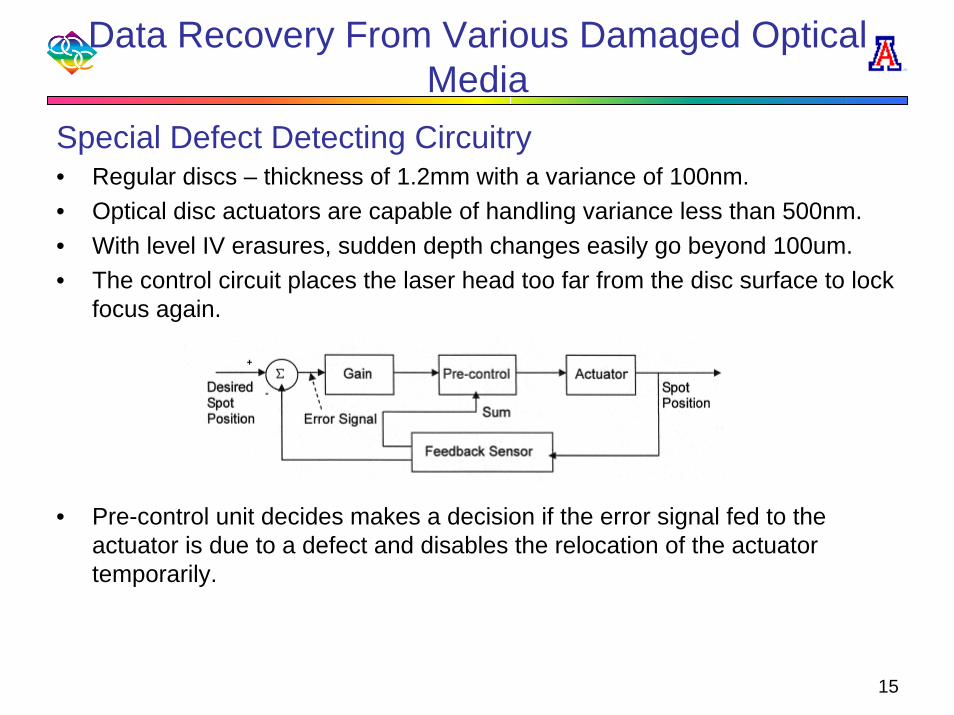
Special Defect Detecting Circuitry• Regular discs – thickness of 1.2mm with a variance of 100nm.• Optical disc actuators are capable of handling variance less than 500nm.• With level IV erasures, sudden depth changes easily go beyond 100um.• The control circuit places the laser head too far from the disc surface to lock
focus again.
• Pre-control unit decides makes a decision if the error signal fed to the actuator is due to a defect and disables the relocation of the actuator temporarily.
16
Knurled Disc
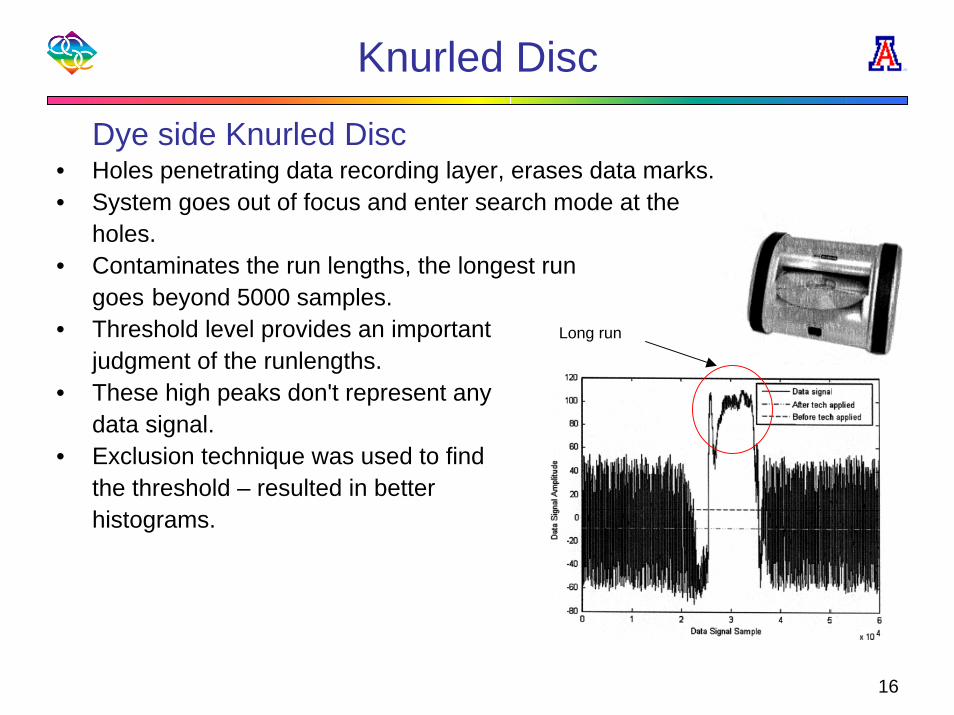
Dye side Knurled Disc• Holes penetrating data recording layer, erases data marks.• System goes out of focus and enter search mode at the
holes.• Contaminates the run lengths, the longest run
goes beyond 5000 samples.• Threshold level provides an important
judgment of the runlengths.• These high peaks don't represent any
data signal.• Exclusion technique was used to find
the threshold – resulted in better histograms.
Long run

17
Knurled Disc
Substrate-side Knurled Disc• No change on the data marks but deceives the system by creating light
distraction through the holes on the data marks.• Dynamic threshold adjustment
algorithm is developed. • The threshold follows the rise and
fall of the envelope.• Improvements were seen in the
histogram and hence the probability of data recovery.
• Another promising mechanical recovery technique explored is improving the substrate topology by filling knurled holes with epoxy.

18
Statistics From Dye-Side Knurled Disc• Knurled frames occur 24.59 times out of 363.79 average total frames.• Total number of errant frames is 44.01.• Knurling effect is 10.1.• Overall bad frame percentage is 13.064%
STATISTICS FOR DYE-SIDE KNURLING EFFECTS BASED ON RADIUS
19
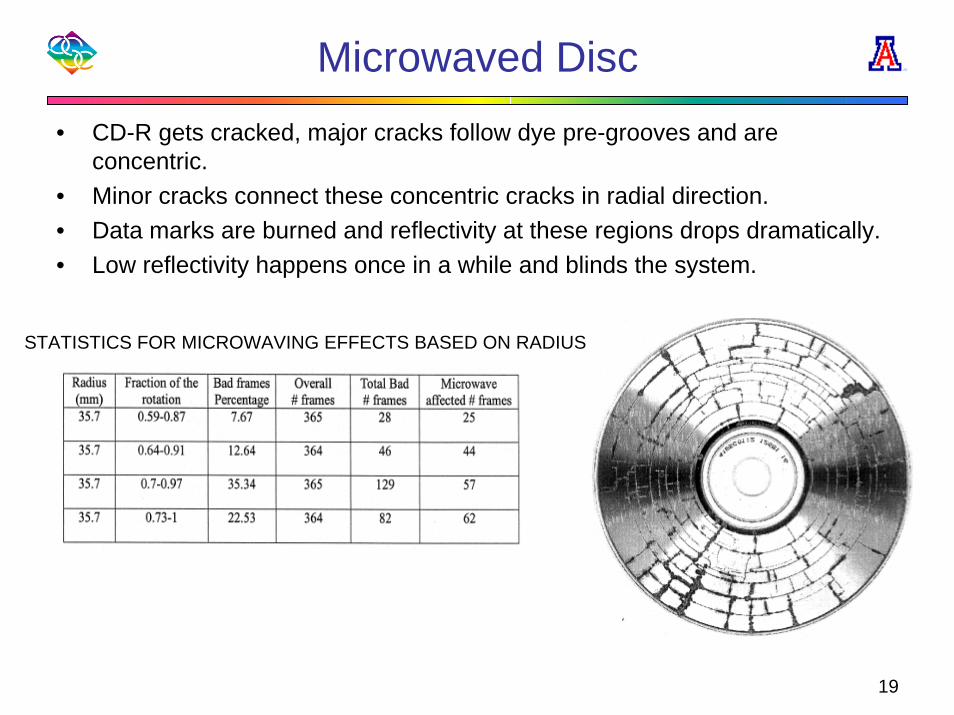
Microwaved Disc• CD-R gets cracked, major cracks follow dye pre-grooves and are
concentric.• Minor cracks connect these concentric cracks in radial direction.• Data marks are burned and reflectivity at these regions drops dramatically.• Low reflectivity happens once in a while and blinds the system.
STATISTICS FOR MICROWAVING EFFECTS BASED ON RADIUS

20
Sanded Disc• Discs sanded on the substrate cause large scattering losses and much
distortion in the laser beam• Since data marks are erased, reading or even observing the marks under
microscope is impossible• Mechanical technique of covering the substrate with epoxy gave some
encouraging results• The erroneous rate of 6 bad frames out of total 124 frames i.e, 4.8% error
rate• This statistic is close to undisturbed disc.

21
Introduction To Wavelets
• Wavelets are used to preprocess and filter the noise components before conversion of the derived analog signal into digital signal.
• “The wavelet transform is a tool that cuts up data, functions oroperators into different frequency components and then studies each component with a resolution matched to its scale (frequency)”
• Wavelet transforms provide a way to analyze signals in the frequency-time plot and with a resolution matched to the frequency– Higher frequency components => Lower frequency resolution
Good time resolution– Lower frequency components => Higher frequency resolution
Bad time resolution• Discrete wavelet transform provides a means of computationally
efficient frequency-time analysis.

22
Introduction To Wavelets• The signal is passed through a bank of
low-pass and high-pass filters.• At each stage, frequency band reduces
by 2.• Nyquist rule – every other sample is
redundant and hence the signal is sub-sampled by 2 after each filtering stage.
• The Low pass and high pass filters are quadrature mirror filters – ensures easy reconstruction since half band filters form orthonormal bases
• Quadrature mirror filter relationg[L-1-n] = (-1)n.h[n]
g[n] - impulse response of high passh[n] - impulse response of low pass

23
Introduction To Wavelets• Figure shows the decomposition
of the given signal s into lowest-highest band of frequencies as a function of time.
• Optimal level of decomposition is chosen to observe the signal.
• Constituents causing error are identified and the reconstruction is performed by altering the same.
• Reconstruction is done by traversing the tree in the reverse direction – up sampling followed by filtering.
24
Wavelet Processing
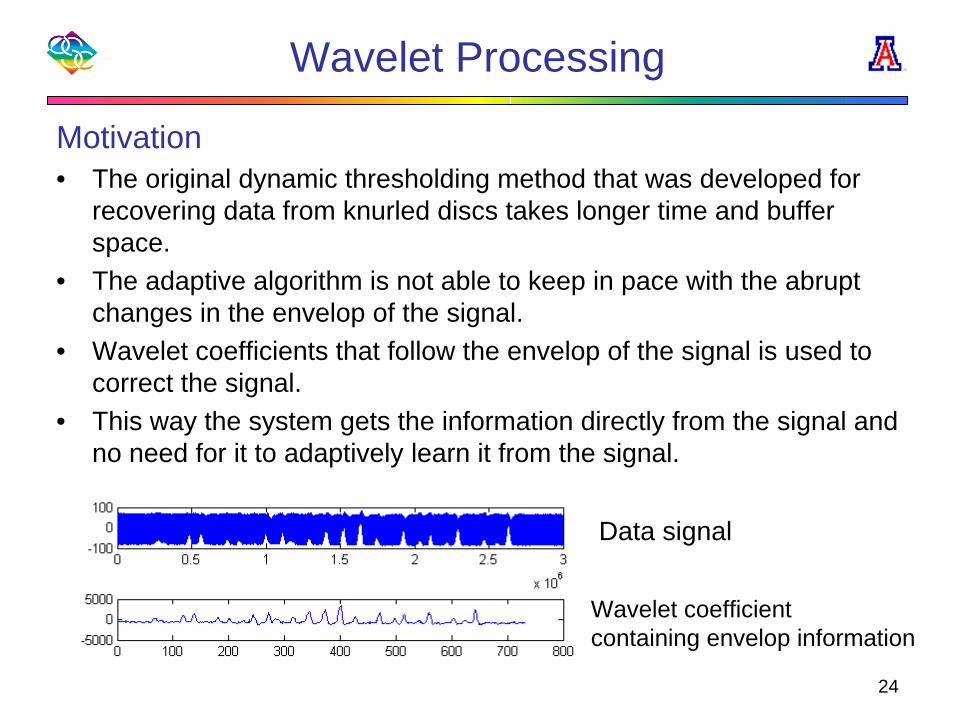
Motivation• The original dynamic thresholding method that was developed for
recovering data from knurled discs takes longer time and buffer space.
• The adaptive algorithm is not able to keep in pace with the abrupt changes in the envelop of the signal.
• Wavelet coefficients that follow the envelop of the signal is used to correct the signal.
• This way the system gets the information directly from the signal and no need for it to adaptively learn it from the signal.
Data signal
Wavelet coefficient containing envelop information
25
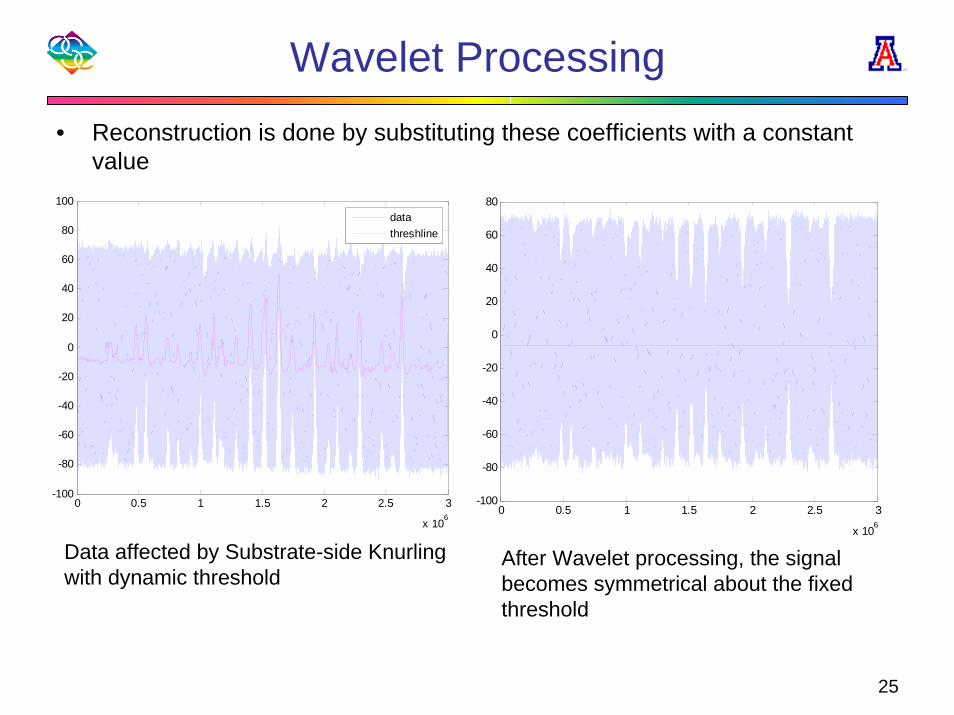
Wavelet Processing • Reconstruction is done by substituting these coefficients with a constant
value
Data affected by Substrate-side Knurlingwith dynamic threshold
0 0.5 1 1.5 2 2.5 3
x 106
-100
-80
-60
-40
-20
0
20
40
60
80
100
datathreshline
0 0.5 1 1.5 2 2.5 3
x 106
-100
-80
-60
-40
-20
0
20
40
60
80
After Wavelet processing, the signal becomes symmetrical about the fixed threshold

26
Wavelet Processing Results• It was observed that the number of errant frames reduced by a factor of 2 after
processing with wavelets• Number of runs that are longer than usual, greatly reduced • Wavelet de-noising completely removes the shorter than usual runs.
Radius Bad frame %
Standard deviation
Overall number of frames
Total number of bad frames
Knurl affected frames
35.37~35.55 18.596 2.6875 369 68.67 1.33
44.5~44.7 19.66 1.3625 493.33 65.33 4.67
51~51.2 77.476 2.643 847.67 657 324.33
STATISTICSOF A SUBSTRATE KNURLED DISC BEFORE WAVELET PROCESSING
Radius Bad frame %
Standard deviation
Overall number of frames
Total bad frames
Knurl affected frames
35.37~35.55 7.866 1.8943 368.33 29 0
44.5~44.7 7.986 0.248 492.33 31.33 051~51.2 47.28 1.7635 732 346 125.33
STATISTICSOF A SUBSTRATE KNURLED DISC AFTER WAVELET PROCESSING

27
De-noising Results• A disc provided to us from one of our sponsors contained bitmap images of
less than 3MB. The CD was broken into three parts with scratches caused due to the break. Results compared here are from the half disc and before ECC.
0 0.5 1 1.5 2 2.5 3 3.5 4
x 106
-60
-40
-20
0
20
40
60
AfterWaveletDenoising
Recovered Bitmap file
Data with scratches

28
De-Noising Results
Bitmap file recovered without wavelet preprocessing
Bitmap file recovered withwavelet preprocessing

29
Conclusions• Microscope data recovery is possible on small segments (< 25 mm), but the
process is slow and acquisition limited.• Spin-stand data acquisition is fast (50,000X faster than current microscope
recovery).• Methods of media damage have been studied.• Special defect detecting circuit made it possible to read data from knurled
discs with sudden depth changes of greater than 100um.• Long run exclusion technique and dynamic threshold algorithms have given
better results.• Mechanical technique of using epoxy coating gave better results with
substrate- side knurled and sanded discs.• Use of Wavelet analysis in dynamic range adjustment and de-noising have
been effectively implemented.• Performance of the system has been greatly improved

30
AcknowledgementsThe presented work contains the Master’s thesis work made by three Graduate students of Electrical and Computer Engineering Department at University of Arizona
– Sashi Kasanavesi, “Data Retireval From Broken CDs Using Microscope Images”, 2004
– Kristi Li, “Data Recovery From Various Damaged Optical Media”,2005
– Swetha Kannan, “Data Retrieval From Damaged Optical Media Using Wavelet Analysis”, 2006