data report: mclean county community permanency enhancement action team jeannie higdon jacki...
TRANSCRIPT

DATA REPORT:MCLEAN COUNTY COMMUNITY PERMANENCY ENHANCEMENT ACTION TEAM
Jeannie HigdonJacki Schuster
McLean County Action Team The McLean County Action team consists
of: The Juvenile Court Judge DCFS Supervisor, Jaime Ralph Karen Blum, The Baby Fold McLean County Health Department POS Agencies within the community (Catholic Charities, The Baby
Fold, Children’s Home + Aid) Family Community Resource Center Assistant State’s Attorney’s Public Defenders Illinois State University Any interested community members willing to work towards and
support the goals of the program.

Project Goal:As a result of the presented data, the MCAT looked for ways to engage birth parents earlier, thereby decreasing the length of stay a child is in substitute care and increasing the chances for a successful reunification.
Our specific project
Through the Court Improvement Program, our team is in the process of completing a grant request for funds to support a parent mentor.
As students of the program, we sought ways to support the goal of the action team.

The goal of the mentoring is for a birth parent who has successfully navigated their way through the court and child welfare system to share their experiences and guide the parents through their current case. They will be available to answer questions and offer support when parents most need it. The action team believes that by engaging parents immediately upon case opening that it will increase the family’s chances for a successful reunification in a shorter length of time.

COLLECTED DATA
What did we find?
The following slides are based on data collected from the Child and Family Research CenterThe data can be accessed at: http://cfrcwww.social.uiuc.edu

Although African American children consistently make up 9%- 11% of the total population under age of 18, they represent 36%- 48% of the total number of indicated reports from the year 2001 to 2007.
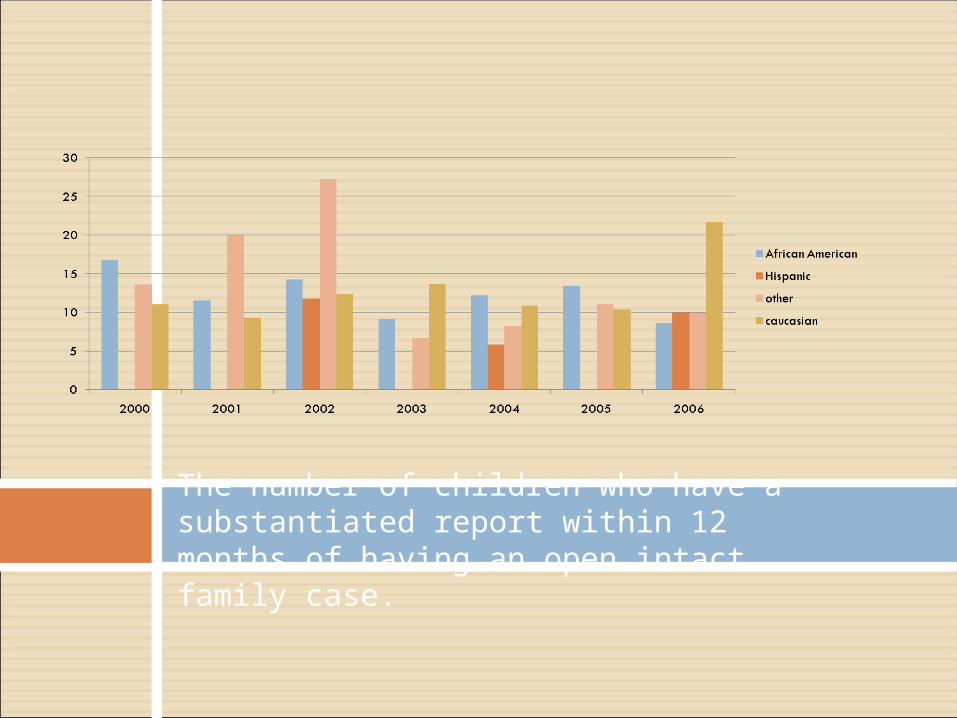
The number of children who have a substantiated report within 12 months of having an open intact family case.

With regards to children entering care following 12 months of intact family, there appears to be no consistent pattern. The numbers vary greatly year to year with the numbers scattered.
% of Intact families who had children enter care within 12 months
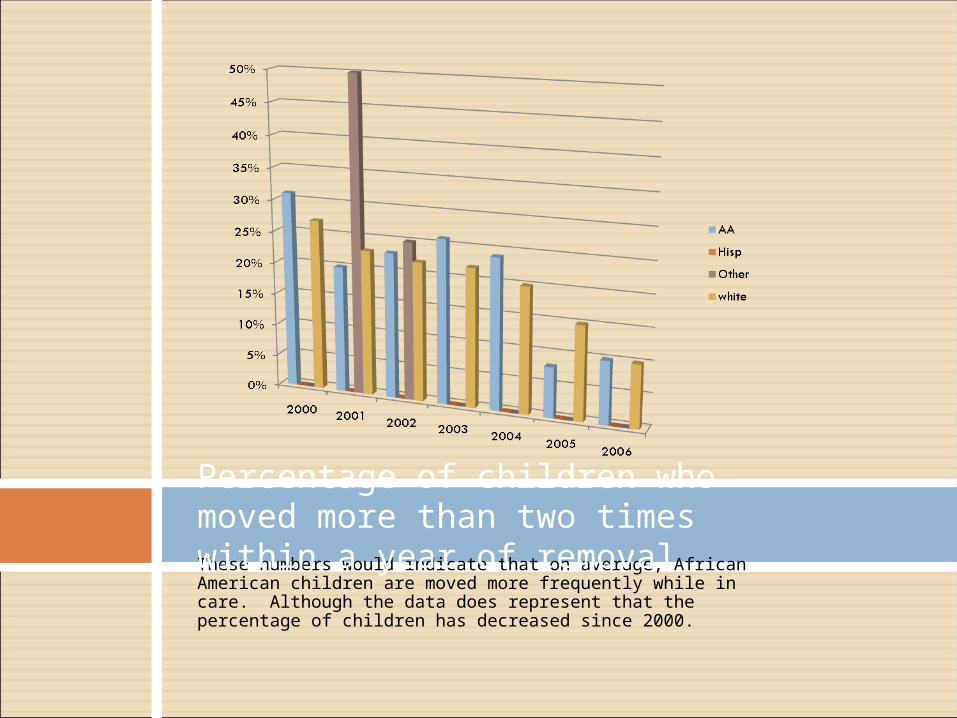
These numbers would indicate that on average, African American children are moved more frequently while in care. Although the data does represent that the percentage of children has decreased since 2000.
Percentage of children who moved more than two times within a year of removal

These numbers would indicate that previously fewer African American children were placed with relatives. However the percentage of kinship placements has increased since 2001.
Number of children placed in kinship care when they first enter placement
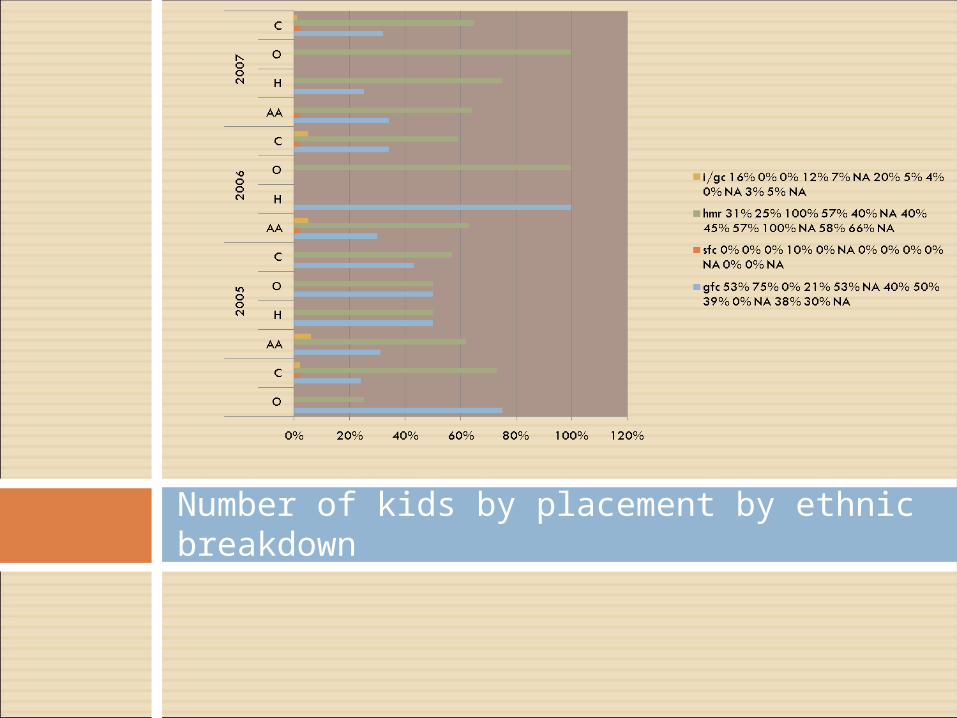
Number of kids by placement by ethnic breakdown

Percent of Children in care living with kin
0
20
40
60
80
100
120
2001 2002 2003 2004 2005 2006 2007
Year
Pe
rce
nt
of
Ch
ild
ren
A. Amer.
Hispanic
Other
Caucasian
All kids
African American children are more consistently placed with kin.
Caucasian children are more likely to be placed in foster care.

Median Length of stay for children in care
0
10
20
30
40
1999 2000 2001 2002 2003 2004 2005 2006
Year
Len
gth
of
stay
in
m
on
ths
0510152025303540
A. Amer.
Hispanic
Other
Caucasian
All children
The median length of stay is longer for African American children.
Caucasian children have a shorter median length of stay than the average for all children.

Average of median length of stay by race
African American 17.125 months
Hispanic 13.2 months
Other 17.5 months
Caucasian 15.87 months
All Children 16.375 months
Children living with kin placed within 5 miles of home of origin
0
20
40
60
80
100
2001 2002 2003 2004 2005 2006 2007
per
cen
t o
f ch
ildre
n
0102030405060708090
A. Amer. Hispanic Other Caucasian All kids
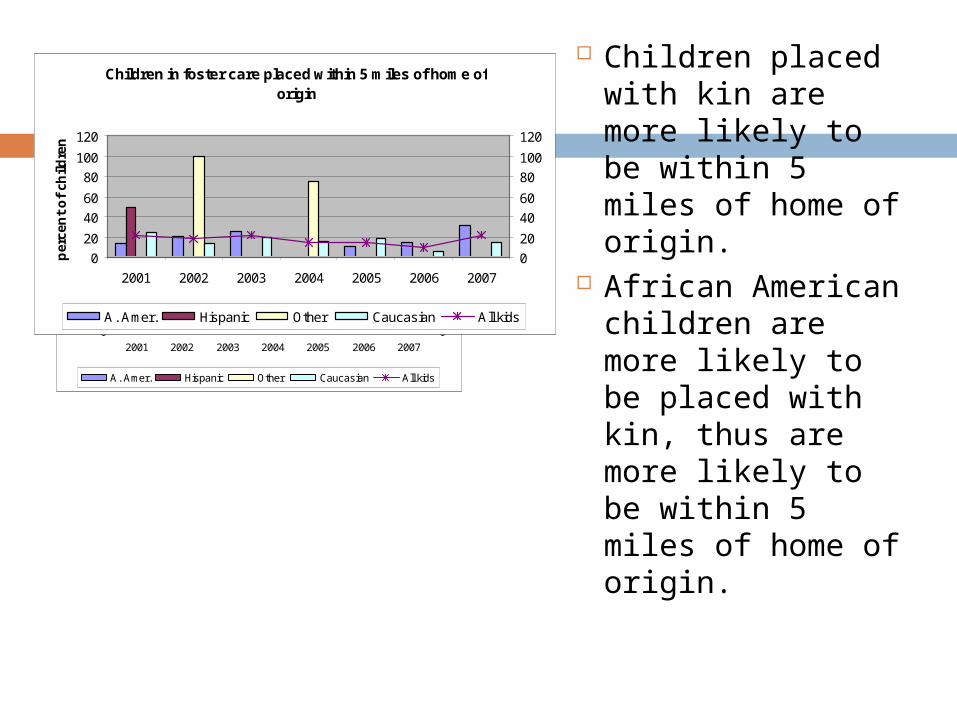
Children in foster care placed within 5 miles of home of origin
0
20
40
60
80
100
120
2001 2002 2003 2004 2005 2006 2007
per
cen
t o
f ch
ildre
n
0
20
40
60
80
100
120
A. Amer. Hispanic Other Caucasian All kids
Children placed with kin are more likely to be within 5 miles of home of origin.
African American children are more likely to be placed with kin, thus are more likely to be within 5 miles of home of origin.

Permanency at 12 months
0
50
100
150
2000 2001 2002 2003 2004 2005 2006per
cen
t o
f ch
ildre
n
ach
eivi
ng
per
man
ence
020406080100120
African Am. Hispanic Other Caucasian All kids
Caucasian children were consistent with the percentage of all children to attain permanence.
Hispanic children were more likely to achieve permanence.
African American children were less likely to achieve permanence.

Permanency at 24 months
0
50
100
150
1999 2000 2001 2002 2003 2004 2005Per
cen
t o
f ch
ildre
n
ach
eivi
ng
p
erm
anen
ce
020406080100120
African Am. Hispanic Other Caucasian All kids
The percentage increased by about 20% over the years. Hispanic children were less likely to achieve permanence
than any other group with the exception of 2005. African American and Caucasian children are consistent
with the total children to achieve permanency.
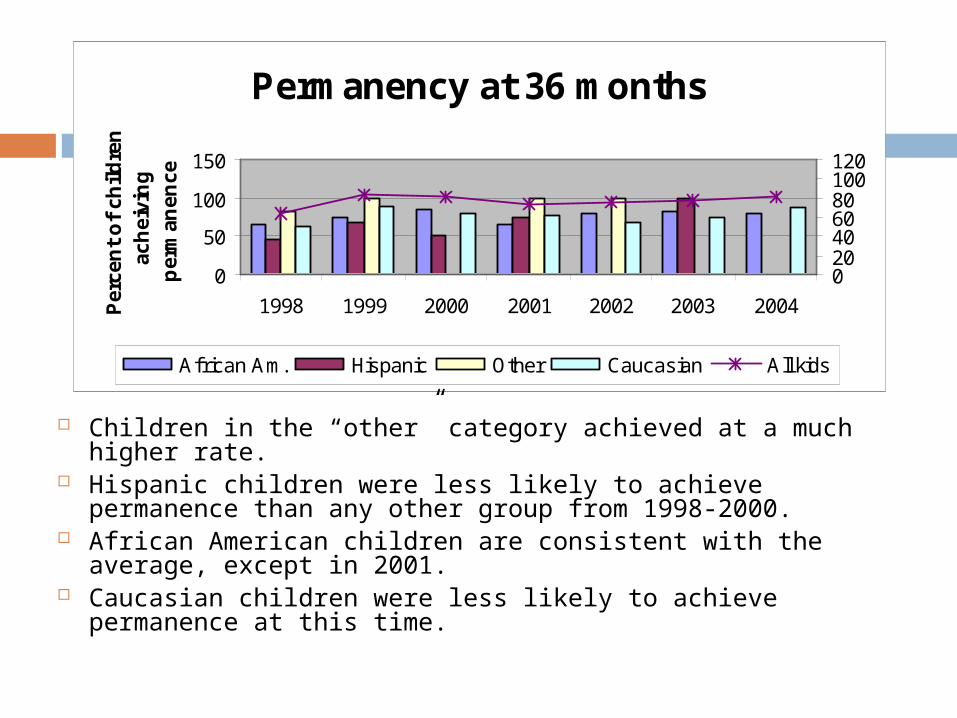
Permanency at 36 months
0
50
100
150
1998 1999 2000 2001 2002 2003 2004Per
cen
t o
f ch
ildre
n
ach
eivi
ng
p
erm
anen
ce
020406080100120
African Am. Hispanic Other Caucasian All kids
Children in the “other” category achieved at a much higher rate.
Hispanic children were less likely to achieve permanence than any other group from 1998-2000.
African American children are consistent with the average, except in 2001.
Caucasian children were less likely to achieve permanence at this time.
U.S. Census Bureau Data
The following slides represent the population in McLean County.

Median Income
The median income in McLean country for all residents is $51,176.
Caucasian residents:Average household income (1999): $48,152Average family income (1999): $62,164Income per capita: $22,970
African American residents:Average household income (1999): $30,578Average family income (1999): $38,221Income per capita: $15,544
Hispanic residents:Average household income (1999): $37,692Average family income (1999): $42,868Income per capita: $12,945

Income by Gender
Population 16 years and oldermale: $50,950 female: $51,
263 Full time year round workers with earnings
male: $28,650 female: $21,211
Median earningsmale: $48,506 female:
$36,547

Median Income by Household Households: $47,021 Total: $61,073 Married-couple families: $67,355 Female householder, no husband
present:$29,317
Non-family households: $26,416

Median earnings by educational attainment Less than high school graduate
male: $26,500 female: $16,133 High school graduate
male: $34,806 female: $21,703 Some college or associate’s degree
male: $40,672 female: $26,653 Bachelor’s degree
male: $50,037 female: $36,221 Graduate or professional degree
male: $65,533 female: $44,177
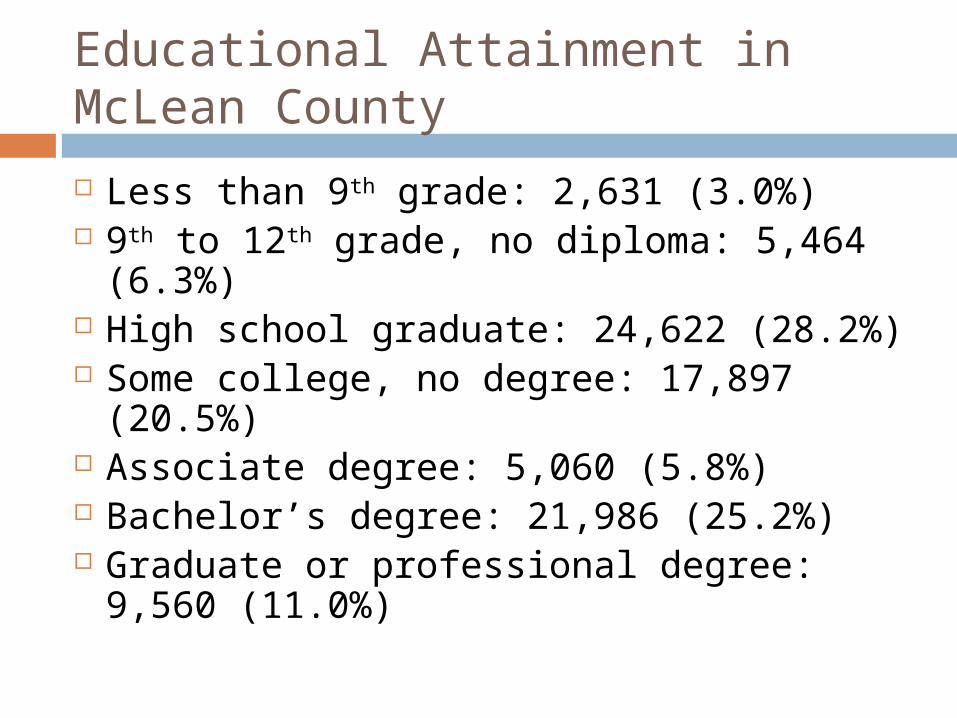
Educational Attainment in McLean County
Less than 9th grade: 2,631 (3.0%) 9th to 12th grade, no diploma: 5,464
(6.3%) High school graduate: 24,622 (28.2%) Some college, no degree: 17,897
(20.5%) Associate degree: 5,060 (5.8%) Bachelor’s degree: 21,986 (25.2%) Graduate or professional degree: 9,560
(11.0%)
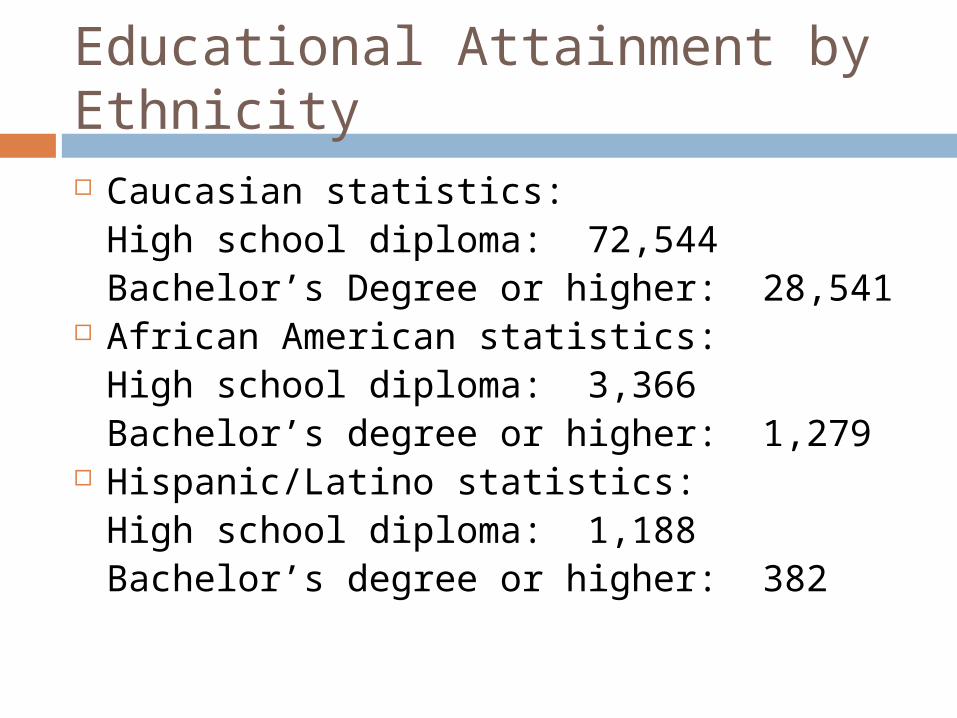
Educational Attainment by Ethnicity Caucasian statistics:
High school diploma: 72,544Bachelor’s Degree or higher: 28,541
African American statistics:High school diploma: 3,366Bachelor’s degree or higher: 1,279
Hispanic/Latino statistics:High school diploma: 1,188Bachelor’s degree or higher: 382
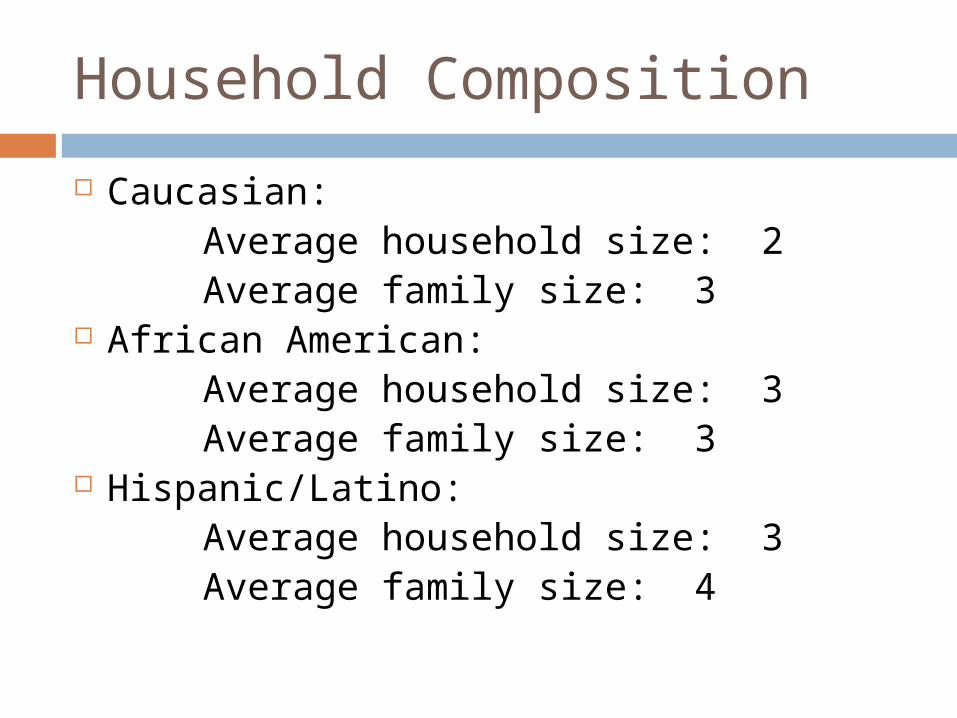
Household Composition
Caucasian:Average household size: 2Average family size: 3
African American:Average household size: 3Average family size: 3
Hispanic/Latino:Average household size: 3Average family size: 4

Poverty Line
Caucasian:Families living below the poverty line: 1,001Individuals living below the poverty line: 10,565
African American:Families living below the poverty line: 377Individuals living below the poverty line: 1,924
Hispanic/Latino:Families living below the poverty line: 102Individuals living below the poverty line: 727

Kay Brown/ GAO study
According to the GAO results, there were several key factors contributing to the proportion of African American Children in foster care.
These included:
1. Higher rate of poverty
2. Challenges in Accessing support services (Parent Mentor)
3. Racial bias and distrust
4. Difficulties in finding appropriate adoptive homes
(Kay Brown/ Government Accountability Office 2008)

Most states surveyed reported using various strategies intended to address these issues. Some of the various strategies included;
1. Building community supports
2. Cultral competency training for caseworkers
3. Diligence with kinship care placements
Significantly for this particular Government Accountability Study, it was emphasized the importance of “analyzing the data to address the proportion of African American children in care in order to better understand the issue and devise strategies to address it.” (Kay Brown/ Government Accountability Office 2008 pg 2)

What do we do with this information?
How do we meet the needs identified in the previously mentioned data?
What populations seem to have the highest representation with the lowest access to services?
How does the action team intend to address these concerns?
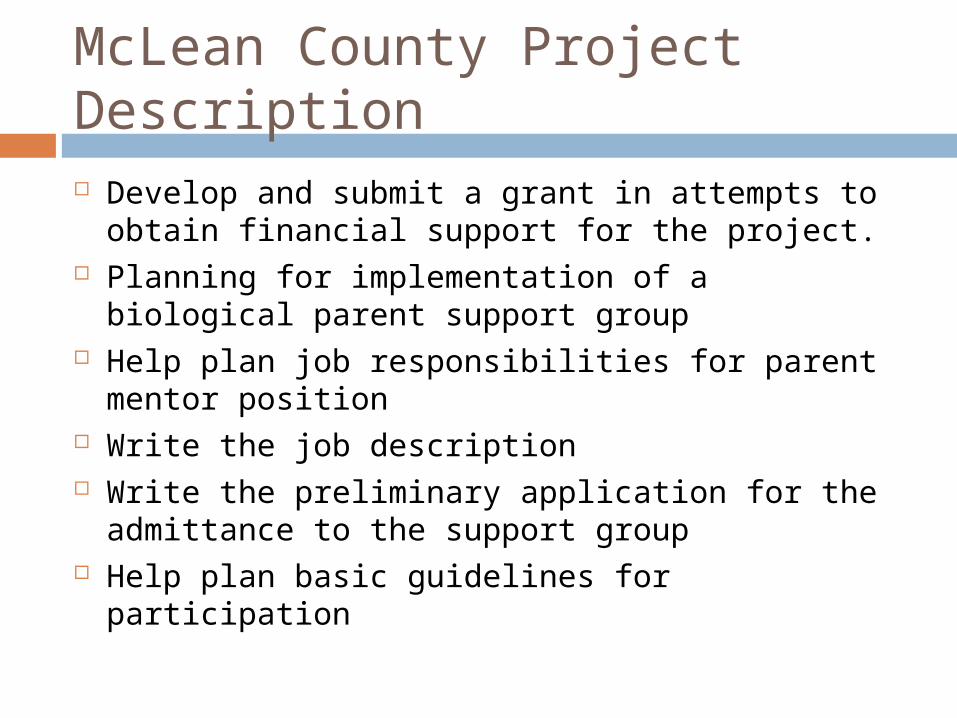
McLean County Project Description Develop and submit a grant in attempts to obtain
financial support for the project. Planning for implementation of a biological
parent support group Help plan job responsibilities for parent mentor
position Write the job description Write the preliminary application for the
admittance to the support group Help plan basic guidelines for participation
Why a support group?
The parent mentor leading the group will be a person that has been successful in reunification with their children. This mentor will then be in the position to provide support and assistance to families that are entering the juvenile court system. By having support, it is intended to help reduce the stress on the parent(s) and allow for a more timely reunification if possible.

Mentor Position
The parent mentor will be a paid position with about 10 hours a week of work.
The expectation is for the mentor to run a bi-weekly support group meeting, and allow for phone contact or meet by appointment with parents in the group.
The Next Step
The community action team is looking for more participation from community members, including inviting other involved agencies to participate on the team.
Continue to notify community members of when and where the meetings will happen. Continue to invite these members in hopes that they will become involved in the future.
The action team will continue to move forward with the grant in attempts to best serve the needs of the families within our communities.

Project Drawbacks
Due to the time constraint of the fall semester, we were only able to participate in the initial planning of this support group. We were only able to attend two MCAT meetings aside from our individual meetings for interviews and project status meetings. Group members will have to move forward with the materials presented to them and finalize the grant process.
Final Summary
In closing, we would like to thank not only our action team members, but those in the surrounding communities. Through this project we have learned that each action team is attempting to address the issue of minority overrepresentation within their communities served. Also that it is not a one person commitment, but that it takes a community to bring about change.
References
Government Accountability Office (2008, July). African American Children in Foster Care HHS and Congressional Actions Could Help Reduce Proportion in Care, Retrieved from www.gao.gov