data report: particle size analysis of sediments in the nankai trough
TRANSCRIPT

Proc. IODP | Volume 319
Saffer, D., McNeill, L., Byrne, T., Araki, E., Toczko, S., Eguchi, N., Takahashi, K., and the Expedition 319 ScientistsProceedings of the Integrated Ocean Drilling Program, Volume 319
Chapter contents
Abstract . . . . . . . . . . . . . . . . . . . . . . . . . . . . . . . 1
Introduction . . . . . . . . . . . . . . . . . . . . . . . . . . . 1
Methods . . . . . . . . . . . . . . . . . . . . . . . . . . . . . . 2
Results . . . . . . . . . . . . . . . . . . . . . . . . . . . . . . . . 3
Reproducibility . . . . . . . . . . . . . . . . . . . . . . . . . 4
Acknowledgments. . . . . . . . . . . . . . . . . . . . . . . 4
References . . . . . . . . . . . . . . . . . . . . . . . . . . . . . 4
Figures . . . . . . . . . . . . . . . . . . . . . . . . . . . . . . . . 5
Tables. . . . . . . . . . . . . . . . . . . . . . . . . . . . . . . . 12
1Flemings, P.B., Reece, J.S., Ditkof, J., Atkins, C.C., and Sawyer, D., 2015. Data report: particle size analysis of sediments in the Nankai Trough, IODP Expedition 319 Hole C0009A. In Saffer, D., McNeill, L., Byrne, T., Araki, E., Toczko, S., Eguchi, N., Takahashi, K., and the Expedition 319 Scientists, Proc. IODP, 319: Tokyo (Integrated Ocean Drilling Program Management International, Inc.). doi:10.2204/iodp.proc.319.203.20152Jackson School of Geosciences, University of Texas, Austin TX 78705, USA. Correspondence author: [email protected] of Earth and Environmental Sciences, University of Kentucky, Lexington KY 40506, USA.4Department of Geophysics, Stanford University, Stanford CA 94305, USA.
Data report: particle size analysis of sediments in the Nankai Trough, IODP Expedition 319 Hole C0009A1
Peter B. Flemings,2 Julia S. Reece,2, 4 Julie Ditkof,2 Carmen C. Atkins,2 and Derek Sawyer3
AbstractWe analyzed the particle size distribution of 46 samples from Inte-grated Ocean Drilling Program (IODP) Expedition 319 HoleC0009A in the Kumano Basin of the Nankai Trough. Using Shep-ard’s classification, we found that most samples fall into theclayey-silt classification. Clayey-silt is composed of 35%–88% silt-size particles, 11%–38% clay-size particles, and <20% sand-sizedparticles by weight. However, six samples contain more sand-sized particles and thus fall into either the sandy-silt or silty-sandcategory according to Shepard’s classification. Samples at SiteC0009 were analyzed over a depth range of 1529–1591 meters be-low seafloor using the wet-sieve and hydrometer methods.
IntroductionThe Nankai Trough Seismogenic Zone Experiment (NanTroSEIZE)is a coordinated, multiexpedition drilling project designed to in-vestigate fault slip behavior and the mechanics of seismogenesisalong a subduction megathrust fault system through direct sam-pling, in situ measurements, and long-term monitoring associ-ated with laboratory and numerical modeling studies (Saffer et al.,2009). As part of the NanTroSEIZE program, operations during In-tegrated Ocean Drilling Program (IODP) Expedition 319 includedriser and riserless drilling, analyses of cuttings and core samples,downhole measurements and logging, observatory operations,and casing. Two sites were drilled during Expedition 319: SiteC0009 in the Kumano forearc basin and Site C0010 across a majorsplay fault (termed the “megasplay”) that bounds the seawardedge of the forearc basin near its updip terminus. We analyze thegrain size of samples from Site C0009, which is located at thenorthern edge of the 3-D seismic volume acquired in 2006 (Fig.F1).
Hole C0009A was cored from 1509.7–1593.9 meters below sea-floor (mbsf). The strata in this interval are late Miocene in age andare described as brown-gray silty-claystone, with minor interbedsof brown-gray siltstone-sandstone, and minor interbeds of lightgray fine vitric tuff. Four lithofacies were defined based on the rel-ative abundance of these lithologies (see the “Site C0009” chap-ter [Expedition 319 Scientists, 2010]).
To create a depth profile of particle sizes at Site C0009, we ana-lyzed the particle size distribution of 46 samples. The results may
doi:10.2204/iodp.proc.319.203.2015
P.B. Flemings et al. Data report: particle size analysis of sediments
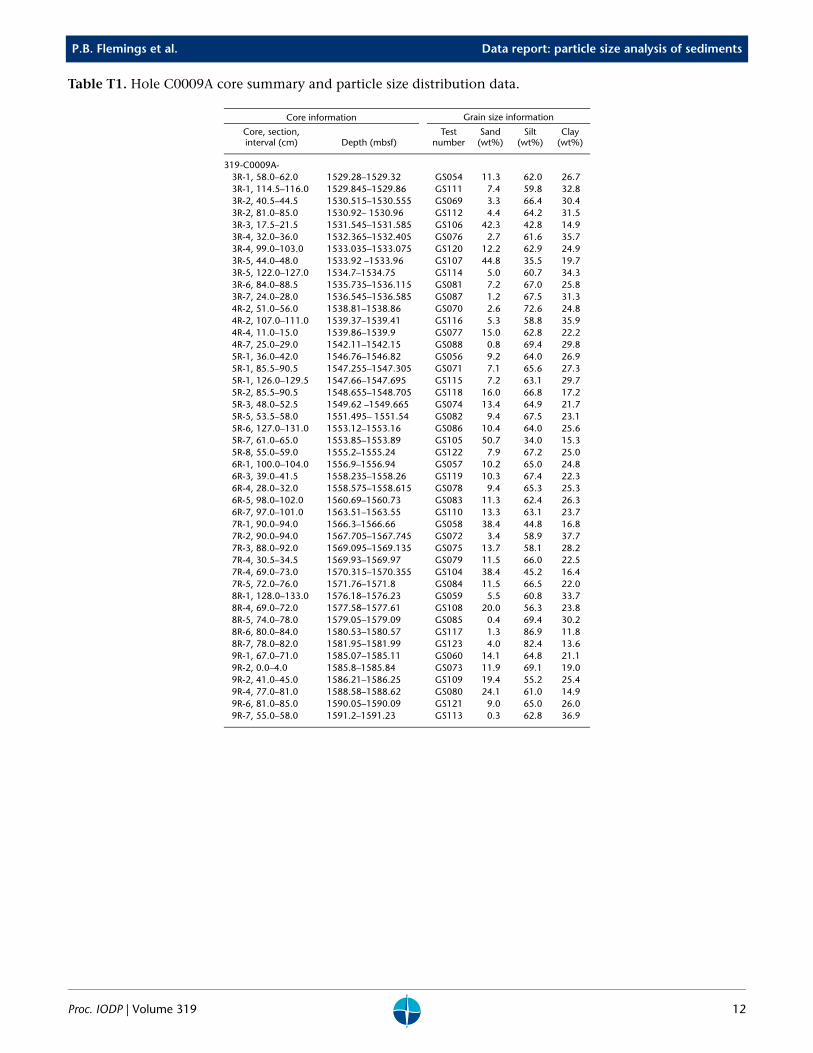
provide a useful constraint to understand how litho-logy impacts physical properties (e.g., permeability,compressibility, and porosity) and may assist in in-terpreting the paleogeographic evolution of the Ku-mano Basin. Our procedure and results are presentedbelow (Tables T1, T2). A nomenclature table is in-cluded (Table T3).
MethodsTo create a depth profile of particle sizes at SiteC0009, we analyzed the particle size distribution of atotal of 46 samples. The samples were primarily from10 cm3 plug samples taken shipboard. The wet-sieveand hydrometer techniques were used, which gener-ated particle size distributions for each sample. Theprocedure used at the University of Texas at Austin(USA) for this study is described below. It is slightlymodified from that used in Sawyer et al. (2008). Thisprocedure is internationally recognized as a standardin the American Standard for Testing and Materials(ASTM International, 2007) and in the British Stan-dard Institution (British Standard Institution, 1990).These size distributions were binned into sand, silt,and clay percentages for each sample. We used aclay-silt-sand ternary diagram using the Shepardclassification (Shepard, 1954) to classify the samples.
Principles of hydrometer analysisGermaine and Germaine (2009) discuss hydrometeranalysis and the physical principles of sedimenta-tion. The terminal velocity at which spherical parti-cles settle through a column of fluid can be de-scribed by Stokes’ law (Craig, 1992). Stoke’s lawassumes that particles are (1) rigid, spherical, andsmooth; (2) of similar density; (3) separated fromeach other; (4) do not interact during sedimentation;and (5) are large enough that Brownian motion doesnot control settlement. This approach is applicablefor particle sizes ranging from 0.0002 to 0.1 mm(Germaine and Germaine, 2009). The general ap-proach is to mix the sediment into a suspension andthen allow sedimentation while measuring the den-sity of the suspended sediment at a specific depth.
The diameter of the largest particle in suspension (D)is
, (1)
where
D 18μρwg Gs 1–( )-------------------------------- L
t---×=
Proc. IODP | Volume 319
D = diameter of the particle (cm),µ = viscosity of water (g/[cm·s]),Gs = specific gravity of sediment (dimensionless),ρw = water density (g/cm3),g = force of gravity (cm/s2),L = distance the particle falls (cm), andt = time for fall (s).
The percent finer material (N) at reading m is
, (2)
where
Nm = percent finer material at reading m (%),Gs = the specific gravity of sediment (dimension-
less),V = volume of suspension (mm3),MD = dry solid mass of hydrometer specimen (g),Rm = hydrometer reading in suspension at time
(t) and temperature, T (dimensionless),Rw,m = hydrometer reading in water with disper-
sant at the same temperature as for Rm (di-mensionless), and
m = reading number.
SamplesWe analyzed 46 samples distributed across the inter-val between 1529 and 1591 mbsf. We analyzed sam-ples with a wet mass between 25 and 45 g because itwas determined that a mass <25 g produced inaccu-rate results.
Sample preparationSamples were first manually disaggregated using amortar and pestle. After recording the wet mass, thewet sample was mixed with 5 g of dispersing agent(sodium hexametaphosphate) and ~200 mL of de-ionized water and allowed to sit for 24–48 h. Themixture was further disaggregated for 1 min using aHamilton-Beach malt mixer (ASTM International,2007).
Once the sample was mixed, the slurry was washedthrough a 63 µm sieve with deionized water and aspatula. Material that was unable to pass through thesieve was dried at 110°C. The sample was thencooled and weighed to determine the percentage ofsand for each sample.
The material that passed through the sieve wasplaced in a 1000 mL plastic cylinder and deionized
Nm
GsGs 1–---------------- V
MD--------- ρc Rm Rw m, 100×–( )=
2
P.B. Flemings et al. Data report: particle size analysis of sediments
water was added to create a total volume of 1000 mL.Five to six cylinders were usually tested at one time.
Hydrometer analysisThe prepared suspension was mixed thoroughly witha plunging rod for 1 min. The removal of the plung-ing rod marked the beginning of the sedimentationprocess. Two sets of hydrometer readings were ob-tained for the first 2 min (each at 15, 30, 60, 90, and120 s) of sedimentation with the hydrometer re-maining in the suspension. The hydrometer wasthen removed, rinsed and wiped dry. Readings werethen taken at larger increments of time (4, 8, 16, 32,64, etc., minutes), with the hydrometer being in-serted and removed right before and after the timemark, until the largest particle in solution (Equation 1)was >0.002 m (the clay/silt boundary assumed). Thetemperature in the laboratory was monitored with athermometer in a cylinder filled with deionized wa-ter and salt. At the end of the experiment, the slurrywas poured into an evaporating dish and dried in anoven at 110°C to obtain the final dry mass of sedi-ment and dispersing agent.
The hydrometer has to be calibrated prior to testingto obtain information for three factors: the meniscusrise, the effective reading depth for any particularreading, and the changes in fluid density with tem-perature and dispersing agent (Germaine and Ger-maine, 2009). For the effective reading depth (L),two relationships are required: one for situationswhen the hydrometer remains in the suspensioncontinuously and one for situations when the hy-drometer is inserted for the reading (Germaine andGermaine, 2009). For times ≤2 min, the effectivereading depth (L) is described by
, (3)
where
L = effective reading depth for situations whenthe hydrometer remains in the suspensioncontinuously (cm),
Hr,1 and Hr,2 = dimension between the center ofbuoyancy and readings Rh,1 and Rh,2 on thehydrometer (cm),
Rh = hydrometer reading in suspension (g/L) attime (t) and temperature (T), and
cmr = meniscus correction in units of specific grav-ity (dimensionless).
For times <2 min, an immersion correction (Vh/2A)was applied to the readings to account for the fact
L Hr 1,
Hr 1, Hr 2,–( )Rh 2, Rh 1,–( )-------------------------------- Rh cmr Rh 1,–+( )×–=
Proc. IODP | Volume 319
that the insertion of the hydrometer into the suspen-sion stretches the column of fluid:
, (4)
where
L = effective reading depth for situations whenthe hydrometer is inserted before individualreadings (cm)
Vh = volume of hydrometer bulb up to the base ofthe stem (cm3), and
A = cross-section area of cylinder (cm2).
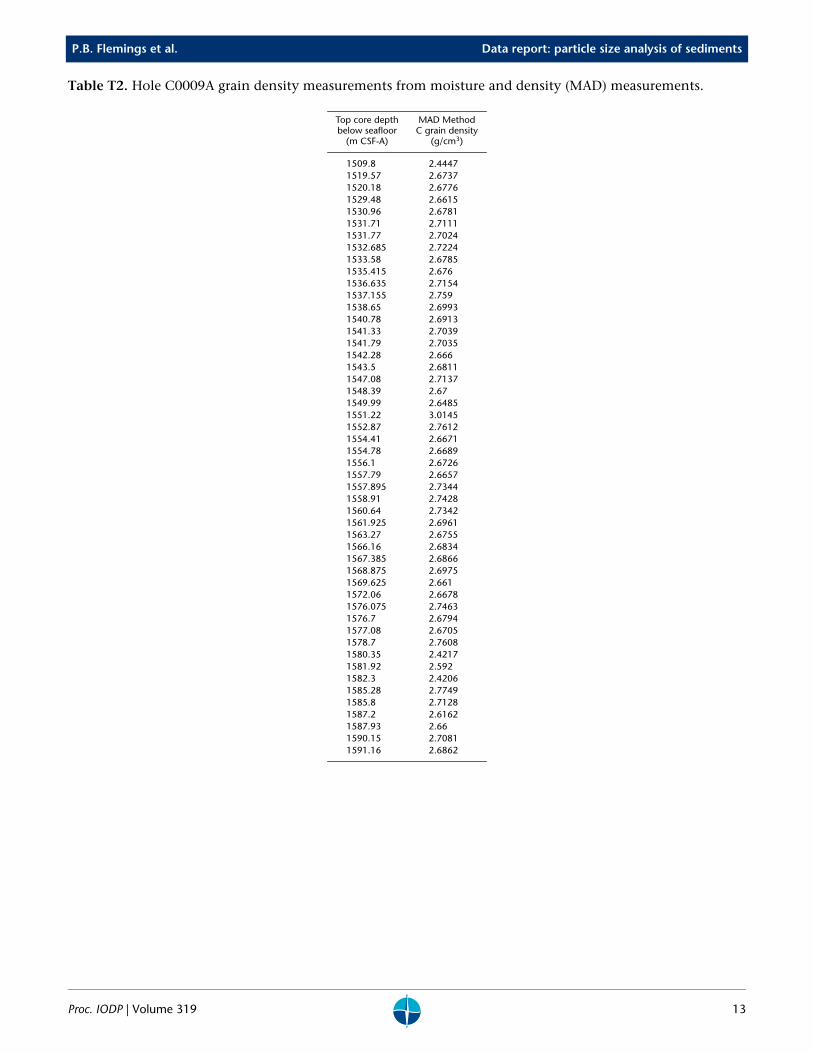
Grain densities were not measured on the samplesthat we performed grain size analysis on. Instead,density was estimated from shipboard moisture anddensity (MAD) measurements. These measurementsranged between 2.42 and 3.01 g/cm3 (Table T2). Weused the average of two or three MAD grain densitymeasurements take near the depths of the samplethat we performed grain size analysis on.
ResultsParticle size distribution curves were created for all46 samples. Table T1 gives the sand, silt, and claypercentages calculated using the hydrometer analy-sis. Figures F2 and F3 show an example data sheetand plot for our hydrometer analysis (see GRAINSIZin “Supplementary material” for similar graphs foreach sample).
Figure F4 shows a particle distribution graph show-ing depth versus grain density and weight percentclay. Because we did not measure the density of theactual grain size samples, we determined an error re-sulting from using MAD density values from depthsthat are close to the depth of the grain size samples.To test the error in our grain density, we present thedata using three constant grain density values. Wecalculated all grain size distributions to have a graindensity of 2.7 g/cm3 as an average specific gravity.We then altered all 46 samples to have a specificgravity of 2.6 and 2.8. The fraction of clay presentvaried only ±0.8% compared to the grain size distri-bution with a specific gravity of 2.7. This demon-strates that variation in grain density over a reason-able range has a small effect on the interpreted grainsize distribution.
Using the ternary diagram in Figure F5, we plot thesand, silt, and clay percentages for all 46 samples.Nearly all samples are within the clayey-silt fieldwith a few scattered sandy-silts, silty-sands, andsands. The samples are more clay rich in the upper-
L Hr 1,Hr 1, Hr 2,–( )Rh 2, Rh 1,–( )---------------------------------- Rh cmr Rh 1,–+( )×
Vh2A-------––=
3
P.B. Flemings et al. Data report: particle size analysis of sediments
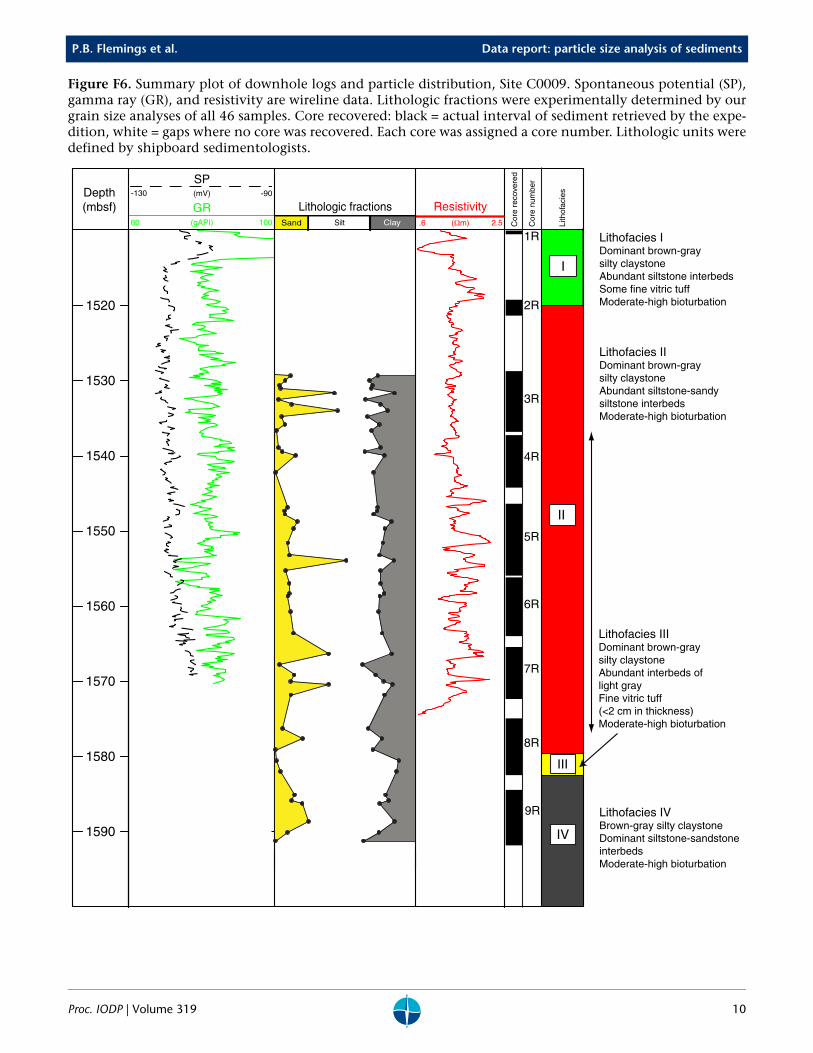
most section, as seen in the particle distributiongraph (Fig. F6).
The downcore profile for sand, silt, and clay againstgamma ray, spontaneous potential, resistivity, litho-logy, and core information is shown in Figure F6.
ReproducibilityWe used excess material from the samples to run arepeat experiment of Sample 319-C0009A-5R-1W,126.0–129.5 cm. We conducted one test where mul-tiple hydrometer runs were taken on a single sample.The initial masses of the samples were varied (37.52and 31.61 g) (Fig. F7).
The particle size distribution curves generally matcheach other with only minor variation in two parts(Fig. F7). This deviation can be explained by recog-nizing the material was not homogenized. They weretaken from the same core, interval, and depth, butwere separated into two packages. We assume there-fore that our methods are reproducible.
AcknowledgmentsAll samples used in this study were collected duringIntegrated Ocean Drilling Program (IODP) Expedi-tion 319. Funding for this research was provided bythe U.S. Science Support Program, administered bythe Consortium for Ocean Leadership. We thank theExpedition 319 crew and science party.
ReferencesASTM International, 2007. Standard test method for parti-
cle-size analysis of soils (Standard D422-63[2007]). In Annual Book of ASTM Standards (Vol. 04.08): Soil and Rock (I): West Conshohocken, PA (Am. So. Testing Mater.). doi:10.1520/D0422-63R07
British Standards Institution, 1990. Methods of Test for Soils for Civil Engineering Purposes (Standard BS-1377[1990]): London (British Standards Inst.).
Proc. IODP | Volume 319
Craig, R.F., 1992. Soil Mechanics (5th ed.): London (Chap-man and Hall).
Expedition 319 Scientists, 2010. Site C0009. In Saffer, D., McNeill, L., Byrne, T., Araki, E., Toczko, S., Eguchi, N., Takahashi, K., and the Expedition 319 Scientists, Proc. IODP, 319: Tokyo (Integrated Ocean Drilling Program Management International, Inc.). doi:10.2204/iodp.proc.319.103.2010
Germaine, J.T., and Germaine, A.V., 2009. Geotechnical Lab-oratory Measurements for Engineers: Hoboken, NJ (Wiley). doi:10.1002/9780470548790
Heki, K., 2007. Secular, transient, and seasonal crustal movements in Japan from a dense GPS array: implica-tion for plate dynamics in convergent boundaries. In Dixon, T.H., and Moore, J.C. (Eds.), The Seismogenic Zone of Subduction Thrust Faults: New York (Columbia Univ. Press), 512–539.
Saffer, D., McNeill, L., Araki, E., Byrne, T., Eguchi, N., Toczko, S., Takahashi, K., and the Expedition 319 Scien-tists, 2009. NanTroSEIZE Stage 2: NanTroSEIZE riser/riserless observatory. IODP Prel. Rept., 319. doi:10.2204/iodp.pr.319.2009
Sawyer, D.E., Jacoby, R., Flemings, P., and Germaine, J.T., 2008. Data report: particle size analysis of sediments in the Ursa Basin, IODP Expedition 308 Sites U1324 and U1322, northern Gulf of Mexico. In Flemings, P.B., Beh-rmann, J.H., John, C.M., and the Expedition 308 Scien-tists, Proc. IODP, 308: College Station, TX (Integrated Ocean Drilling Program Management International, Inc.). doi:10.2204/iodp.proc.308.205.2008
Seno, T., Stein, S., and Gripp, A.E., 1993. A model for the motion of the Philippine Sea plate consistent with NUVEL-1 and geological data. J. Geophys. Res.: Solid Earth, 98(B10):17941–17948. doi:10.1029/93JB00782
Shepard, F.P., 1954. Nomenclature based on sand-silt-clay ratios. J. Sediment. Res., 24(3):151–158. doi:10.1306/D4269774-2B26-11D7-8648000102C1865D
Initial receipt: 19 April 2013 Acceptance: 21 January 2015 Publication: 1 May 2015 MS 319-203
4

P.B. Flemings et al. Data report: particle size analysis of sediments
Figure F1. Map of study area showing drill sites, Sites C0009 and C0010 (green diamonds) (modified from Safferet al., 2009). Red circles = NanTroSEIZE Stage 1 sites, black box = location of 3-D reflection data acquisition in2006, yellow arrows = vectors estimated far-field between Philippine Sea plate and Japan (Heki, 2007; Seno,1993), stars = large earthquakes in the past.
Izu
1944
1946
33°
135°E 136° 137° 138° 139°
34°
35°N
TokaiIzu
Philippine Sea plate(Shikoku Basin)
km
0 50
Izu
30°
130°E 140° 150°
40°N
~4.1–6.5 cm/y
Kii Peninsula
Site C0009
Site C0006
Site C0003 and C0004
Site C0002Site C0001
Site C0010
Lin
e 5
Proc. IODP | Volume 319 5

P.B. Flemings et al. Data report: particle size analysis of sediments
Figure F2. Example data sheet for hydrometer analyses, Site C0009.
IODP Expedition 319
C0009A Hydrometer: 151H Fisher Brand Volumetric
3R-1 54-62 cm Number = 98 Volume = (cm3)95.96= emuloViaknaN (cm3) Area = (cm2)
Spec. Grav. = 2.66 Hr @ 1035 = 8.2 (cm) Mass Measurement
Dry Soil Mass = 36.18 (gm) Hr @ 1000 = )mg()mc(5.71)mg()l/mg(4.0= sucsineM)mg(00.5= .psiD ssaM
Note: Disp. not included in dry mass. Note: Read hydrometer to 0.2 gm/l
stluseRstnemerusaeM
0.33 1023.1 23.0 11.30.5 1022.7 23.0 11.41 1021.9 23.0 11.6
1.5 1021.1 23.0 11.82 1020.5 23.0 11.94 1019.2 23.0 11.1
8.0 1018.1 23.0 11.416 1016.2 23.0 11.932 1014.9 23.0 12.265 1013.2 23.0 12.7128 1012.0 23.0 13.0210 1011.0 23.0 13.3460 1010.0 23.0 13.5
1413 1009.6 23.0 13.61891 1009.2 23.0 13.72843 1007.8 23.0 14.110042 1006.9 23.0 14.4
Sieve Data (wet sieved at 63 μm) Interpolated silt/clay boundary (at 2 μm)4.080 )%()mg(11.28 (%) (mm)88.72 (%)0.0630 (mm)
Remarks: For times greater than 2 minutes, an immersion correction is applied to the readings.
100028.77
9.56E-069.56E-069.56E-069.56E-069.56E-069.56E-069.56E-06
Viscosity (gm-
sec/cm2)9.56E-069.56E-069.56E-069.56E-06
353.35316.25
83.4
Hydrometer AnalysisTest No: GS054
Project : Tested by: CAA
Test Date: 4/20/2010Boring :
Location :Sample :
0.06267
Constants
4/20/20104/20/2010
85.2 0.076781003.91003.9
Tare, soil, disp. =Tare =
0.0081318500.03.149.3001
9.849.3001
0.369.300133110.06.459.3001
27.1
0.0041903300.06.139.3001
05000.09.300139000.04.719.3001
6.329.3001
0.639.3001
9.56E-069.56E-069.56E-069.56E-06
9.56E-069.56E-06
13.44/21/2010
4/20/20104/20/20104/20/20104/20/20104/20/2010
0.036859.979.30013.679.3001
0.0321388120.09.769.3001
7.379.3001
0.01568
0.04473
0.0022592100.04.529.3001
1003.9
Date (mm/dd/yyyy)
Diameter (mm)
Percent Finer (%)
Temp. (C)
Elasped Time (min)
Suspension Reading
(SG*1000)
Water / Disp. Reading
(SG*1000)
Reading Depth (cm)
Diameter:
Mass retained on sieve:Sand-percent of dry mass:
Percent passing 63 μm:
Percent passing 2 μm: 26.7Diameter: 0.002
0.00112
4/26/2010
4/20/20104/20/20104/20/20104/20/20104/20/20104/20/20104/20/20104/21/2010
Proc. IODP | Volume 319 6

P.B. Flemings et al. Data report: particle size analysis of sediments
Figure F3. Sample particle size distribution plotted on a semilog scale, Site C0009. Black circles = hydrometerreadings, diamond = sand fraction from wet sieving through 63 µm sieve. The sand/silt boundary is defined at63 µm and the silt/clay boundary is defined at 2 µm. See GRAINSIZ in “Supplementary material” for test re-sults.
22 Apr 2010:etaD tseTiaknaN:noitacoLmc 24-63 1,-R5 :elpmaSA9000C:gniroB650SG:tseT
0
10
20
30
40
50
60
70
80
90
100
0.00010.00100.01000.10001.0000
Mas
s pa
ssin
g (%
)
Particle diameter (mm)
Summary of grain size analysis
Hydrometer data
Sieve data
Sand Silt Clay
Proc. IODP | Volume 319 7

P.B. Flemings et al. Data report: particle size analysis of sediments
Figure F4. Grain density and clay fraction vs. depth for all measured samples, Site C0009. A. Grain density mea-sured by shipboard scientists (Table T2). B. Grain density used for analyses, determined by averaging two orthree MAD grain density measurements. C. Clay fractions determined from hydrometer analyses using graindensity shown in B. Gray = clay fraction, white = silt and sand fraction. Positive and negative error bars in clayfraction are determined from using grain density values of 2.6 and 2.8 g/cm3 relative to 2.7 g/cm3 in the clayfraction calculation, respectively.
Clay (wt%)
Dep
th (
mbs
f)
1530
1540
1550
1560
1570
1580
1590
Grain density (g/cm3)MAD grain density (g/cm3)2.5 2.6 2.7 2.8 2.9 2.5 2.6 2.7 2.8 2.9 0 10 20 30 40 50
A B C
Proc. IODP | Volume 319 8

P.B. Flemings et al. Data report: particle size analysis of sediments
Figure F5. Ternary diagram of all 46 samples from Hole C0009A using Shepard’s (1954) sediment classificationscheme.
% Silt0 10 20 30 40 50 60 70 80 90 100
% Clay
0
10
20
30
40
50
60
70
80
90
100
% Sand
0
10
20
30
40
50
60
70
80
90
100
Sand-silt-clay
Clay
SiltSand
Clayeysilt
Silty clay
Sandy siltSilty sand
Clayey sand
Sandy clay
Proc. IODP | Volume 319 9
P.B. Flemings et al. Data report: particle size analysis of sediments
Figure F6. Summary plot of downhole logs and particle distribution, Site C0009. Spontaneous potential (SP),gamma ray (GR), and resistivity are wireline data. Lithologic fractions were experimentally determined by ourgrain size analyses of all 46 samples. Core recovered: black = actual interval of sediment retrieved by the expe-dition, white = gaps where no core was recovered. Each core was assigned a core number. Lithologic units weredefined by shipboard sedimentologists.
1520
1530
1540
1550
1560
1570
1580
1590
60
-130Depth (mbsf) GR
(gAPI) 100
SP(mV) -90
Lithologic fractions
1R
2R
3R
4R
5R
6R
7R
8R
9R
III
IV
II
I
Cor
e re
cove
red
60
Resistivity(Ωm) 2.5.6Sand Silt Clay
Lithofacies IDominant brown-gray silty claystoneAbundant siltstone interbedsSome fine vitric tuffModerate-high bioturbation
Lithofacies IIDominant brown-gray silty claystoneAbundant siltstone-sandy siltstone interbedsModerate-high bioturbation
Lithofacies IVBrown-gray silty claystoneDominant siltstone-sandstone interbedsModerate-high bioturbation
Lithofacies IIIDominant brown-gray silty claystoneAbundant interbeds of light grayFine vitric tuff (<2 cm in thickness)Moderate-high bioturbation
Cor
e nu
mbe
r
Lith
ofac
ies
Proc. IODP | Volume 319 10

P.B. Flemings et al. Data report: particle size analysis of sediments
Figure F7. Graph of two hydrometer tests (GS071 and GS115) on the same sample from 1547.66 mbsf to illus-trate reproducibility. The initial mass of the samples also varied. Sample GS115 had a mass of 31.61 g andSample GS071 had a mass of 37.52 g.
0
10
20
30
40
50
60
70
80
90
100
0.00010.00100.01000.10001.0000
Mas
s pa
ssin
g (%
)
Particle diameter (mm)
Hydrometer data (71)
Sieve data (71)
Hydrometer data (115)
Sieve data (115)
Sand Silt Clay
Proc. IODP | Volume 319 11
P.B. Flemings et al. Data report: particle size analysis of sediments
Table T1. Hole C0009A core summary and particle size distribution data.
Core information Grain size information
Core, section, interval (cm) Depth (mbsf)
Test number
Sand (wt%)
Silt (wt%)
Clay (wt%)
319-C0009A-3R-1, 58.0–62.0 1529.28–1529.32 GS054 11.3 62.0 26.73R-1, 114.5–116.0 1529.845–1529.86 GS111 7.4 59.8 32.83R-2, 40.5–44.5 1530.515–1530.555 GS069 3.3 66.4 30.43R-2, 81.0–85.0 1530.92– 1530.96 GS112 4.4 64.2 31.53R-3, 17.5–21.5 1531.545–1531.585 GS106 42.3 42.8 14.93R-4, 32.0–36.0 1532.365–1532.405 GS076 2.7 61.6 35.73R-4, 99.0–103.0 1533.035–1533.075 GS120 12.2 62.9 24.93R-5, 44.0–48.0 1533.92 –1533.96 GS107 44.8 35.5 19.73R-5, 122.0–127.0 1534.7–1534.75 GS114 5.0 60.7 34.33R-6, 84.0–88.5 1535.735–1536.115 GS081 7.2 67.0 25.83R-7, 24.0–28.0 1536.545–1536.585 GS087 1.2 67.5 31.34R-2, 51.0–56.0 1538.81–1538.86 GS070 2.6 72.6 24.84R-2, 107.0–111.0 1539.37–1539.41 GS116 5.3 58.8 35.94R-4, 11.0–15.0 1539.86–1539.9 GS077 15.0 62.8 22.24R-7, 25.0–29.0 1542.11–1542.15 GS088 0.8 69.4 29.85R-1, 36.0–42.0 1546.76–1546.82 GS056 9.2 64.0 26.95R-1, 85.5–90.5 1547.255–1547.305 GS071 7.1 65.6 27.35R-1, 126.0–129.5 1547.66–1547.695 GS115 7.2 63.1 29.75R-2, 85.5–90.5 1548.655–1548.705 GS118 16.0 66.8 17.25R-3, 48.0–52.5 1549.62 –1549.665 GS074 13.4 64.9 21.75R-5, 53.5–58.0 1551.495– 1551.54 GS082 9.4 67.5 23.15R-6, 127.0–131.0 1553.12–1553.16 GS086 10.4 64.0 25.65R-7, 61.0–65.0 1553.85–1553.89 GS105 50.7 34.0 15.35R-8, 55.0–59.0 1555.2–1555.24 GS122 7.9 67.2 25.06R-1, 100.0–104.0 1556.9–1556.94 GS057 10.2 65.0 24.86R-3, 39.0–41.5 1558.235–1558.26 GS119 10.3 67.4 22.36R-4, 28.0–32.0 1558.575–1558.615 GS078 9.4 65.3 25.36R-5, 98.0–102.0 1560.69–1560.73 GS083 11.3 62.4 26.36R-7, 97.0–101.0 1563.51–1563.55 GS110 13.3 63.1 23.77R-1, 90.0–94.0 1566.3–1566.66 GS058 38.4 44.8 16.87R-2, 90.0–94.0 1567.705–1567.745 GS072 3.4 58.9 37.77R-3, 88.0–92.0 1569.095–1569.135 GS075 13.7 58.1 28.27R-4, 30.5–34.5 1569.93–1569.97 GS079 11.5 66.0 22.57R-4, 69.0–73.0 1570.315–1570.355 GS104 38.4 45.2 16.47R-5, 72.0–76.0 1571.76–1571.8 GS084 11.5 66.5 22.08R-1, 128.0–133.0 1576.18–1576.23 GS059 5.5 60.8 33.78R-4, 69.0–72.0 1577.58–1577.61 GS108 20.0 56.3 23.88R-5, 74.0–78.0 1579.05–1579.09 GS085 0.4 69.4 30.28R-6, 80.0–84.0 1580.53–1580.57 GS117 1.3 86.9 11.88R-7, 78.0–82.0 1581.95–1581.99 GS123 4.0 82.4 13.69R-1, 67.0–71.0 1585.07–1585.11 GS060 14.1 64.8 21.19R-2, 0.0–4.0 1585.8–1585.84 GS073 11.9 69.1 19.09R-2, 41.0–45.0 1586.21–1586.25 GS109 19.4 55.2 25.49R-4, 77.0–81.0 1588.58–1588.62 GS080 24.1 61.0 14.99R-6, 81.0–85.0 1590.05–1590.09 GS121 9.0 65.0 26.09R-7, 55.0–58.0 1591.2–1591.23 GS113 0.3 62.8 36.9
Proc. IODP | Volume 319 12
P.B. Flemings et al. Data report: particle size analysis of sediments
Table T2. Hole C0009A grain density measurements from moisture and density (MAD) measurements.
Top core depth below seafloor
(m CSF-A)
MAD MethodC grain density
(g/cm3)
1509.8 2.44471519.57 2.67371520.18 2.67761529.48 2.66151530.96 2.67811531.71 2.71111531.77 2.70241532.685 2.72241533.58 2.67851535.415 2.6761536.635 2.71541537.155 2.7591538.65 2.69931540.78 2.69131541.33 2.70391541.79 2.70351542.28 2.6661543.5 2.68111547.08 2.71371548.39 2.671549.99 2.64851551.22 3.01451552.87 2.76121554.41 2.66711554.78 2.66891556.1 2.67261557.79 2.66571557.895 2.73441558.91 2.74281560.64 2.73421561.925 2.69611563.27 2.67551566.16 2.68341567.385 2.68661568.875 2.69751569.625 2.6611572.06 2.66781576.075 2.74631576.7 2.67941577.08 2.67051578.7 2.76081580.35 2.42171581.92 2.5921582.3 2.42061585.28 2.77491585.8 2.71281587.2 2.61621587.93 2.661590.15 2.70811591.16 2.6862
Proc. IODP | Volume 319 13

P.B. Flemings et al. Data report: particle size analysis of sediments
Table T3. Nomenclature.
Name Definition Unit
D Particle diameter cmg Gravitational force cm/s2
Gs Specific gravity of sediment dimensionlessL Distance the particle falls cmm Reading number dimensionlessMD Dry solid mass of hydrometer specimen gNm Percent-finer material at reading m %V Volume of suspension mm3
Rm Hydrometer reading in suspension at time (t), and temperature, (T) dimensionlessRw,m Hydrometer reading in water with dispersant at the same temperature as for Rm dimensionlesst Time for particle to fall sµ Viscosity of water g/(cm·s)ρw Water density g/cm3
Proc. IODP | Volume 319 14