data sets and population synthesis -...
TRANSCRIPT
Mem. S.A.It. Vol. 77, 1136c© SAIt 2006 Memorie della
Data sets and population synthesis
A.C. Robin
CNRS-UMR6091 Observatoire de Besancon, BP1615, F-25010 Besancon cedex, Francee-mail: [email protected]
Abstract. The availability of new wide field survey opens the era of emphasizing ourknowledge of large scale structure and evolution of the Galaxy. We describe the populationsynthesis approach used at Besancon Observatory which has led to a consistent descriptionof the Galaxy, the way the model is constrained both by theoretical approach and by largescale surveys, from photometry, as well as from kinematics. We show recent progresses onlarge scale structure of dust in the galactic plane, and on the bulge structure linked withmicrolensing experiments.
Key words. Galaxy: stellar content – Galaxy: evolution – stellar populations
1. Introduction
Constraints on Galactic structure and evolu-tion come from a wide variety of data sets,multi-wavelength photometry, kinematics, mi-crolensing events, among others. Scenariosof Galaxy formation and evolution are in-ferred from these constraints. A ultimate testof these scenarios can be done by using theseconstraints piece by piece in order to builta population synthesis model which predic-tions can be directly compared with observa-tions. This synthetic approach insures that bi-ases have been correctly taken into accountand that the scenario is compatible with thatmany kind of constraints. In the last yearswide surveys have been obtained from opticaland near-infrared photometry thanks to widemosaic camera of CCDs, from spectroscopy,helped from the availability of dedicated tele-scopes and multi-object spectrometers, fromthe ground and from space. Astrometric accu-racy has also been largely improved and cata-
Send offprint requests to: A.C. Robin
logues with accurate proper motions are alsoavailable, well calibrated by Hipparcos andTycho data. The homogeneity of these data setsis a great help for avoiding systematic bias andbad links from a set to the other, which havecreated troubles in data interpretation in thepast. All these data sets benefit to Galactic evo-lution studies and provide constraints on thepopulation synthesis approach. Here we reporton the development of the Besancon Galaxymodel based on this synthesis approach. Weoverview the basic scheme and inputs (sect. 2)and we describe new results obtained by anal-ysis of large data sets like DENIS and 2MASSsurveys, as well as predictions for microlensingoptical depth (sect. 3). We conclude on futuredevelopments in sect. 4.
2. Besancon Galaxy Model overallscheme
The population synthesis approach aims at as-sembling current scenarios of galaxy forma-tion and evolution, theories of stellar forma-

Robin: Data sets as Constraints on Population synthesis 1137
tion and evolution, models of stellar atmo-spheres and dynamical constraints, in order tomake a consistent picture explaining currentlyavailable observations of different types (pho-tometry, astrometry, spectroscopy) at differ-ent wavelengths. The validity of any Galacticmodel is always questionable, as it describesa smooth Galaxy, while inhomogeneities exist,either in the disc or the halo. The issue is notto make a perfect model that reproduces theknown Galaxy at any scale. Rather one aims toproduce a useful tool to compute the probablestellar content of large data sets and thereforeto test the usefulness of such data to answera given question in relation to Galactic struc-ture and evolution. Modelling is also an effec-tive way to test alternative scenarios of galaxyformation and evolution.
The originality of the Besancon model,as compared to a few other population syn-thesis models presently available for theGalaxy, is the dynamical self-consistency. TheBoltzmann equation allows the scale heightof an isothermal and relaxed population to beconstrained by its velocity dispersion and theGalactic potential. The use of this dynamicalconstraint avoids a set of free parameters quitedifficult to determine: the scale height of thethin disc at different ages. It gives the model animproved physical credibility.
The main scheme of the model is to re-produce the stellar content of the Galaxy, us-ing some physical assumptions and a scenarioof formation and evolution. We essentially as-sume that stars belong to four main popula-tions: the thin disc, the thick disc, the stellarhalo (or spheroid), and the outer bulge. Themodeling of each population is based on a setof evolutionary tracks, assumptions on densitydistributions, constrained either by dynamicalconsiderations or by empirical data, and guidedby a scenario of formation and evolution.
In Bienayme et al. (1987a,b) we haveshown for the first time an evolutionary modelof the Galaxy where the dynamical self-consistency was taken into account to constrainthe disc scale height and the local dark mat-ter. Then Haywood et al. (1997) used improvedevolutionary tracks and remote star counts toconstrain the initial mass function (IMF) and
star formation rate (SFR) of the disc popu-lation. The thick disc formation scenario hasbeen studied using photometric and astromet-ric star counts in many directions, which alsoprovided its velocity ellipsoid, local density,scale height, and mean metallicity. These phys-ical constraints led to a demonstration thatthe probable origin of the thick disc is anaccretion event at early ages of the Galaxy(Robin et al. 1996). Improved constraints onthe spheroid (Robin et al. 2000) and the thickdisc populations (Reyle & Robin 2001a) havealso been obtained my comparing model sim-ulations with a wide set of photometric datain different directions. The bulge populationshas been studied extensively from analysis ofnear-infrared survey data, leading to constrainson its bar shape and the age of the population(Picaud & Robin 2004).
The Galactic model has been developed toreturn results in the near-infrared and visiblefilters, but has also been extended to predict thestellar content in the X-ray domain (Guillout etal. (1996)). More recently, the Hipparcos mis-sion and large scale surveys in the optical andthe near-infrared have led to new physical con-straints improving our knowledge of the over-all structure and evolution of the Galaxy. Thesenew constraints are now included in the presentversion of the model described in Robin et al.(2003).
3. New results on disc and bulgelarge scale structure from largedata sets analysis
Once the dynamical and stellar evolution con-straints have led to a well defined distributionsof stars near the sun and at high and mediumlatitude, interest have been put forward to theGalactic disc which contains most of the massinto stars of the Galaxy. The thin disc containsseveral know features which have however notbeen quantified enough due to the position ofthe sun in the Galactic plane and the highdust absorption at optical wavelength: the spi-ral structure, disc scale length, warp and flareare not known with sufficient accuracy fromsimple analysis of photometric data. Distancesof the stars have uncertainties large enough that
1138 Robin: Data sets as Constraints on Population synthesis
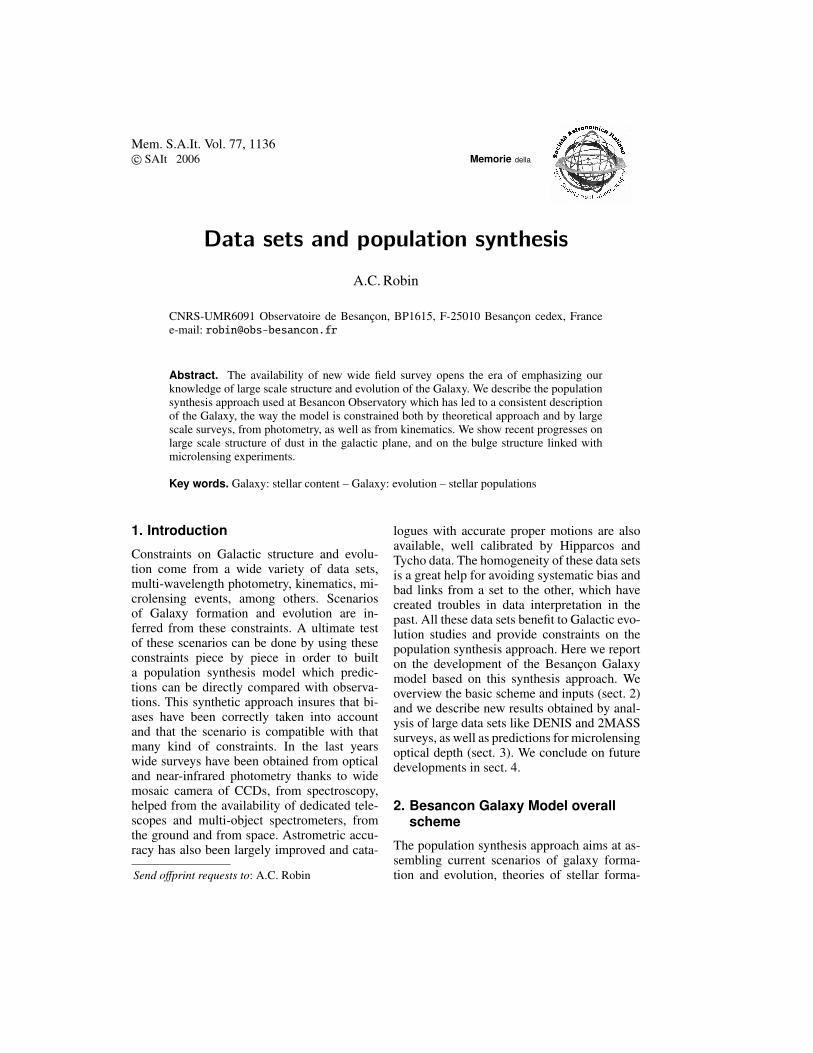
Fig. 1. Local extinction at different heliocentric distances. The uppermost image is at 1 kpc, the bottomone is at 8 kpc. The x axis is in Galactic longitude, the y axis in Galactic latitude. The warp is well visiblein the last rows. The solid line indicates the warped mid-plane as used in the Galaxy model and is not a fitto these data.

Robin: Data sets as Constraints on Population synthesis 1139
Fig. 2. Top: Total extinction integrated along the line of sight to 10 kpc. Bottom: CO velocityintegrated spatial map by Dame et al. (2001). The units of the two maps are different; they areput here to compare their respective interpretation of the large scale structure of the Galaxy. Thecoordinates are expressed in degrees (l, b).
even the spiral structure is uncertain, being ei-ther 2-arm or 4-arm or even a mixing of bothdepending on the radius. The warp has beendetected in stars only recently while it was de-tected in HI for several decades. The flare instars is still subject to debate, as well as a pos-sible hole in the center of the inner disc.
3.1. Dust extinction 3D distribution
The first effect visible in star density distribu-tion near the Galactic plane is due to the dust,even at near-infrared wavelength. Extinction isso clumpy that it drives the number of starsmore than any other large scale structure in thestars. Conversely, photometry and star countscontains the information about the dust extinc-tion. Marshall et al. (2006) have shown thatthe 3D extinction distribution can be inferredfrom star counts and colour distributions fromthe 2MASS survey. Using stellar colours in J-Kas extinction indicators and assuming that most
of model prediction deviations from observedcolours come from the variation of extinctionalong line of sights, they built a 3D extinctionmodel of the galactic plane (−10 < b < 10◦and −90 < l < 90) with a resolution in longi-tude and latitude of 15 arcmin and variable res-olution in distance between 100 pc to 1 kpc, de-pending on star density and dust density alongthe line of sight. Figure 1 shows the result-ing extinction distribution at different distancesfrom the sun. As expected close structures arespread over several degrees in latitude whilefarther ones are squeezed to the galactic plane,due to the projection effects.
The 3D extinction model furnishes an ac-curate description of the large scale structureof the disc of dust. It shows a scale height of98 ± 21 pc. A big hole almost free of dust isidentified around the Galactic center with a ra-dius of ∼ 3.2 ± 0.5 kpc, but it also containsan elongated feature which ressembles a dustlane with an inclination with regard to the sun-

1140 Robin: Data sets as Constraints on Population synthesis
Fig. 3. Distribution of star counts in K magnitude up to the limit of completeness of the 2MASS survey (toppanel) compared with Besancon Galaxy model prediction using 3D dust model described in the text (bottompanel). The stellar population model is completely smooth, with no spiral structure. Hence the clumpinessof the star counts in the 2MASS survey seems mainly due to the dust distribution. The simulated warp issymmetrical, while the warp in the data is not. The observed stellar warp appears stronger in the north thanin the south, as in HI (see text). The model fit correctly the northern warp but should be revised in the south.
Galactic center direction of ∼ 32◦ ± 10◦. Thisfeature may trace the dust falling into the cen-ter along the stellar bar.
A test of the reliability of the features dis-covered by this original method of determiningextinction is to compare it with other tracers ofinterstellar matter. Dame et al. (2001) have cre-ated a large scale CO survey of the entire MilkyWay, using the rotational transition 1-0 of theCO molecule at 115 GHz, from new observa-tions and existing CO surveys. Fig. 2 showsthe total extinction integrated to a distance of10 kpc from the Sun from the Marshall et al.extinction map, as well as the distribution ofCO as presented in Dame et al. (2001), wherethe two maps overlap. The resolution of the ex-tinction map is 15′x 15′; the resolution of theCO map varies from 9′to 30′, the region pre-sented here is mostly at the higher resolutionof 9′. The main structures that appear in bothmaps are indicated. The Musca Dark cloud,(l, b) = (−59,−9), that appears in the extinc-tion map is not in the Dame et al. (2001) mapas this region was not observed in their com-posite survey. The overall very good agreementof the CO emission and dust extinction feature
indicates a good correlation of these two com-ponents of the interstellar material as well asgive confidence into the 3D extinction map.
3.2. Star counts in the galactic plane
Using this 3D extinction map, detailed predic-tions of the star density and luminosity canbe produced in the Galactic plane and com-pared with observations. Figure 3 compares thestar density per square degree up to complete-ness limit from the 2MASS near-infrared sur-vey and from the Besancon Galaxy model pre-dictions using the 3D extinction map describedabove. It should be noted that the stellar pop-ulation model is completely smooth, with nospiral structure. Hence the clumpiness of thestar counts in the 2MASS survey is only due tothe dust distribution. The spiral structure is cer-tainly not a prominent structure in our Galaxy,as seen from K giants which is the dominantpopulation in this data set. This is due to thefact that K giants in the clump are mostly olderthan 1 gigayear and have lost most of the mem-ory of their birth place (see also Amores et al.(2006)).

Robin: Data sets as Constraints on Population synthesis 1141
e
Fig. 4. Comparison of I and K band maps of instantaneous microlensing event density, that is the productof the optical depth and source number density, as predicted by the Besancon Galaxy Model. The greyscalein both maps is normalised to a peak density of 20 events per square degree. Upper panel is for all sourcesbrighter than I = 19 at baseline, bottom panel is for sources brighter than K = 17 at baseline. The greyscalerange is given by the bar to the rights of each plot. Optical depth contours are also over-plotted : solid,dashed and dot-dashed indicate optical depths of 4, 2 and 1 ×10⁻⁶, respectively.
The overall structure of the model repro-duces well the 2MASS star counts, while nei-ther the scale length nor the warp have beenadjusted onto these data. However looking
carefully to this figure one can notice slightdifferences between model and data showingthat better agreement could be obtained withslightly decreased scale length (smaller than

1142 Robin: Data sets as Constraints on Population synthesis
2.5 kpc) for the stellar population, and anasymmetric warp. The warp as simulated issymmetrical, while the warp in the data is not.The observed warp is stronger in the north thanin the south. The model fits correctly the north-ern warp but should be revised in the south.In HI data, the southern warp does not go ashigh as the northern warp (Levine et al. 2006).2MASS data seem to show the same feature.A quantitative analysis will be performed us-ing 2MASS data as well as deeper data towardsthe external disc in order to better constrain thewarp shape, its kinematics and its origin.
3.3. Microlensing optical depth towardsthe Galactic bulge
Several microlensing survey teams have beenmonitoring millions of stars over a large re-gion of the Galactic bulge for more than adecade. These surveys have detected thousandsof events and the combined detection rate ofthe OGLE-III and MOA-II surveys is expectedto reach around 1000 events per year. The mi-crolensing optical depth, that is the instanta-neous number of ongoing microlensing eventsper source star, is a key measurable for thesesurveys and provides an important constrainton the bulge surface mass density. Its depen-dency upon direction provides, in principle,a unique and powerful probe of the three-dimensional geometry of the bulge stellar massdistribution.
Direct star counts and photometry also al-low to derive the bulge stellar distributionbased on the luminous population, mainly fromK and M giants. Picaud & Robin (2004) haveanalysed DENIS data towards the galacticbulge in about hundred windows in order toadjust a bulge density model on (K,J-K) starcounts. They show that the bulge ressemblesa bar, with an inclination of about 10◦ fromthe sun-Galactic centre direction, and find ahole inside the thin disc. From the Galaxymodel it is then possible to check that thesetwo different data sets (photometric cataloguesand microlensing events) are compatible witheach other, given the uncertainties. Kerins et al.(2006) have computed the expected opticaldepth from the Besancon model in the bulge
region. Figure 4 shows I and K band maps ofinstantaneous microlensing event density, thatis the product of the optical depth and sourcenumber density, as predicted by the BesanconGalaxy Model. The map in I band is producedby sources having I < 19 at baseline and canbe compared with events data sets. The highresolution of this map show how the opticaldepth varies from line of sight to line of sightdue to extinction. The map in K band is pro-duced by sources having K < 17 at baseline. Itshows that surveys in the K band are much lessaffected by dust and would provide a substan-tial sensitivity increase over current I-band sur-veys and would reveal a significant microlens-ing signature towards the far side of the bar.
4. Conclusions
The population synthesis approach has beenshown to be very useful for analysis of largedata sets, like visible and near-infrared photo-metric surveys. The same approach can be usedon other types of data sets, like microlensingoptical depth maps, all-sky proper motions andradial velocity surveys like UCAC2, RAVE ex-periment, or deep surveys on restricted areaslike Cosmos, CFHT-Legacy Surveys, GOODS,among others. These data sets must be com-bined in order to have combined informationabout stellar evolution stage, kinematics andmetallicity. It allows to confirm global scenarioof formation and evolution of the Galaxy, in-cluding kinematics, dynamical constraints andchemical evolution constraints. The main prob-lem is still due to the large amount of data tomanage. An accurate and efficient method ofdata fitting must be involved which would re-quire anyhow large amount of computing time.
References
Amores E.B., Robin, A.C., 2006, This confer-ence.
Bienayme, O., Robin, A. C., & Creze, M.1987a, A&A, 180, 94
Bienayme, O., Robin, A. C., & Creze, M.1987b, A&A, 186, 359

Robin: Data sets as Constraints on Population synthesis 1143
Cutri, R. M., Skrutskie, M.F., van Dyk, S. etal., 2003, Explanatory Supplement to the2MASS All Sky Data Release
Dame, T. M., Hartmann, D. & Thaddeus,P.,2001 ApJ, 547, 792
Drimmel, R., Cabrera-Lavers, A., & Lopez-Corredoira, M. 2003, A&A, 409, 205
Epchtein, N. et al. 1997, The Messenger, 87,27
Guillout, P., Haywood, M., Motch, C., &Robin, A. C. 1996, A&A, 316, 89
Haywood, M., Robin, A. C., & Creze, M. 1997,A&A, 320, 440
Kerins, E., Robin, A.C., et al., 2006, in prepa-ration
Levine, E.S, Blitz, L., Heiles, C., 2006, ApJ inpress
Marshall, D.J., Robin, A.C., Reyle, C.,Schultheis, M., Picaud, S. 2006, A&A 453,635
Picaud, S., & Robin, A. C. 2004, A&A, 428,891
Reyle, C. & Robin, A. C. 2001a, A&A, 373,886
Robin, A. C., Haywood, M., Creze, M., Ojha,D. K., & Bienayme, O. 1996, A&A, 305,125
Robin, A.C., Reyle, C., Creze, M. 2000, A&A359, 103
Robin, A.C., Reyle, C., Derriere, S., & PicaudS. 2003, A&A, 409, 523. Erratum 2004,A&A, 416, 157