data smart
TRANSCRIPT


Data Smart
John W. Foreman
Using Data Science to Transform Information into Insight

Data Smart: Using Data Science to Transform Information into Insight
Published byJohn Wiley & Sons, Inc.
10475 Crosspoint BoulevardIndianapolis, IN 46256www.wiley.com
Copyright © 2014 by John Wiley & Sons, Inc., Indianapolis, Indiana
Published simultaneously in Canada
ISBN: 978-1-118-66146-8ISBN: 978-1-118-66148-2 (ebk)ISBN: 978-1-118-83986-7 (ebk)
Manufactured in the United States of America
10 9 8 7 6 5 4 3 2 1
No part of this publication may be reproduced, stored in a retrieval system or transmitted in any form or by any means, electronic, mechanical, photocopying, recording, scanning or otherwise, except as permit-ted under Sections 107 or 108 of the 1976 United States Copyright Act, without either the prior written permission of the Publisher, or authorization through payment of the appropriate per-copy fee to the Copyright Clearance Center, 222 Rosewood Drive, Danvers, MA 01923, (978) 750-8400, fax (978) 646-8600. Requests to the Publisher for permission should be addressed to the Permissions Department, John Wiley & Sons, Inc., 111 River Street, Hoboken, NJ 07030, (201) 748-6011, fax (201) 748-6008, or online at http://www.wiley.com/go/permissions.
Limit of Liability/Disclaimer of Warranty: The publisher and the author make no representations or war-ranties with respect to the accuracy or completeness of the contents of this work and specifi cally disclaim all warranties, including without limitation warranties of fi tness for a particular purpose. No warranty may be created or extended by sales or promotional materials. The advice and strategies contained herein may not be suitable for every situation. This work is sold with the understanding that the publisher is not engaged in rendering legal, accounting, or other professional services. If professional assistance is required, the services of a competent professional person should be sought. Neither the publisher nor the author shall be liable for damages arising herefrom. The fact that an organization or Web site is referred to in this work as a citation and/or a potential source of further information does not mean that the author or the publisher endorses the information the organization or website may provide or recommendations it may make. Further, readers should be aware that Internet websites listed in this work may have changed or disappeared between when this work was written and when it is read.
For general information on our other products and services please contact our Customer Care Department within the United States at (877) 762-2974, outside the United States at (317) 572-3993 or fax (317) 572-4002.
Wiley publishes in a variety of print and electronic formats and by print-on-demand. Some material included with standard print versions of this book may not be included in e-books or in print-on-demand. If this book refers to media such as a CD or DVD that is not included in the version you purchased, you may download this material at http://booksupport.wiley.com. For more information about Wiley products, visit www.wiley.com.
Library of Congress Control Number: 2013946768
Trademarks: Wiley and the Wiley logo are trademarks or registered trademarks of John Wiley & Sons, Inc. and/or its affi liates, in the United States and other countries, and may not be used without written permission. All other trademarks are the property of their respective owners. John Wiley & Sons, Inc. is not associated with any product or vendor mentioned in this book.

To my wife, Lydia. What you do each day is impossibly rad. If it weren’t for you,
I’d have lost my hair (and my mind) eons ago.

Executive Editor
Carol Long
Senior Project Editor
Kevin Kent
Technical Editors
Greg Jennings
Evan Miller
Production Editor
Christine Mugnolo
Copy Editor
Kezia Endsley
Editorial Manager
Mary Beth Wakefi eld
Freelancer Editorial Manager
Rosemarie Graham
Associate Director of Marketing
David Mayhew
Marketing Manager
Ashley Zurcher
Business Manager
Amy Knies
Vice President and Executive Group
Publisher
Richard Swadley
Associate Publisher
Jim Minatel
Project Coordinator, Cover
Katie Crocker
Proofreader
Nancy Carrasco
Indexer
Johnna van Hoose Dinse
Cover Image
Courtesy of John W. Foreman
Cover Designer
Ryan Sneed
Credits

John W. Foreman is the Chief Data Scientist for MailChimp.com. He’s also a
recovering management consultant who’s done a lot of analytics work for large
businesses (Coca-Cola, Royal Caribbean, Intercontinental Hotels) and the gov-
ernment (DoD, IRS, DHS, FBI). John can often be found speaking about the trials
and travails of implementing analytic solutions in business—check John-Foreman
.com to see if he’s headed to your town.
When he’s not playing with data, John spends his time hiking, watching copious
amounts of television, eating all sorts of terrible food, and raising three smelly boys.
About the Author
Greg Jennings is a data scientist, software engineer, and co-founder of ApexVis. After
completing a master’s degree in materials science from the University of Virginia, he
began his career with the Analytics group of Booz Allen Hamilton, where he grew
a team providing predictive analytics and data visualization solutions for planning
and scheduling problems.
After leaving Booz Allen Hamilton, Greg cofounded his fi rst startup, Decision
Forge, where he served as CTO and helped develop a web-based data mining plat-
form for a government client. He also worked with a major media organization to
develop an educational product that assists teachers in accessing targeted content for
their students, and with a McLean-based startup to help develop audience modeling
applications to optimize web advertising campaigns.
After leaving Decision Forge, he cofounded his current business ApexVis, focused
on helping enterprises get maximum value from their data through custom data
visualization and analytical software solutions. He lives in Alexandria, Virginia,
with his wife and two daughters.
Evan Miller received his bachelor’s degree in physics from Williams College in
2006 and is currently a PhD student in economics at the University of Chicago.
His research interests include specifi cation testing and computational methods in
econometrics. Evan is also the author of Wizard, a popular Mac program for per-
forming statistical analysis, and blogs about statistics problems and experiment
design at http://www.evanmiller.org.
About the Technical Editors

This book started after an improbable number of folks checked out my analytics
blog, Analytics Made Skeezy. So I’d like to thank those readers as well as my
data science Twitter pals who’ve been so supportive. And thanks to Aarron Walter,
Chris Mills, and Jon Duckett for passing the idea for this book on to Wiley based
on my blog’s silly premise.
I’d also like to thank the crew at MailChimp for making this happen. Without
the supportive and adventurous culture fostered at MailChimp, I’d not have felt
confi dent enough to do something so stupid as to write a technical book while
working a job and raising three boys. Specifi cally, I couldn’t have done it without
the daily assistance of Neil Bainton and Michelle Riggin-Ransom. Also, I’m indebted
to Ron Lewis, Josh Rosenbaum, and Jason Travis for their work on the cover and
marketing video for the book.
Thanks to Carol Long at Wiley for taking a chance on me and to all the editors
for their expertise and hard work. Big thanks to Greg Jennings for working all the
spreadsheets!
Many thanks to my parents for reading my sci-fi novel and not telling me to quit
writing.
Acknowledgments

Contents
Introduction . . . . . . . . . . . . . . . . . . . . . . . . . . . . . . . . . . . . . . . . . . . . . . . . . . . . . . . . . . . . . . . . . . xiii
1 Everything You Ever Needed to Know about Spreadsheets but Were Too Afraid to Ask . . . . . . . . . . . . . . . . . . . . . . . . . . . . . . . . . . . . . . . . . . . . . . . . . . . . . . . . . . . 1
Some Sample Data . . . . . . . . . . . . . . . . . . . . . . . . . . . . . . . . . . . . . . . . . . . . . . . . . . . . . . . . . . . . . . . . . . . .2
Moving Quickly with the Control Button . . . . . . . . . . . . . . . . . . . . . . . . . . . . . . . . . . . . . . . . . . . . . . .2
Copying Formulas and Data Quickly . . . . . . . . . . . . . . . . . . . . . . . . . . . . . . . . . . . . . . . . . . . . . . . . . . . .4
Formatting Cells . . . . . . . . . . . . . . . . . . . . . . . . . . . . . . . . . . . . . . . . . . . . . . . . . . . . . . . . . . . . . . . . . . . . . .5
Paste Special Values . . . . . . . . . . . . . . . . . . . . . . . . . . . . . . . . . . . . . . . . . . . . . . . . . . . . . . . . . . . . . . . . . . .7
Inserting Charts . . . . . . . . . . . . . . . . . . . . . . . . . . . . . . . . . . . . . . . . . . . . . . . . . . . . . . . . . . . . . . . . . . . . . . .8
Locating the Find and Replace Menus . . . . . . . . . . . . . . . . . . . . . . . . . . . . . . . . . . . . . . . . . . . . . . . . . .9
Formulas for Locating and Pulling Values . . . . . . . . . . . . . . . . . . . . . . . . . . . . . . . . . . . . . . . . . . . . . .10
Using VLOOKUP to Merge Data . . . . . . . . . . . . . . . . . . . . . . . . . . . . . . . . . . . . . . . . . . . . . . . . . . . . . . . 12
Filtering and Sorting . . . . . . . . . . . . . . . . . . . . . . . . . . . . . . . . . . . . . . . . . . . . . . . . . . . . . . . . . . . . . . . . . . 13
Using PivotTables . . . . . . . . . . . . . . . . . . . . . . . . . . . . . . . . . . . . . . . . . . . . . . . . . . . . . . . . . . . . . . . . . . . . 16
Using Array Formulas . . . . . . . . . . . . . . . . . . . . . . . . . . . . . . . . . . . . . . . . . . . . . . . . . . . . . . . . . . . . . . . . . 19
Solving Stuff with Solver . . . . . . . . . . . . . . . . . . . . . . . . . . . . . . . . . . . . . . . . . . . . . . . . . . . . . . . . . . . . 20
OpenSolver: I Wish We Didn’t Need This, but We Do . . . . . . . . . . . . . . . . . . . . . . . . . . . . . . . . . . 26
Wrapping Up . . . . . . . . . . . . . . . . . . . . . . . . . . . . . . . . . . . . . . . . . . . . . . . . . . . . . . . . . . . . . . . . . . . . . . . .27
2 Cluster Analysis Part I: Using K-Means to Segment Your Customer Base . . . . . . . . 29Girls Dance with Girls, Boys Scratch Their Elbows . . . . . . . . . . . . . . . . . . . . . . . . . . . . . . . . . . . . . 30
Getting Real: K-Means Clustering Subscribers in E-mail Marketing . . . . . . . . . . . . . . . . . . . . . . .35
Joey Bag O’ Donuts Wholesale Wine Emporium . . . . . . . . . . . . . . . . . . . . . . . . . . . . . . . . . . .36
The Initial Dataset . . . . . . . . . . . . . . . . . . . . . . . . . . . . . . . . . . . . . . . . . . . . . . . . . . . . . . . . . . . . . . .36
Determining What to Measure . . . . . . . . . . . . . . . . . . . . . . . . . . . . . . . . . . . . . . . . . . . . . . . . . . .38
Start with Four Clusters . . . . . . . . . . . . . . . . . . . . . . . . . . . . . . . . . . . . . . . . . . . . . . . . . . . . . . . . . . 41
Euclidean Distance: Measuring Distances as the Crow Flies . . . . . . . . . . . . . . . . . . . . . . . . . 41
Distances and Cluster Assignments for Everybody! . . . . . . . . . . . . . . . . . . . . . . . . . . . . . . . . 44
Solving for the Cluster Centers . . . . . . . . . . . . . . . . . . . . . . . . . . . . . . . . . . . . . . . . . . . . . . . . . . 46
Making Sense of the Results . . . . . . . . . . . . . . . . . . . . . . . . . . . . . . . . . . . . . . . . . . . . . . . . . . . . . 49

Contents viii
Getting the Top Deals by Cluster . . . . . . . . . . . . . . . . . . . . . . . . . . . . . . . . . . . . . . . . . . . . . . . . 50
The Silhouette: A Good Way to Let Different K Values Duke It Out . . . . . . . . . . . . . . . . . . . . . . . . . . . . . . . . . . . . . . . . . . . . . . . . . . . . . . . . . . . . . . . . . . . . .53
How about Five Clusters? . . . . . . . . . . . . . . . . . . . . . . . . . . . . . . . . . . . . . . . . . . . . . . . . . . . . . . . 60
Solving for Five Clusters . . . . . . . . . . . . . . . . . . . . . . . . . . . . . . . . . . . . . . . . . . . . . . . . . . . . . . . . . 60
Getting the Top Deals for All Five Clusters . . . . . . . . . . . . . . . . . . . . . . . . . . . . . . . . . . . . . . . . 61
Computing the Silhouette for 5-Means Clustering . . . . . . . . . . . . . . . . . . . . . . . . . . . . . . . . 64
K-Medians Clustering and Asymmetric Distance Measurements . . . . . . . . . . . . . . . . . . . . . . . . 66
Using K-Medians Clustering . . . . . . . . . . . . . . . . . . . . . . . . . . . . . . . . . . . . . . . . . . . . . . . . . . . . . 66
Getting a More Appropriate Distance Metric . . . . . . . . . . . . . . . . . . . . . . . . . . . . . . . . . . . . . .67
Putting It All in Excel . . . . . . . . . . . . . . . . . . . . . . . . . . . . . . . . . . . . . . . . . . . . . . . . . . . . . . . . . . . . 69
The Top Deals for the 5-Medians Clusters . . . . . . . . . . . . . . . . . . . . . . . . . . . . . . . . . . . . . . . . 70
Wrapping Up . . . . . . . . . . . . . . . . . . . . . . . . . . . . . . . . . . . . . . . . . . . . . . . . . . . . . . . . . . . . . . . . . . . . . . . .75
3 Naïve Bayes and the Incredible Lightness of Being an Idiot . . . . . . . . . . . . . . . . . . . . 77When You Name a Product Mandrill, You’re Going to Get Some Signal and Some Noise . . . . . . . . . . . . . . . . . . . . . . . . . . . . . . . . . . . . . . . . . . . . . . . . . . . . . . . . . . . . . . . . . . . . . . . . .77
The World’s Fastest Intro to Probability Theory . . . . . . . . . . . . . . . . . . . . . . . . . . . . . . . . . . . . . . . .79
Totaling Conditional Probabilities . . . . . . . . . . . . . . . . . . . . . . . . . . . . . . . . . . . . . . . . . . . . . . . . 80
Joint Probability, the Chain Rule, and Independence . . . . . . . . . . . . . . . . . . . . . . . . . . . . . . 80
What Happens in a Dependent Situation? . . . . . . . . . . . . . . . . . . . . . . . . . . . . . . . . . . . . . . . . . 81
Bayes Rule . . . . . . . . . . . . . . . . . . . . . . . . . . . . . . . . . . . . . . . . . . . . . . . . . . . . . . . . . . . . . . . . . . . . . 82
Using Bayes Rule to Create an AI Model . . . . . . . . . . . . . . . . . . . . . . . . . . . . . . . . . . . . . . . . . . . . . . .83
High-Level Class Probabilities Are Often Assumed to Be Equal . . . . . . . . . . . . . . . . . . . . . 84
A Couple More Odds and Ends . . . . . . . . . . . . . . . . . . . . . . . . . . . . . . . . . . . . . . . . . . . . . . . . . . .85
Let’s Get This Excel Party Started . . . . . . . . . . . . . . . . . . . . . . . . . . . . . . . . . . . . . . . . . . . . . . . . . . . . .87
Removing Extraneous Punctuation . . . . . . . . . . . . . . . . . . . . . . . . . . . . . . . . . . . . . . . . . . . . . . . .87
Splitting on Spaces . . . . . . . . . . . . . . . . . . . . . . . . . . . . . . . . . . . . . . . . . . . . . . . . . . . . . . . . . . . . . 88
Counting Tokens and Calculating Probabilities . . . . . . . . . . . . . . . . . . . . . . . . . . . . . . . . . . . . 92
And We Have a Model! Let’s Use It. . . . . . . . . . . . . . . . . . . . . . . . . . . . . . . . . . . . . . . . . . . . . . . 94
Wrapping Up . . . . . . . . . . . . . . . . . . . . . . . . . . . . . . . . . . . . . . . . . . . . . . . . . . . . . . . . . . . . . . . . . . . . . . . 98
4 Optimization Modeling: Because That “Fresh Squeezed” Orange Juice Ain’t Gonna Blend Itself . . . . . . . . . . . . . . . . . . . . . . . . . . . . . . . . . . . . . . . . . . . . . . . . . . . . 101
Why Should Data Scientists Know Optimization? . . . . . . . . . . . . . . . . . . . . . . . . . . . . . . . . . . . . .102
Contents ix
Starting with a Simple Trade-Off . . . . . . . . . . . . . . . . . . . . . . . . . . . . . . . . . . . . . . . . . . . . . . . . . . . . .103
Representing the Problem as a Polytope . . . . . . . . . . . . . . . . . . . . . . . . . . . . . . . . . . . . . . . . .103
Solving by Sliding the Level Set . . . . . . . . . . . . . . . . . . . . . . . . . . . . . . . . . . . . . . . . . . . . . . . . . .105
The Simplex Method: Rooting around the Corners . . . . . . . . . . . . . . . . . . . . . . . . . . . . . . . 106
Working in Excel . . . . . . . . . . . . . . . . . . . . . . . . . . . . . . . . . . . . . . . . . . . . . . . . . . . . . . . . . . . . . . . 108
There’s a Monster at the End of This Chapter . . . . . . . . . . . . . . . . . . . . . . . . . . . . . . . . . . . . . 117
Fresh from the Grove to Your Glass...with a Pit Stop Through a Blending Model . . . . . . . . . 118
You Use a Blending Model . . . . . . . . . . . . . . . . . . . . . . . . . . . . . . . . . . . . . . . . . . . . . . . . . . . . . . 119
Let’s Start with Some Specs . . . . . . . . . . . . . . . . . . . . . . . . . . . . . . . . . . . . . . . . . . . . . . . . . . . . . 119
Coming Back to Consistency . . . . . . . . . . . . . . . . . . . . . . . . . . . . . . . . . . . . . . . . . . . . . . . . . . . . 121
Putting the Data into Excel . . . . . . . . . . . . . . . . . . . . . . . . . . . . . . . . . . . . . . . . . . . . . . . . . . . . . . 121
Setting Up the Problem in Solver . . . . . . . . . . . . . . . . . . . . . . . . . . . . . . . . . . . . . . . . . . . . . . . . 124
Lowering Your Standards . . . . . . . . . . . . . . . . . . . . . . . . . . . . . . . . . . . . . . . . . . . . . . . . . . . . . . . . 126
Dead Squirrel Removal: The Minimax Formulation . . . . . . . . . . . . . . . . . . . . . . . . . . . . . . . . 131
If-Then and the “Big M” Constraint . . . . . . . . . . . . . . . . . . . . . . . . . . . . . . . . . . . . . . . . . . . . . . . 133
Multiplying Variables: Cranking Up the Volume to 11 . . . . . . . . . . . . . . . . . . . . . . . . . . . . . . 137
Modeling Risk . . . . . . . . . . . . . . . . . . . . . . . . . . . . . . . . . . . . . . . . . . . . . . . . . . . . . . . . . . . . . . . . . . . . . .144
Normally Distributed Data . . . . . . . . . . . . . . . . . . . . . . . . . . . . . . . . . . . . . . . . . . . . . . . . . . . . . . 145
Wrapping Up . . . . . . . . . . . . . . . . . . . . . . . . . . . . . . . . . . . . . . . . . . . . . . . . . . . . . . . . . . . . . . . . . . . . . . . 154
5 Cluster Analysis Part II: Network Graphs and Community Detection . . . . . . . . . . .155What Is a Network Graph? . . . . . . . . . . . . . . . . . . . . . . . . . . . . . . . . . . . . . . . . . . . . . . . . . . . . . . . . . . . 156
Visualizing a Simple Graph . . . . . . . . . . . . . . . . . . . . . . . . . . . . . . . . . . . . . . . . . . . . . . . . . . . . . . . . . . . 157
Brief Introduction to Gephi . . . . . . . . . . . . . . . . . . . . . . . . . . . . . . . . . . . . . . . . . . . . . . . . . . . . . . . . . . 159
Gephi Installation and File Preparation . . . . . . . . . . . . . . . . . . . . . . . . . . . . . . . . . . . . . . . . . . 160
Laying Out the Graph . . . . . . . . . . . . . . . . . . . . . . . . . . . . . . . . . . . . . . . . . . . . . . . . . . . . . . . . . . . 162
Node Degree . . . . . . . . . . . . . . . . . . . . . . . . . . . . . . . . . . . . . . . . . . . . . . . . . . . . . . . . . . . . . . . . . . . 165
Pretty Printing . . . . . . . . . . . . . . . . . . . . . . . . . . . . . . . . . . . . . . . . . . . . . . . . . . . . . . . . . . . . . . . . . .166
Touching the Graph Data . . . . . . . . . . . . . . . . . . . . . . . . . . . . . . . . . . . . . . . . . . . . . . . . . . . . . . . .168
Building a Graph from the Wholesale Wine Data . . . . . . . . . . . . . . . . . . . . . . . . . . . . . . . . . . . . . .170
Creating a Cosine Similarity Matrix . . . . . . . . . . . . . . . . . . . . . . . . . . . . . . . . . . . . . . . . . . . . . . 172
Producing an r-Neighborhood Graph . . . . . . . . . . . . . . . . . . . . . . . . . . . . . . . . . . . . . . . . . . . . 174
How Much Is an Edge Worth? Points and Penalties in Graph Modularity . . . . . . . . . . . . . . . . 178

Contents x
What’s a Point and What’s a Penalty? . . . . . . . . . . . . . . . . . . . . . . . . . . . . . . . . . . . . . . . . . . . . . 179
Setting Up the Score Sheet . . . . . . . . . . . . . . . . . . . . . . . . . . . . . . . . . . . . . . . . . . . . . . . . . . . . . 183
Let’s Get Clustering! . . . . . . . . . . . . . . . . . . . . . . . . . . . . . . . . . . . . . . . . . . . . . . . . . . . . . . . . . . . . . . . . . 185
Split Number 1 . . . . . . . . . . . . . . . . . . . . . . . . . . . . . . . . . . . . . . . . . . . . . . . . . . . . . . . . . . . . . . . . . 185
Split 2: Electric Boogaloo . . . . . . . . . . . . . . . . . . . . . . . . . . . . . . . . . . . . . . . . . . . . . . . . . . . . . . . 190
And…Split 3: Split with a Vengeance . . . . . . . . . . . . . . . . . . . . . . . . . . . . . . . . . . . . . . . . . . . . . .192
Encoding and Analyzing the Communities . . . . . . . . . . . . . . . . . . . . . . . . . . . . . . . . . . . . . . . . 193
There and Back Again: A Gephi Tale . . . . . . . . . . . . . . . . . . . . . . . . . . . . . . . . . . . . . . . . . . . . . . . . . . 197
Wrapping Up . . . . . . . . . . . . . . . . . . . . . . . . . . . . . . . . . . . . . . . . . . . . . . . . . . . . . . . . . . . . . . . . . . . . . . 202
6 The Granddaddy of Supervised Artifi cial Intelligence—Regression . . . . . . . . . . . . 205Wait, What? You’re Pregnant? . . . . . . . . . . . . . . . . . . . . . . . . . . . . . . . . . . . . . . . . . . . . . . . . . . . . . . . 205
Don’t Kid Yourself . . . . . . . . . . . . . . . . . . . . . . . . . . . . . . . . . . . . . . . . . . . . . . . . . . . . . . . . . . . . . . . . . . 206
Predicting Pregnant Customers at RetailMart Using Linear Regression . . . . . . . . . . . . . . . . . 207
The Feature Set. . . . . . . . . . . . . . . . . . . . . . . . . . . . . . . . . . . . . . . . . . . . . . . . . . . . . . . . . . . . . . . . 207
Assembling the Training Data . . . . . . . . . . . . . . . . . . . . . . . . . . . . . . . . . . . . . . . . . . . . . . . . . . . 209
Creating Dummy Variables . . . . . . . . . . . . . . . . . . . . . . . . . . . . . . . . . . . . . . . . . . . . . . . . . . . . . .210
Let’s Bake Our Own Linear Regression . . . . . . . . . . . . . . . . . . . . . . . . . . . . . . . . . . . . . . . . . . . 213
Linear Regression Statistics: R-Squared, F Tests, t Tests . . . . . . . . . . . . . . . . . . . . . . . . . . . .221
Making Predictions on Some New Data and Measuring Performance . . . . . . . . . . . . . . 230
Predicting Pregnant Customers at RetailMart Using Logistic Regression . . . . . . . . . . . . . . . . 239
First You Need a Link Function . . . . . . . . . . . . . . . . . . . . . . . . . . . . . . . . . . . . . . . . . . . . . . . . . 240
Hooking Up the Logistic Function and Reoptimizing . . . . . . . . . . . . . . . . . . . . . . . . . . . . . . 241
Baking an Actual Logistic Regression . . . . . . . . . . . . . . . . . . . . . . . . . . . . . . . . . . . . . . . . . . . . 244
Model Selection—Comparing the Performance of the Linear and Logistic Regressions . . . . . . . . . . . . . . . . . . . . . . . . . . . . . . . . . . . . . . . . . . . . . . . . . . . . . . . .245
For More Information . . . . . . . . . . . . . . . . . . . . . . . . . . . . . . . . . . . . . . . . . . . . . . . . . . . . . . . . . . . . . . 248
Wrapping Up . . . . . . . . . . . . . . . . . . . . . . . . . . . . . . . . . . . . . . . . . . . . . . . . . . . . . . . . . . . . . . . . . . . . . . 249
7 Ensemble Models: A Whole Lot of Bad Pizza . . . . . . . . . . . . . . . . . . . . . . . . . . . . . . . . .251Using the Data from Chapter 6 . . . . . . . . . . . . . . . . . . . . . . . . . . . . . . . . . . . . . . . . . . . . . . . . . . . . . . .252
Bagging: Randomize, Train, Repeat . . . . . . . . . . . . . . . . . . . . . . . . . . . . . . . . . . . . . . . . . . . . . . . . . . 254
Decision Stump Is an Unsexy Term for a Stupid Predictor . . . . . . . . . . . . . . . . . . . . . . . . 254
Doesn’t Seem So Stupid to Me! . . . . . . . . . . . . . . . . . . . . . . . . . . . . . . . . . . . . . . . . . . . . . . . . . .255
You Need More Power! . . . . . . . . . . . . . . . . . . . . . . . . . . . . . . . . . . . . . . . . . . . . . . . . . . . . . . . . .257

Contents xi
Let’s Train It . . . . . . . . . . . . . . . . . . . . . . . . . . . . . . . . . . . . . . . . . . . . . . . . . . . . . . . . . . . . . . . . . . . 258
Evaluating the Bagged Model . . . . . . . . . . . . . . . . . . . . . . . . . . . . . . . . . . . . . . . . . . . . . . . . . . . 267
Boosting: If You Get It Wrong, Just Boost and Try Again . . . . . . . . . . . . . . . . . . . . . . . . . . . . . . . . . . . . . . . . . . . . . . . . . . . . . . . . . . . . . . . . . . . . . . . . . . 272
Training the Model—Every Feature Gets a Shot . . . . . . . . . . . . . . . . . . . . . . . . . . . . . . . . . . 272
Evaluating the Boosted Model . . . . . . . . . . . . . . . . . . . . . . . . . . . . . . . . . . . . . . . . . . . . . . . . . . 280
Wrapping Up . . . . . . . . . . . . . . . . . . . . . . . . . . . . . . . . . . . . . . . . . . . . . . . . . . . . . . . . . . . . . . . . . . . . . . 283
8 Forecasting: Breathe Easy; You Can’t Win . . . . . . . . . . . . . . . . . . . . . . . . . . . . . . . . . . . 285The Sword Trade Is Hopping . . . . . . . . . . . . . . . . . . . . . . . . . . . . . . . . . . . . . . . . . . . . . . . . . . . . . . . . 286
Getting Acquainted with Time Series Data . . . . . . . . . . . . . . . . . . . . . . . . . . . . . . . . . . . . . . . . . . . 286
Starting Slow with Simple Exponential Smoothing . . . . . . . . . . . . . . . . . . . . . . . . . . . . . . . . . . . 288
Setting Up the Simple Exponential Smoothing Forecast . . . . . . . . . . . . . . . . . . . . . . . . . . 290
You Might Have a Trend . . . . . . . . . . . . . . . . . . . . . . . . . . . . . . . . . . . . . . . . . . . . . . . . . . . . . . . . . . . . 296
Holt’s Trend-Corrected Exponential Smoothing . . . . . . . . . . . . . . . . . . . . . . . . . . . . . . . . . . . . . 299
Setting Up Holt’s Trend-Corrected Smoothing in a Spreadsheet . . . . . . . . . . . . . . . . . . 300
So Are You Done? Looking at Autocorrelations . . . . . . . . . . . . . . . . . . . . . . . . . . . . . . . . . . 306
Multiplicative Holt-Winters Exponential Smoothing . . . . . . . . . . . . . . . . . . . . . . . . . . . . . . . . . . . 313
Setting the Initial Values for Level, Trend, and Seasonality . . . . . . . . . . . . . . . . . . . . . . . . . 315
Getting Rolling on the Forecast. . . . . . . . . . . . . . . . . . . . . . . . . . . . . . . . . . . . . . . . . . . . . . . . . . 319
And...Optimize! . . . . . . . . . . . . . . . . . . . . . . . . . . . . . . . . . . . . . . . . . . . . . . . . . . . . . . . . . . . . . . . . .324
Please Tell Me We’re Done Now!!! . . . . . . . . . . . . . . . . . . . . . . . . . . . . . . . . . . . . . . . . . . . . . . .326
Putting a Prediction Interval around the Forecast . . . . . . . . . . . . . . . . . . . . . . . . . . . . . . . . .327
Creating a Fan Chart for Effect . . . . . . . . . . . . . . . . . . . . . . . . . . . . . . . . . . . . . . . . . . . . . . . . . . 331
Wrapping Up . . . . . . . . . . . . . . . . . . . . . . . . . . . . . . . . . . . . . . . . . . . . . . . . . . . . . . . . . . . . . . . . . . . . . . . 333
9 Outlier Detection: Just Because They’re Odd Doesn’t Mean They’re Unimportant . . . . . . . . . . . . . . . . . . . . . . . . . . . . . . . . . . . . . . . . . . . . . . . . . . . . . . . . . . . . . 335
Outliers Are (Bad?) People, Too . . . . . . . . . . . . . . . . . . . . . . . . . . . . . . . . . . . . . . . . . . . . . . . . . . . . . .335
The Fascinating Case of Hadlum v. Hadlum . . . . . . . . . . . . . . . . . . . . . . . . . . . . . . . . . . . . . . . . . . .336
Tukey Fences . . . . . . . . . . . . . . . . . . . . . . . . . . . . . . . . . . . . . . . . . . . . . . . . . . . . . . . . . . . . . . . . . . .337
Applying Tukey Fences in a Spreadsheet . . . . . . . . . . . . . . . . . . . . . . . . . . . . . . . . . . . . . . . . .338
The Limitations of This Simple Approach . . . . . . . . . . . . . . . . . . . . . . . . . . . . . . . . . . . . . . . . 340
Terrible at Nothing, Bad at Everything . . . . . . . . . . . . . . . . . . . . . . . . . . . . . . . . . . . . . . . . . . . . . . . . 341
Preparing Data for Graphing . . . . . . . . . . . . . . . . . . . . . . . . . . . . . . . . . . . . . . . . . . . . . . . . . . . . .342

Contents xii
Creating a Graph . . . . . . . . . . . . . . . . . . . . . . . . . . . . . . . . . . . . . . . . . . . . . . . . . . . . . . . . . . . . . . .345
Getting the k Nearest Neighbors . . . . . . . . . . . . . . . . . . . . . . . . . . . . . . . . . . . . . . . . . . . . . . . .347
Graph Outlier Detection Method 1: Just Use the Indegree . . . . . . . . . . . . . . . . . . . . . . . . 348
Graph Outlier Detection Method 2: Getting Nuanced with k-Distance . . . . . . . . . . . . . 351
Graph Outlier Detection Method 3: Local Outlier Factors Are Where It’s At . . . . . . . .353
Wrapping Up . . . . . . . . . . . . . . . . . . . . . . . . . . . . . . . . . . . . . . . . . . . . . . . . . . . . . . . . . . . . . . . . . . . . . . .358
10 Moving from Spreadsheets into R . . . . . . . . . . . . . . . . . . . . . . . . . . . . . . . . . . . . . . . . . . .361Getting Up and Running with R . . . . . . . . . . . . . . . . . . . . . . . . . . . . . . . . . . . . . . . . . . . . . . . . . . . . . 362
Some Simple Hand-Jamming . . . . . . . . . . . . . . . . . . . . . . . . . . . . . . . . . . . . . . . . . . . . . . . . . . . .363
Reading Data into R . . . . . . . . . . . . . . . . . . . . . . . . . . . . . . . . . . . . . . . . . . . . . . . . . . . . . . . . . . . . 370
Doing Some Actual Data Science . . . . . . . . . . . . . . . . . . . . . . . . . . . . . . . . . . . . . . . . . . . . . . . . . . . . .372
Spherical K-Means on Wine Data in Just a Few Lines . . . . . . . . . . . . . . . . . . . . . . . . . . . . . .372
Building AI Models on the Pregnancy Data . . . . . . . . . . . . . . . . . . . . . . . . . . . . . . . . . . . . . . .378
Forecasting in R . . . . . . . . . . . . . . . . . . . . . . . . . . . . . . . . . . . . . . . . . . . . . . . . . . . . . . . . . . . . . . . 385
Looking at Outlier Detection . . . . . . . . . . . . . . . . . . . . . . . . . . . . . . . . . . . . . . . . . . . . . . . . . . . 389
Wrapping Up . . . . . . . . . . . . . . . . . . . . . . . . . . . . . . . . . . . . . . . . . . . . . . . . . . . . . . . . . . . . . . . . . . . . . . 394
Conclusion . . . . . . . . . . . . . . . . . . . . . . . . . . . . . . . . . . . . . . . . . . . . . . . . . . . . . . . . . . . . . . 395Where Am I? What Just Happened? . . . . . . . . . . . . . . . . . . . . . . . . . . . . . . . . . . . . . . . . . . . . . . . . . .395
Before You Go-Go . . . . . . . . . . . . . . . . . . . . . . . . . . . . . . . . . . . . . . . . . . . . . . . . . . . . . . . . . . . . . . . . . .395
Get to Know the Problem . . . . . . . . . . . . . . . . . . . . . . . . . . . . . . . . . . . . . . . . . . . . . . . . . . . . . . 396
We Need More Translators . . . . . . . . . . . . . . . . . . . . . . . . . . . . . . . . . . . . . . . . . . . . . . . . . . . . . .397
Beware the Three-Headed Geek-Monster: Tools, Performance, and Mathematical Perfection . . . . . . . . . . . . . . . . . . . . . . . . . . . . . . . . . . . . . . . . . . . . . . . . . . . . . . . .397
You Are Not the Most Important Function of Your Organization . . . . . . . . . . . . . . . . . 400
Get Creative and Keep in Touch! . . . . . . . . . . . . . . . . . . . . . . . . . . . . . . . . . . . . . . . . . . . . . . . . . . . . 400
Index . . . . . . . . . . . . . . . . . . . . . . . . . . . . . . . . . . . . . . . . . . . . . . . . . . . . . . . . . . . . . . . . . . . . 401

What Am I Doing Here?You’ve probably heard the term data science fl oating around recently in the media, in
business books and journals, and at conferences. Data science can call presidential races,
reveal more about your buying habits than you’d dare tell your mother, and predict just
how many years those chili cheese burritos have been shaving off your life.
Data scientists, the elite practitioners of this art, were even labeled “sexy” in a recent
Harvard Business Review article, although there’s apparently such a shortage that it’s kind
of like calling a unicorn sexy. There’s just no way to verify the claim, but if you could see
me as I type this book with my neck beard and the tired eyes of a parent of three boys,
you’d know that sexy is a bit of an overstatement.
I digress. The point is that there’s a buzz about data science these days, and that buzz
is creating pressure on a lot of businesses. If you’re not doing data science, you’re gonna
lose out to the competition. Someone’s going to come along with some new product called
the “BlahBlahBlahBigDataGraphThing” and destroy your business.
Take a deep breath.
The truth is most people are going about data science all wrong. They’re starting with
buying the tools and hiring the consultants. They’re spending all their money before they
even know what they want, because a purchase order seems to pass for actual progress
in many companies these days.
By reading this book, you’re gonna have a leg up on those jokers, because you’re going
to learn exactly what these techniques in data science are and how they’re used. When it
comes time to do the planning, and the hiring, and the buying, you’ll already know how
to identify the data science opportunities within your own organization.
The purpose of this book is to introduce you to the practice of data science in a com-
fortable and conversational way. When you’re done, I hope that much of that data science
anxiety you’re feeling is replaced with excitement and with ideas about how you can use
data to take your business to the next level.
Introduction
xiv Introduction
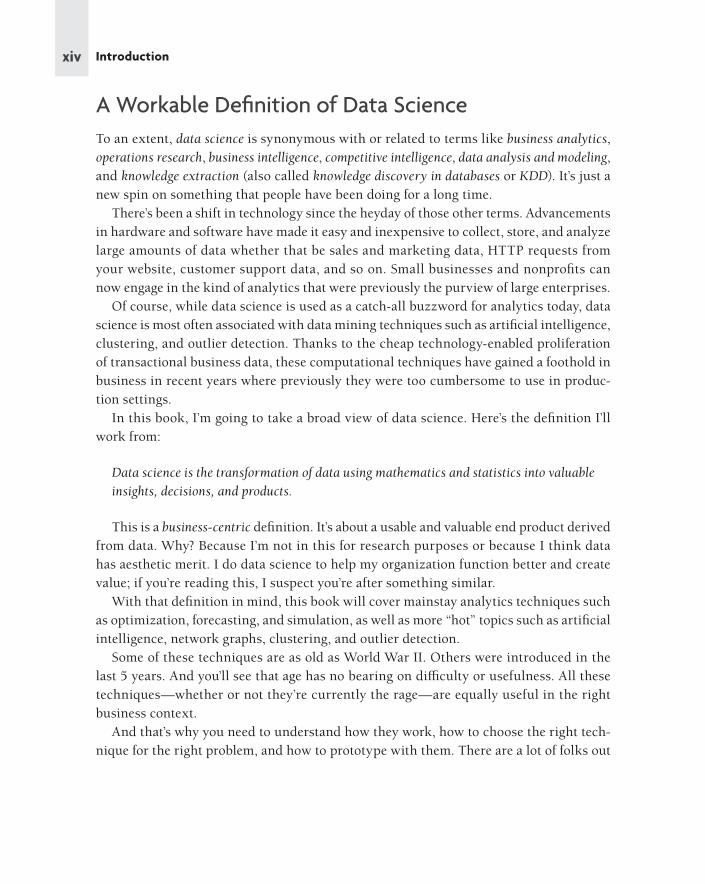
A Workable Defi nition of Data ScienceTo an extent, data science is synonymous with or related to terms like business analytics,
operations research, business intelligence, competitive intelligence, data analysis and modeling,
and knowledge extraction (also called knowledge discovery in databases or KDD). It’s just a
new spin on something that people have been doing for a long time.
There’s been a shift in technology since the heyday of those other terms. Advancements
in hardware and software have made it easy and inexpensive to collect, store, and analyze
large amounts of data whether that be sales and marketing data, HTTP requests from
your website, customer support data, and so on. Small businesses and nonprofi ts can
now engage in the kind of analytics that were previously the purview of large enterprises.
Of course, while data science is used as a catch-all buzzword for analytics today, data
science is most often associated with data mining techniques such as artifi cial intelligence,
clustering, and outlier detection. Thanks to the cheap technology-enabled proliferation
of transactional business data, these computational techniques have gained a foothold in
business in recent years where previously they were too cumbersome to use in produc-
tion settings.
In this book, I’m going to take a broad view of data science. Here’s the defi nition I’ll
work from:
Data science is the transformation of data using mathematics and statistics into valuable
insights, decisions, and products.
This is a business-centric defi nition. It’s about a usable and valuable end product derived
from data. Why? Because I’m not in this for research purposes or because I think data
has aesthetic merit. I do data science to help my organization function better and create
value; if you’re reading this, I suspect you’re after something similar.
With that defi nition in mind, this book will cover mainstay analytics techniques such
as optimization, forecasting, and simulation, as well as more “hot” topics such as artifi cial
intelligence, network graphs, clustering, and outlier detection.
Some of these techniques are as old as World War II. Others were introduced in the
last 5 years. And you’ll see that age has no bearing on diffi culty or usefulness. All these
techniques—whether or not they’re currently the rage—are equally useful in the right
business context.
And that’s why you need to understand how they work, how to choose the right tech-
nique for the right problem, and how to prototype with them. There are a lot of folks out

xvIntroduction
there who understand one or two of these techniques, but the rest aren’t on their radar. If
all I had in my toolbox was a hammer, I’d probably try to solve every problem by smack-
ing it real hard. Not unlike my two-year-old.
Better to have a few other tools at your disposal.
But Wait, What about Big Data?You’ve heard the term big data even more than data science most likely. Is this a book on
big data?
That depends on how you defi ne big data. If you defi ne big data as computing simple
summary statistics on unstructured garbage stored in massive, horizontally scalable,
NoSQL databases, then no, this is not a book on big data.
If you defi ne big data as turning transactional business data into decisions and insight
using cutting-edge analytics (regardless of where that data is stored), then yes, this is a
book about big data.
This is not a book that will be covering database technologies, like MongoDB and HBase.
This is not a book that will be covering data science coding packages like Mahout, NumPy,
various R libraries, and so on. There are other books out there for that stuff .
But that’s a good thing. This book ignores the tools, the storage, and the code. Instead,
it focuses as much as possible on the techniques. There are many folks out there who
think that data storage and retrieval, with a little bit of cleanup and aggregation mixed
in, constitutes all there is to know about big data.
They’re wrong. This book will take you beyond the spiel you’ve been hearing from the
big data software sales reps and bloggers to show you what’s really possible with your data.
And the cool thing is that for many of these techniques, your dataset can be any size, small
or large. You don’t have to have a petabyte of data and the expenses that come along with
it in order to predict the interests of your customer base. If you have a massive dataset,
that’s great, but there are some businesses that don’t have it, need it, and will likely never
generate it. Like my local butcher. But that doesn’t mean his e-mail marketing couldn’t
benefi t from a little bacon versus sausage cluster detection.
If data science books were workouts, this book would be all calisthenics—no machine
weights, no ergs. Once you understand how to implement the techniques with even the
most barebones of tools, you’ll fi nd yourself free to implement them in a variety of tech-
nologies, prototype with them with ease, buy the correct data science products from
consultants, delegate the correct approach to your developers, and so on.

xvi Introduction
Who Am I?Let me pause a moment to tell you my story. It’ll go a long way to explaining why I teach
data science the way I do. Many moons ago, I was a management consultant. I worked
on analytics problems for organizations such as the FBI, DoD, the Coca-Cola Company,
Intercontinental Hotels Group, and Royal Caribbean International. And through all these
experiences I walked away having learned one thing—more people than just the scientists
need to understand data science.
I worked with managers who bought simulations when they needed an optimization
model. I worked with analysts who only understood Gantt charts, so everything needed
to be solved with Gantt charts. As a consultant, it wasn’t hard to win over a customer
with any old white paper and a slick PowerPoint deck, because they couldn’t tell AI from
BI or BI from BS.
The point of this book is to broaden the audience of who understands and can imple-
ment data science techniques. I’m not trying to turn you into a data scientist against your
will. I just want you to be able to integrate data science as best as you can into the role
you’re already good at.
And that brings me to who you are.
Who Are You?No, I haven’t been using data science to spy on you. I have no idea who you are, but thanks
for shelling out some money for this book. Or supporting your local library. You can do
that, too.
Here are some archetypes (or personas for you marketing folks) I had in mind when
writing this book. Maybe you are:
• The vice president of marketing who wants to use her transactional business data
more strategically to price products and segment customers. But she doesn’t under-
stand the approaches her software developers and overpriced consultants are rec-
ommending she try.
• The demand forecasting analyst who knows his organization’s historical purchase
data holds more insight about his customers than just the next quarter’s projections.
But he doesn’t know how to extract that insight.
• The CEO of an online retail start-up who wants to predict when a customer is likely
to be interested in buying an item based on their past purchases.

xviiIntroduction
• The business intelligence analyst who sees money going down the tubes from the
infrastructure and supply chain costs her organization is accruing, but doesn’t know
how to systematically make cost-saving decisions.
• The online marketer who wants to do more with his company’s free text customer
interactions taking place in e-mail, Facebook, and Twitter, but right now they’re
just being read and saved.
I have in mind that you are a reader who would benefi t directly from knowing more
about data science but hasn’t found a way to get a foothold into all the techniques. The
purpose of this book is to strip away all the distractions around data science (the code,
the tools, and the hype) and teach the techniques using practical use cases that someone
with a semester of linear algebra or calculus in college can understand. Assuming you
didn’t fail that semester. If you did, just read slower and use Wikipedia liberally.
No Regrets. Spreadsheets ForeverThis is not a book about coding. In fact, I’m giving you my “no code” guarantee (until
Chapter 10 at least). Why?
Because I don’t want to spend a hundred pages at the beginning of this book messing
with Git, setting environment variables, and doing the dance of Emacs versus Vi.
If you run Windows and Microsoft Offi ce almost exclusively. If you work for the govern-
ment, and they don’t let you download and install random open source stuff on your box.
Even if MATLAB or your TI-83 scared the hell out of you in college, you need not be afraid.
Do you need to know how to write code to put most of these techniques in automated,
production settings? Absolutely! Or at least someone you work with needs to be able to
handle code and storage technologies.
Do you need to know how to write code in order to understand, distinguish between,
and prototype with these techniques? Absolutely not!
This is why I go over every technique in spreadsheet software.
Now, this is all a bit of a lie. The fi nal chapter in this book is actually on moving to the
data science-focused programming language, R. It’s for those of you that want to use this
book as a jumping-off point to deeper things.
But Spreadsheets Are So Démodé!Spreadsheets are not the sexiest tools around. In fact, they’re the Wilford-Brimley-selling-
Colonial-Penn of the analytics tool world. Completely unsexy. Sorry, Wilford.

xviii Introduction
But that’s the point. Spreadsheets stay out of the way. They allow you to see the data
and to touch (or at least click on) the data. There’s a freedom there. In order to learn these
techniques, you need something vanilla, something everyone understands, but nonethe-
less, something that will let you move fast and light as you learn. That’s a spreadsheet.
Say it with me: “I am a human. I have dignity. I should not have to write a map-reduce
job in order to learn data science.”
And spreadsheets are great for prototyping! You’re not running a production AI model
for your online retail business out of Excel, but that doesn’t mean you can’t look at purchase
data, experiment with features that predict product interest, and prototype a targeting
model. In fact, it’s the perfect place to do just that.
Use Excel or LibreOffi ceAll the examples you’re going to work through will be visualized in the book in Excel.
On the book’s website (www.wiley.com/go/datasmart) are posted companion spread-
sheets for each chapter so that you can follow along. If you’re really adventurous, you can
clear out all but the starting data in the spreadsheet and replicate all the work yourself.
This book is compatible with Excel versions 2007, 2010, 2011 for Mac, and 2013. Chapter
1 will discuss the version diff erences most in depth.
Most of you have access to Excel, and you probably already use it for reporting or
recordkeeping at work. But if for some reason you don’t have a copy of Excel, you can
either buy it or go for LibreOffi ce (www.libreoffice.org) instead.
LibreOffi ce is open source, free, and has nearly all of the same functionality as Excel.
I think its native solver is actual preferable to Excel’s. So if you want to go that route for
this book, feel free.
WHAT ABOUT GOOGLE DRIVE?
Now, some of you might be wondering whether you can use Google Drive. It’s an appeal-
ing option since Google Drive is in the cloud and can run on your mobile devices as
well as your beige box. But it just won’t work.
Google Drive is great for simple spreadsheets, but for where you’re going, Google
just can’t hang. Adding rows and columns in Drive is a constant annoyance, the imple-
mentation of Solver is dreadful, and the charts don’t even have trendlines. I wish it were
otherwise.

xixIntroduction
ConventionsTo help you get the most from the text and keep track of what’s happening, I’ve used a
number of conventions throughout the book.
WARNING
Warnings hold important, not-to-be-forgotten information that is directly relevant to
the surrounding text.
NOTE
Notes cover tips, hints, tricks, or asides to the current discussion.
Frequently in this text I’ll reference little snippets of Excel code like this:
=CONCATENATE(“THIS IS A FORMULA”, “ IN EXCEL!”)
We highlight new terms and important words when we introduce them. We show fi le
names, URLs, and formulas within the text like so:
http://www .john-foreman.com.
Let’s Get GoingIn the fi rst chapter, I’m going to fi ll in a few holes in your Excel knowledge. After that,
you’ll move right into use cases. By the end of this book, you’ll not only know about but
actually have experience implementing from scratch the following techniques:
• Optimization using linear and integer programming
• Working with time series data, detecting trends and seasonal patterns, and forecast-
ing with exponential smoothing
SIDEBARS
Sidebars, like the one you just read about Google Drive, touch upon some side issue
related to the text in detail.

xx Introduction
• Using Monte Carlo simulation in optimization and forecasting scenarios to quantify
and address risk
• Artifi cial intelligence using the general linear model, logistic link functions, ensem-
ble methods, and naïve Bayes
• Measuring distances between customers using cosine similarity, creating kNN
graphs, calculating modularity, and clustering customers
• Detecting outliers in a single dimension with Tukey fences or in multiple dimen-
sions with local outlier factors
• Using R packages to “stand on the shoulders” of other analysts in conducting these
tasks
If any of that sounds exciting, read on! If any of that sounds scary, I promise to keep
things as clear and enjoyable as possible.
In fact, I prefer clarity well above mathematical correctness, so if you’re an academician
reading this, there may be times where you should close your eyes and think of England.
Without further ado, then, let’s get number-crunching.

1This book relies on you having a working knowledge of spreadsheets, and I’m going to
assume that you already understand the basics. If you’ve never used a formula before
in your life, then you’ve got a slight uphill battle here. I’d recommend going through a For
Dummies book or some other intro-level tutorial for Excel before diving into this.
That said, even if you’re a seasoned Excel veteran, there’s some functionality that’ll keep
cropping up in this text that you may not have had to use before. It’s not diffi cult stuff ;
just things I’ve noticed not everyone has used in Excel. You’ll be covering a wide variety
of little features in this chapter, and the example at this stage might feel a bit disjointed.
But you can learn what you can here, and then, when you encounter it organically later
in the book, you can slip back to this chapter as a reference.
As Samuel L. Jackson says in Jurassic Park, “Hold on to your butts!”
EXCEL VERSION DIFFERENCES
As mentioned in the book’s introduction, these chapters work with Excel 2007, 2010,
2013, 2011 for Mac, and LibreOffi ce. Sadly, in each version of Excel, Microsoft has
moved stuff around for the heck of it.
For example, things on the Layout tab on 2011 are on the View tab in the other ver-
sions. Solver is the same in 2010 and 2013, but the performance is actually better in
2007 and 2011 even though 2007’s Solver interface is grotesque.
The screen captures in this text will be from Excel 2011. If you have an older or newer
version, sometimes your interactions will look a little diff erent—mostly when it comes
to where things are on the menu bar. I will do my best to call out these diff erences. If
you can’t fi nd something, Excel’s help feature and Google are your friends.
The good news is that whenever we’re in the “spreadsheet part of the spreadsheet,”
everything works exactly the same.
As for LibreOffi ce, if you’ve chosen to use open source software for this book, then
I’m assuming you’re a do-it-yourself kind of person, and I won’t be referencing the
LibreOffi ce interface directly. Never you mind, though. It’s a dead ringer for Excel.
Everything You Ever Needed to Know about Spreadsheets but Were Too Afraid to Ask
2 Data Smart
Some Sample Data
NOTE
The Excel workbook used in this chapter, “Concessions.xlsx,” is available for download
at the book’s website at www.wiley.com/go/datasmart.
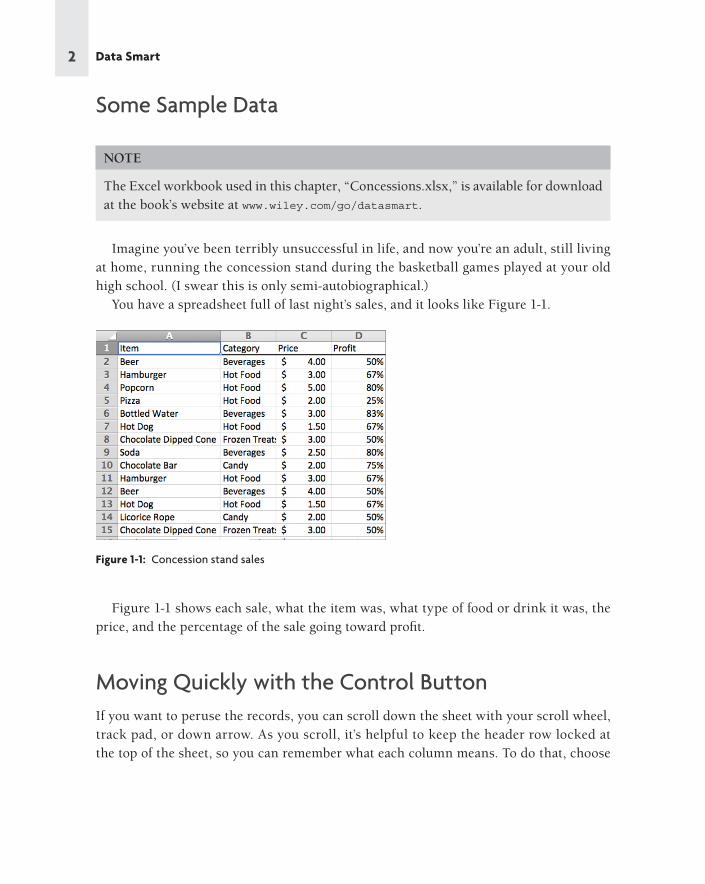
Imagine you’ve been terribly unsuccessful in life, and now you’re an adult, still living
at home, running the concession stand during the basketball games played at your old
high school. (I swear this is only semi-autobiographical.)
You have a spreadsheet full of last night’s sales, and it looks like Figure 1-1.
Figure 1-1: Concession stand sales
Figure 1-1 shows each sale, what the item was, what type of food or drink it was, the
price, and the percentage of the sale going toward profi t.
Moving Quickly with the Control ButtonIf you want to peruse the records, you can scroll down the sheet with your scroll wheel,
track pad, or down arrow. As you scroll, it’s helpful to keep the header row locked at
the top of the sheet, so you can remember what each column means. To do that, choose

3Everything You Ever Needed to Know about Spreadsheets but Were Too Afraid to Ask
Freeze Panes or Freeze Top Row from the “View” tab on Windows (“Layout” tab on Mac
2011 as shown in Figure 1-2).
Figure 1-2: Freezing the top row
To move quickly to the bottom of the sheet to look at how many transactions you have,
you can select a value in one of the populated columns and press Ctrl+↓ (Command+↓
on a Mac). You’ll zip right to the last populated cell in that column. In this sheet, the fi nal
row is 200. Also, note that using Ctrl/Command to jump around the sheet from left to
right works much the same.
If you want to take an average of the sales prices for the night, below the price column,
column C, you can jot the following formula:
=AVERAGE(C2:C200)
The average is $2.83, so you won’t be retiring wealthy anytime soon. Alternatively, you
can select the last cell in the column, C200, hold Shift+Ctrl+↑ to highlight the whole col-
umn, and then select the Average calculation from the status bar in the bottom right of the
spreadsheet to see the simple summary statistic (see Figure 1-3). On Windows, you’ll need
to right-click the status bar to select the average if it’s not there. On Mac, if your status bar
is turned off , click the View menu and select “Status Bar” to turn it on.

4 Data Smart
Figure 1-3: Average of the price column in the status bar
Copying Formulas and Data QuicklyPerhaps you’d like to view your profi ts in actual dollars rather than as percentages. You
can add a header to column E called “Actual Profi t.” In E2, you need only to multiply the
price and profi t columns together to obtain this:
=C2*D2
For beer, it’s $2. You don’t have to rewrite this formula in every cell in the column.
Instead, Excel lets you grab the right-bottom corner of the cell and drag the formula
where you like. The referenced cells in columns C and D will update relative to where you
copy the formula. If, as in the case of the concession data, the column to the left is fully
populated, you can double-click the bottom-right corner of the formula to have Excel fi ll
the whole column (see Figure 1-4). Try this double-click action for yourself, because I’ll
be using it all over the place in this book, and if you get the hang of it now, you’ll save
yourself a whole lot of heartache.
Now, what if you don’t want the cells in the formula to change relative to the target when
they’re dragged or copied? Whatever you don’t want changed, just add a $ in front of it.

5Everything You Ever Needed to Know about Spreadsheets but Were Too Afraid to Ask
For example, if you changed the formula in E2 to:
=C$2*D$2
Figure 1-4: Filling in a formula by dragging the corner
Then when you copy the formula down, nothing changes. The formula continues to
reference row 2.
If you copy the formula to the right, however, C would become D, D would become E,
and so on. If you don’t want that behavior, you need to put a $ in front of the column refer-
ences as well. This is called an absolute reference as opposed to a relative reference.
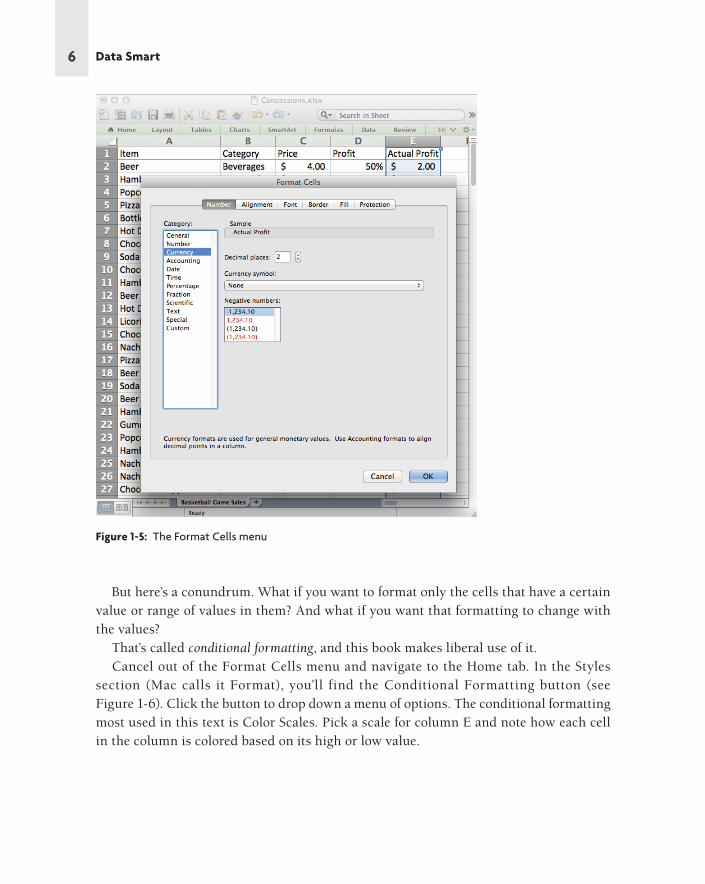
Formatting CellsExcel off ers static and dynamic options for formatting values. Take a look at column E, the
Actual Profi t column you just created. Select column E by clicking on the gray E column
label. Then right-click the selection and choose Format Cells.
From within the Format Cells menu, you can tell Excel the type of number to be found
in column E. In this case you want it to be Currency. And you can set the number of
decimal places. Leave it at two decimals, as shown in Figure 1-5. Also available in Format
Cells are options for changing font colors, text alignment, fi ll colors, borders, and so on.
6 Data Smart
Figure 1-5: The Format Cells menu
But here’s a conundrum. What if you want to format only the cells that have a certain
value or range of values in them? And what if you want that formatting to change with
the values?
That’s called conditional formatting, and this book makes liberal use of it.
Cancel out of the Format Cells menu and navigate to the Home tab. In the Styles
section (Mac calls it Format), you’ll find the Conditional Formatting button (see
Figure 1-6). Click the button to drop down a menu of options. The conditional formatting
most used in this text is Color Scales. Pick a scale for column E and note how each cell
in the column is colored based on its high or low value.

7Everything You Ever Needed to Know about Spreadsheets but Were Too Afraid to Ask
Figure 1-6: Applying conditional formatting to the profi t
To remove conditional formatting, use the Clear Rules options under the Conditional
Formatting menu.
Paste Special ValuesIt’s often in your best interest not to have a formula lying around like you see in Column E
in Figure 1-4. If you were using the RAND() formula to generate a random value, for example,
it changes each time the spreadsheet auto-recalculates, which while awesome, can also be
extremely annoying. The solution is to copy and paste these cells back to the sheet as fl at
values.
To convert formulas to values only, simply copy a column fi lled with formulas (grab
column E) and paste it back using the Paste Special option (found on the Home tab under
the Paste option on Windows and under the Edit menu on Mac). In the Paste Special win-
dow, choose to paste as values (see Figure 1-7). Note also that Paste Special allows you to
transpose the data from vertical to horizontal and vice versa when pasting. You’ll be using
that a fair bit in the chapters to come.

8 Data Smart
Figure 1-7: The Paste Special window in Excel 2011
Inserting ChartsIn the concession stand sales workbook, there’s also a tab called Calories with a tiny table
that shows the calorie count of each item the concession stand sells. You can chart data
like this in Excel easily. On the Insert tab (Charts on a Mac), there is a charts section that
provides diff erent visualization options such as bar charts, line graphs, and pie charts.
NOTE
In this book, we’re going to use mostly column charts, line graphs, and scatter plots.
Never be caught using a pie chart. And especially never use the 3D pie charts Excel
off ers, or my ghost will personally haunt you when I die. They’re ugly, they don’t com-
municate data well, and the 3D eff ect has less aesthetic value than the seashell paintings
hanging on the wall of my dentist’s offi ce.
Highlighting columns A:B on the Calories workbook, you can select a Clustered Column
chart to visualize the data. Play around with the graph. Sections can be right-clicked to
bring up formatting menus. For example, right-clicking the bars, you can select “Format
9Everything You Ever Needed to Know about Spreadsheets but Were Too Afraid to Ask
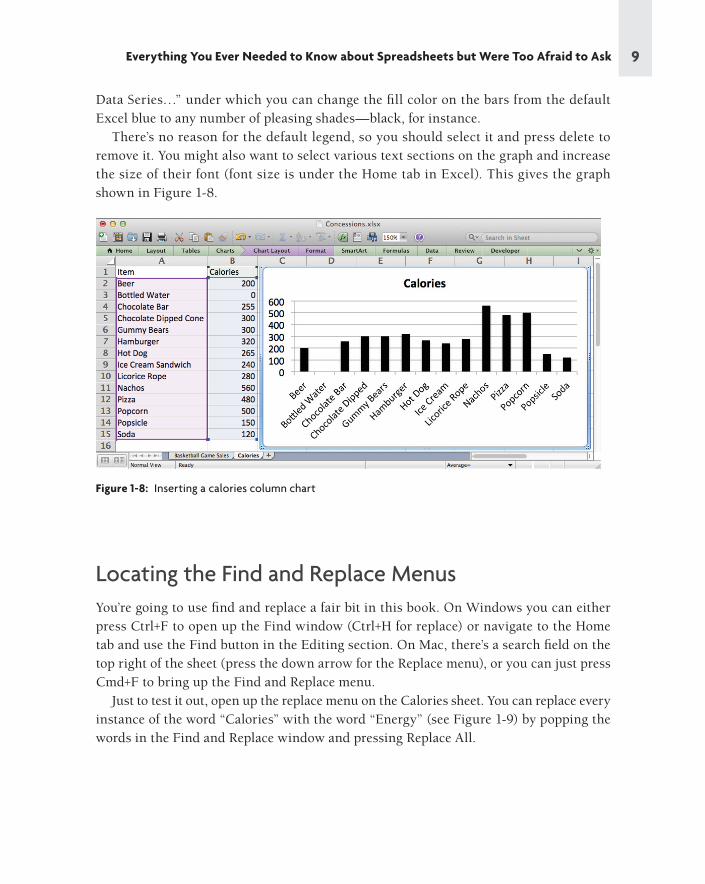
Data Series…” under which you can change the fi ll color on the bars from the default
Excel blue to any number of pleasing shades—black, for instance.
There’s no reason for the default legend, so you should select it and press delete to
remove it. You might also want to select various text sections on the graph and increase
the size of their font (font size is under the Home tab in Excel). This gives the graph
shown in Figure 1-8.
Figure 1-8: Inserting a calories column chart
Locating the Find and Replace MenusYou’re going to use fi nd and replace a fair bit in this book. On Windows you can either
press Ctrl+F to open up the Find window (Ctrl+H for replace) or navigate to the Home
tab and use the Find button in the Editing section. On Mac, there’s a search fi eld on the
top right of the sheet (press the down arrow for the Replace menu), or you can just press
Cmd+F to bring up the Find and Replace menu.
Just to test it out, open up the replace menu on the Calories sheet. You can replace every
instance of the word “Calories” with the word “Energy” (see Figure 1-9) by popping the
words in the Find and Replace window and pressing Replace All.

10 Data Smart
Figure 1-9: Running a Find and Replace
Formulas for Locating and Pulling ValuesIf I didn’t assume you at least knew some formulas in Excel (SUM, MAX, MIN, PERCENTILE, and
so on), we’d be here all day. And I want to get started. But there are some formulas used a
lot in this book that you’ve probably not used unless you’ve dug deep into the wonderful
world of spreadsheets. These formulas deal with fi nding a value in a range and returning its
location or on the fl ip side fi nding a location in a range and returning its value.
I want to cover a few of those on the Calories tab.
Sometimes you want to know the place in line of some element in a column or row. Is it
fi rst, second, third? The MATCH formula handles that quite nicely. Below your calorie data,
label A18 as Match. You can implement the formula one cell over in B18 to fi nd where in
the item list above the word “Hamburger” appears. To use the formula, you supply it a
value to look for, a range to search in, and a 0 to force it to give you back the position of
the keyword itself:
=MATCH("Hamburger",A2:A15,0)
This yields a 6, because “Hamburger” is the sixth item in the list (see Figure 1-10).
Next up is the INDEX formula. Label A19 as Index.
This formula takes in a range of values and a row and column number and returns
the value in the range at that location. For example, you can feed the INDEX formula our
calorie table A1:B15, and to pull back the calorie count for bottled water, feed in 3 rows
down and 2 columns over:
=INDEX(A1:B15,3,2)

11Everything You Ever Needed to Know about Spreadsheets but Were Too Afraid to Ask
This yields a calorie count of 0 as expected (see Figure 1-10).
Another formula you’ll see a lot in this text is OFFSET. Go ahead and label A20 as Off set,
and you can play with the formula in B20.
With this formula, you provide a range that acts like a cursor which is moved around
with row and column off sets (similar to INDEX for the single valued case except it’s 0-based).
For example, you can provide OFFSET with a reference to the top left of the sheet, A1, and
then pull back the value 3 cells below by providing a row off set of 3 and a column off set
of 0:
=OFFSET(A1,3,0)
This returns the name of the third item on the list, “Chocolate Bar.” See Figure 1-10.
The last formula I want to look at in this section is SMALL (it has a counterpart called
LARGE that works the same way). If you have a list of values and you want to return, say,
the third smallest, SMALL does that for you. To see this, label A21 as Small and in B21 feed
in the list of calorie counts and an index of 3:
=SMALL(B2:B15,3)
This hands back a value of 150 which is the third smallest after 0 (bottled water) and
120 (soda). See Figure 1-10.
Now, there’s one more formula used for looking up values that’s kind of like MATCH on
steroids and that’s VLOOKUP (and its horizontal counterpart HLOOKUP). That’s got its own
section next because it’s a beast.
Figure 1-10: Formulas you should learn
12 Data Smart
Using VLOOKUP to Merge DataGo ahead and fl ip back to the Basketball Game Sales tab. You can still reference a cell
here from the previous tab, Calories, by simply placing the tab name and “!” in front of a
referenced cell. For example, Calories!B2 is a reference to the calories in beer regardless
of what sheet you’re working in.
Now, what if you wanted to toss the calorie data into a column back on the sales sheet
so that next to each item sold the appropriate calorie count was listed? You’d somehow
have to look up the calorie count of each item sold and place it into a column next to the
transaction. Well, it turns out there’s a formula for that called VLOOKUP.
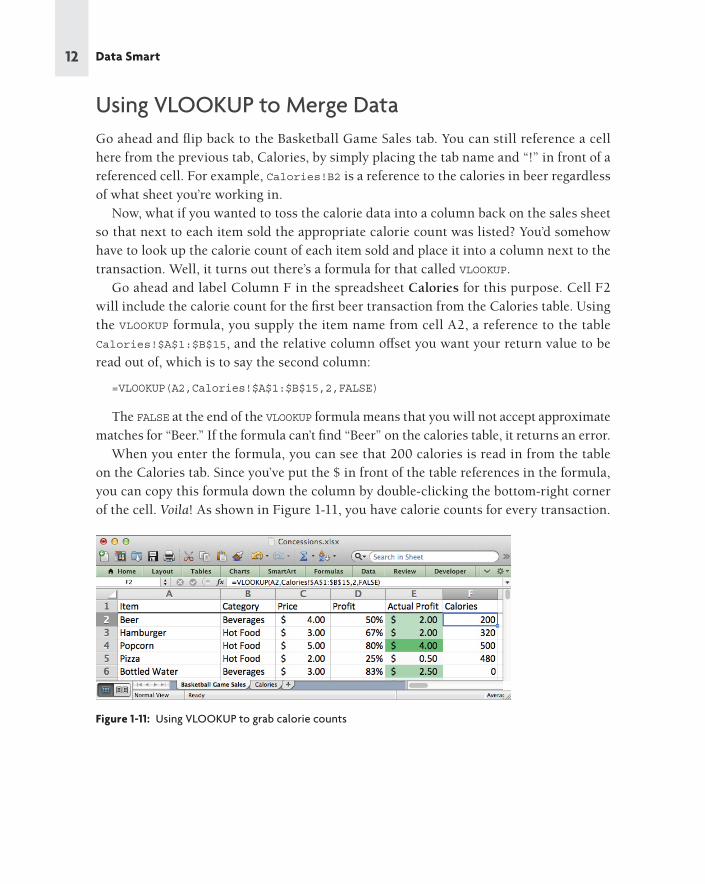
Go ahead and label Column F in the spreadsheet Calories for this purpose. Cell F2
will include the calorie count for the fi rst beer transaction from the Calories table. Using
the VLOOKUP formula, you supply the item name from cell A2, a reference to the table
Calories!$A$1:$B$15, and the relative column off set you want your return value to be
read out of, which is to say the second column:
=VLOOKUP(A2,Calories!$A$1:$B$15,2,FALSE)
The FALSE at the end of the VLOOKUP formula means that you will not accept approximate
matches for “Beer.” If the formula can’t fi nd “Beer” on the calories table, it returns an error.
When you enter the formula, you can see that 200 calories is read in from the table
on the Calories tab. Since you’ve put the $ in front of the table references in the formula,
you can copy this formula down the column by double-clicking the bottom-right corner
of the cell. Voila! As shown in Figure 1-11, you have calorie counts for every transaction.
Figure 1-11: Using VLOOKUP to grab calorie counts

13Everything You Ever Needed to Know about Spreadsheets but Were Too Afraid to Ask
Filtering and SortingNow that you have calories in there, say you now want to view only those transactions
from the Frozen Treats category. What you want to do then is fi lter the sheet. To do so, fi rst
you select the data in range A1:F200. You can put the cursor in A1 and press Shift+Ctrl+↓
then →. An even easier method is to click the top of column A and hold the click as you
mouse over to column F to highlight all six columns.
Then to place auto-fi ltering on these six columns, you press the Filter button in the
Data section of the ribbon. It looks like a gray funnel as shown in Figure 1-12.
Figure 1-12: Place auto-fi lter on a selected range
Once auto-fi lter is activated, you can click the drop-down menu that appears in cell B1
and choose to show only certain categories (in this case, only the Frozen Treats transac-
tions will be displayed). See Figure 1-13.
Once you’ve fi ltered, highlighting columns of data allows the summary bar in Excel to
give you rolled-up information just on the cells that remain. For example, having fi ltered
just the Frozen Treats, we can highlight the values in column E and use the summary bar
to get a quick total of profi t just from that category. See Figure 1-14.

14 Data Smart
Figure 1-13: Filtering on category
Figure 1-14: Summarizing a fi ltered column
Auto-fi lter allows you to sort as well. For example, if you want to sort by profi t, just
click the auto-fi lter menu on the Profi t cell (D1) and select Sort Ascending (or “Smallest
to Largest” in some versions). See Figure 1-15.

15Everything You Ever Needed to Know about Spreadsheets but Were Too Afraid to Ask
Figure 1-15: Sorting in ascending order by profi t
To remove all the fi ltering you’ve applied, either you can go back into the Category fi lter
menu and check the other boxes, or you can un-toggle the fi lter button on the ribbon that
you pressed in the fi rst place. You’ll see that although you have all of your data back, the
Frozen Treats are still in the order you sorted them in.
Excel also off ers the Sort interface for doing more complex sorts than might be possible
with auto-fi lter. To use the feature, you highlight the data to be sorted (grab A:F again)
and select Sort from the Sort & Filter section of the Data tab in Excel. This will bring up
the sort menu. On Mac, to get this window, you must press the down arrow in the sort
button and select Custom Sort….
In the sort menu, shown in Figure 1-16, you can note whether your data has column
headers or not, and if it does have headers like this example does, then you can select, by
name, the columns to be sorted.
Now, the most awesome part of this sorting interface is that under the “Options…”
button, you can select to sort left to right instead of column data. That’s something you
cannot do with auto-fi lter. In top to bottom of this book you’ll need to randomly sort data
by both columns and rows in two quick steps, and this interface is going to be your friend.
For now, just cancel out of it as the data is already ordered the way you want it.

16 Data Smart
Figure 1-16: Using the Sort menu
Using PivotTablesWhat if you wanted to know the total counts of each item type you sold? Or you wanted
to know revenue totals by item?
These questions are akin to “aggregate” or “group by” queries that you’d run in a tra-
ditional SQL database. But this data isn’t in a database. It’s in a spreadsheet. That’s where
PivotTables come to the rescue.
Just as when you fi ltered your data, you start by selecting the data you want to manipu-
late—in this case, the purchase data in the range A1:F:200. From the Insert tab (Data tab
on Mac), you can press the PivotTable button and select for Excel to create a new sheet
with a PivotTable. While some versions of Excel allow you to insert a PivotTable into an
existing sheet, it’s standard practice to select the new sheet option unless you have a really
good reason not to.
In this new sheet, the PivotTable Builder will be aligned to the right of the table (it fl oats
on a Mac). The builder allows you to take the columns from the original selected data and
use them as report fi lters, column and row labels for grouping, or values. A report fi lter
is similar in function to a fi lter from the previous section—it allows you to select only a
subset of the data, such as Frozen Treats. The Column Labels and Row Labels fi ll in the
meat of the PivotTable report with distinct values from the selected columns.

17Everything You Ever Needed to Know about Spreadsheets but Were Too Afraid to Ask
On Windows, the initial PivotTable built will be completely empty, while on Mac it is
often prepopulated with distinct values from the fi rst selected column down the rows of
the table and distinct values from the second column across the columns. If you’re on a
Mac, go ahead and uncheck all the boxes in the builder, so that you can work along from
an empty table.
Now, say you wanted to know total revenue by item. To get at that, you’d drag the Item
tile in the PivotTable Builder into the Rows section and the Price tile into the Values sec-
tion. This means that you’ll be operating on revenue grouped by item name.
Initially, however, the PivotTable is set up to merely count the number of price records
that are within a group. For example, there are 20 Beer rows. See Figure 1-17.
Figure 1-17: The PivotTable builder and a count of sales by item
You need to change the count to a sum in order to examine revenue. To do so, on
Windows, drop the menu down on the Price tile in the Values section of the builder and
select “Value Field Settings….” On Mac, press the little “i” button. From there, “sum” can
be selected from the various summary options.

18 Data Smart
What if you wanted to break out these sums by category? To do so, you drag the Category
tile into the Columns section of the builder. This gives the table shown in Figure 1-18.
Note that the PivotTable in the fi gure automatically totals up rows and columns for you.
Figure 1-18: Revenue by item and category
And if you want to ever get rid of something from the table, just uncheck it or grab the
tile from the section it’s in and drag it out of the sheet as if you were tossing it away. Go
ahead and drop the Category tile.
Once you get a report you want in a PivotTable, you can always select the values and
paste them to another sheet to work on further. In this example, you can copy the table
(A5:B18 on Mac) and Paste Special its values into a new tab called Revenue By Item (see
Figure 1-19).
Feel free to swap in various row and column labels until you get the hang of what’s
going on. For instance, try to get a total calorie count sold by category using a PivotTable.