data the afterpack - social mobility toolkit
TRANSCRIPT

Click to edit Master title style
1
Masterclass: Data Insights to drive your decisions and interventions
Afterpack
@SMCommission Social Mobility Commission @socialmobilitystories
#socialmobility www.socialmobilityworks.org2pm – 3:30pm 25th March 2021

Introduction
Thank you for joining us for the second in our masterclass series of 2021.
The purpose of this 'after-pack’ is to share the good practice, insights and presentations delivered during the event. It includes:
• Your review and refine check list and next steps
• Presentations from the Social Mobility Commission, BBC, Work Advance/PEC and the HMRC.
• Overview of the SME Index from the Social Mobility Foundation
The recording of the event can be found here.2

Area Recommendation Current Status Next Steps Due
Date
DA
TA
ST
RA
TE
GY
Data foundations
Do you have D&I targets as a business?
Do you use national benchmarks?
Do you have socio-economic diversity targets?
Are you using the latest scorecard from the SMC to track your KPIs? (link)
Do you publish this data?
Do you connect with others in the sector to gain sector commitment to targets?
Data collection
Do you collect any form of D&I data?
Is this done through an annual survey?
Do you collect data at any other times of the year, or at employee points?
Do you collect socio-economic data at both the recruitment and existing employee
stages?
Do you use socio-economic questions recommended by SMC?
Are you aware of our latest guidance? (link)
Data communication
Do you make your employees aware of your socio-economic intentions?
Do you publicise this alongside your data collection survey?
Are people aware as to why you are asking the socio-economic questions that you are
asking?
Do you clearly communicate how the data will be used and stored?
Maximising response rate
Is management fully engaged with the data agenda?
Do you share with staff how questions are strategically connected and relevant?
Are diversity surveys mandatory? (always with the option ‘prefer not to say’)
Your data review and refine checklist (1/3)
www.socialmobilityworks.org 3
It will enable you to review and refine your data strategy and focus on next steps. We would recommend that it be used alongside any internal documents you
may have already in place.
Nothing/Not something you currently do
Do something in this space but limited
Actively do this

Area Recommendation Current Status Next Steps Due
Date
PR
AC
TIC
AL
EL
EM
EN
TS
Analysis of results
Do you analyse socio-economic data at each grade level/job role (i.e. to
assess progression)?
Do you analyse socio-economic data against pay rewards and bonuses?
Do you analyse your training take up by socio-economic background?
Do you benchmark and contextualise against industry and national data?
Do you use data to inform change and evaluate progress?
Informing your inventions
Outreach
Do you collect and analyse outreach data to examine how participation
converts to desired outcomes, and how this varies between groups?
Do you use your outreach strategic plan to identify key impact metrics and
measure against these?
Recruitment
Do you compare applicant data with external benchmarks to assess how well
they reflect the eligible talent pool?
Do you monitor data during the application process to identify where diversity
is low?
Do you evaluate the impact of various entry routes on SEB diversity?
Progression
Do you benchmark socio-economic background progression against time to
progress and job performance?
Do you consider intersectionality when measuring progression?
Do you assess outcomes on progression after apprenticeships are completed
by socio-economic background?
Your data review and refine checklist (2/3)
www.socialmobilityworks.org 4
It will enable you to review and refine your data strategy and focus on next steps. We would recommend that it be used alongside any internal documents
you may have already in place.
Nothing/Not something you currently do
Do something in this space but limited
Actively do this

Your data review and refine checklist (3/3)
www.socialmobilityworks.org 5
This document has been designed using the ideas that were generated in our collaborative workshop. It will enable you to review and refine your progression strategy and focus on next steps. We would recommend that it be used alongside any internal documents you may have already in place.
Area Recommendation Current Status Action Due
Date
LE
AD
ER
SH
IP A
ND
CU
LT
UR
E
Leadership and culture
Do leaders and managers support the analysis of data, to understand the
current situation, indicate opportunities for action and enable you to measure
change?
Is consistent collection and analysis of data in the context of your organisation
and against relevant external benchmarks a central element of your strategy,
underpinning all other aspects?
Do you use data to help inform your decisions about the rate of progression?
Do you use data to help inform you about performance outcomes?
Do you use this data to help inform your pay grades?
Do you use data to help inform your decisions about pay and reward?
Do you share data with managers to educate them about the disproportionate
rate of progression/pay/reward etc for people from lower socio-economic
backgrounds?
Advocacy
Do you share the data findings internally within the business?
Do you share the data findings externally?
Do you make a public commitment to publishing data annually and reporting
on trends?
Do you publish aggregate diversity data, together with the rationale for
collecting these and statements about your strategy in response?
It will enable you to review and refine your data strategy and focus on next steps. We would recommend that it be used alongside any internal documents
you may have already in place.
Nothing/Not something you currently do
Actively do this
Nothing/Notsomething you currently do
Do something in this space but limited
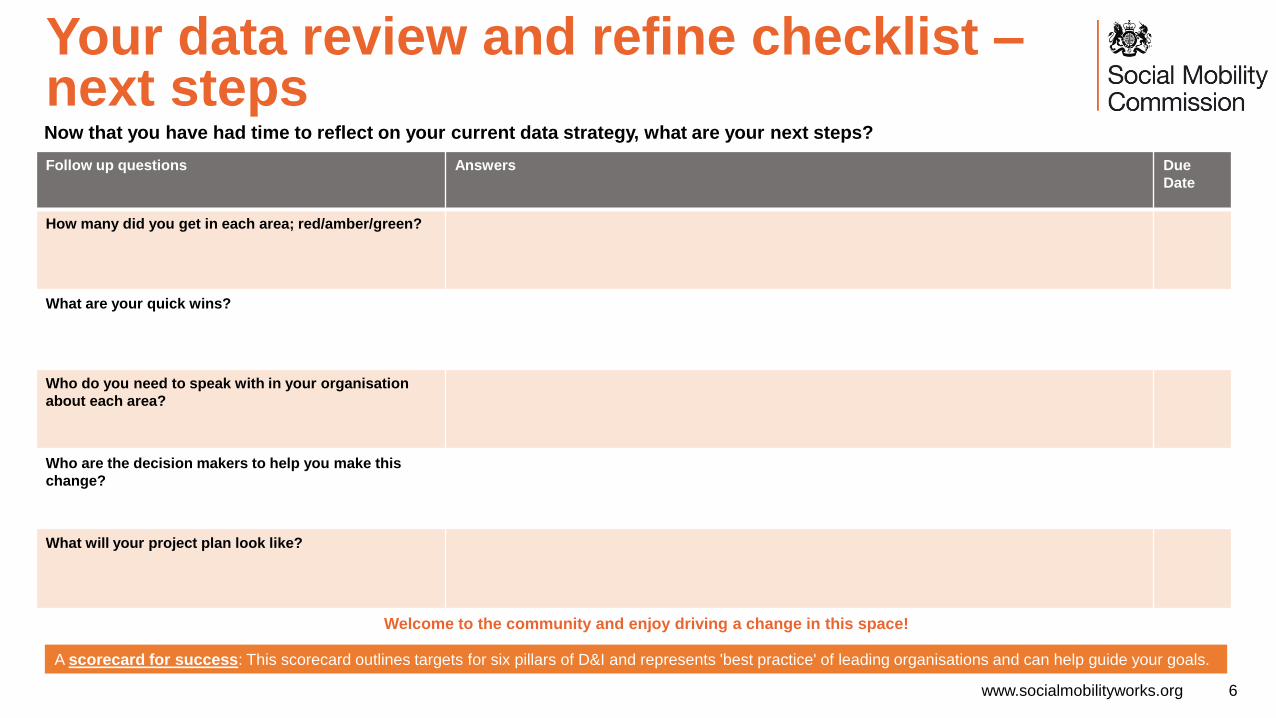
Your data review and refine checklist –next steps
www.socialmobilityworks.org 6
Follow up questions Answers Due
Date
How many did you get in each area; red/amber/green?
What are your quick wins?
Who do you need to speak with in your organisation
about each area?
Who are the decision makers to help you make this
change?
What will your project plan look like?
Now that you have had time to reflect on your current data strategy, what are your next steps?
Welcome to the community and enjoy driving a change in this space!
A scorecard for success: This scorecard outlines targets for six pillars of D&I and represents 'best practice' of leading organisations and can help guide your goals.
Click to edit Master title style
7
Masterclass: Data Insights to drive your decisions and interventions
@SMCommission Social Mobility Commission @socialmobilitystories
#socialmobility #askthequestion www.socialmobilityworks.org2pm – 3:30pm 25th March 2021

Today’s session
8
Employer case study: Cliff Sale, HMRC
Introduction - Data collection & Measuring Success: Paula Kemp, SMC
Employer case study: Andrew Young, BBC
Social Mobility Employer Index, Mareen Birresborn, SMF
Q&A
Sector Overview: Heather Carey, Work Advance

Workshop etiquette
9
Remain on mute Use the Q&A function to ask questions
Webinar will be recorded

Section TitleWhat is social mobility?
10
Social mobility is the link
between a person’s
occupation or income and
the occupation or income
of their parents.
In other words, it's
about ensuring your
background
doesn't determine your
future.

Your voice: what you are doing
11
Last week we asked: what data activity/interventions does your organisation currently do to support your social mobility agenda?
Question asked Percentage of
respondents
Has a diversity and inclusion strategy 90%
Has set D&I targets 45%
Has set economic diversity targets 14%
Collects D&I data through an annual survey 50%
Records D&I data on its HR systems 68%
Collects specific social mobility data 47%
Collects specific social mobility data through an annual survey 24%
Records specific social mobility data on its HR system 37%
Uses the questions recommended by the SMC to collect social mobility data 27%
Shares the data findings internally within the business 40%
Publicly shares social mobility data 14%
Use data to help inform your success of attracting individuals from a lower socio-economic background 20%
Use data to help inform how people progress in your organisation 21%

Your voice: Your challenges
12
Nearly ½find it challenging knowing how to interpret data gained
¾feel there is a lack of understanding of what
to ask to obtain socio-economic diversity data
of current employers
80%tell us that your response rate for data
collection is low
83%feel there is little or no link between the data
you collect and your social mobility
interventions
13%feel your organisation understands the
importance of measuring socio-economic
data across the organisation

Our data question journey so far…
1
3
Fe
ed
ba
ck
Re
sp
on
se
Just 17% of employers in the
SMF’s index asked the best
question* - Survey too long
What about response rates?
What to do with the data?
Employers' toolkit
launched in
February 2020
The Key
Question
We created one key
question to
measure socio-
economic diversity
most accurately and
simply
We consulted;
• academic
experts
• think tanks
• charities
• employers
*Data from the Social Mobility Employer Index, produced by our partners at the Social Mobility Foundation
Endorsed by our partners:

Step 1: Ask the question
1
4
What was the occupation of your main
household earner when you were aged
about 14?

Modern professional & traditional professional occupations such as: teacher, nurse, physiotherapist, social
worker, musician, police officer (sergeant or above), software designer, accountant, solicitor, medical
practitioner, scientist, civil / mechanical engineer.
Senior, middle or junior managers or administrators such as: finance manager, chief executive, large
business owner, office manager, retail manager, bank manager, restaurant manager, warehouse manager.
What was the occupation of your main household
earner when you were aged about 14?
1
5
INTERMEDIATE
PROFESSIONAL
WORKING
CLASS
Small business owners who employed less than 25 people such as: corner shop owners, small plumbing
companies, retail shop owner, single restaurant or cafe owner, taxi owner, garage owner.
Clerical and intermediate occupations such as: secretary, personal assistant, call centre agent, clerical
worker, nursery nurse
Other: such as: retired, this question does not apply to me, I don’t know, I prefer not to say.EXCLUDE
Routine, semi-routine manual and service occupations such as: postal worker, machine operative, security
guard, caretaker, farm worker, catering assistant, sales assistant, HGV driver, cleaner, porter, packer, labourer,
waiter/waitress, bar staff.
Technical and craft occupations such as: motor mechanic, plumber, printer, electrician, gardener, train driver.
Long-term unemployed (claimed Jobseeker’s Allowance or earlier unemployment benefit for 1yr plus).
How to group responses from the key question.

Want to up your game?
16
Question 2
• Which type of school did you
attend for the most time
between the ages of 11 and
16?
Question 3
• If you finished school after
1980, were you eligible for
free school meals at any point
during your school years?
OPTIONAL - Question 4
(only for new graduate hires).
Did either of your parents attend
university and gain a degree (e.g.
BA/BSc or equivalent) by the time
you were 18?
*Visit www.socialmobilityworks.org/toolkit/measurement for the full text
Why ask?
This is a measure of extreme
economic disadvantage. It can
help you target outreach
programmes.
Why ask?
This measure shows
extreme economic and
cultural advantage. Just 7%
of people attend independent
schools and yet our research
with our partners at the
Sutton Trust show how over-
represented these groups
our in top jobs.
Ask these supplementary questions.
Why ask?
Being the ‘first in family’ to
attend signals a potential lack
of support to navigate
university and entry into the
graduate workforce.

Improve your response rates
17
The quality and value of the data you collect depends on high response rates
Eventually, make
responses to survey’s
compulsory but
always with ‘Prefer
not to say’ as an
option on the survey
Issues around data storage, use and confidentiality
are critically important. Be clear about this: who will
see data, how you will ensure anonymity, and how it
will be stored and used
Offer support and
encouragement to
managers,
especially where
response rates are
low
Set a clear and
transparent goal to
create a more socially
diverse and inclusive
workplace
Explain why this
information is important
and how it will drive
positive change
Use senior leaders to
act as role models
Applicants and
employees are more
likely to engage with
these questions if they
see them as part of an
integrated D&I strategy

Visit www.socialmobilityworks.org for best practice and case studies.
Collect, analyse, publish
18
Report three
groups:
• Professional
backgrounds
• Intermediate
backgrounds
• Working class
backgrounds
Ask yourself: is
our workforce
equal?
Which is the
dominant socio-
economic group?
Compare the % of
applicants and staff
members from
each background.
If your business
isn’t
representative of
the nation:
• Develop a
strategy
• Use our toolkit
Compare
your data
against the
national (and
industry)
benchmarks
Want to lead
best practice?
Publish your
data and invite
your supply
chain to ask the
question of their
workforce, too!

National benchmarks*
*Some industry benchmarks will also become available on our site as we release industry-specific toolkits
The key question – parental occupation at age 14

Step 2: Assess progression
20
Collect the data from the key question
Breakdown your current workforce: Split occupations in
your organisation by grade or seniority level (e.g. managing
director vs. associates etc.). Ensure you consider anonymity
– the ‘rule of thumb’ is not to analyse results below 10, so
group levels together if needed.
Analyse the data
Interpret the results
Understanding where those from lower
socio-economic backgrounds stop
progressing
Identify the barriers that are limiting upward mobility in your
organisation and use our toolkit to improve social
representation and inclusion across all levels of seniority.
Don’t just focus on getting in. Talented individuals from lower socio-economic backgrounds are often overlooked when it comes to moving up.
What percentage of people at each grade or seniority level
are in the three socio-economic background groups?
Is there equal or close to equal representation of socio-
economic backgrounds at each grade or seniority level?
Does your data have a ‘cliff edge’ effect, where those from lower
socio-economic backgrounds suddenly fall off, or a ‘pyramid’
effect, where they slowly fall off as you go higher in seniority?

21
Our research consistently shows those from working class backgrounds receive less training and apprenticeships
Analyse your overall apprenticeship and
training makeup by socio-economic
background as you would with your workforce,
using the key question.
Are there certain apprenticeships or training offers
that are over or under-represented by socio-
economic status?
Assess by level and completion
Look at the percentage of learners by socio-
economic background at each Level and who have
completed apprenticeships/training. Are they
proportionately represented?
Completion rates
Use your workforce data to look at who receives a
promotion or goes onto a higher level of apprenticeship
within a set period of time after they are done with their
training.
Progression
Get the overall picture
Step 3: Look at apprentices and training opportunities

Click to edit Master title styleThe scorecardA tool for mature organisations to track progress
22

The scorecard*
23
• Measure your progress, we have developed a scorecard with Key Performance Indicators in: outreach, hiring, progression, culture & leadership, advocacy and data.
• The targets have been set using data collected by our partners at the Social Mobility Foundation through their Social Mobility Employer Index.
• The scorecard will help you measure progress against set targets, drive constant improvements and assess yourself against leading practice of other employers in the Index.
*Download the scorecard here.

Socio-economic diversity and inclusion at the BBC
Andrew Young
Workforce Diversity & Inclusion Lead

2016 started collecting SED data from staff
2018 Culture and Career
Progression staff consultation
2021 Diversity and Inclusion Plan
Published
2021 staff census with new questions
2019 RAISED Network
established
Bridge Group research on the
experiencesof staff


OFFICIAL
Our progress and top tips to overcoming barriers to data collection
Cliff SaleHMRC Social Mobility Programme Lead

OFFICIAL
Data Driven Change
Quantitative Internal Surveys
Social Mobility Employer Index
Civil Service People Surveys Qualitative
Focus Groups & Informal Feedback
Online HR Data
ChangingPerceptions
Staff Network
Blended Comms
Channels
Talks
Awards and indices
Regional Leads
Champion & Allies
Nurturing Internal Talent
Stride
Private Offices
Internal Vacancies
HMRC SEB Profile
Apprentice-ships
Developm't Sessions
Attracting Diverse Talent
Graduate Outreach
Tax Facts
Work Experience
Apprentice-ships
Exceptions Progs
Schools Outreach
HMRC Social Mobility Data and Deliverables
OFFICIAL
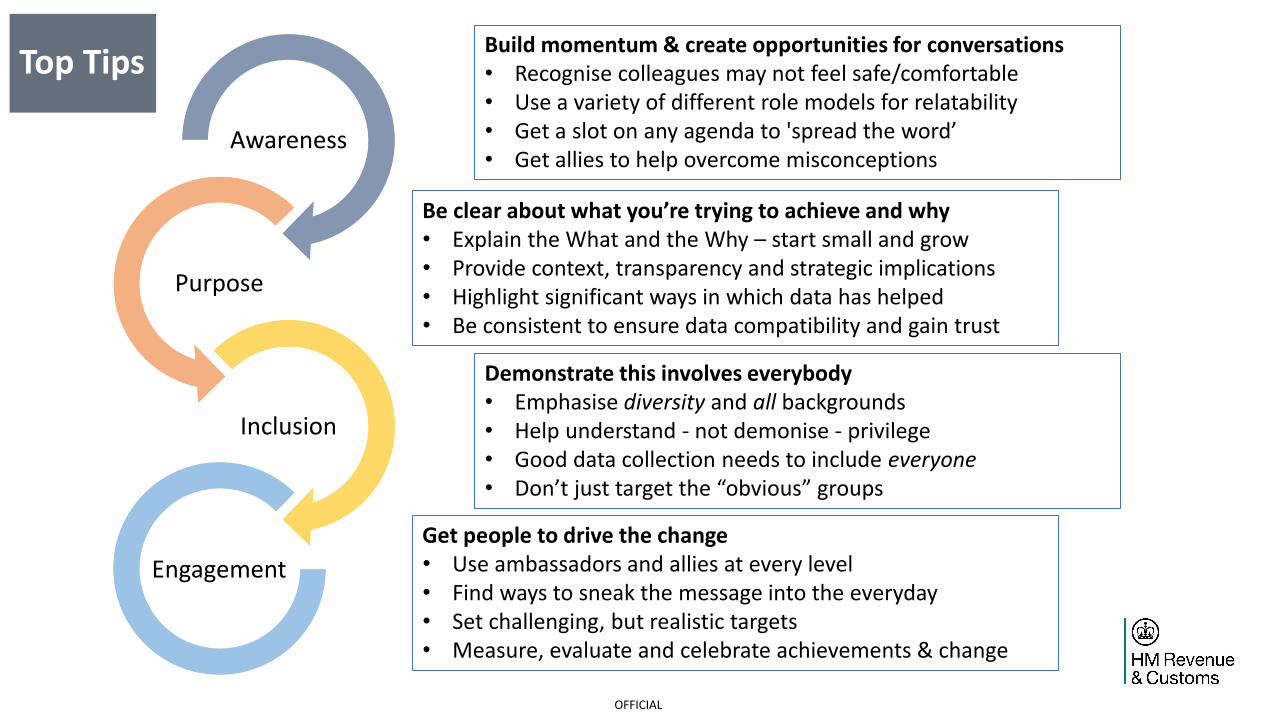
Awareness
Purpose
Inclusion
Engagement
Build momentum & create opportunities for conversations• Recognise colleagues may not feel safe/comfortable• Use a variety of different role models for relatability• Get a slot on any agenda to 'spread the word’• Get allies to help overcome misconceptions
Be clear about what you’re trying to achieve and why• Explain the What and the Why – start small and grow• Provide context, transparency and strategic implications• Highlight significant ways in which data has helped• Be consistent to ensure data compatibility and gain trust
Demonstrate this involves everybody• Emphasise diversity and all backgrounds• Help understand - not demonise - privilege• Good data collection needs to include everyone• Don’t just target the “obvious” groups
Get people to drive the change• Use ambassadors and allies at every level• Find ways to sneak the message into the everyday• Set challenging, but realistic targets• Measure, evaluate and celebrate achievements & change
Top Tips

Heather Carey
Director, Work Advance
Social Mobility Employers Masterclass
Series: Data
25th March 2021
Using data to catalyse
industry leadership on
social mobility: an
example from the UK
Creative Industries
www.pec.ac.uk
@CreativePEC
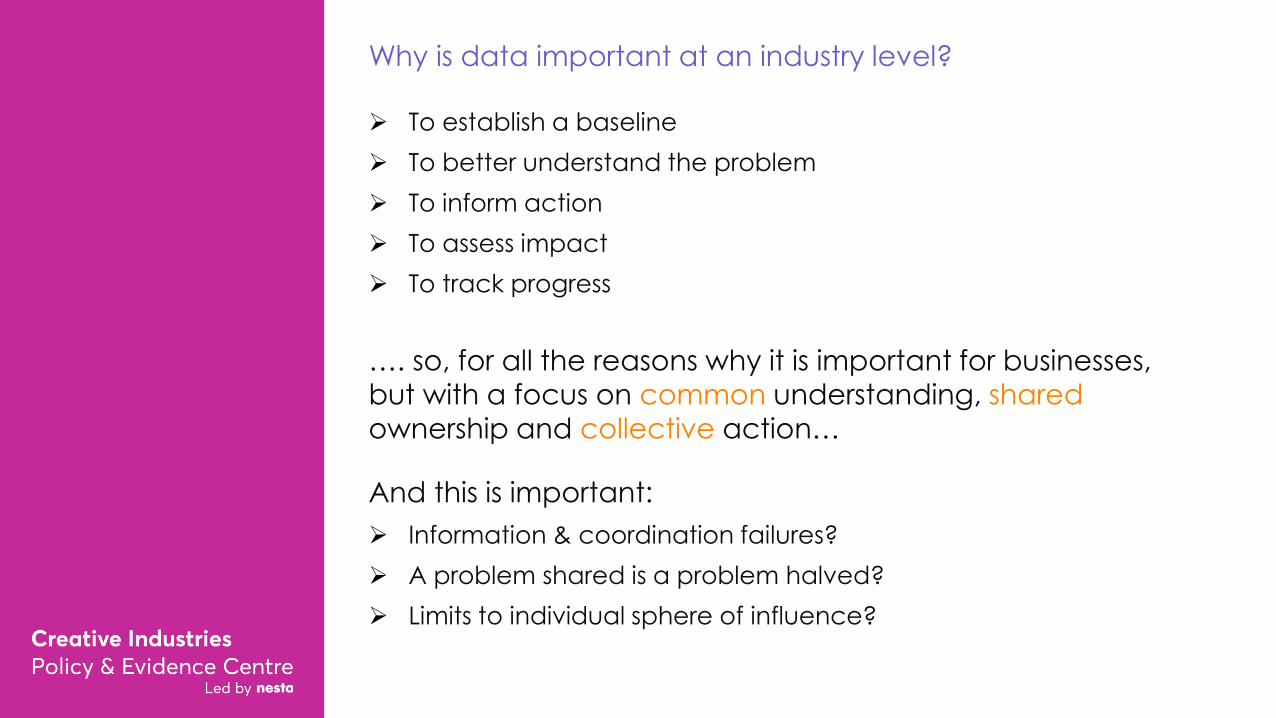
Why is data important at an industry level?
➢ To establish a baseline
➢ To better understand the problem
➢ To inform action
➢ To assess impact
➢ To track progress
…. so, for all the reasons why it is important for businesses, but with a focus on common understanding, shared
ownership and collective action…
And this is important:
➢ Information & coordination failures?
➢ A problem shared is a problem halved?
➢ Limits to individual sphere of influence?

The PEC’s Class in the Creative
Industries programme
“catalyse collaborative action –
led by industry, trade bodies,
wider stakeholders and
Government – to test and trial
new policy, programmes and
practices that promote socio-
economic inclusion in the
Creative Industries; to show
leadership as an industry on the
vital issue of social mobility in
the UK”
Phase 1: Getting in & getting on
What: Establish a baseline picture of the
participation and progression of those from
working-class backgrounds in the CIs
How:
➢ We explored class composition in the
workforce and select measures of job quality, using the Labour Force Survey
➢ We explored additional measures of job quality, retention and progression, using the
longitudinal survey Understanding Society
waves from 2009-17
➢ We used parental occupation at 14 to derive
NSSEC categories to differentiate three class
backgrounds: privileged, intermediate and working class

Class in the CIs: 5 key facts
1. There are widespread & persistent class imbalances in the Creative Industries
2. Those from privileged backgrounds dominate key creative roles

3. Class isn’t the only
factor at play &
interacts with other
characteristics –
such as gender,
ethnicity, disability
and skill levels – to
create ‘double
disadvantage’
4. Those from
working-class
backgrounds also
experience
differences in job
quality &
progression
Odds and odds ratios of being employed in creative occupations, 2019

5. Despite growing awareness & action, the likelihood of someone from a working-class
background finding work in a creative occupation has remained largely unchanged

So what started with data is now… PEC Class and Social Mobility in the UK Creative industries programme
Phase 2 of the programme will:
1. Establish a clear & coherent narrative of the underlying
causes of class imbalances
2. Consider the nuances, in 4 key
parts of the CIs: screen,
publishing, advertising and
Fashion
3. Review current policy,
programmes & practice, identify how we can more effectively
shift the dial on diversity

Any questions for our speakers?
37
Heather Carey
Director
Work Advance
Andrew Young
Diversity Lead,
Workforce
BBC
Cliff Sale
Social Mobility
Programme Lead,
HMRC
Abeda Malek
Statistician
HMRC
Social Mobility Employers Masterclass 2021 Series: Data
Mareen Birresborn, Senior Employer Relations Officer and Index Lead


It’s free of charge, you can enter anonymously and your organisation will receive a comprehensive
audit
• Many organisations have found it useful in forming their social mobility strategy or monitoring the
progress of their existing work
Clients care about social mobility
• 86% of last year’s entrants said that their clients care about the socioeconomic background of their
workforce
Be a trailblazer for diversity and social mobility
• If you join, others will follow and take action
To find the UK’s best talent
• Taking part in the Index is a great way to find out if your recruitment approach is getting you the best
available talent
Why take part in the Social Mobility Employer Index?

• Submissions are open now and close on 28th May
• Over the summer we mark the responses and benchmark submissions
• In September/October you will receive a tailored feedback report detailing how your organisation
performed in each section and the offer of a meeting to discuss the findings
• We announce the Top 75 and a key findings report in October/November
The SMF is on hand to help
How it works: the process

Outreach with
young people
Routes into
the employerAttraction
Recruitment and
selection
Data
collection
Progression,
culture and
experienced
hires
AdvocacyEmployee
survey (optional)

Register your interest in joining
the Social Mobility Employer Index 2021:
socialmobility.org.uk/index/
Joining the 2021 Index
March 2021

Dates for your diary
44
• Over 500 entries from across the UK, from a range of sectors 12 categories to enter
• Independent judging panel of leading figures from business and other sectors
The UK Social Mobility Awards are opening for entries soon.
UK Social Mobility Awards

Click to edit Master title style
45
@SMCommission Social Mobility Commission @socialmobilitystories
#socialmobility #GettingInGettingOn www.socialmobilityworks.org
Masterclass: Progression Thursday April 22nd 2-3:30pm
Register Now