data transfer in a motorbike test bed - theseus
TRANSCRIPT

___. ___. ______ ________________________________
Valitse kohde.
Data Transfer in a Motorbike Test Bed
Olusegun E. Okedara
Bachelor’s Thesis
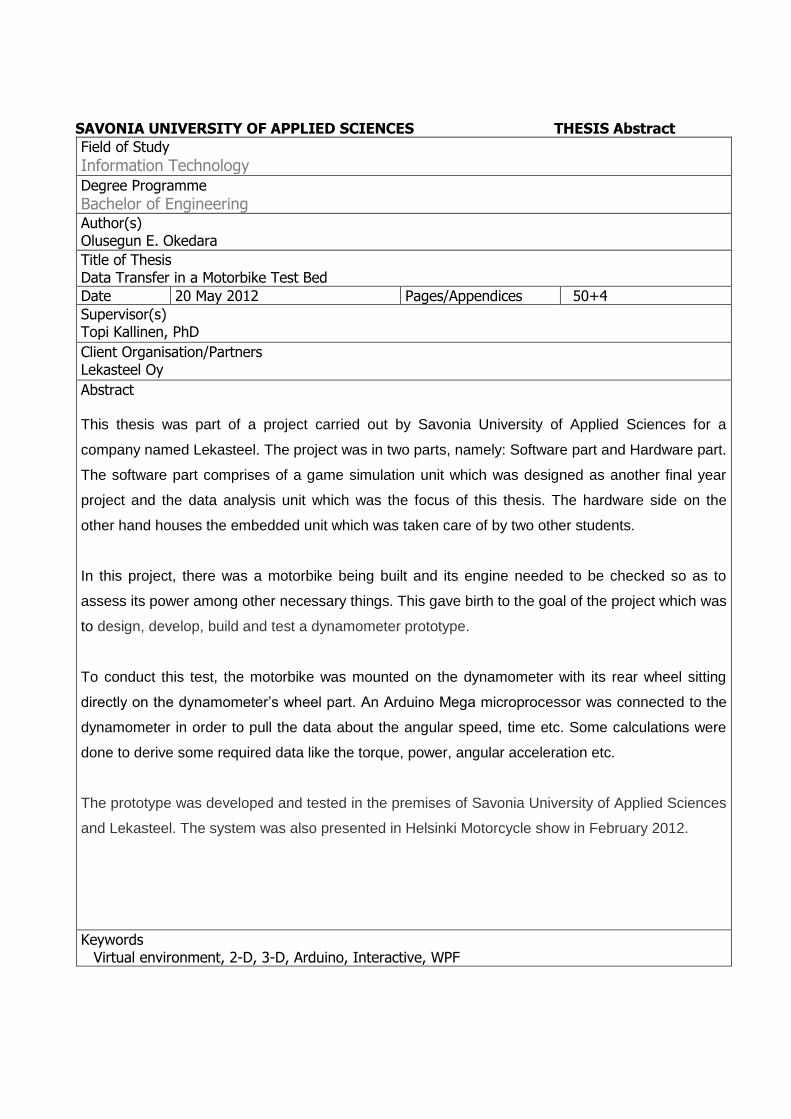
SAVONIA UNIVERSITY OF APPLIED SCIENCES THESIS Abstract
Field of Study
Information Technology
Degree Programme
Bachelor of Engineering
Author(s) Olusegun E. Okedara Title of Thesis Data Transfer in a Motorbike Test Bed
Date 20 May 2012 Pages/Appendices 50+4
Supervisor(s) Topi Kallinen, PhD Client Organisation/Partners Lekasteel Oy Abstract This thesis was part of a project carried out by Savonia University of Applied Sciences for a
company named Lekasteel. The project was in two parts, namely: Software part and Hardware part.
The software part comprises of a game simulation unit which was designed as another final year
project and the data analysis unit which was the focus of this thesis. The hardware side on the
other hand houses the embedded unit which was taken care of by two other students.
In this project, there was a motorbike being built and its engine needed to be checked so as to
assess its power among other necessary things. This gave birth to the goal of the project which was
to design, develop, build and test a dynamometer prototype.
To conduct this test, the motorbike was mounted on the dynamometer with its rear wheel sitting
directly on the dynamometer’s wheel part. An Arduino Mega microprocessor was connected to the
dynamometer in order to pull the data about the angular speed, time etc. Some calculations were
done to derive some required data like the torque, power, angular acceleration etc.
The prototype was developed and tested in the premises of Savonia University of Applied Sciences
and Lekasteel. The system was also presented in Helsinki Motorcycle show in February 2012.
Keywords Virtual environment, 2-D, 3-D, Arduino, Interactive, WPF
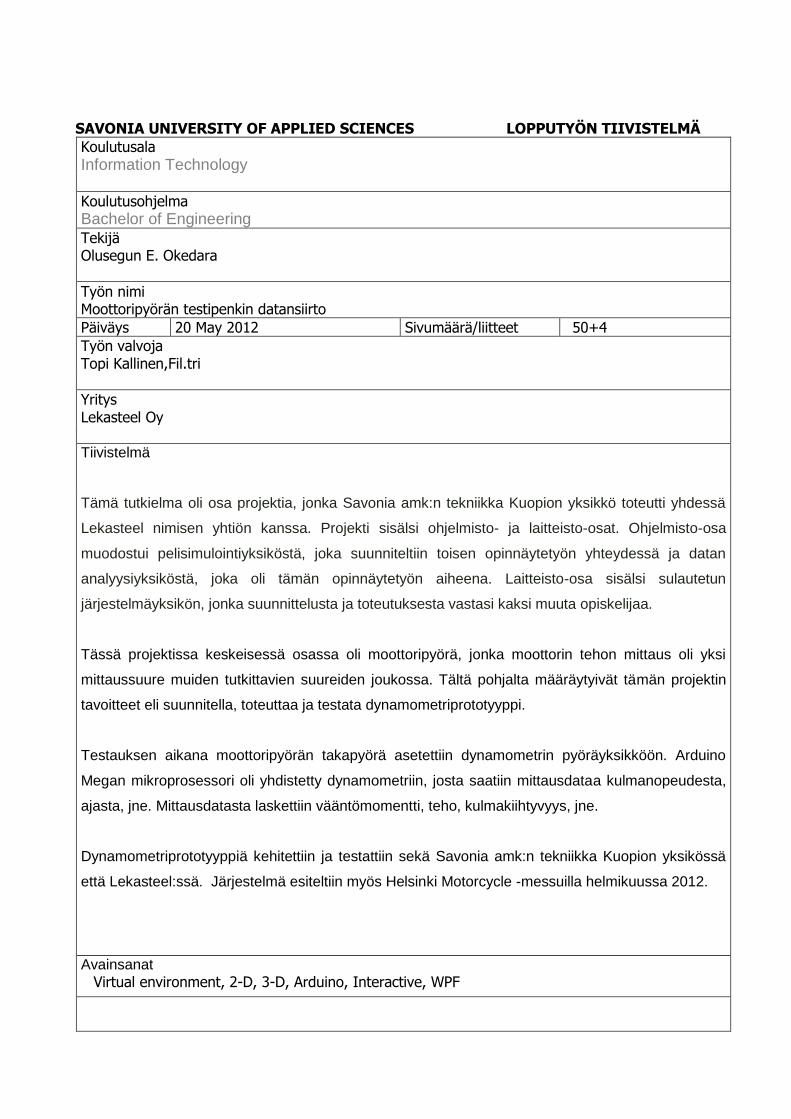
SAVONIA UNIVERSITY OF APPLIED SCIENCES LOPPUTYÖN TIIVISTELMÄ
Koulutusala
Information Technology
Koulutusohjelma Bachelor of Engineering
Tekijä Olusegun E. Okedara
Työn nimi Moottoripyörän testipenkin datansiirto
Päiväys 20 May 2012 Sivumäärä/liitteet 50+4
Työn valvoja Topi Kallinen,Fil.tri
Yritys Lekasteel Oy Tiivistelmä
Tämä tutkielma oli osa projektia, jonka Savonia amk:n tekniikka Kuopion yksikkö toteutti yhdessä
Lekasteel nimisen yhtiön kanssa. Projekti sisälsi ohjelmisto- ja laitteisto-osat. Ohjelmisto-osa
muodostui pelisimulointiyksiköstä, joka suunniteltiin toisen opinnäytetyön yhteydessä ja datan
analyysiyksiköstä, joka oli tämän opinnäytetyön aiheena. Laitteisto-osa sisälsi sulautetun
järjestelmäyksikön, jonka suunnittelusta ja toteutuksesta vastasi kaksi muuta opiskelijaa.
Tässä projektissa keskeisessä osassa oli moottoripyörä, jonka moottorin tehon mittaus oli yksi
mittaussuure muiden tutkittavien suureiden joukossa. Tältä pohjalta määräytyivät tämän projektin
tavoitteet eli suunnitella, toteuttaa ja testata dynamometriprototyyppi.
Testauksen aikana moottoripyörän takapyörä asetettiin dynamometrin pyöräyksikköön. Arduino
Megan mikroprosessori oli yhdistetty dynamometriin, josta saatiin mittausdataa kulmanopeudesta,
ajasta, jne. Mittausdatasta laskettiin vääntömomentti, teho, kulmakiihtyvyys, jne.
Dynamometriprototyyppiä kehitettiin ja testattiin sekä Savonia amk:n tekniikka Kuopion yksikössä
että Lekasteel:ssä. Järjestelmä esiteltiin myös Helsinki Motorcycle -messuilla helmikuussa 2012.
Avainsanat
Virtual environment, 2-D, 3-D, Arduino, Interactive, WPF
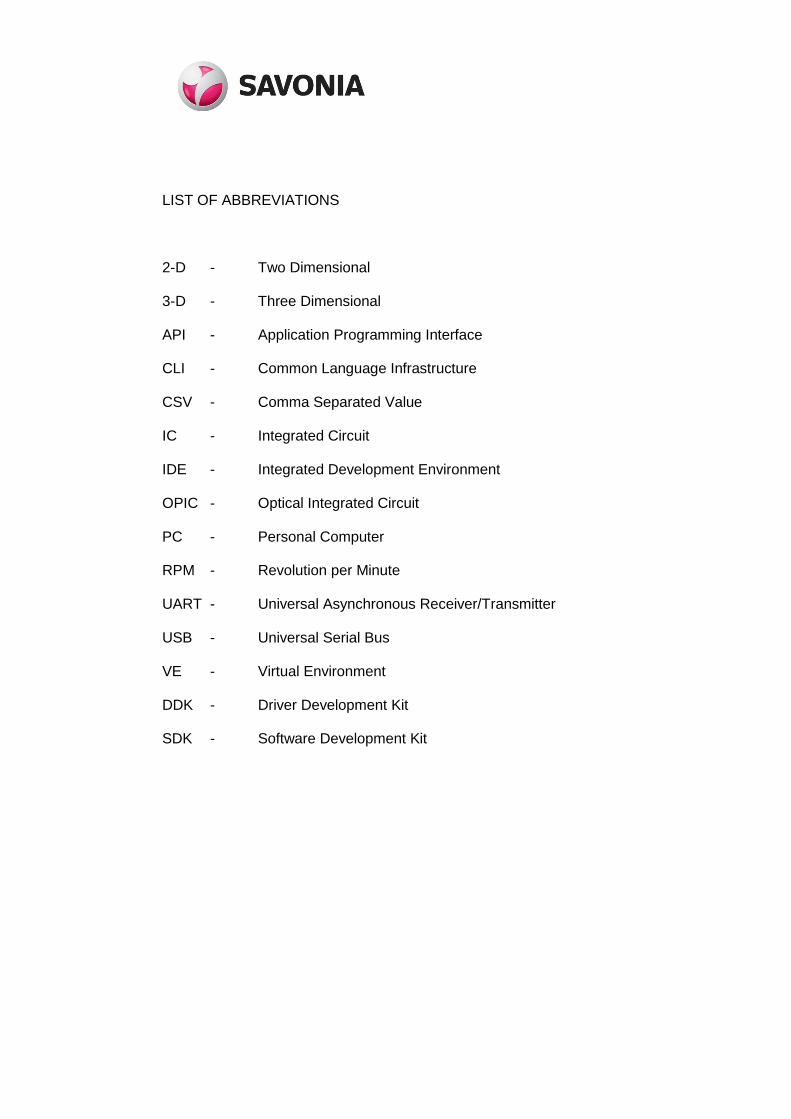
LIST OF ABBREVIATIONS 2-D - Two Dimensional 3-D - Three Dimensional API - Application Programming Interface CLI - Common Language Infrastructure CSV - Comma Separated Value IC - Integrated Circuit IDE - Integrated Development Environment OPIC - Optical Integrated Circuit PC - Personal Computer RPM - Revolution per Minute UART - Universal Asynchronous Receiver/Transmitter USB - Universal Serial Bus VE - Virtual Environment DDK - Driver Development Kit SDK - Software Development Kit

Acknowledgements
Aside my own efforts, the success of this project also depended largely on the
encouragement and guidance of many others. I would like to use this opportunity to
express my sincere gratitude to the people who have been instrumental in the
successful completion of this project.
I would like to show my appreciation to my supervisor, Dr. Topi Kallinen. I cannot thank
him enough for his tremendous support and help. Without his encouragement and
guidance, this project would not have materialized.
My appreciation goes to the head of my department, Mr Arto Toppinen, who made it
possible for me to participate in this work.
Finally, I would like to express my gratitude to my parents who brought me up in the way
of the Lord and my younger ones for their support. I really appreciate my family and
friends back at home and here in Finland for their support and also my very best friend,
Treasure.
Kuopio, 20 May, 2012

TABLE OF CONTENTS
1 INTRODUCTION ............................................................................................. 8
2 PRELIMINARY ANALYSIS ............................................................................... 10
2.1 Project Description .................................................................................. 10
2.1.1 Purpose of the Test ....................................................................... 10
2.1.2 Project Structure ........................................................................... 10
2.2 Preparation Ahead .................................................................................. 11
2.2.1 Getting the Needed Software ......................................................... 11
2.2.2 About Programming Language ....................................................... 15
3 CHALLENGES ENCOUNTERED ........................................................................ 16
3.1 About Data Transfer ............................................................................... 16
3.1.1 Choice of Micro-Controller .............................................................. 16
3.1.2 Serial Communication .................................................................... 16
3.2 About Data Analysis and Graph Plotting Tools ........................................... 17
4 EQUIPMENT ................................................................................................. 19
4.1 Hardware Unit ........................................................................................ 19
4.1.1 Inertial Dynamometer .................................................................... 19
4.1.2 Arduino Mega 2560 ....................................................................... 20
4.1.3 Interface Card .............................................................................. 21
4.1.4 Arduino IDE .................................................................................. 22
4.2 Software Unit ......................................................................................... 23
4.2.1 C# Language ................................................................................ 23
4.2.2 Windows Presentation Foundation .................................................. 24
4.2.3 Unity Game Engine ........................................................................ 24
5 HARDWARE & SOFTWARE LINK ..................................................................... 26
5.1 Data Transfer ......................................................................................... 26
5.1.1 Electronics Section ........................................................................ 29
5.1.2 Software Section ........................................................................... 29
5.1.3 Sensors’ Data Flow ........................................................................ 29
5.2 Dynamometer Physics ............................................................................. 39
6 TESTS .......................................................................................................... 40

6.1 Intra-Unit Tests ...................................................................................... 40
6.1.1 Arduino Test with Random Numbers ............................................... 40
6.1.2 Graphical Analysis Test with Random Numbers ................................ 43
6.2 Inter-Unit Test ....................................................................................... 44
6.3 Noise and Signal Errors ........................................................................... 46
7 CONCLUSION ............................................................................................... 48
REFERENCES .................................................................................................... 49
APPENDIX 1: Arduino Code for Random Numbers ................................................ 51
APPENDIX 2: Code for Reading from Arduino and Writing into File ........................ 52
APPENDIX 3: Code for plotting the Graph with WPF ............................................. 53
8
1 INTRODUCTION
The need to carry out a proper test on a vehicle without taking it onto the road has
made dynamometer become a household name in automobile industries. The Inertia
dynamometer is fast becoming the preferred choice for obtaining the most accurate
results in dyno testing in automobile industries. Inertia dynos simulate the conditions
created when accelerating an engine, therefore giving more reliable results.
During the period at which the engine is being accelerated, the dynamometer
absorbs some needed data. This data is then passed onto the embedded side where
necessary analysis is carried out in order to generate the needed data to be analyzed
on the software part. Parts of these data are: revolution per minute (rpm), torque and
power. The generated data is then analysed and presented in a graphical format.
This thesis focuses on the unit that handles the data analysis and gets it displayed in
a graphical format on the computer screen. The unit is part of the software section
where there was also the game simulation unit. These units have different software
applications running on a dedicated computer. The computer that houses these two
applications will have to communicate with the microprocessor and read the needed
data through its usb port, possibly as a serial communication.
After succeeding in getting the computer and the microprocessor to communicate
with each other, then it is time for the data to be analyzed and presented in a
graphical format like in Figure1. This gives the necessary information which is useful
in fine-tuning the engine and safer since it is totally an off-road test.

9
FIGURE 1. Sample dyno plot (Bimmer Forums 2008)
10
2 PRELIMINARY ANALYSIS
2.1 Project Description
2.1.1 Purpose of the Test
A dynamometer or a dyno as it might be called is mainly about performance in the
world of automobiles. A dynamometer is mechanical tool used in getting some
information about the torque produced by an engine (King, P, J. Burnham, K. J. 1991,
1). This test is for the purpose of tuning up and adding more to the power and torque
of an already built motorcycle. The purpose was to design and build a dyno system
that collects motorcycle run-time information. The measurement targets are power,
torque, engine speed, and the oxygen to air mixture ratio. The device is also suitable
for adjusting and test-running. The device is a prototype, the first of its kind in the
driving simulator for motorcycles in Finland. The system can be tested in a variety of
wheel types, as the customer's bike is easily mounted on the adjustable platform.
2.1.2 Project Structure
This project is divided into four major units:
- The first unit deals with the building of the motorcycle.
- The second unit deals with the analysis in the microprocessor side, which is
directly connected to the motorcycle.
- The third unit deals with the building of the virtual road-platform for the
motorcycle.
- The fourth unit deals with the analysis of the data and its graphical
presentation.
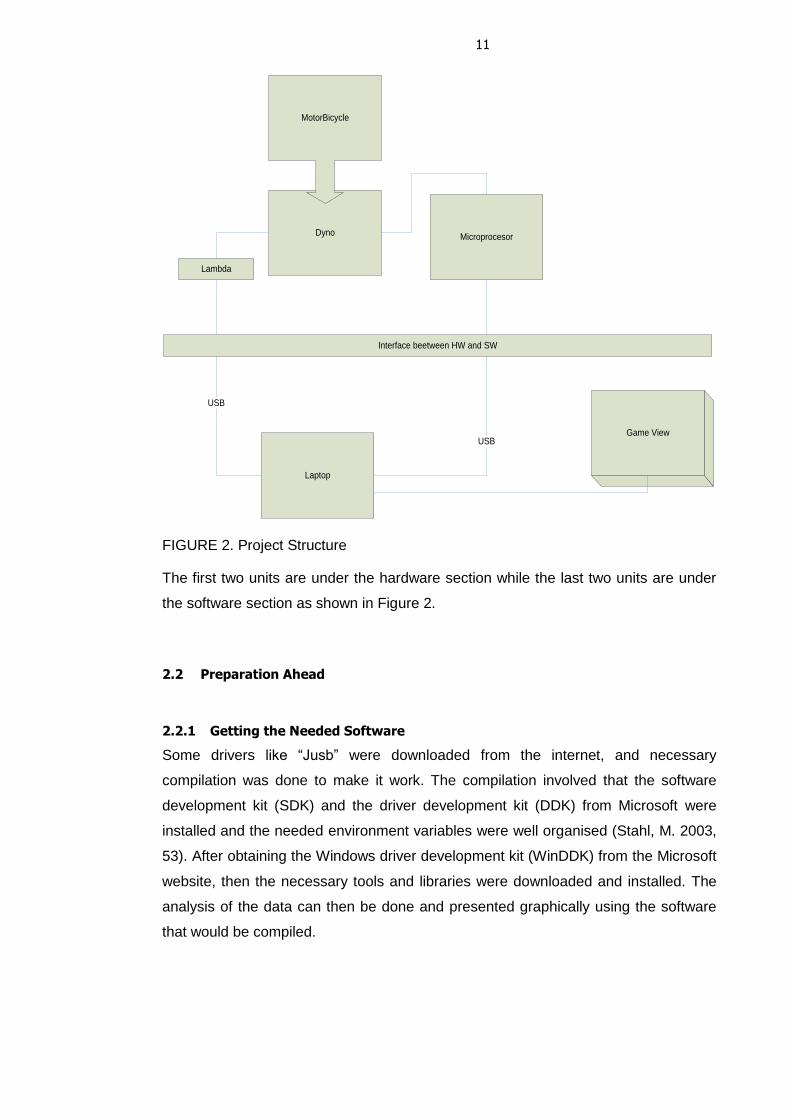
11
Dyno
MotorBicycle
Microprocesor
Lambda
Laptop
USB
USBGame View
Interface beetween HW and SW
FIGURE 2. Project Structure
The first two units are under the hardware section while the last two units are under
the software section as shown in Figure 2.
2.2 Preparation Ahead
2.2.1 Getting the Needed Software
Some drivers like “Jusb” were downloaded from the internet, and necessary
compilation was done to make it work. The compilation involved that the software
development kit (SDK) and the driver development kit (DDK) from Microsoft were
installed and the needed environment variables were well organised (Stahl, M. 2003,
53). After obtaining the Windows driver development kit (WinDDK) from the Microsoft
website, then the necessary tools and libraries were downloaded and installed. The
analysis of the data can then be done and presented graphically using the software
that would be compiled.

12
About Jusb
The core Java USB API comes up with a host that takes good care of all USB buses.
That host also has the responsibility of monitoring the USB devices on the Java side
and sending notification whenever a device is attached or detached. This is similar to
the work of the USB hub driver (USBHUB.sys) and the USB driver (USBD.sys) as
displayed in the USB driver stack (see Figure 3). (Stahl, M. 2003)
FIGURE 3. Windows USB driver stack (Stahl, M. 2003)

13
Figure 4 shows the USB API for Windows with all the detailed information about the
User Mode and the Kernel Mode.
FIGURE 4. Java USB API layer for windows (Stahl, M. 2003)

14
Figure 5 shows the comprehensive view of the USB class with all the interactions. It
gives detailed information about the working principle of a USB.
FIGURE 5. USB class overview with its interaction (Stahl, M. 2003)

15
Windows DDK & SDK
The Microsoft Windows SDK is a class of needed tools that developers use when
creating applications that are to be installed on operating systems for Windows. The
Windows Driver Kit (WDK) on the other hand includes the tools and documentation
needed to develop drivers. (Microsoft page 2011)
2.2.2 About Programming Language
Programming is the core of this thesis as the graphical analysis requires writing some
codes to do the presentation as expected. In deciding which programming language
to choose, one major issue considered was getting a suitable language that works
fine with serial data transfer between two systems. As shown in Figure 2, this part of
the project is under the software section which mainly depends on programming.
Software refers to the set of computer programs well arranged with the procedures
that explain how they are to be used. It can be referred to as the collection of
programs, which add to the capabilities of the hardware. The process of software
development is referred to as programming. The type of job needed to be done
determines the particular programming language in which instructions will be written.
For this project, some programming languages were considered, namely: Java
language, C# language, Processing and Python.

16
3 CHALLENGES ENCOUNTERED
3.1 About Data Transfer
3.1.1 Choice of Micro-Controller
The choice of the Micro-Controller to be used was the first hurdle in this project.
Object oriented programmable integrated circuit (Oopic), the first programmable
microcontroller to make use of object oriented language (Robot Builder’s Bonanza
2001) was first considered. Later came the other option of using the Arduino Micro-
Controller which has an IDE that is compatible with applications on different platform
(Kioumars, A. H. Tang, L. 2011, 2).
With its simplicity but yet powerful environment making it possible for user programs
to be easily sketched, Arduino looked like the best option. After much consideration,
Arduino was chosen as the preferred Micro-Controller for the project.
3.1.2 Serial Communication
After the Arduino choice was confirmed, the work on the driver package had to be
suspended. That was done since the Arduino Micro-Controller has the ability of
transmitting data onto the serial port (Kioumars, A. H. Tang, L. 2011, 2) through the
usb cable attached to the Arduino board and the computer port.
Then, the next challenge was to write some codes to read data from the Arduino
through the serial port. A package called Processing which communicates well with
Arduino was first selected. Processing is a programming language and also a
development environment that has promoted software literacy (Mediawiki 2010).
Processing is an open source package that can run on different operating systems
and that makes it more interesting.
As interesting as it was, some other means in terms of programming language were
considered before taking the final decision to settle for C-Sharp. C-Language and
Java were the languages that were considered at the initial stage but after some trials
on those languages, they were dropped. Quitting those languages did not just
happen but was born out of information that was derived about Windows and those
programming languages as regards serial port applications.

17
That brought about C-Sharp language which is more compatible with serial port
applications. Applications can be developed using c-sharp language in visual c-sharp
or visual studio environment. For this reason, some tutorials were followed on C-
Sharp, and it has been just a bit stressful but interesting and remarkable learning
experience.
3.2 About Data Analysis and Graph Plotting Tools
Generating a graph from a set of data is a task that is frequent in software
development. From experience, the most usual method is by importing data into an
Excel sheet, after which one can then produce the graph using the Excel built-in
graph analysis features. It is suitable in most cases, but when it requires a real-time
plot i.e. the data changes frequently, it can be so frustrating.
This brought about the next challenge in line, which is about getting the graphical
analysis of the data displayed on the computer screen. Some studies were done
concerning the real time graph libraries. Some real time graph libraries were
considered, which are: LiveGraph, NPlot and ZedGraph.
During the process of learning and applying those graph libraries to do some
analysis, ZedGraph was chosen as the best option. Then after some consultations,
there came some information about Windows Presentation Foundation (WPF). At this
point the processing package had been placed aside since it could only offer less
compared to any of those plotting tools.
LiveGraph
LiveGraph is a framework which is Java-based and can run on any computer system
and this framework is for real-time data visualisation. Data is stored in csv file-format
for onward processing by the LiveGraph. (SourceForge 2011)
NPlot
NPlot is an open source charting library for the .NET framework with an interface that
is simple to use. One good point to note about NPlot is its ability to quickly create

18
charts for the purpose of data analysis and the library's flexibility makes it a great
choice for creating charts even just as you want it to be. (Nplot page 2011)
ZedGraph
“ZedGraph is a class library, Windows Forms UserControl, and ASP web-accessible
control for creating 2D line, bar, and pie graphs of arbitrary datasets” (Code Project
2007). The classes are very flexible in that nearly everything about the graph can be
modified by the user. There are already set value for every graph attributes and that
talk about its simplicity. The classes consists of code for making suitable scale
ranges and step sizes depending on the data range being analysed. ZedGraph can
be used with .NET 2.0, and VS .NET 2005. (Code Project 2007)

19
4 EQUIPMENT
4.1 Hardware Unit
4.1.1 Inertial Dynamometer
A dynamometer is a device which is used for measuring the power output of an
engine. In the world of automobiles, a dynamometer is used to test engines and bikes
mainly for the purpose of tuning and for needed diagnostics to be carried out. There
are two types of dynamometer namely:
Engine dyno: the engine has to be all by itself connected to the dynamometer,
which means that it has to be removed from the motorbike.
Chasis dyno: measures power at the wheels, usually by having the vehicle drive
on a single roller or between a set of rollers.
Going deeper on the chasis dyno, it is also divided into two categories namely:
Inertial dyno: The motorbike turns the roller and accelerates from a known
revolution per minute (rpm), and the electronics part gets the speed data from
the roller and uses it with the known roller inertia. After which the computer is
able to know the torque that has been supplied by the wheel during the process
of accelerating the roller. The roller diameter and the engine rpm are used in
getting the reduction ratio after which the horsepower (HP) and the torque of the
engine are calculated. The drum is accelerated by the bike’s power which is
dissipated when the drum’s speed is reduced.
Brake dyno: The roller is lighter compared to that of inertial dyno. A certain rpm
is set after which the motorbike accelerates to that already set rpm and then the
brake holds the engine at that rpm. The torque that the wheel exerts on the
drum is derived by applying a regulated counter-torque. Transducers are used
to measure the braking force, which must be calibrated. (TripleZee Cycles)
20
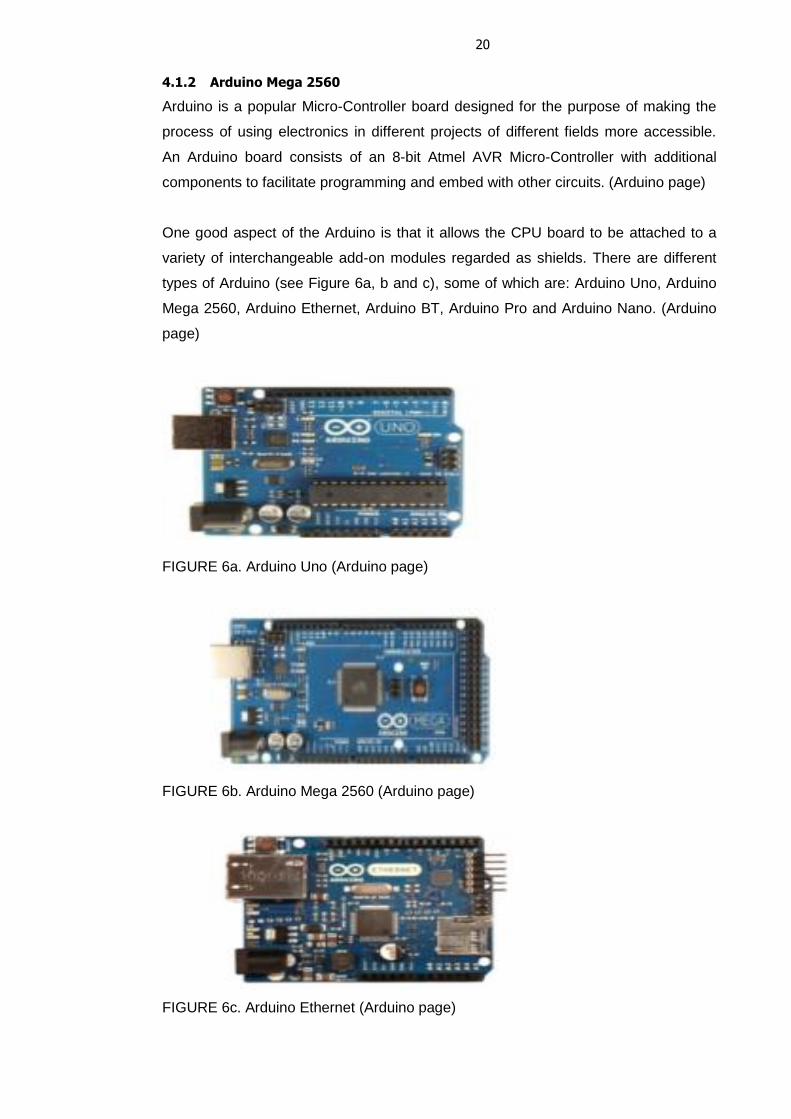
4.1.2 Arduino Mega 2560
Arduino is a popular Micro-Controller board designed for the purpose of making the
process of using electronics in different projects of different fields more accessible.
An Arduino board consists of an 8-bit Atmel AVR Micro-Controller with additional
components to facilitate programming and embed with other circuits. (Arduino page)
One good aspect of the Arduino is that it allows the CPU board to be attached to a
variety of interchangeable add-on modules regarded as shields. There are different
types of Arduino (see Figure 6a, b and c), some of which are: Arduino Uno, Arduino
Mega 2560, Arduino Ethernet, Arduino BT, Arduino Pro and Arduino Nano. (Arduino
page)
FIGURE 6a. Arduino Uno (Arduino page)
FIGURE 6b. Arduino Mega 2560 (Arduino page)
FIGURE 6c. Arduino Ethernet (Arduino page)

21
Arduino Mega 2560 comes with fifty-four digital input/output pins. Fourteen of those
can be used as PWM outputs. Connecting the board to the computer through the usb
cable is enough to power it but can also use AC-DC adapter. Arduino Mega2560 has
the capabilities for exchanging information with a computer, another Arduino, or other
microcontrollers. (Arduino page)
4.1.3 Interface Card
The interface card is a printed circuit board (see Figure 7a and b), which gives the
provision for an interface between the sensors and the Micro-Controller. The sensors
will be linked to the Micro-Controller through the interface card.
FIGURE 7a. Top & side view of the interface card (Polat 2012)
FIGURE 7b. Aerial view of the interface card (Polat 2012)

22
4.1.4 Arduino IDE
FIGURE 8. Arduino development environment (University of California, Berkeley
2012)
Figure 8 shows those seven commands that can be used with the Arduino IDE.
I. Serial Monitor is for opening the debugging tool on the Arduino and for
displaying information sent from the Arduino Mega 2560 to the computer.
II. Upload is for compiling the program named “sketch” with their file extension
as .ino, and also for sending it to the board if free of compile-time errors.
III. Save is for saving the sketch.
IV. Open is for opening an existing sketch.
V. New is for creating a new sketch.
VI. Stop is for interrupting the compilation of the code.
VII. Compile is for compiling the sketch in order to check for compile-time errors.
(University of California, Berkeley 2012)
23
4.2 Software Unit
4.2.1 C# Language
The reason behind the evolvement of programming is due to the fact that computers
only have the ability to carry out instructions that are written in digits 0 and 1 to be
precise. This form of instruction is known as machine language while humans
communicate using words. During the early days of computers, programmers had to
input machine codes into computers which used to be a tedious process indeed.
Thereafter comes a piece of software referred to as assembler, which merge some
commands that are readable by human with the machine code which goes along with
it. This process then brought about what is referred to today as assembly Language.
(Techotopia 2009)
Next in line are some high level languages developed to make it easier for humans
when writing programs. One of such languages is called C which was developed at
AT&T Bell Labs between late 1960s and early 1970s. C++ came to be as a result of
some programmers’ effort in the late 1970s and early 1980s to have an object
oriented approach to C programming language. These languages never exist without
their respective short-comings. One major problem with those compiled languages is
about the source code which needs to be re-compiled for each different processor
type. (Techotopia 2009)
Due to the above stated problem, Sun Microsystems commenced the development of
a new language and development environment in 1990 which gave birth to the
language named Java. Java is a programming language in which many of the
problems of C++ are addressed. Java gained rapid acceptance and even Microsoft
embraced it. When Microsoft embraced Java, Sun was happy but had to quit that
relationship when they realized that Microsoft was planning to bring up their own
version of that language. Not long after, Microsoft started something called .Net, after
which the language named C# came to be. (Techotopia 2009)
C# is regarded as a multi-purpose programming language which is object oriented. It
behaves like Java except that its variable types are derived from a common ancestor
class. (Bolton, D. 2011)

24
4.2.2 Windows Presentation Foundation
Windows Presentation Foundation (WPF) is a computer-software developed by
Microsoft for rendering user interfaces in windows-based applications. WPF can be
used to create different applications, ranging from standalone to browser-hosted
applications. WPF is designed to utilize the advantage of modern graphics hardware.
It has different features, some of which include Extensible Application Markup
Language (XAML), data binding, layout, 2-D and 3-D graphics, animation, templates,
media and typography. WPF is among the Microsoft .NET Framework, which makes
it possible to build applications that incorporate other elements of the .NET
Framework class library. (Microsoft page 2012)
4.2.3 Unity Game Engine
There are more than one means of terrain generation, but one which is popularly
used in game industries is the procedural technique. It involves the use of computer
programs in terrain generation, and it is easier to use. One example of such is
referred to as Unity game engine. (Ashaolu, P. 2012, 16)
Unity helps users to create the best interactive entertainment or multimedia
experience as much as they can. It is designed by Unity Technologies and
incorporates a physics engine known as the nVidia PhysX (Craighead, J. Burke, J.
and Murphy R. 2007, 2). Unity consists of both an editor for developing content and a
game engine for executing the final product.

25
FIGURE 9. Unity3d terrain generation (Source: Education Scotland, UK)
26
5 HARDWARE & SOFTWARE LINK
5.1 Data Transfer
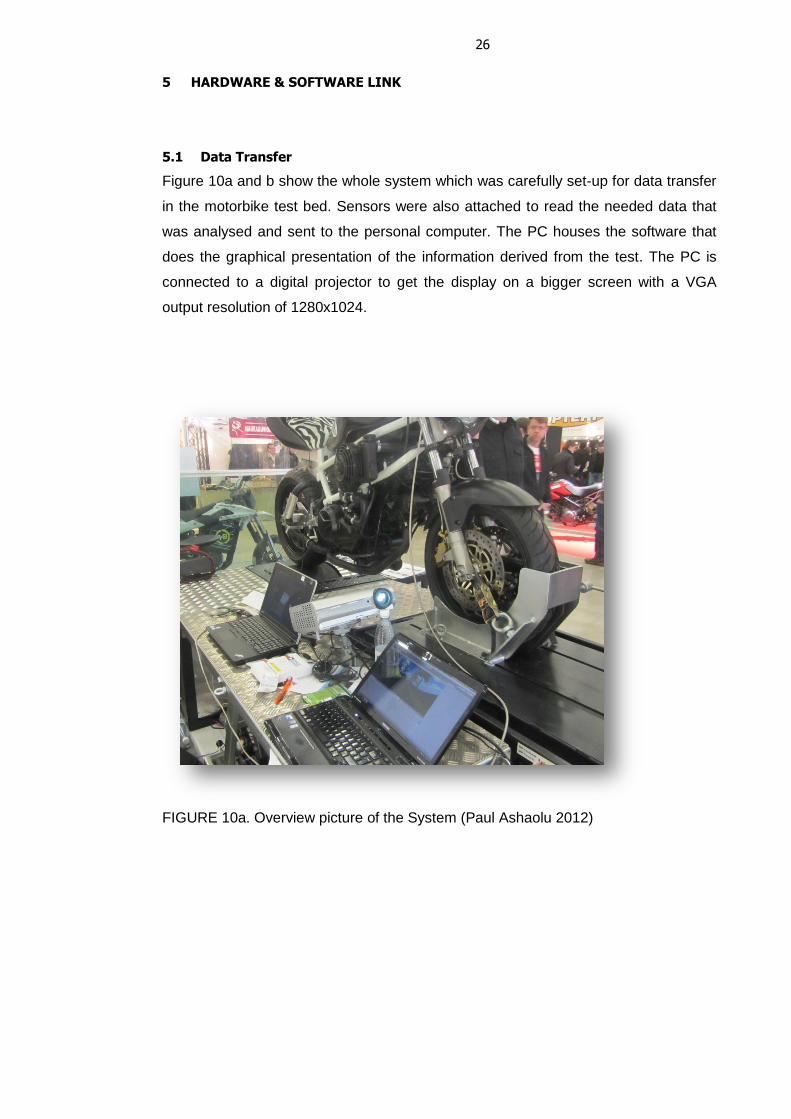
Figure 10a and b show the whole system which was carefully set-up for data transfer
in the motorbike test bed. Sensors were also attached to read the needed data that
was analysed and sent to the personal computer. The PC houses the software that
does the graphical presentation of the information derived from the test. The PC is
connected to a digital projector to get the display on a bigger screen with a VGA
output resolution of 1280x1024.
FIGURE 10a. Overview picture of the System (Paul Ashaolu 2012)

27
Fig.10b Overview picture of the system showing the motorbike mounted on a
mechanical bench (Paul Ashaolu 2012)
In Figure 10b, the motorbike was clamped to the mechanical platform which allows
some inertia effects. Provision was made for the adequate braking systems needed
to support the motorbike with the wheels which were part of the mechanical bench
located directly under the motorbike's rear wheel. The motorbike is carefully tied to
the bench by using the front clamp to fasten the front wheel of the bike to the bench.
28
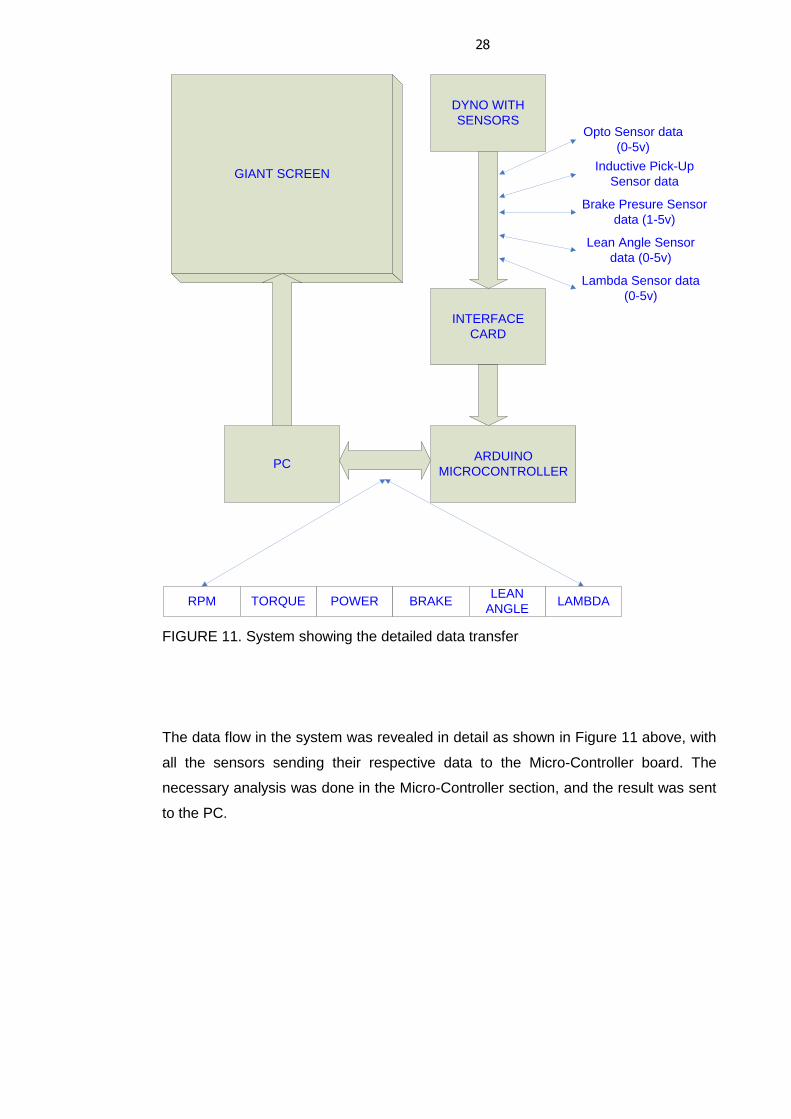
GIANT SCREEN
DYNO WITH
SENSORS
INTERFACE
CARD
ARDUINO
MICROCONTROLLERPC
RPM TORQUE POWER BRAKELEAN
ANGLE
Opto Sensor data
(0-5v)
Inductive Pick-Up
Sensor data
Brake Presure Sensor
data (1-5v)
Lean Angle Sensor
data (0-5v)
Lambda Sensor data
(0-5v)
LAMBDA
FIGURE 11. System showing the detailed data transfer
The data flow in the system was revealed in detail as shown in Figure 11 above, with
all the sensors sending their respective data to the Micro-Controller board. The
necessary analysis was done in the Micro-Controller section, and the result was sent
to the PC.

29
5.1.1 Electronics Section
Electronics section is where the sensors carried out their respective readings and
output the data as shown in Figure 11 for onward processing in the Micro-Controller
unit. It is the section that serves as centre of attraction, because the overall outcome
of the test depends on the careful analysis in-there. Much work was done to minimize
all possible delays, as well as error checking to ensure that the right data format is
sent to the PC.
5.1.2 Software Section
Software section is where the data collected as stream from the electronics section is
analyzed and presented in a graphical format which is also visible in a projected
bigger screen. The presentation is done during program execution, and necessary
feedbacks are done simultaneously.
As the data is being graphically analyzed, the road track in the virtual environment
also makes use of needed data to present the visual analysis of the test. The terrain
in the virtual environment was developed to be as real as possible, with simulated
images of a selected motorway (Ashaolu, P. 2012).
5.1.3 Sensors’ Data Flow
Speed Sensor
With the help of an optical sensor, the speed of the motorbike was measured by
counting the number of turns the rear wheel covers within a minute. The optical
sensor was designed from a GP1A50HR Optical integrated circuit (OPIC) photo-
interrupter as shown in Figure 12. A photo-interrupter is a transmission type sensor
incorporating an infrared LED and a photo-sensor in the same package, both in
upright position, separated from each other in a "U" shape.
The package is arranged in such a way as to give chance for infrared light to shine
through the "U" ends, onto the detector so as to detect object whenever it passes in
between the emitter and the detector. The GP1A50HR Optical IC photo-interrupter
has a slit width of 0.5mm, and it is useful in getting information about the turning of
slotted discs as was the case in this project. The sensor generates an interrupt
whenever it finds its way by shining through to the photo-transistor.

30
An interrupt is generated when the disc which is put in between the “U” shape of the
photo-interrupter rotates to the slit point. This method is simple and also minimizes
cost when generating information about the rotation of the motorbike wheel. (See
Figure 13a and b)
FIGURE 12. Speed measurement by using the GP1A50HR OPIC photo-interrupter
(Polat 2012)

31
FIGURE 13a. The OPIC opto sensor point of attachment to the mechanical platform
(Polat 2012)
FIGURE 13b. Magnified image of the slotted disc and the OPIC opto sensor (Polat
2012)

32
Lean Angle Sensor
The lean angle sensor comprises of a potentiometer. A potentiometer is that simple
knob shown in Figure 14 used in getting variable resistance values. It is also referred
to as an electro-mechanical transducer that changes linear and rotary motion from
the operator into different resistance values. It is a good option as a tilt sensor by
connecting its outputs to the Arduino analog pins, since those variable resistance
values can be read into the Arduino board as analog values. The resistance varies by
turning that potentiometer shaft.
FIGURE 14. Calibration of the lean angle measurement (Polat 2012)
According to Figure 14, the turning effects of the motorbike which falls between 0º to
±90º affects the degree of closeness of the pin to the 5V supply voltage and 0V
ground voltage, to give different outputs ranging from 0 to 1023. (Ashaolu, P. 2012)

33
FIGURE 15. Set-up showing the attached potentiometer circled in red (Paul Ashaolu
2012)
In Figure 15, the spot circled in red shows the potentiometer already attached to the
tip of the bench. The potentiometer was carefully installed so that the motorbike’s
turning effect leads to a change in the rotating shaft of the potentiometer and
therefore measures the lean angle of the motorbike in the x-y coordinates. (Ashaolu,
P. 2012)
Break Pressure Sensor
This sensor allows the motorcycle brake to be controlled by Dyno brake system. A
suitable sensor was found, but the availability of it in Finland during the project period
was difficult. Another sensor which was readily available was then chosen. The
sensor was put on the motorcycle brake system of the air screw in place of the
pressure sensor. The sensor is MSP 300 series pressure transducer. The MSP 300-
2k5-P-4-N-1 pressure sensor has 5-30V supply voltage and the output of 1-5V. The
pressure sensor values are 0-170 bar. The motorcycle brake pressure is
approximately 0-60 bar. Figure 16 below shows the connection to the interface card.

34
FIGURE 16. System showing the break pressure sensor (Polat 2012)
Eddy Brake Current
Eddy brake current which is an electromagnetic brake is the dynamometer brake
used in this project, and it controls the speed during simulation so as to withstand the
400kg mass of the fly wheel. The brake is controlled by the pressure sensor through
its measurement of the brake fluid line pressure. The angle variations and air
resistance factor which ensure better accurate measurement are not really
considered since this project is still a prototype. The brake power is 400kW and
controlled by DC voltage of 192V. Figure 17 shows the block diagram of the setup.

35
FIGURE 17. Dynamometer break system set-up (Polat 2012)
Lambda Sensor
The lambda sensor measures the oxygen to air mixture ratio. The module can be
connected directly to the computer and it provides 5V analog output. The sensor can
be easily installed in the exhaust pipes as pictured in Figure 18.

36
FIGURE 18. Set-up showing Lambda sensor (Polat 2012)
Inductive Pickup Sensor
The inductive pickup sensor measures the engine speed and torque. It measures the
engine speed by clamping the inductive Pickup Sensor around a Secondary Ignition
cable. The connection of the sensor is displayed in Figure 19.

37
FIGURE 19. System showing the set-up of inductive pickup sensor (Polat 2012)
38
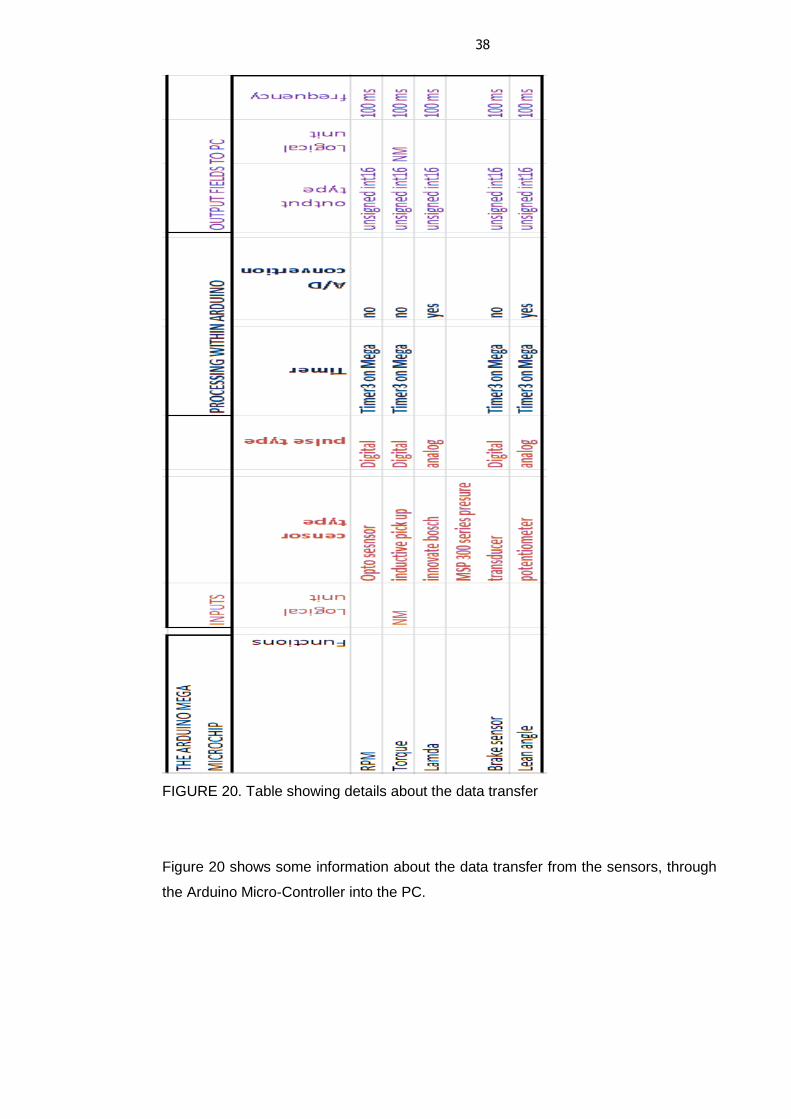
FIGURE 20. Table showing details about the data transfer
Figure 20 shows some information about the data transfer from the sensors, through
the Arduino Micro-Controller into the PC.

39
5.2 Dynamometer Physics
The torque on the dynamometer was calculated using the following equations Angular velocity: (1) Where is the Revolution Per Second.
Angular acceleration:
(2)
Rear-wheel torque: (3) The engine torque was calculated from the engine’s power and the angular velocity:
Power: (4)
Engine’s torque: m =
(5)
The Velocity (km/h) is calculated from the circumference of the rear wheel, 2.04m2 and its revolutions per second. Velocity: (6)
(Polat 2012)

40
6 TESTS
6.1 Intra-Unit Tests
Tests were carried out at different intervals within each unit in order to simplify the
whole process in the project work. After various forms of intra-unit tests, then comes
an overall test. During those periods of carrying out the overall test, maximum
attention was paid so as to note the corrections that needed to be made. For the tests
within the data analysis unit which is the scope of this thesis, randomly generated
numbers were utilized to see how the graphical analysis would look like. An Arduino
Mega 2560 was used to generate some random numbers each time there was need
for test. The purpose of doing that was to simulate the kind of data that would have
been received from the embedded unit to do the expected graphical analysis of the
system. The work has to be done that way in order to save time and to make sure
that no unit would be delaying another.
6.1.1 Arduino Test with Random Numbers
Arduino has a function named random(). This function generates by default what
appear to be random numbers. Though in the real sense of it, those numbers came
as a result of some calculations that were done while applying a formular. Anytime
that formular is reset, it starts at a point and continues a long sequence of random-
like numbers. Meanwhile, Arduino do take off at the same point in that sequence at
every reset. But when there is need for a set of values derived by random() to be
different, one needs to make use randomSeed() to initialize the generator with an
input that is fairly random. (Google Project 2010)

41
FIGURE 21. Arduino mega 2560 connected to my PC
Figure 21 shows the connection of the Arduino board to my PC during the test with
random numbers.
42
TABLE 1. Randomly generated numbers.
RPM TORQUE POWER
5570 29 16
5580 13 5
5590 28 3
5600 21 9
5610 22 18
5620 16 19
5630 16 23
5640 34 23
5650 29 13
5660 13 14
5670 25 13
5680 20 7
5690 34 17
5700 19 3
5710 29 15
5720 27 16
5730 11 12
5740 36 6
5750 21 22
5760 30 8
5770 18 12
5780 5 20
5790 5 19
5800 22 15
5810 21 6
5820 14 14
5830 35 17
5840 18 18
5850 12 5
5860 32 4
5870 38 13
5880 14 21
5890 12 20
5900 37 23
5910 14 17
5920 11 4
5930 5 11
5940 6 15
5950 28 10
5960 1 23
5970 34 24
5980 18 12
5990 8 3
6000 39 24

43
6.1.2 Graphical Analysis Test with Random Numbers
FIGURE 22. Graphical analysis of randomly generated numbers
The randomly generated data are displayed in Table 1, and its graphical analysis
using the WPF is shown in Figure 22. The code (see appendix 1) suggested that
column 1 is for the randomly generated numbers for the RPM with an increment of
10, while columns 2 and 3 are for the torque and power respectively. The code
suggested that the torque could have the highest possible value of 40 and a minimum
of 1, while the power could have the lowest possible value of 2 and the highest of 25.
44
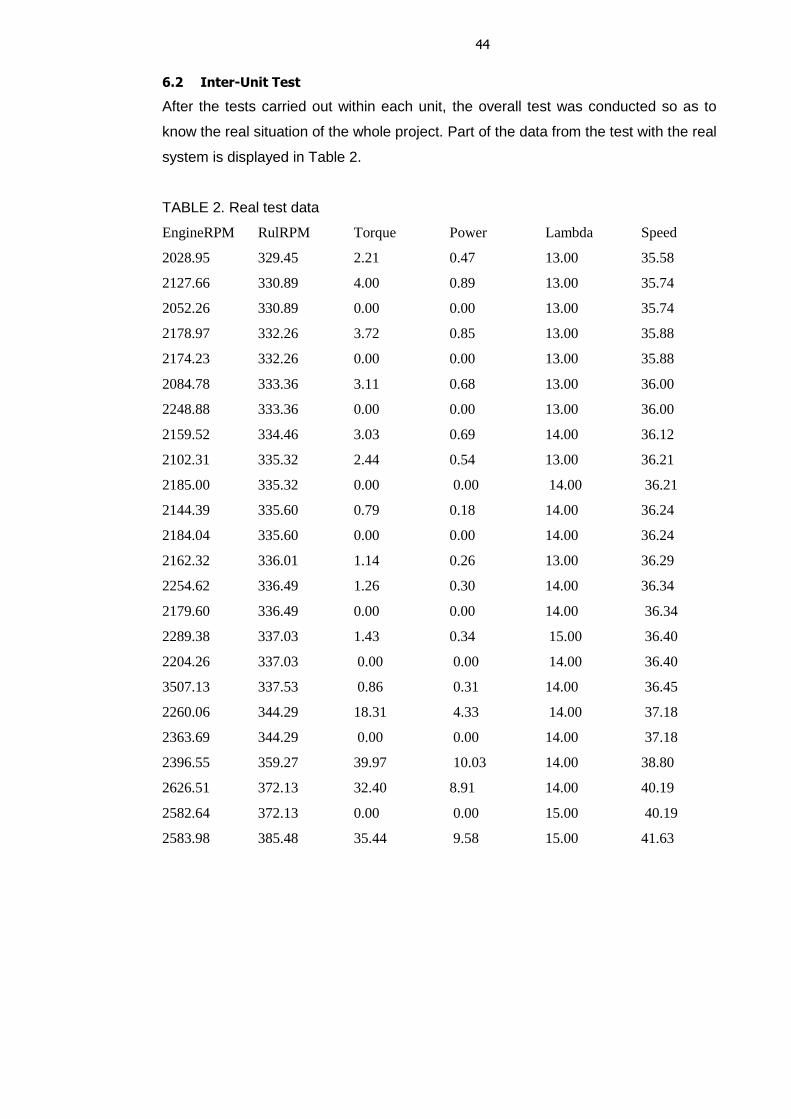
6.2 Inter-Unit Test
After the tests carried out within each unit, the overall test was conducted so as to
know the real situation of the whole project. Part of the data from the test with the real
system is displayed in Table 2.
TABLE 2. Real test data
EngineRPM RulRPM Torque Power Lambda Speed
2028.95 329.45 2.21 0.47 13.00 35.58
2127.66 330.89 4.00 0.89 13.00 35.74
2052.26 330.89 0.00 0.00 13.00 35.74
2178.97 332.26 3.72 0.85 13.00 35.88
2174.23 332.26 0.00 0.00 13.00 35.88
2084.78 333.36 3.11 0.68 13.00 36.00
2248.88 333.36 0.00 0.00 13.00 36.00
2159.52 334.46 3.03 0.69 14.00 36.12
2102.31 335.32 2.44 0.54 13.00 36.21
2185.00 335.32 0.00 0.00 14.00 36.21
2144.39 335.60 0.79 0.18 14.00 36.24
2184.04 335.60 0.00 0.00 14.00 36.24
2162.32 336.01 1.14 0.26 13.00 36.29
2254.62 336.49 1.26 0.30 14.00 36.34
2179.60 336.49 0.00 0.00 14.00 36.34
2289.38 337.03 1.43 0.34 15.00 36.40
2204.26 337.03 0.00 0.00 14.00 36.40
3507.13 337.53 0.86 0.31 14.00 36.45
2260.06 344.29 18.31 4.33 14.00 37.18
2363.69 344.29 0.00 0.00 14.00 37.18
2396.55 359.27 39.97 10.03 14.00 38.80
2626.51 372.13 32.40 8.91 14.00 40.19
2582.64 372.13 0.00 0.00 15.00 40.19
2583.98 385.48 35.44 9.58 15.00 41.63

45
FIGURE 23. Real test graphical analysis
Figure 23 shows the graphical analysis of the system’s overall test using the data
from the inter-unit test.

46
The data visualization user interface was later developed in Visual Studio.NET,
coding language done in C#. Figure 24 shows the user interface with controls for the
parameter display and plot areas for the torque and power against the engine RPM,
and also the air/fuel ratio chart area included.
FIGURE 24. User interface for the system analysis
6.3 Noise and Signal Errors
Testing stages of this project was time-consuming, especially with some issues that
arise with the noise and signal errors. Testing was carried out under laboratory
conditions at Lekasteel oy. The project had problems with the inductive, optical and
angular sensors. The signal noise problem took a lot of time for my colleague in the
embedded unit to get a way around it. He was having some problems with electronics
and programmatic method. And more importantly, he was having problems with a
median program security algorithm. The median code protection algorithm that was
later added is displayed as follows:

47
int mode(int *x,int n){
int i = 0; int count = 0; int maxCount = 0; int mode = 0; int bimodal; int prevCount = 0; while(i<(n-1)){ prevCount=count; count=0; while(x[i]==x[i+1]){ count++; i++; } if(count>prevCount&count>maxCount){ mode=x[i]; maxCount=count; bimodal=0; } if(count==0){ i++; } if(count==maxCount){//If the dataset has 2 or more modes. bimodal=1; } if(mode==0||bimodal==1){//Return the median if there is no mode. mode=x[(n/2)]; } return mode; }
}
(Polat, B. 2012)

48
7 CONCLUSION
This project was presented at the Helsinki Motorbike show from 2 of February to 5 of
February, 2012. Many of the participants in attendance were from other parts of
Finland and neighbouring countries. Ideas were later raised on how to improve and
develop the whole system further for better performance.
Some stages in the project came with the opportunity to learn new things, especially
about Arduino and WPF. Fortunately, the Internet has a lot of good forums where
small projects are analysed and following these discussion was helpful. In general, it
was a bit stressful but interesting and remarkable learning experience.

49
REFERENCES
Arduino page. Arduino [web document]. [reference made 12 August 2011].
Available at: www.arduino.cc
Arduino page. Arduino Mega 2560 [web document]. [reference made 12.08.2011]
Available at: http://arduino.cc/en/Main/ArduinoBoardMega2560
Ashaolu, P. 2012. Development of an Interactive 3-D Virtual Environment Test
Bed for Motorbikes. Kuopio: Savonia University of Applied Sciences, Information
Technology. Thesis.
Barber, T. 2003. Horsepower and Torque [web document]. [reference made 13
March 2012] Available at: http://wotid.com/dyno/content/view/18/37
Bimmer Forums. 2008. BMW of Bloomfield [web document]. [reference made 17 February 2012]. Available at: http://forums.bimmerforums.com/forum/showthread.php?t=934780
Bolton, D. 2011. C# For Beginners - Learn about C# [web document]. [reference
made 10 November 2011]. Available at:
http://cplus.about.com/od/introductiontoprogramming/a/cshbeginners.htm
Code Project. 2007. A flexible charting library for .NET [web document].
[reference made 24 June 2011]. Available at:
http://www.codeproject.com/Articles/5431/A-flexible-charting-library-for-NET
Craighead, J. Burke, J. and Murphy, R. 2007. Using the Unity Game Engine to
Develop SARGE: A Case Study [electronic book]. USA: University of South
Florida [reference made 10 March 2012]. Available at:
http://www.robot.uji.es/research/events/iros08/contributions/craighead.pdf
Google Project, 2010. TrueRandom library for Arduino [web document].
[reference made 15 November 2011]. Available at:
http://code.google.com/p/tinkerit/wiki/TrueRandom
King, P, J. Burnham, K. J. 1991. Implementation of a self-tuning controller to the dynamometer torque loop of an engine test cell. [electronic book]. Vol.1 pg 110-114. IET Confrence [reference made 10 January 2012].
Kioumars, A. H. Tang, L. 2011. Wireless Network for Health Monitoring: Heart
Rate and Temperature Sensor [electronic book]. IEEE 2011 Fifth International
Conference on Sensing Technology. [reference made 12 September 2011].
Available at: http://ieeexplore.ieee.org/stamp/stamp.jsp?tp=&arnumber=6137000
Mediawiki. 2010. About Processing [web document]. [reference made 12 October
2011] Available at: http://wiki.processing.org/w/Processing:About
Microsoft page. Introduction to WPF [web document]. [reference made 16
January 2012]. Available at: http://msdn.microsoft.com/en-
us/library/aa970268.aspx

50
Microsoft page. Windows Driver Kit (WDK) [web document]. [reference made 11
May 2011] Available at: http://msdn.microsoft.com/en-
us/windows/hardware/gg487428.aspx
Nplot page. Introduction to Nplot [electronic book]. [reference made 27 June
2011] Available at: http://netcontrols.org/nplot/downloads/nplot_introduction.pdf
Polat, B. 2012. Moottoripyörän Dynamometrin Mittauselektroniikan Suunnitte-lu ja
Testaus. Kuopio: Savonia University of Applied Sciences, Electronics. Thesis.
Robot Builder’s Bonanza, 2001. Using the OOPIC Microcontroller [web
document]. [reference made 9 December 2011] Available at:
http://www.robotoid.com/bonus-chapters/rbb2-ch33-
Using_the_OOPic_Microcontroller.pdf
SourceForge, 2011. LiveGraph [web document]. [reference made 20 June 2011]
Available at: http://www.live-graph.org
Stahl, M. 2003. Java USB API for Windows. Zurich: Institute for Information
Systems, ETH Zurich. Thesis. [reference made 11 January 2012]. Available at:
http://www.steelbrothers.ch/jusb/api/usb/windows/related-
docs/JavaUSBforWindowsWeb.pdf
Stahl, M. 2003. Java USB API for Windows. Zurich: Institute for Information
Systems, ETH Zurich. Thesis. [reference made 1 February 2012]. Available at:
http://www.steelbrothers.ch/jusb/api/usb/windows/package-summary.html
TDK Motorsports, 2004. Why an Inertia Dyno [web document]. [reference made 7 March 2012] Available at: http://www.tdkmotorsports.com/whydyno.html
Techotopia, 2009. C# Essentials [electronic book]. [reference made 11 November
2011] Available at:
http://www.techotopia.com/index.php/The_C_Sharp_Language_and_Environmen
t
TripleZee Cycles. What is a dyno. [web document]. [reference made 11
November 2011] Available at:
http://www.triplezeecycles.co.nz/Articles/Dynos%20what%20are%20they.html
University of California, Berkeley. ME102 Lab 1: Getting Started [web document].
[reference made 17 May 2012] Available at:
http://www.me.berkeley.edu/ME102/lab1.html
51
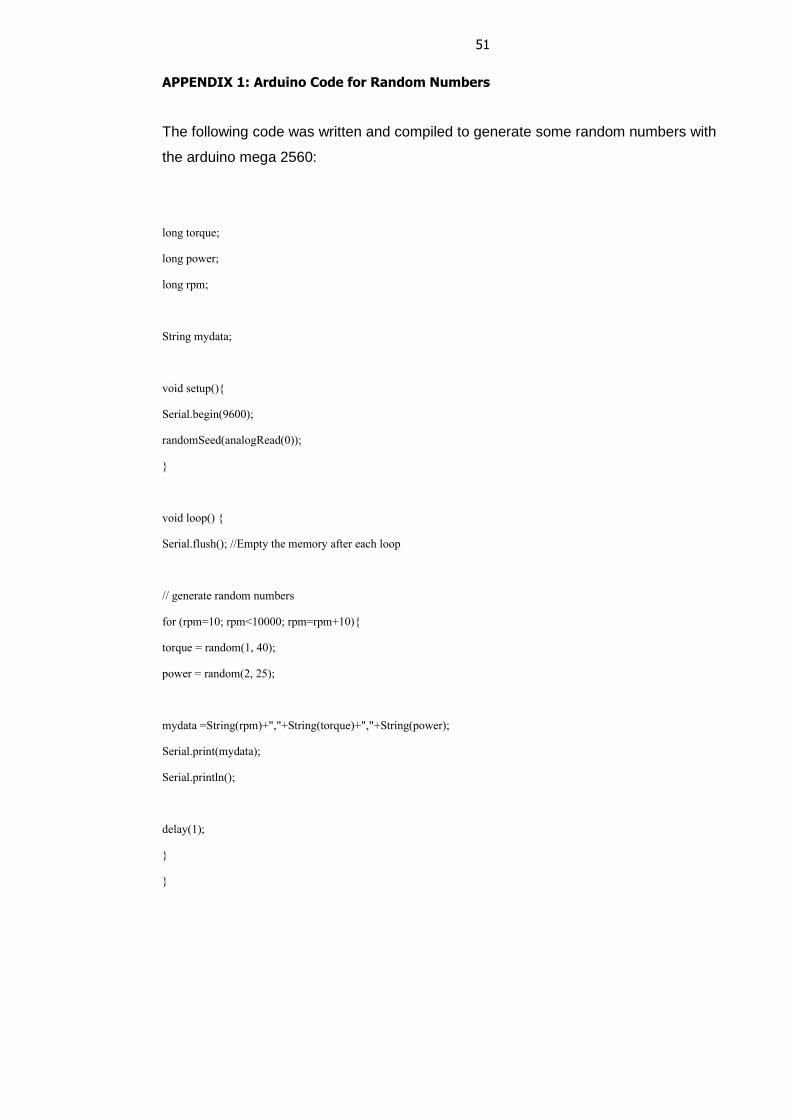
APPENDIX 1: Arduino Code for Random Numbers
The following code was written and compiled to generate some random numbers with
the arduino mega 2560:
long torque;
long power;
long rpm;
String mydata;
void setup(){
Serial.begin(9600);
randomSeed(analogRead(0));
}
void loop() {
Serial.flush(); //Empty the memory after each loop
// generate random numbers
for (rpm=10; rpm<10000; rpm=rpm+10){
torque = random(1, 40);
power = random(2, 25);
mydata =String(rpm)+","+String(torque)+","+String(power);
Serial.print(mydata);
Serial.println();
delay(1);
}
}

52
APPENDIX 2: Code for Reading from Arduino and Writing into File
The numbers generated with the code in appendix 1, were retrieved from the arduino
mega 2560 using the code below and saved into a csv file.
// Reads input from Arduino card
public class WriteToText: MonoBehaviour
{
SerialPort stream = new SerialPort("COM4", 9600);
void Start ()
{
stream.Open(); //Open the Serial Stream
}
void Update ()
{
string value = stream.ReadLine();
var values = value.Split(' , '); //Split incoming stream values on comma into arrays
string path = @"c:\data\lekas.csv";
if(!File.Exists(path))
{
using (StreamWriter sw = new StreamWriter(path))
{
sw.WriteLine(value);
}
}
using (StreamWriter sw = File.AppendText(path))
{
sw.WriteLine(value);
}
}
}

53
APPENDIX 3: Code for plotting the Graph with WPF
namespace Lekasteel
{
public partial class Window1 : Window
{
ObservableDataSource<Point> source1 = null;
ObservableDataSource<Point> source2 = null;
ObservableDataSource<Point> source3 = null;
public Window1()
{
InitializeComponent();
}
private void Lekasteel()
{
CultureInfo culture = CultureInfo.InvariantCulture;
Assembly executingAssembly = Assembly.GetExecutingAssembly();
const string spimDataName = "c:\\data\\lekas.csv";
using (Stream spimStream = File.OpenRead(spimDataName))
{
using (StreamReader r = new StreamReader(spimStream))
{
string line = r.ReadLine();
while (!r.EndOfStream)
{
line = r.ReadLine();
string[] values = line.Split(' ');
double x = Double.Parse(values[1], culture);
double y2 = Double.Parse(values[2], culture);
double y3 = Double.Parse(values[3], culture);
double y4 = Double.Parse(values[4], culture);
Point p2 = new Point(x, y2);
Point p3 = new Point(x, y3);
Point p4 = new Point(x, y4);

54
source2.AppendAsync(Dispatcher, p2);
source3.AppendAsync(Dispatcher, p3);
source4.AppendAsync(Dispatcher, p4);
Thread.Sleep(1); // time for computations...
}
}
}
}
private void Window_Loaded(object sender, RoutedEventArgs e)
{
// Create first source
Source1 = new ObservableDataSource<Point>();
// Set identity mapping of point in collection to point on plot
Source1.SetXYMapping(p => p);
// Create second source
Source2 = new ObservableDataSource<Point>();
// Set identity mapping of point in collection to point on plot
Source2.SetXYMapping(p => p);
// Create third source
Source3 = new ObservableDataSource<Point>();
// Set identity mapping of point in collection to point on plot
Source3.SetXYMapping(p => p);
// Add all three graphs. Colors are not specified and chosen random
plotter.AddLineGraph(source2, 2, "Torque");
plotter.AddLineGraph(source3, 2, "Power");
plotter.AddLineGraph(source4, 2, "Lambda");
// Start computation process in second thread
Thread simThread = new Thread(new ThreadStart(Lekasteel));
simThread.IsBackground = true;
simThread.Start();
}
}
}