data types entities and fields can be transformed to the other type vectors compared to rasters
TRANSCRIPT

Data Types
Entities and fields can be transformed to the other type
Vectors compared to rasters
Polygon Analysis Methods
• Filtering– Retrieves a subset of a dataset– Examples
• Query (search)
• Aggregation– Combines attributes or features within data sources (layers)– Examples
• Reclassify, dissolve
• Integration– Combine two or more data sources (layers) – Example
• Polygon Overlay (intersection, union, clip)

Slope is the change is elevation (rise) with a change in horizontal position (run).
It provides a measure of the steepest decent between a cell and its neighbors.
Slope is often reported in degrees (0° is flat, 90° is vertical) but is also expressed as a percent
Slope
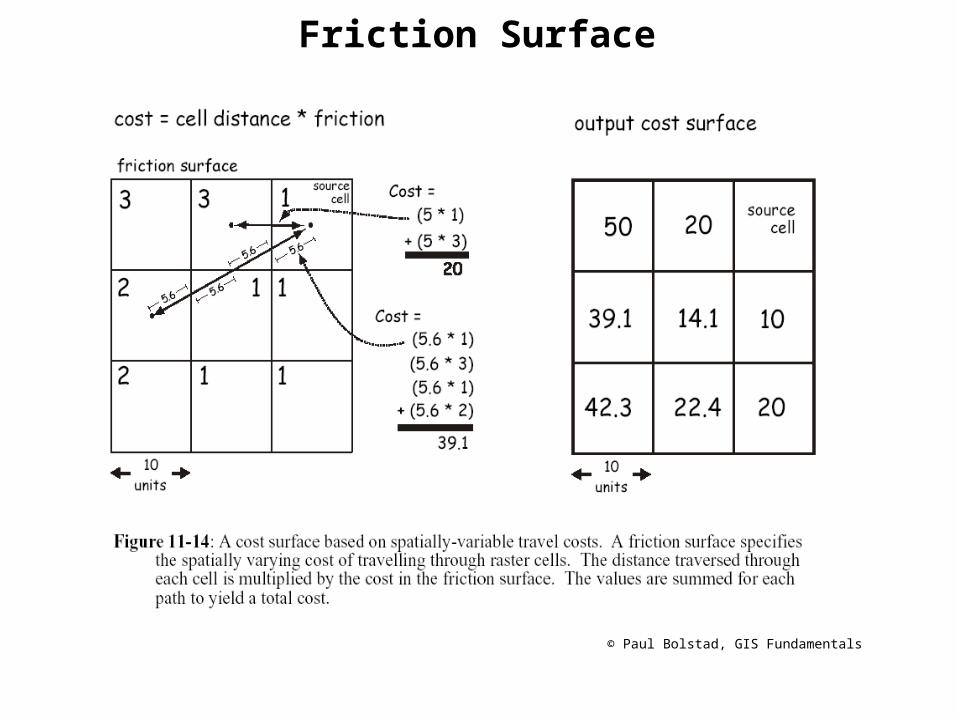
Friction Surface
© Paul Bolstad, GIS Fundamentals
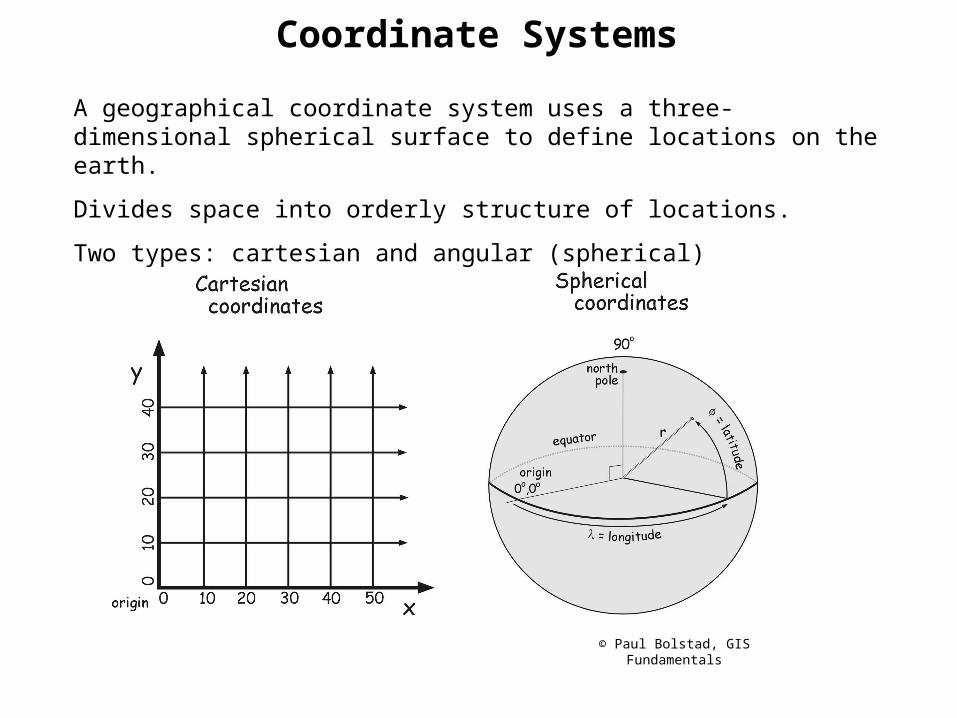
Coordinate Systems
A geographical coordinate system uses a three-dimensional spherical surface to define locations on the earth.
Divides space into orderly structure of locations.
Two types: cartesian and angular (spherical)
© Paul Bolstad, GIS Fundamentals

Projection Types
• Equal area – the ratio of areas on the earth and on the map are constant. Shape, angle, and scale are distorted.
• Conformal – the shape of any small surface of the map is preserved in its original form. If meridians and parallel lines are at 90-degree angles, then angles are also preserved.
• Equidistant - preserve distances between certain points. Scale is not maintained correctly, however, typically one or more lines has its scale maintained.
Three general types of projections:
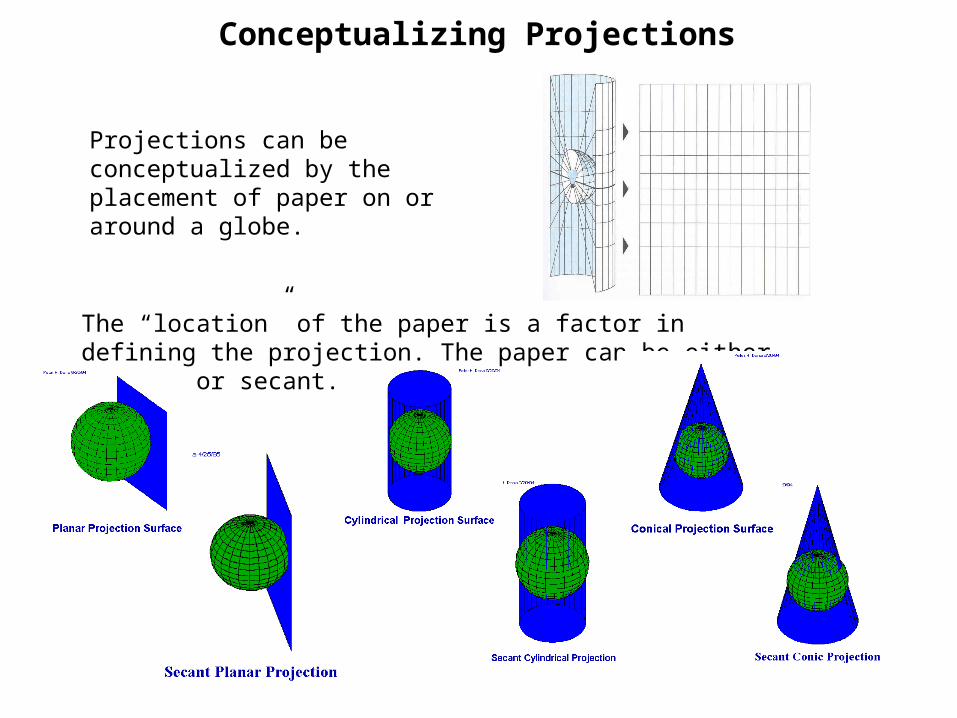
Conceptualizing Projections
Projections can be conceptualized by the placement of paper on or around a globe.
The “location” of the paper is a factor in defining the projection. The paper can be either tangent or secant.

G and F Function
0.0
0.1
0.2
0.3
0.4
0.5
0.6
0.7
0.8
0.9
1.0
1 3 5 7 9
Bin
Fre
qu
en
cy
0.0
0.1
0.2
0.3
0.4
0.5
0.6
0.7
0.8
0.9
1.0
1 4 7 10
Distance, d
G(d
)
G reflects how close together events are within a region while F indicates how distant events are from arbitrary locations
G(d)
0.0
0.1
0.2
0.3
0.4
0.5
0.6
0.7
0.8
0.9
1.0
1 2 3 4 5 6 7 8
Distance, d
F(d
)
F(d)
0.0
0.1
0.2
0.3
0.4
0.5
0.6
0.7
0.8
0.9
1.0
1 3 5 7 9 More
Bin
Fre
qu
ency
G(d) F(d)
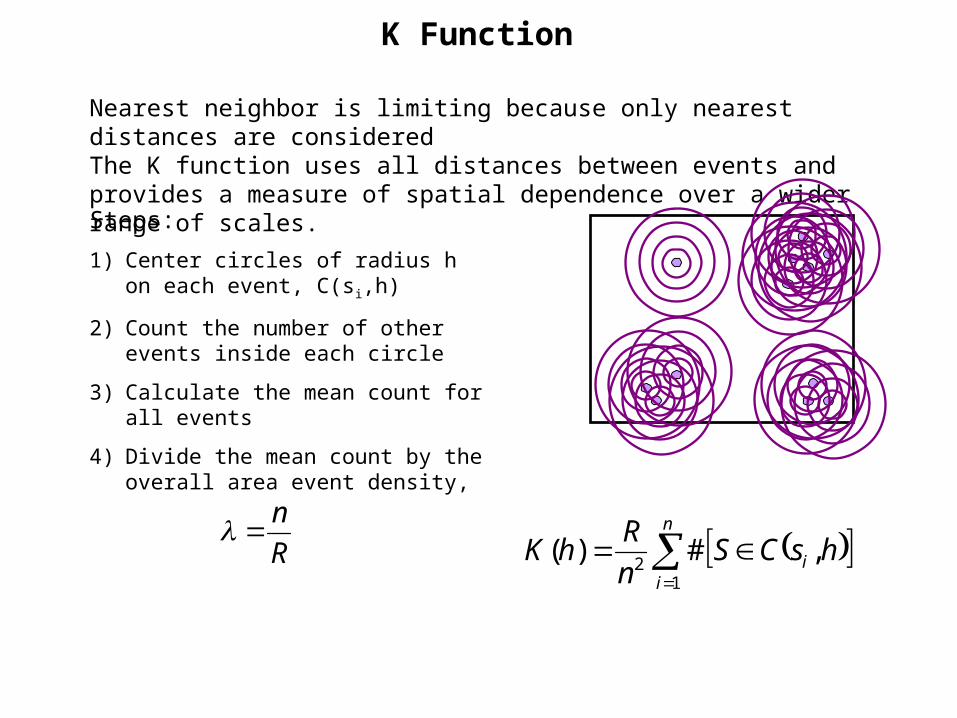
K Function
R
n
Nearest neighbor is limiting because only nearest distances are consideredThe K function uses all distances between events and provides a measure of spatial dependence over a wider range of scales.
n
ii hsCS
n
RhK
12
,#)(
Steps:
1) Center circles of radius h on each event, C(si,h)
2) Count the number of other events inside each circle
3) Calculate the mean count for all events
4) Divide the mean count by the overall area event density,
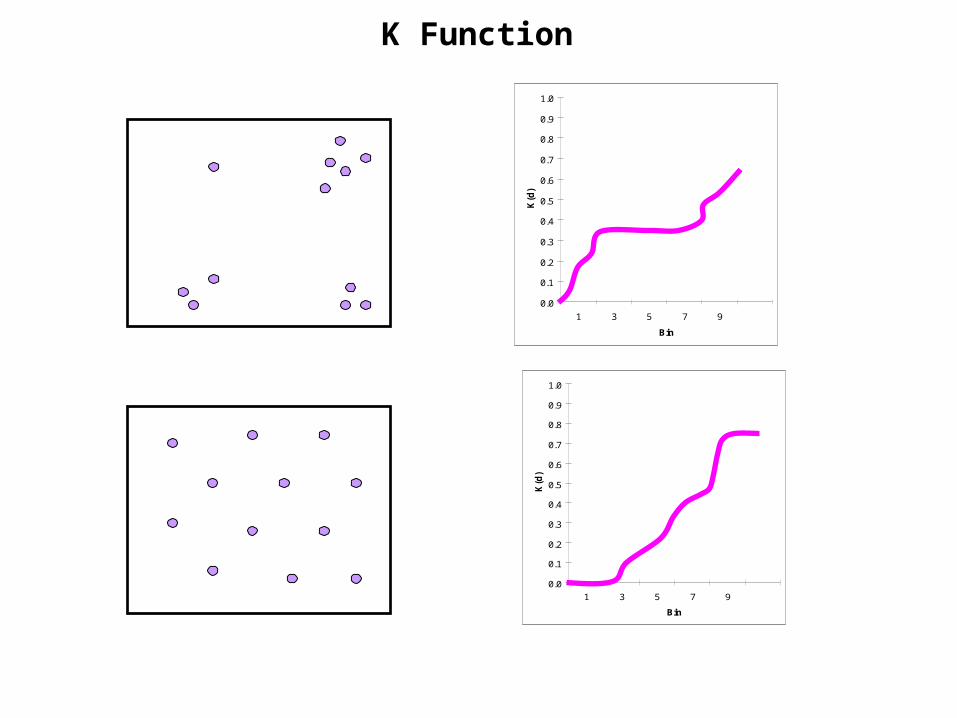
K Function
0.0
0.1
0.2
0.3
0.4
0.5
0.6
0.7
0.8
0.9
1.0
1 3 5 7 9
Bin
K(d
)
0.0
0.1
0.2
0.3
0.4
0.5
0.6
0.7
0.8
0.9
1.0
1 3 5 7 9
Bin
K(d
)

What about the edges?
Kernel Windows
© Paul Bolstad, GIS Fundamentals
Key Factors in Spatial Interpolation
Search Radius - sets the maximum distance at which a monitoring site is to be included for estimation.
Maximum Number of Stations - creates a flexible radius of influence. The radius adjusts itself to the number of available stations.
Minimum Number of Stations - prevents estimates from being made in areas with an inadequate number of stations.
Weighting Factor – determines the relative influence of each monitoring site in deriving an estimate
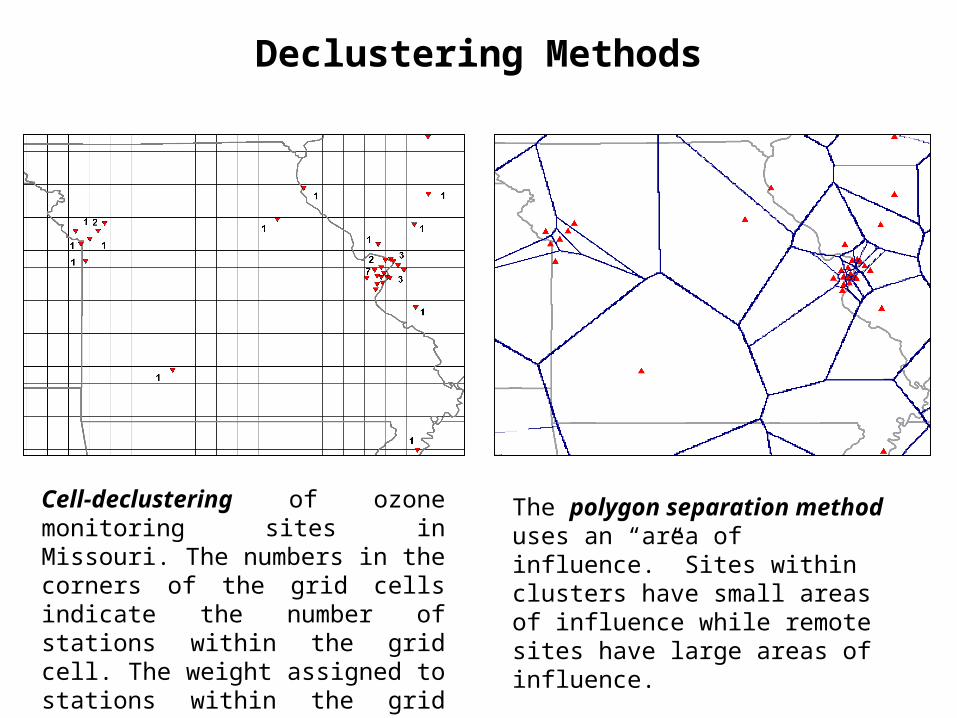
Declustering Methods
Cell-declustering of ozone monitoring sites in Missouri. The numbers in the corners of the grid cells indicate the number of stations within the grid cell. The weight assigned to stations within the grid cell is the inverse of the number of stations.
The polygon separation method uses an “area of influence.” Sites within clusters have small areas of influence while remote sites have large areas of influence.

Variogram Attributes
Sill: the part of the fitted function that levels off indicating that there is no spatial dependence between data points because all estimates of variances of differences will be invariant with sample separation distance
Range is the distance at which the function reaches the sill. If the range is large, then long-range variation occurs over short distances. If the range is small, then major variations occur over short distances.
Nugget is the local variance attributable to measurement error or random error

ArcGIS Main Components
ArcMap
ArcCatalog
ArcToolbox