data vis
TRANSCRIPT
Information Literacy
Information LiteracyData Visualization
Holly WillisHolly Willis
Institute for
Multimedia Literacy
USC
Institute for
Multimedia Literacy
USC
10 Questions
Georgia International Conference
on Information
Literacy
Georgia International Conference
on Information
Literacy

What is data visualization?
#1

“…situations when quantified data which by itself is not visual… is transformed into a visual representation…” Lev Manovich, The Future of Learning Institutions in a Digital Age
“…the process whereby abstract data is rendered visual in a manner that helps elucidate relationships and supports forms of analysis. . .”
datavisualization
pragmatic
aesthetic
versus

* Edward TufteThe Visual Display of Quantitative Information
–> clarity–> precision–> efficiency
What is its history?
#2
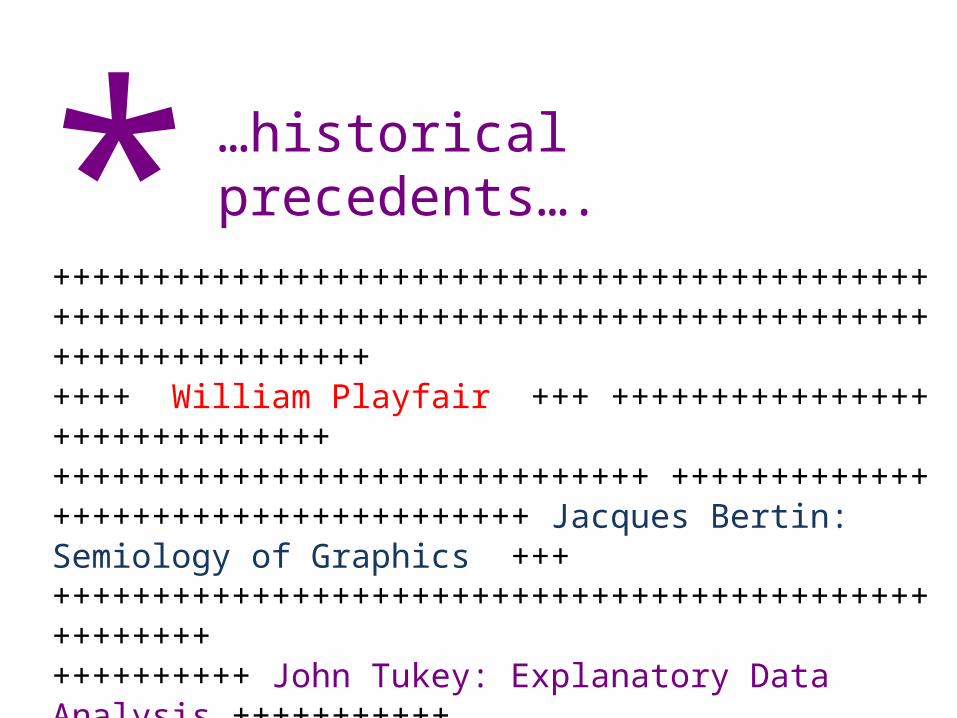
++++++++++++++++++++++++++++++++++++++++++++++++++++++++++++++++++++++++++++++++++++++++++++++++++++++++++++ William Playfair +++ ++++++++++++++++++++++++++++++++++++++++++++++++++++++++++++ +++++++++++++++++++++++++++++++++++++ Jacques Bertin: Semiology of Graphics +++++++++++++++++++++++++++++++++++++++++++++++++++++++++++++++++ John Tukey: Explanatory Data Analysis +++++++++++++++++++++++++++++++++++++++++++++++++++++++++++++++Edward Tufte, The Visual Display of Quantitative Information ++++++++++++++++++++++++++++++++++++++++++++++++++++++++++++++++++++++++++++++++++++++++++++++++++++++++++
* …historical precedents….

Balance of Trade
Prices, Wages and Reigns
William Playfair
“inventor of graphical forms”

Charles Minard Napoleon’s March to Moscow
“best statistical graphic”

John Snow
Cholera deaths in London
“pioneer in disease mapping”

Etienne-Jules Marey motion studies “pioneer of dynamic graphics”

Henry Beck
London Underground
1933
simplicity

Charles & Ray Eames
Powers of Ten1977
Henry Beck

Icoro Doria
AngolaChina
Colombia
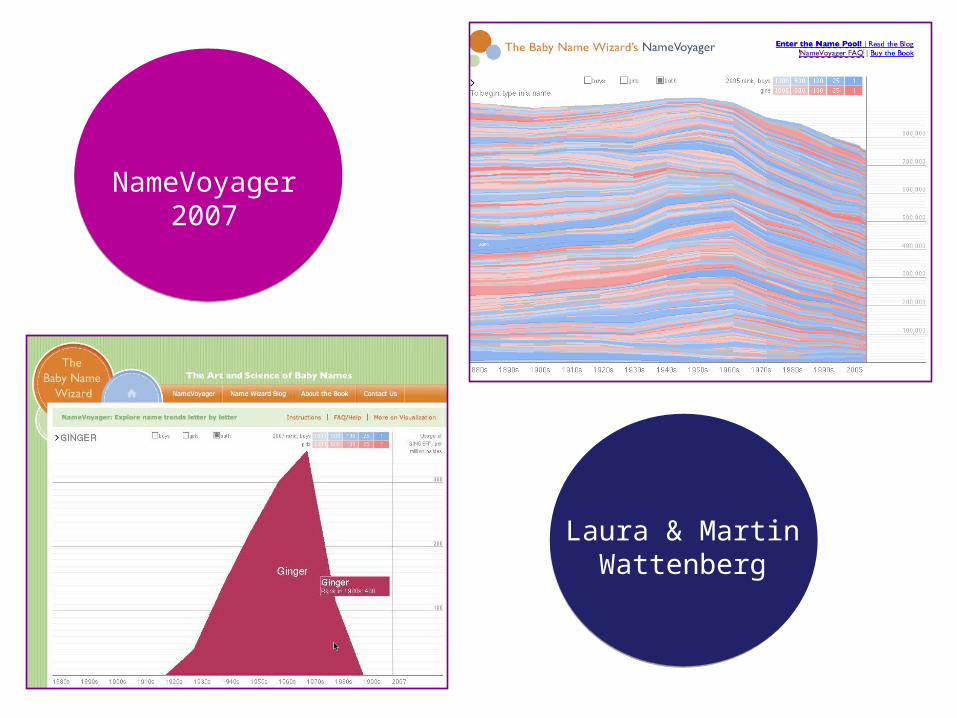
NameVoyager2007
Laura & MartinWattenberg
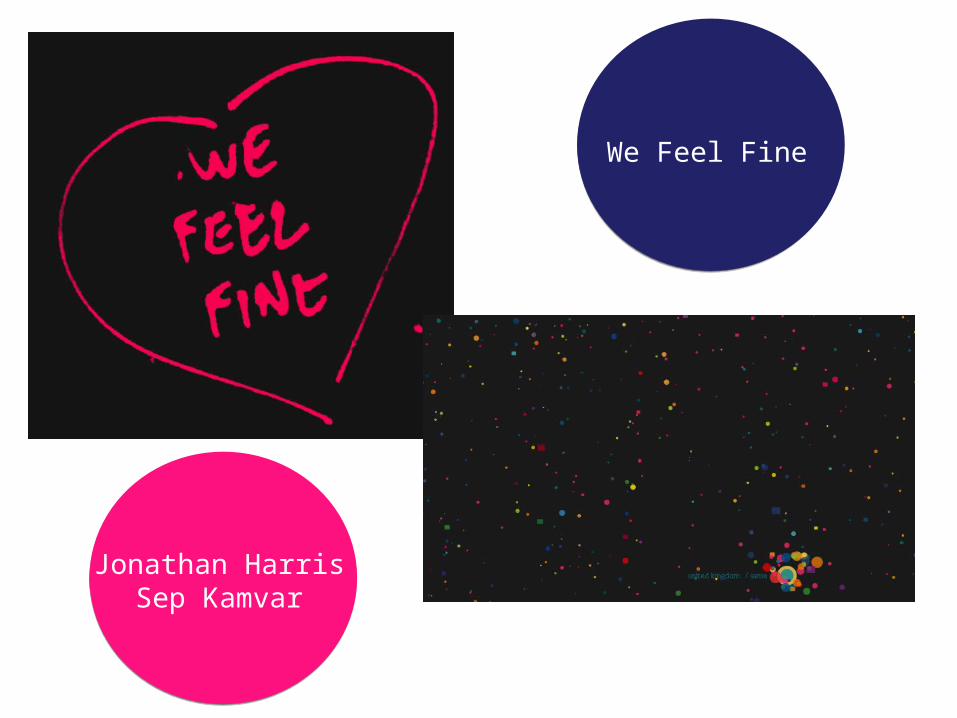
We Feel Fine
Jonathan HarrisSep Kamvar

Why is it so prevalent?
#3
data delugecapacity
databasessocial media

What’s the process?
#4

parsefilter
representmine
refineinteract
Ben Fry, Visualizing Data

organizesimplify
comparecause and effect
contrastmultiply views
What are the various types ?
#5

++++++++++++++++++++++++++++++++++++++++++++++++++++++++++++++++++++++++++++++++++++++++++++++++++++++++++++ comparative analysis +++++++++++++++++++++++++++++++++++++++++++++++++++++++++++++++++++++++++++++++++++++++++++++++++++++++++++++ time series +++++++++++++++++++++++++++++++++++++++++++++++++++++++++++++++++++++++ part to whole relationships +++++++++++++++++++++++++++++++++++++++++++++++++++++++++++++++++++++++++++++++++++++++++++++++ deviation analysis +++++++++++++++++++++++++++++++++++++++++++++++++++++++++++++++++++++++++++++++multivariate analysis+++++++++++++++++++++++++++++++++++++++++++++++++++++++++++++++++++++++++++++++
* …data visualization genres….
What’s storytelling with data?
#6
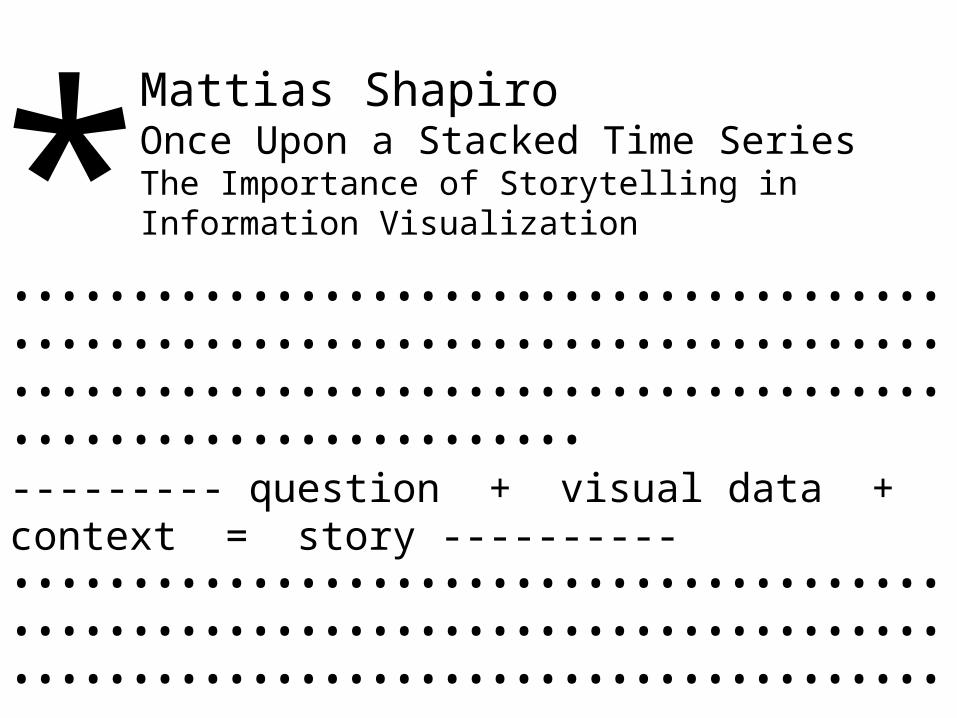
••••••••••••••••••••••••••••••••••••••••••••••••••••••••••••••••••••••••••••••••••••••••••••••••••••••••••••••••••••••••••••••••••••••••••••• --------- question + visual data + context = story ----------•••••••••••••••••••••••••••••••••••••••••••••••••••••••••••••••••••••••••••••••••••••••••••••••••••••••••••••••••••••••••••••••••••••••••••••
*Mattias ShapiroOnce Upon a Stacked Time SeriesThe Importance of Storytelling in Information Visualization
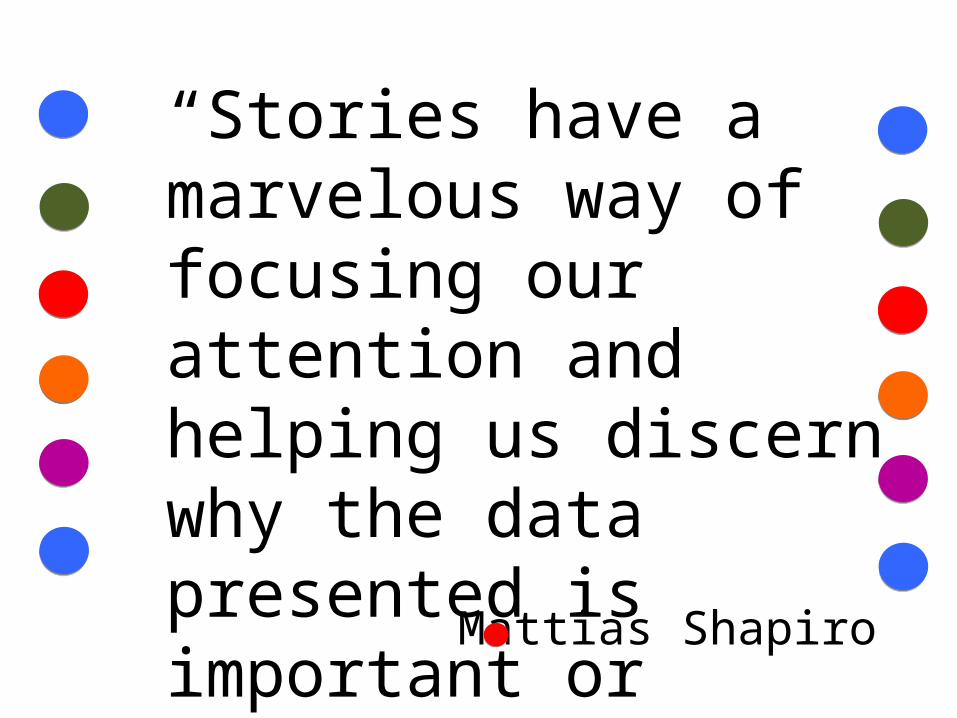
“Stories have a marvelous way of focusing our attention and helping us discern why the data presented is important or relevant to some part of our lives.” Mattias Shapiro

Al Gore, An Inconvenient Truth

What are some tools?
#7

Google RefineDataWrangler
http://code.google.com/p/google-refine/http://vis.stanford.edu/wrangler/
data cleaning

Wordle
http://www.wordle.net/create
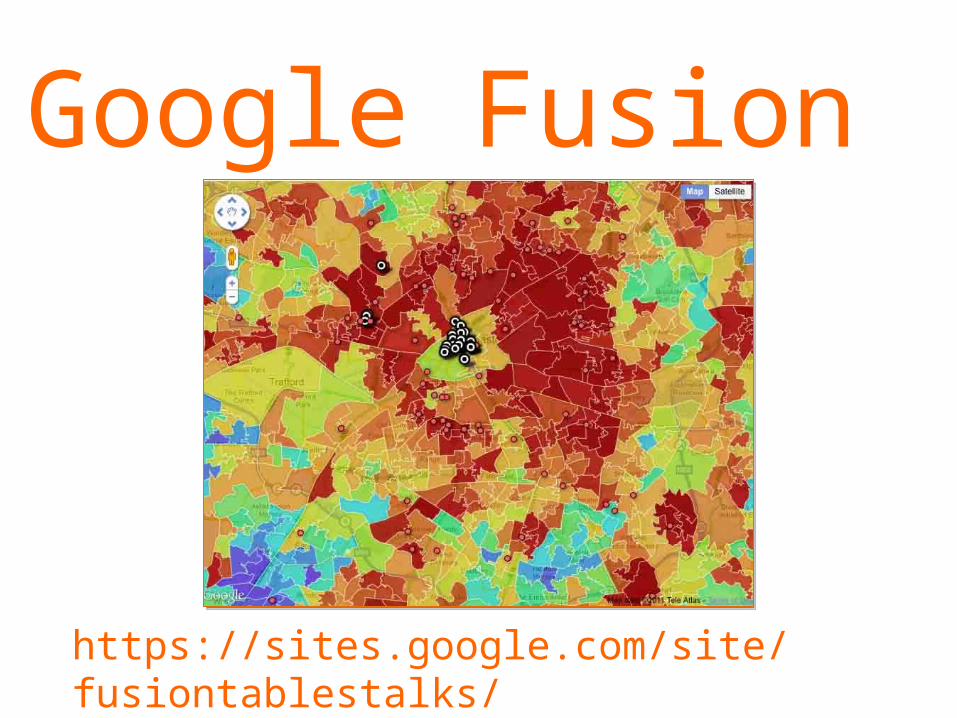
Google Fusion
https://sites.google.com/site/fusiontablestalks/

Many Eyes
http://www-958.ibm.com
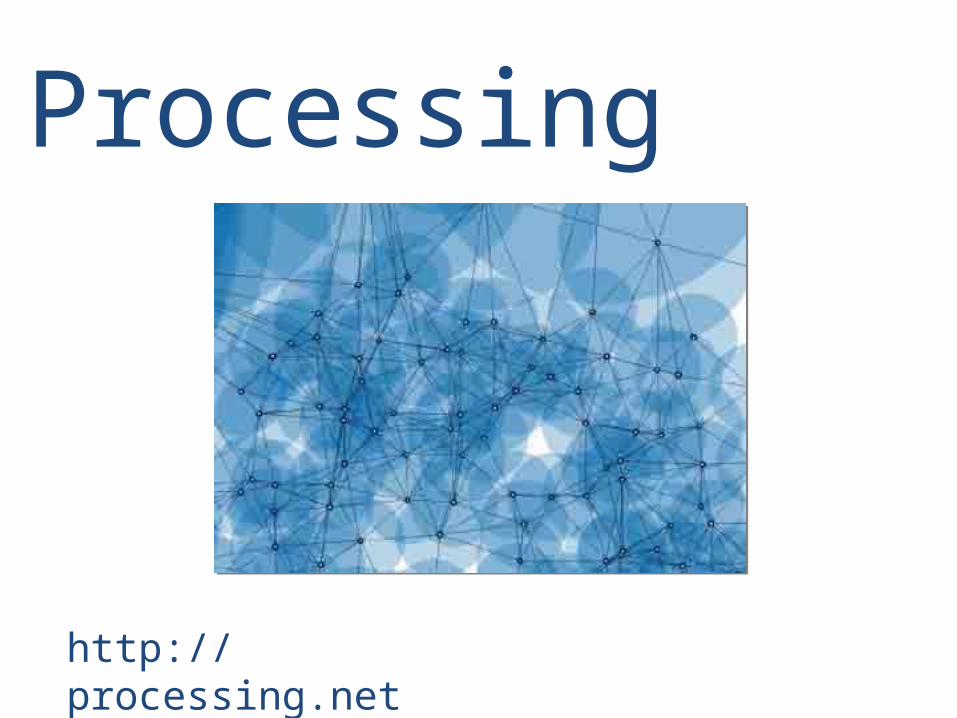
Processing
http://processing.net

Tableau Public
http://www.tableausoftware.com/public

OpenHeatMap
http://www.openheatmap.com/

TimeFlow
https://github.com/FlowingMedia/TimeFlow/wiki/
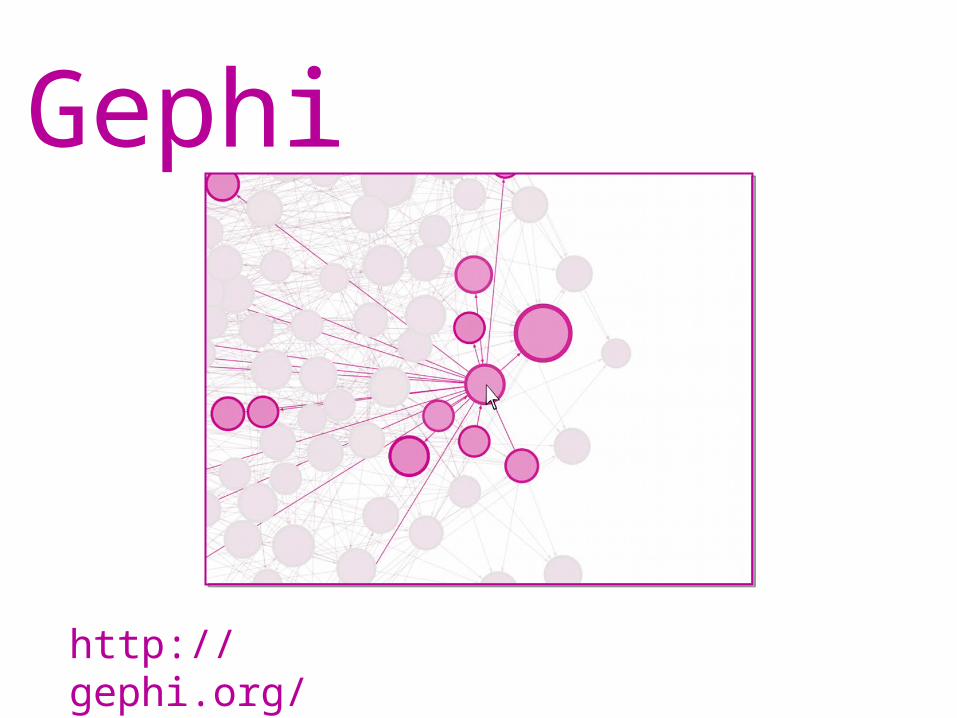
Gephi
http://gephi.org/

Who cares?
#8
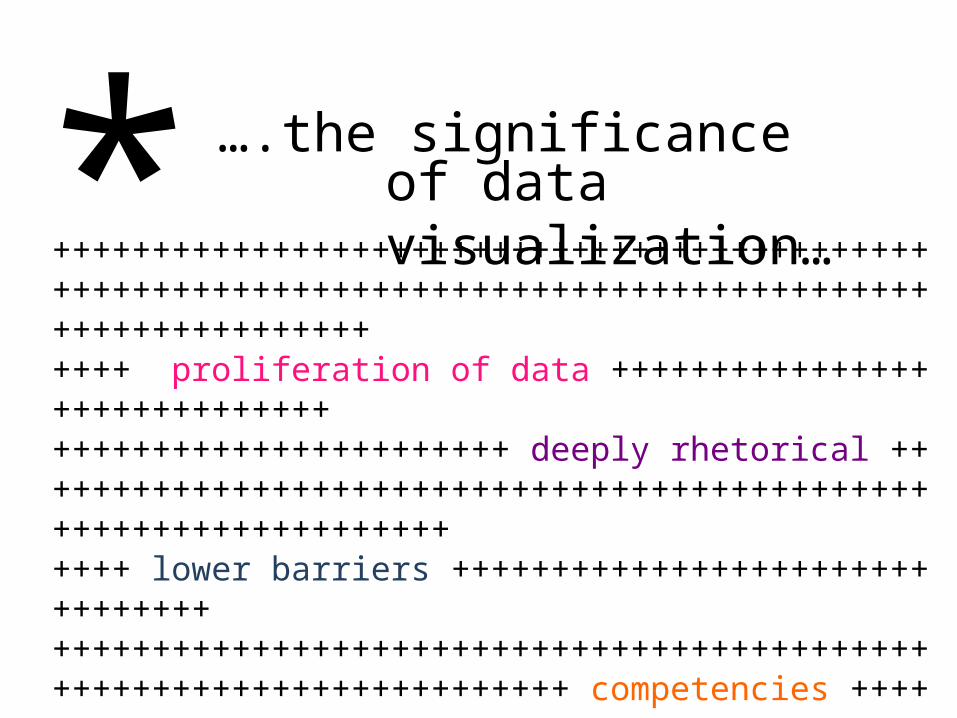
++++++++++++++++++++++++++++++++++++++++++++++++++++++++++++++++++++++++++++++++++++++++++++++++++++++++++++ proliferation of data +++++++++++++++++++++++++++++++++++++++++++++++++++++ deeply rhetorical ++++++++++++++++++++++++++++++++++++++++++++++++++++++++++++++++++++++ lower barriers ++++++++++++++++++++++++++++++++++++++++++++++++++++++++++++++++++++++++++++++++++++++++++++++++++++++ competencies ++++++++++++++++++++++++++++++++++++++++++++++++++++++++++++++++++++++++++++++ 21st century citizenship +++++++++++++++++++++++++++++++++++++++++++++++++++++++++++++++++++++++++++++++++++++++++++++++++++++++++++++++++++++++++++++++++
* ….the significanceof data visualization…

criticalapproach
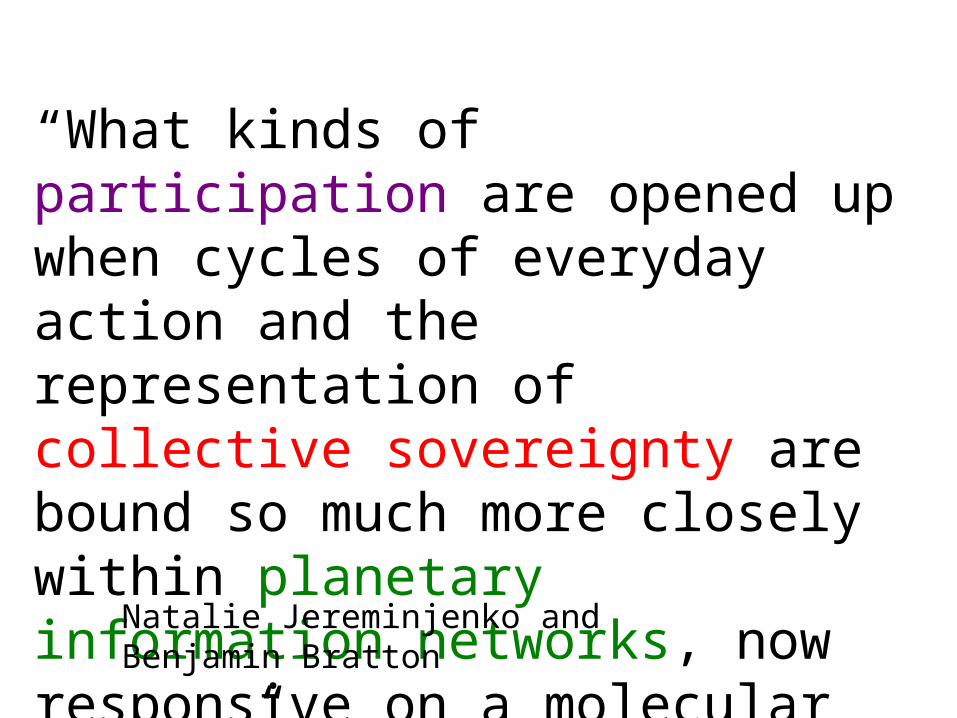
“What kinds of participation are opened up when cycles of everyday action and the representation of collective sovereignty are bound so much more closely within planetary information networks, now responsive on a molecular level?”
Natalie Jereminjenko and Benjamin Bratton

“spectacularization
information”
of
Natalie Jereminjenko and Benjamin Bratton
IBM | Motion Theory | Data Anthem | 2010
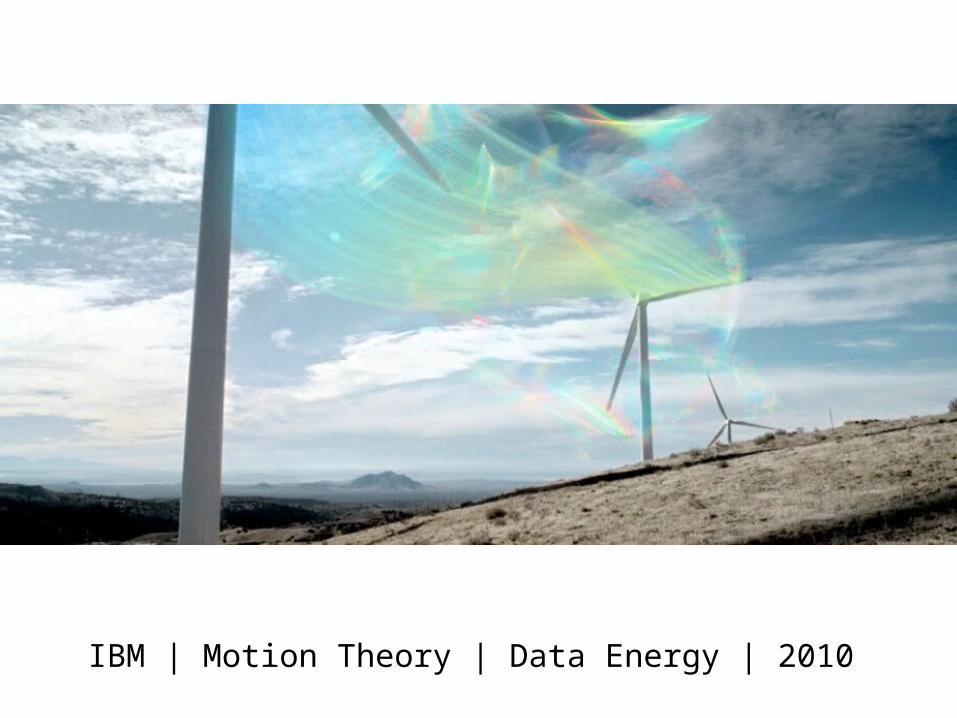
IBM | Motion Theory | Data Energy | 2010

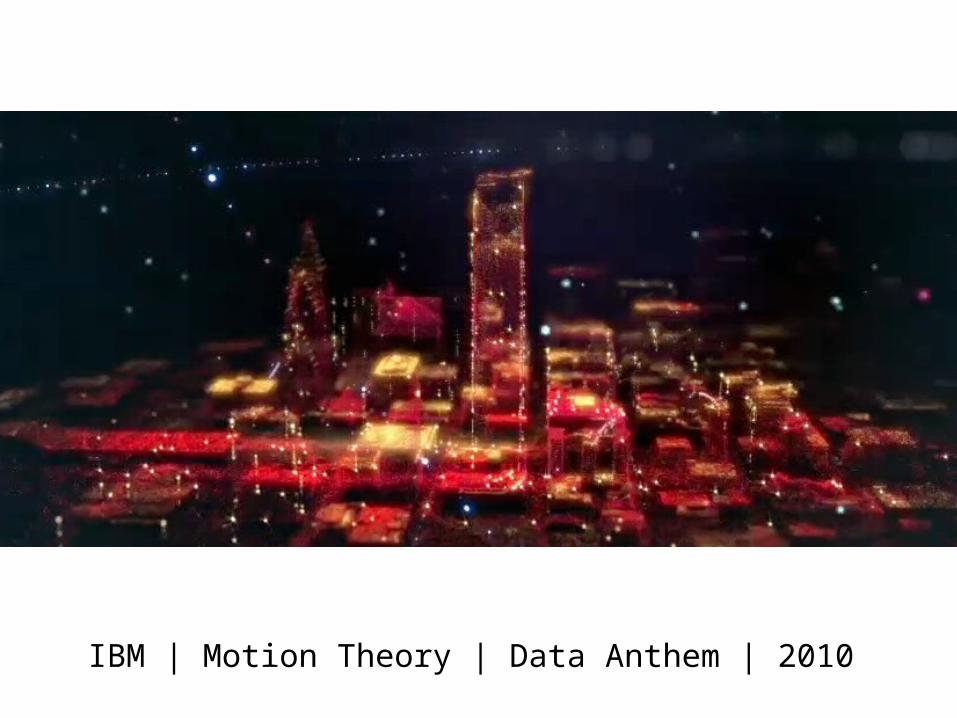
IBM | Motion Theory | Data City | 2010
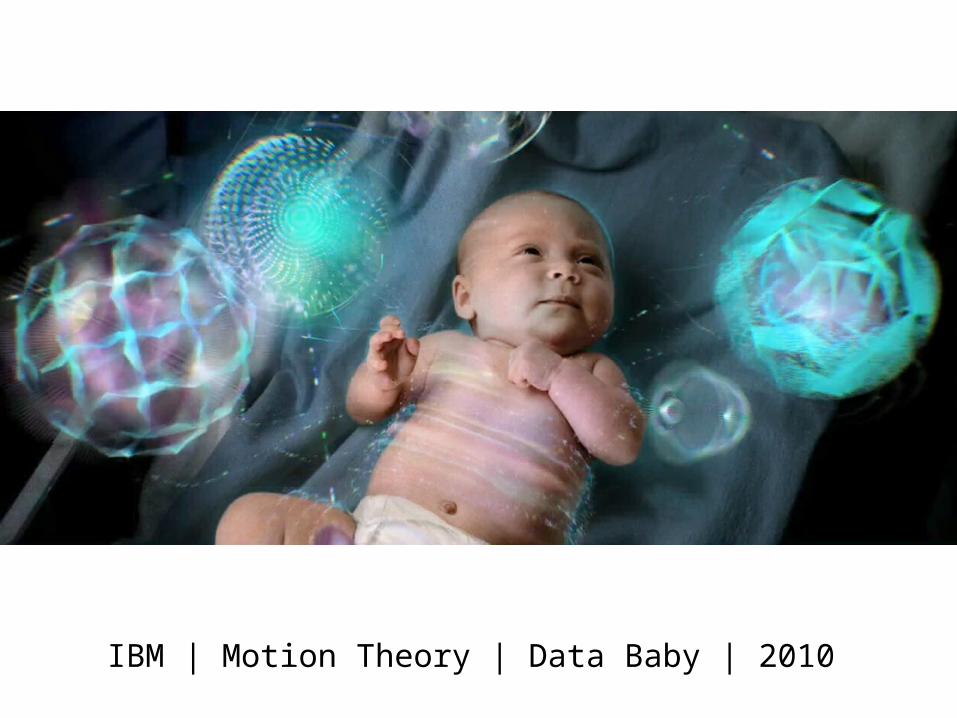
IBM | Motion Theory | Data Baby | 2010

IBM | Internet of Things | 2010

“visualizationcriticism”
Robert Kosara, “Visualization Criticism – The Missing Link Between Information Visualization and Art”


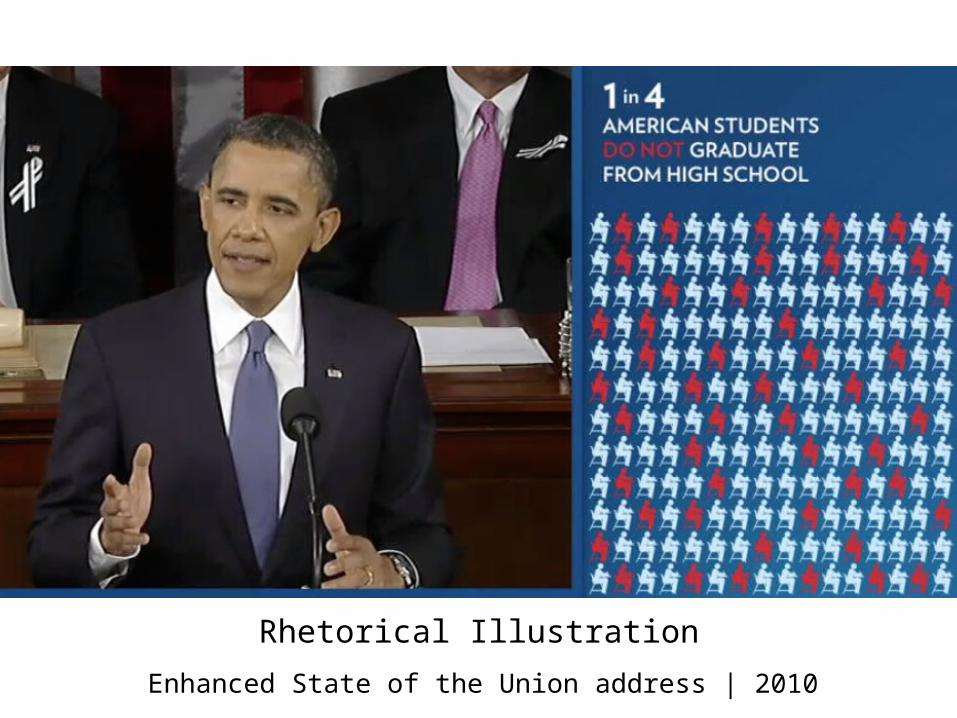
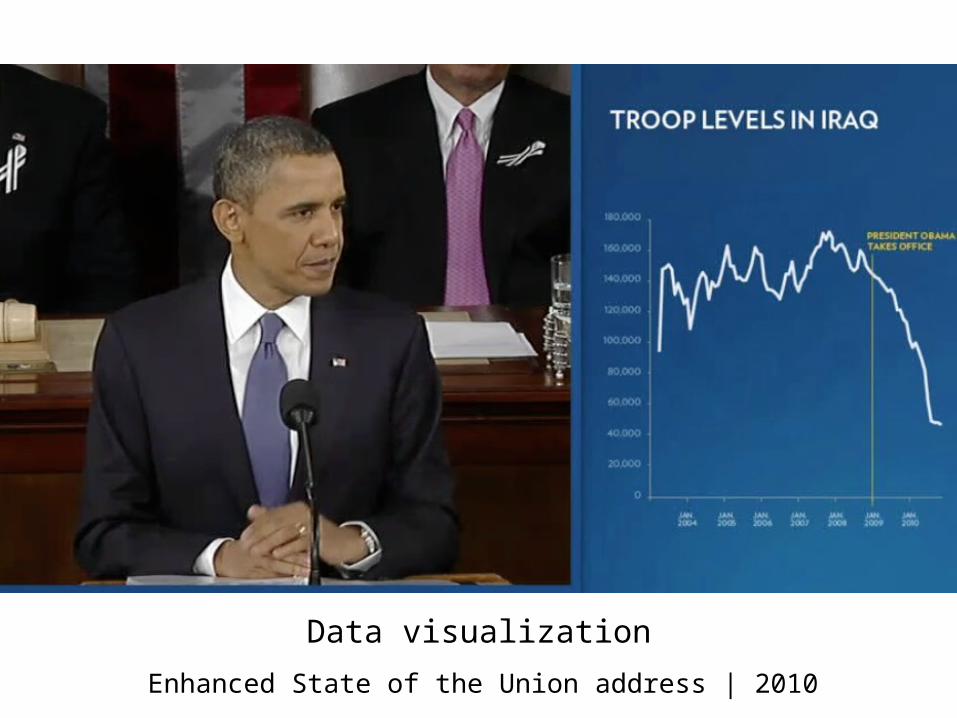
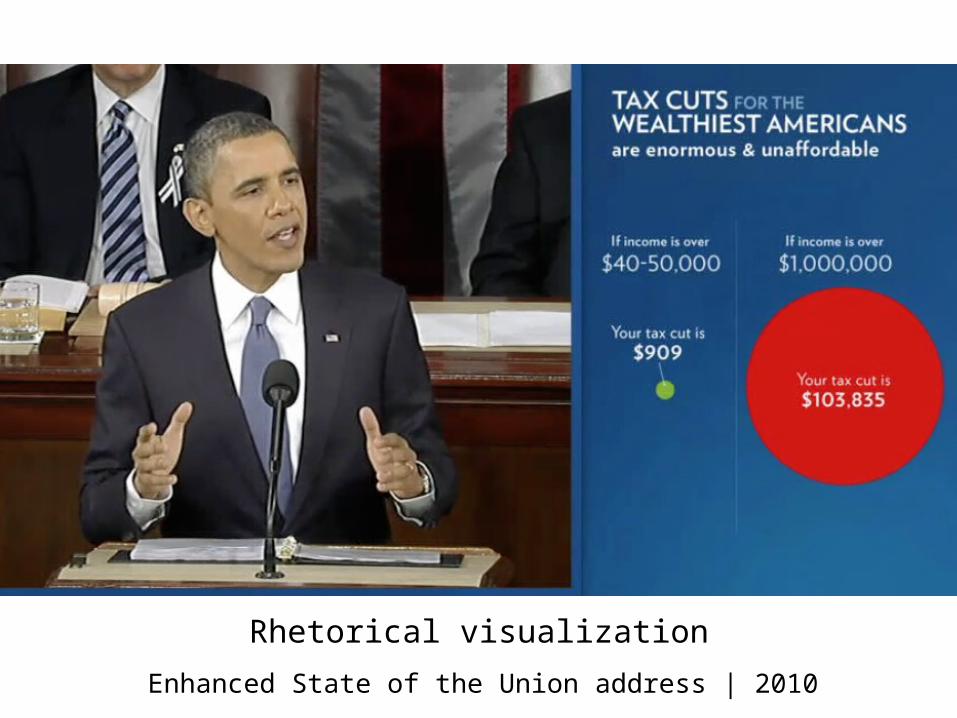
Enhanced State of the Union address | 2010
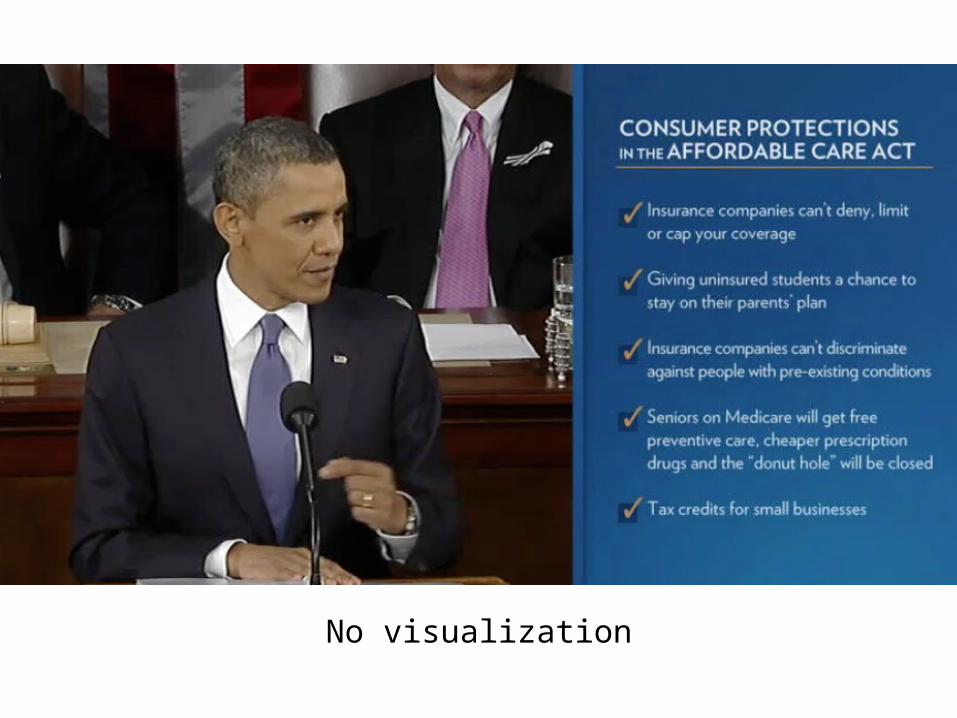
Enhanced State of the Union address | 2010
No visualization

Enhanced State of the Union address | 2010
Meaningless illustration

Enhanced State of the Union address | 2010
Rhetorical juxtaposition

Enhanced State of the Union address | 2010
Text visualization
Enhanced State of the Union address | 2010
Rhetorical Illustration
Enhanced State of the Union address | 2010
Data visualization
Enhanced State of the Union address | 2010
Rhetorical visualization

Enhanced State of the Union address | 2010
Mendacious visualization

State of the Union Visualizer | Brad Borevitz | 2010

George W. Bush SOTU | 2001Harry S. Truman SOTU | 1953
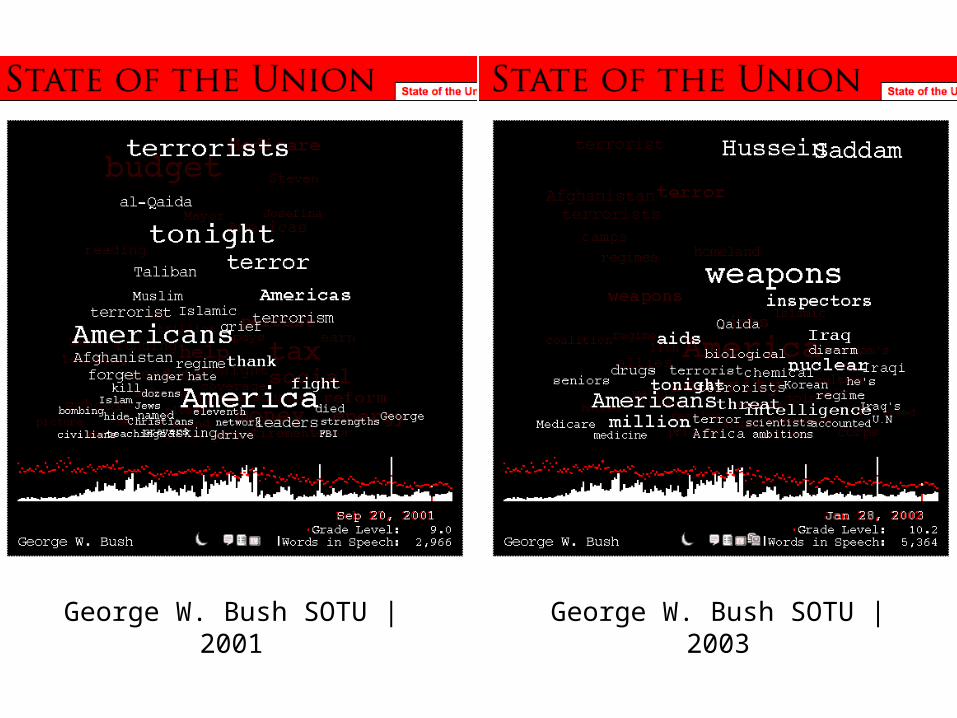
George W. Bush SOTU | 2001 George W. Bush SOTU | 2003

Barack Obama | State of the Union | 2010

State of the Union | Lenka Clayton | 2003
Data Sonification
#9
Connection to the digital humanities?
What’s the future?
#10