data visualisation for analysis in scholarly research · data visualisation for analysis in...
TRANSCRIPT

Data Visualisation for Analysis in Scholarly Research
British Library Digital Scholarship Training Programme August 2014
Mia Ridge, Open University
@mia_out http://miaridge.com

While we're getting started…
• Check that the mouse on your laptop works and that you can get online with the browsers Firefox or Chrome
• Unzip the file containing the slides and exercise handouts and copy the folder to your desktop
• Dig out your GMail/Google login details (if you have an account)

Timetable
• 10am Start
• 11:30-11:45 Break
• 13:00-14:00 Lunch
• 15:00 Conclude
• Sources and further reading
http://bit.ly/UJwgEz

Overview
• Introductions; what is data visualisation?
• History and types of visualisations
• Visualisations for scholarly analysis
• Preparing and cleaning data
• Planning visualisations
• Creating your first visualisations

What is data visualisation?
• '…the graphical display of abstract information for ... sense-making (also called data analysis) and communication' (Stephen Few)
• '…showing quantitative and qualitative information so that a viewer can see patterns, trends, or anomalies, constancy or variation, in ways that other forms – text and tables – do not allow.' (Michael Friendly)
• '…interactive, visual representations of abstract data to amplify cognition' (Card et al)


Who am I?
Tool from http://neatline.org/

Introductions
• In a sentence or two, what's your interest in data visualisation? Do you have any potential users in mind? What’s the goal of any visualisations you’re interested in creating? What kinds of data do you work with?

TYPES OF VISUALISATIONS

Visualisations as intersection of format and purpose
• Data types: quantitative, qualitative, geographic, time series, media, entities (people, places, events, concepts, things)
• Static or interactive; print or digital
• Product or process; exploratory or explanatory: find new insights, or tell a story? Pragmatic, emotive?


EXAMPLES
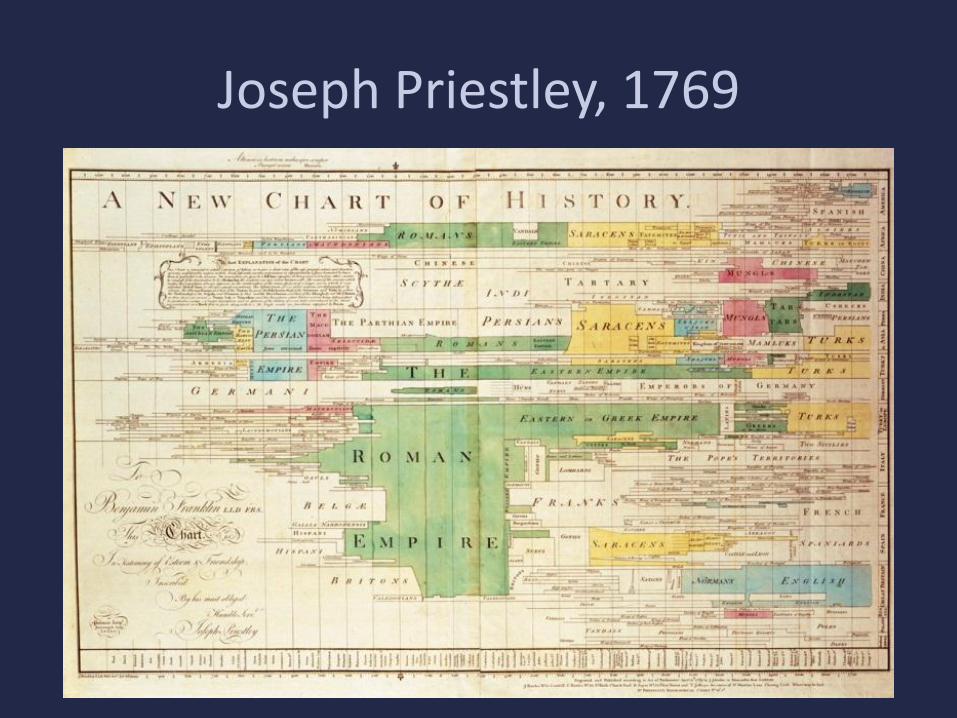
Joseph Priestley, 1769

John Snow’s cholera map, 1854

Florence Nightingale's petal charts, 1857

Charles Minard’s figurative map, 1869
'Figurative Map of the successive losses in men of the French Army in the Russian campaign 1812-1813'. Drawn up by M. Minard, Inspector General of Bridges and Roads in retirement. Paris, November 20, 1869.

...translated
http://hci.stanford.edu/jheer/files/zoo/ex/maps/napoleon.html

The old tube map

Harry Beck, 1931

Web 2.0 and the mashup, 2006

Visualising images and video, 2012
http://www.flickr.com/photos/culturevis/5883371358/ ‘Mondrian vs. Rothko’, Lev Manovich, 2010. images preparation: Xiaoda Wang
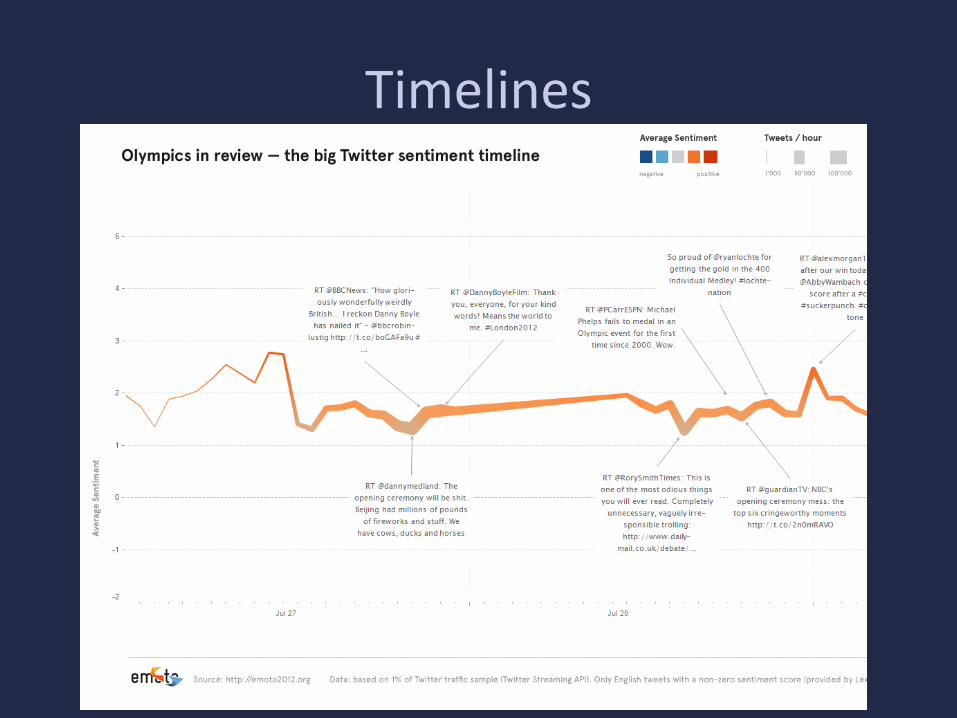
Timelines


Infographics
http://notes.husk.org/post/509063519/infographics

Network visualisations
http://fredbenenson.com/blog/2012/12/05/the-data-behind-my-ideal-bookshelf/

Exercise 1: network visualisations
1. In your browser, go to http://bit.ly/11qqXuj 2. Scroll down the page to the network graph. 3. Take a few minutes to explore it: try holding
the cursor over items, clicking, dragging, etc. 4. You can see the same data represented in
other graphs below. 5. Discuss with your neighbour: does interacting
with the network graph give you more or less information than the other visualisations? Does it open up new questions?

N-grams
http://books.google.com/ngrams/

Exercise 2: comparing N-gram tools
1. Think of two words or phrases you’d like to compare over time (e.g. Burma, Burmah)
2. Open two browser windows
3. In one, go to http://books.google.com/ngrams
4. In the other, go to http://bookworm.culturomics.org/OL/
5. Enter your words or phrases in each and compare the results
6. Discuss with your neighbour: what differences did you find, and what might have caused them?

Exercise 2: Bookworm tips Click here to change options

Topic modelling
http://discontents.com.au/mining-for-meanings/ http://wraggelabs.com/shed/presentations/nla/#slide-24

Other forms of text analysis
Entity recognition: turning text into things

Scholarly data visualisations
• Visualisations as ‘distant reading’ where distance is ‘a specific form of knowledge: fewer elements, hence a sharper sense of their overall interconnection’ (Moretti, 2005)
• Inspiring curiosity and research questions
• But - which questions do they privilege and what do they leave out?

Exercise 3: exploring scholarly visualisations
In pairs, explore and discuss one of the visualisations listed • What do you think is being presented here? What stories or
trends can you start to see? Does it work better at one scale over another? Do you find it more effective at aggregate or detail level? Does it present an argument or provide a space to develop and explore one? If it was designed to present an argument or investigate a particular question, what do you think that was, and how did it shape the visualisation? What have you learned from visualisation that you might not have learned from looking at the data or reading text about it?
• Report back to the group: summarise the site's purpose, visualisation formats and data types in a sentence, then share the most interesting parts of your discussion

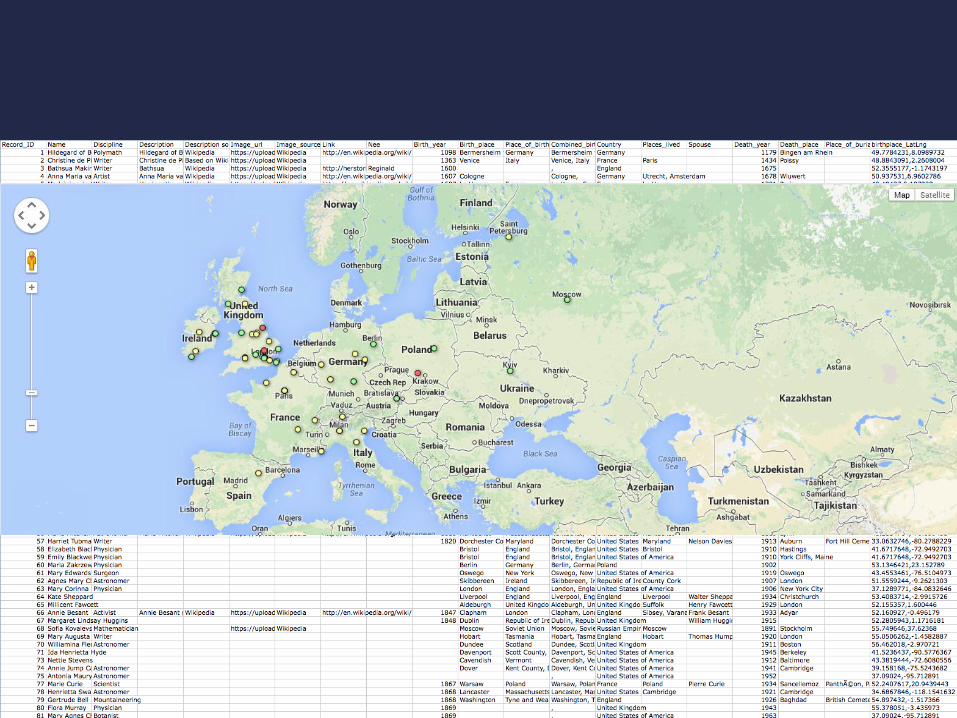
University of Richmond, “Visualizing Emancipation”
http://www.americanpast.org/emancipation/
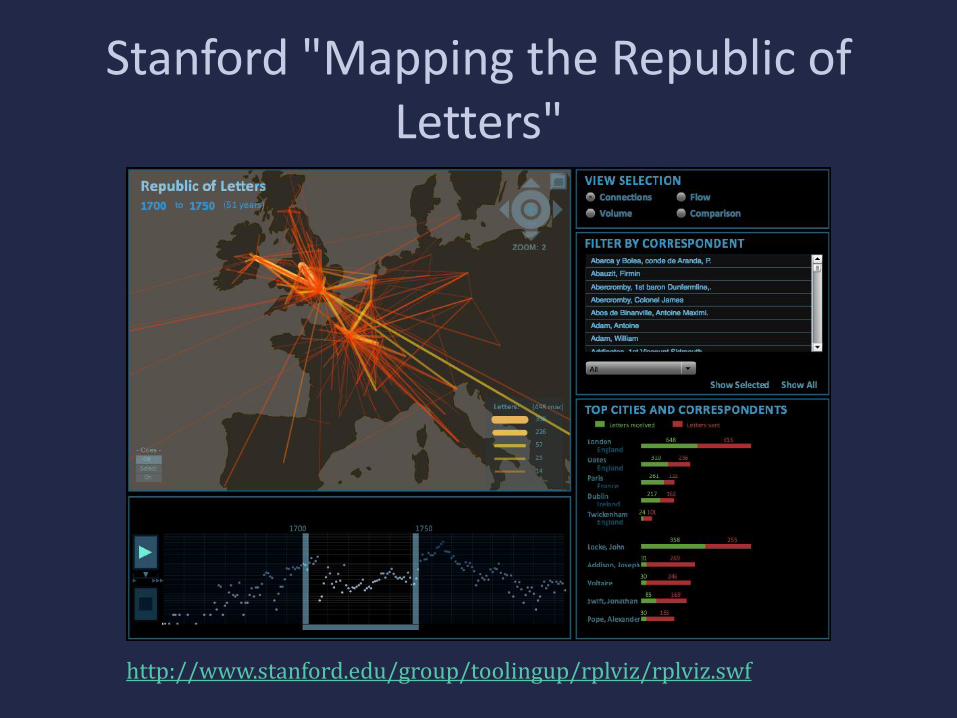
Stanford "Mapping the Republic of Letters"
http://www.stanford.edu/group/toolingup/rplviz/rplviz.swf

GAPVis
http://gap.alexandriaarchive.org/gapvis/index.html

Digital Harlem
http://www.acl.arts.usyd.edu.au/harlem/

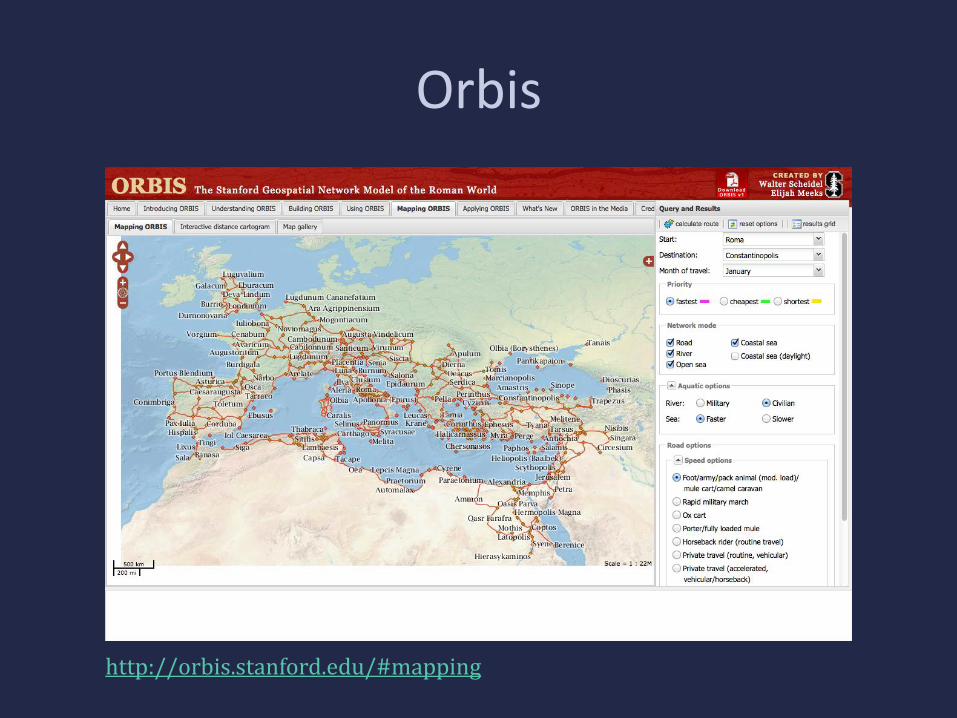
Orbis
http://orbis.stanford.edu/#mapping

Kindred Britain
http://kindred.stanford.edu/

Lost Change
http://tracemedia.co.uk/lostchange/

Exercise 3: exploring scholarly visualisations
In pairs, explore and discuss one of the visualisations listed • What do you think is being presented here? What stories or
trends can you start to see? Does it work better at one scale over another? Do you find it more effective at aggregate or detail level? Does it present an argument or provide a space to develop and explore one? If it was designed to present an argument or investigate a particular question, what do you think that was, and how did it shape the visualisation? What have you learned from visualisation that you might not have learned from looking at the data or reading text about it?
• Report back to the group: summarise the site's purpose, visualisation formats and data types in a sentence, then share the most interesting parts of your discussion

Comments or questions?
Considerations for GLAM data
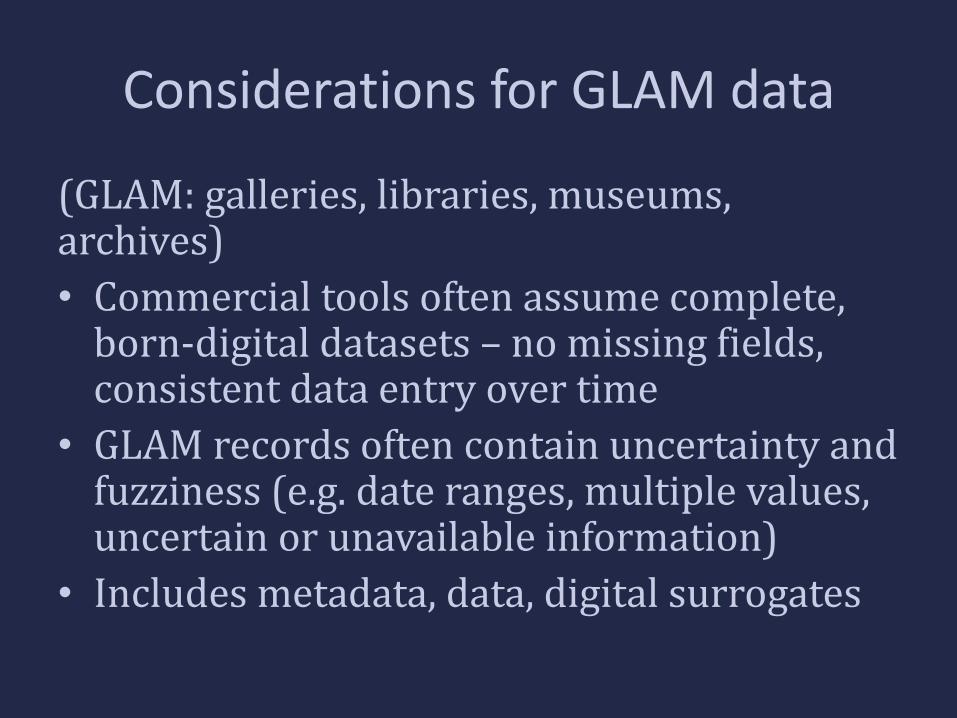
(GLAM: galleries, libraries, museums, archives)
• Commercial tools often assume complete, born-digital datasets – no missing fields, consistent data entry over time
• GLAM records often contain uncertainty and fuzziness (e.g. date ranges, multiple values, uncertain or unavailable information)
• Includes metadata, data, digital surrogates

When were objects collected?
http://ibm.co/OS3HBa

Messiness in GLAM data
• 'Begun in Kiryu, Japan, finished in France' • 'Bali? Java? Mexico?' • Variations on USA:
– U.S. – U.S.A – U.S.A. – USA – United States of America – USA ? – United States (case)
• Inconsistency in uncertainty – U.S.A. or England – U.S.A./England ? – England & U.S.A.

Computers don't cope

Preparing data for visualisations
GLAM data often needs manual cleaning to: remove rows where vital information is missing tidying inconsistencies in term lists or spelling converting words to numbers (e.g. dates) remove hard returns and non-ASCII characters (or change data format) split multiple values in one field into other columns (e.g. author name, date in single field) expand coded values (e.g. countries, language)

Data Preparation
• Generally needs to be in tables, one row per item, one column per value
• Data cleaning tools
– Excel
– OpenRefine http://openrefine.org
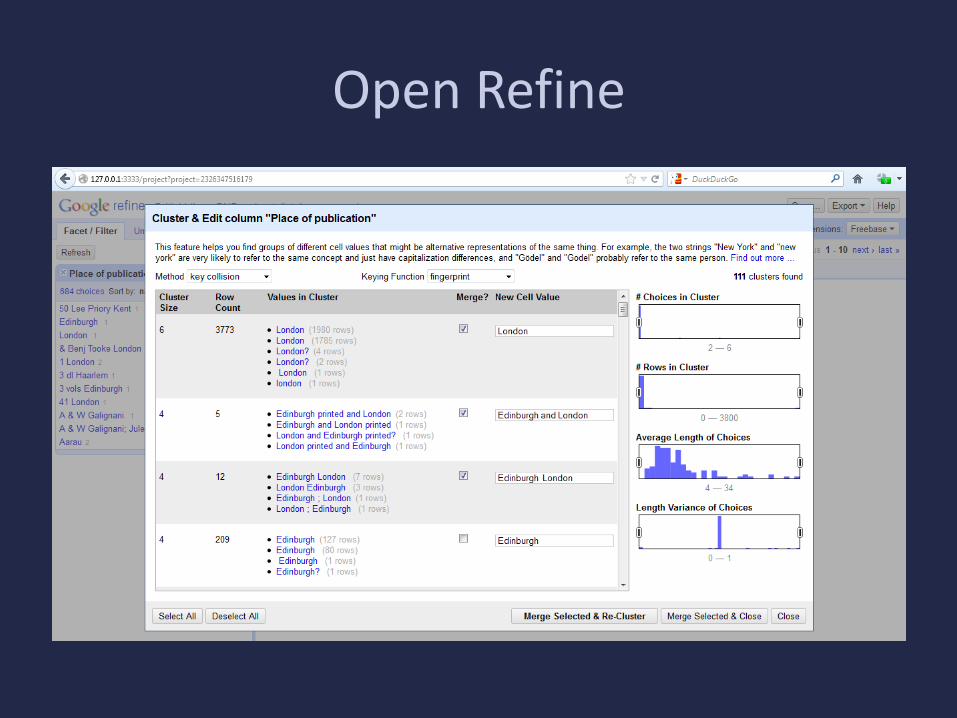
Open Refine

…but be careful

Reconciling and enhancing data
• Test data quality and create new visualisation possibilities
• What other data can you join to yours? – Information from general sites like Wikipedia, Freebase,
VIAF – Information from other GLAMs and related disciplines – Other information about the same event, place, person,
object, etc – General contextualising information – science, history,
reviews, citations?
• e.g. Open Refine – try reconciling against other datasets for geo-coding, entity extraction, etc

Linking Makers to the rest of the web 191877 Versace, Gianni Gianni Versace 1946 1 Designer
191881 Versace, Gianni Gianni Versace 1946 1 Designer
191882 Versace, Gianni Gianni Versace 1946 1 Maker
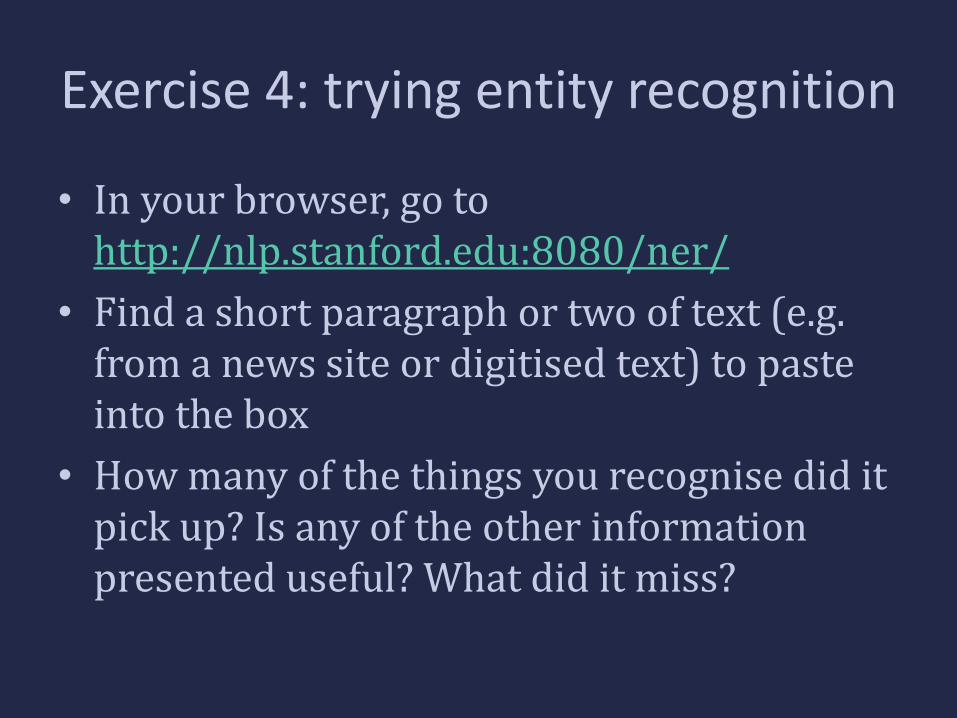
Exercise 4: trying entity recognition
• In your browser, go to http://nlp.stanford.edu:8080/ner/
• Find a short paragraph or two of text (e.g. from a news site or digitised text) to paste into the box
• How many of the things you recognise did it pick up? Is any of the other information presented useful? What did it miss?

Planning a visualisation
...is like planning for a meal:
Buffet or banquet?
Do you have all the ingredients you need?
How do they need to be prepared? What prep needs to be done the day before?
Who are you serving it to, and what do they like?

Planning a visualisation
‘Four Pillars of Visualization’
• Purpose (the why)
• Content (the what)
• Structure (the how)
• Formatting (everything else)
http://complexdiagrams.com/4pillars

Types of visualisations (review)
• Intersections of format and purpose
• Data types: quantitative, qualitative, geographic, time series, media, entities (people, places, events, concepts, things)
• Static, interactive; print, digital
• Product, process; exploratory, explanatory: find new insights, or tell a story? Pragmatic, emotive?

Worst practice in data visualisations
Source: http://www.forbes.com/sites/naomirobbins/2013/01/03/deceptive-donut-chart/
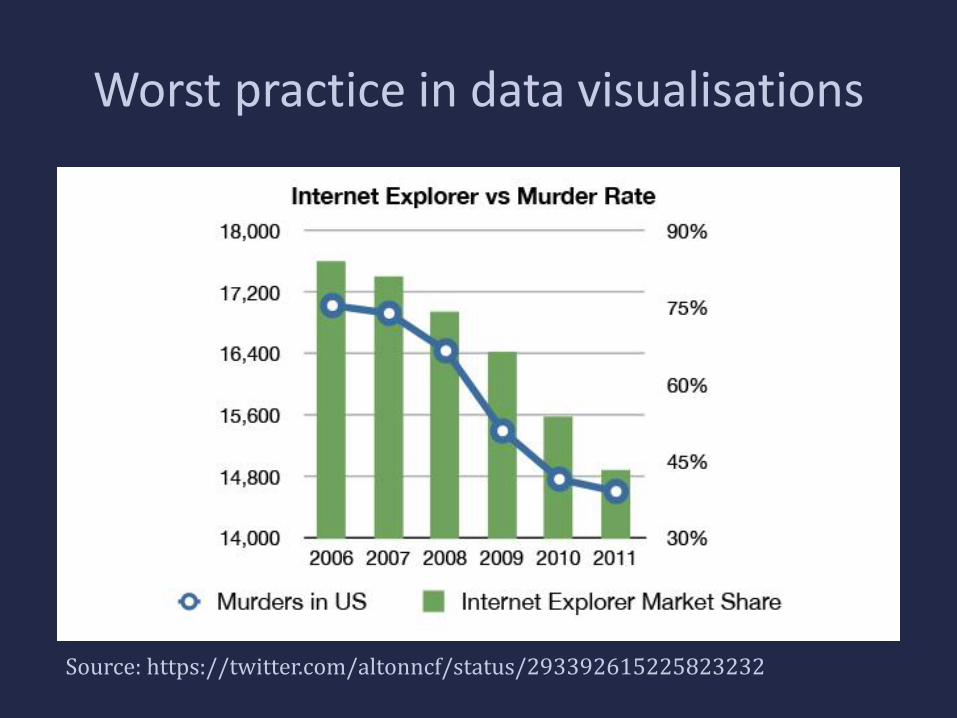
Worst practice in data visualisations
Source: https://twitter.com/altonncf/status/293392615225823232

Best practice visual design
• How effectively does the visualisation support cognitive tasks?
• Most important and frequent visual queries/pattern finding should be supported with the most visually distinct objects (e.g. colour (hue, lightness), elementary shape (orientation, size, elongation), motion, spatial grouping and stereoscopic depth)


Bertin’s retinal variables via Making Maps: A Visual Guide to Map Design for GIS by John Krygier and Denis Wood

Dealing with complex data
• Find a visualisation type that can harbour the data in a meaningful way or reduce the data in a meaningful way.
– e.g. go from individual values to distribution of values
– e.g. introduce interaction: overview, zoom and filter, details on demand (Ben Shneiderman)

Do you really need a visualisation?
• Use tables when the goal is to: – look up individual values
– compare individual values
– use precise values
– display quantitative data that uses more than one unit of measure
• Use visualisations when: – the message is contained in the shape of the values
– the document will be used to reveal relationships among values
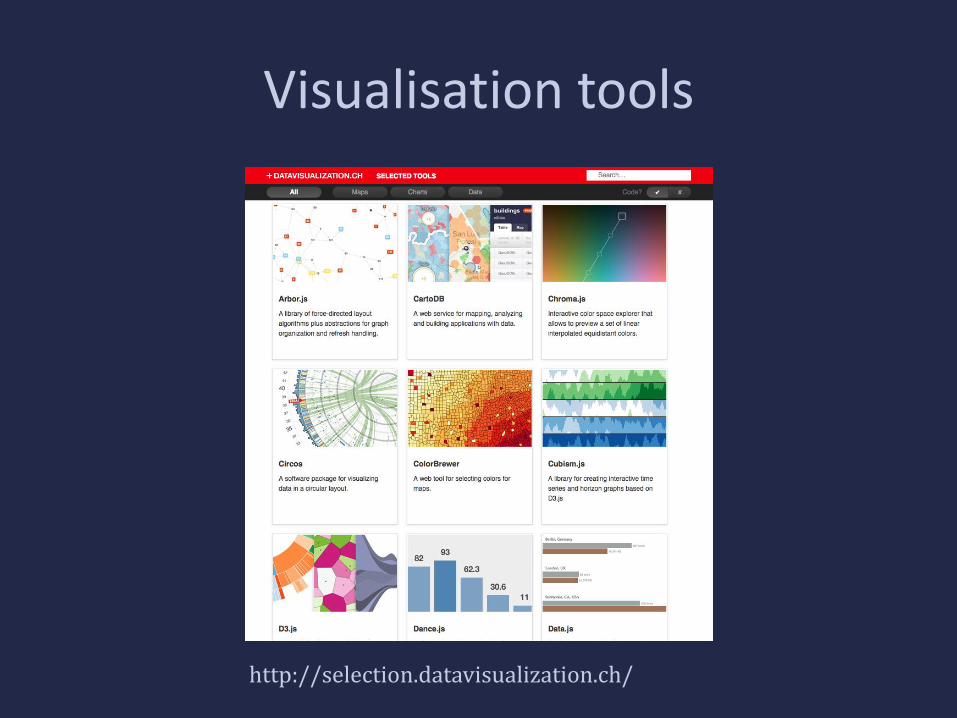
Visualisation tools
http://selection.datavisualization.ch/

Tools that don’t require programming
• Excel
• Google Fusion Tables, Google Drive
• IBM Many Eyes
• Tableau Public

IBM Many Eyes

Tableau Public
http://www.guardian.co.uk/news/datablog/interactive/2011/nov/23/pay-annual-survey-hours-earnings-visualised

Exercise 5: create a chart using Google Fusion Tables
• Instructions on the hand-out

Sample pie chart results

Comments or questions?

Exercise 6: geocoding data and creating a map using Google Fusion
Tables
• Instructions on the hand-out, screenshots follow this slide

Exercise 6: geocode

Exercise 6: add a new map

Exercise 6: update the source location field

Exercise 6: map results
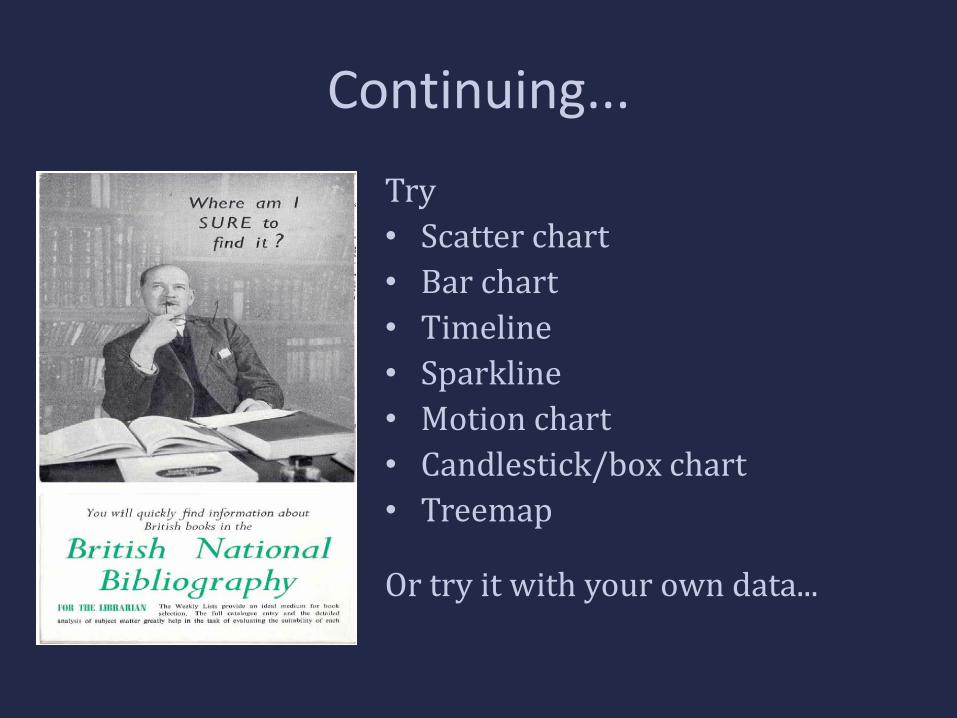
Continuing...
Try
• Scatter chart
• Bar chart
• Timeline
• Sparkline
• Motion chart
• Candlestick/box chart
• Treemap Or try it with your own data...

Exercise 7: Choose your own adventure
Visualising British Library data • Google Docs dataset for Pin-a-tale • http://bit.ly/WT1Ai5
• Choose a type of visualisation (map, timeline, chart,
etc) and evaluate the results – Is your dataset in a suitable format for your
visualisation type? How can you clean it? – Is more cleaning or transformation needed? You may
need to iterate with different versions of your data – Optionally, sketch out your visualisation on paper to test
your ideas

Planning your own visualisation
• With a dataset in mind, consider...
• Exploratory or explanatory? Static or dynamic? Small- or large-scale?
• Choose a type of visualisation (map, timeline, chart, etc) – Is your dataset in a suitable format for your
visualisation type? How can you clean it?
– Optionally, sketch out your visualisation on paper to test it

Review: visualisation tools
• Any data cleaning tips?
• What did you learn about the data?
• What did the tool do well? Poorly?
• Were the tool and the data a good match for each other?
• What other data could you link to?

Review: publishing visualisations
• How can you contextualise, explain any limitations of your visualisations? e.g.
– provenance and qualities of original dataset;
– what you needed to do to it to get it into software (how transformed, how cleaned);
– what's left out of the visualisation?

References and finding out more
http://bit.ly/UJwgEz
Thank you!
Mia Ridge, Open University
http://miaridge.com
@mia_out