data visualization on game consoles - uva visualization on game consoles ren ... performance of d3...
TRANSCRIPT

Bachelor Informatica
Universiteit van Amsterdam
Data Visualization on GameConsolesRene Aparicio Saez
June 18, 2014
Supervisor(s): Robert Belleman (UvA), Christophe Gueret (VU),Frank Nack (UvA)
Signed:
Informatica—
Universiteit
vanAmst
erdam

2

Abstract
Current game consoles provide quite well performing hardware. It is therefore proposedthat game consoles can be used to create data visualizations in a fast and easy way. Theperformance of D3 based information visualizations is tested out for each game console,using a variety of D3 visualizations. Alongside, interaction experiments are conducted toshow the interaction performance of each game consoles controller. This is done with someinput experiments and a Fitts’ Law test. The results of the D3 experiments show that gameconsoles are not performing faster than currently available PCs. The interaction experimentsshow that test subjects preferred a mouse and keyboard over any game console controller.The experimental results however show that the Nintendo Wii U gamepad performs almostequally as well as the mouse and keyboard in most tests. All in all, the use of game consolesfor data visualization by using the web browser is currently not a desired way to go. Thishas to do with the limited amount of visualization methods available and the game consolecontrollers not performing as well as conventional methods on the PC.
3

4
Contents
1 Introduction 7
2 Personal Computers verse Game Consoles 10
2.1 Specifications . . . . . . . . . . . . . . . . . . . . . . . . . . . . . . . . . . . . . . 11
2.1.1 CPUs and GPUs in personal computers . . . . . . . . . . . . . . . . . . . 11
2.1.2 Game console specifications . . . . . . . . . . . . . . . . . . . . . . . . . . 11
2.1.3 Game console controllers . . . . . . . . . . . . . . . . . . . . . . . . . . . . 12
2.2 Discussion . . . . . . . . . . . . . . . . . . . . . . . . . . . . . . . . . . . . . . . . 13
3 Data visualization on Game Consoles 16
3.1 Data visualization developments options . . . . . . . . . . . . . . . . . . . . . . . 17
3.2 Web-based data visualization development options . . . . . . . . . . . . . . . . . 17
3.3 Validation of development options . . . . . . . . . . . . . . . . . . . . . . . . . . 18
3.4 Discussion . . . . . . . . . . . . . . . . . . . . . . . . . . . . . . . . . . . . . . . . 19
4 Experiments 20
4.1 Support experiments . . . . . . . . . . . . . . . . . . . . . . . . . . . . . . . . . . 21
4.1.1 Keeping the browser active . . . . . . . . . . . . . . . . . . . . . . . . . . 21
4.1.2 High resolution timing . . . . . . . . . . . . . . . . . . . . . . . . . . . . . 22
4.1.3 JavaScript event call support and behavior . . . . . . . . . . . . . . . . . 22
4.1.4 D3 file reading . . . . . . . . . . . . . . . . . . . . . . . . . . . . . . . . . 22
4.1.5 Button recognition using Gamepad.js . . . . . . . . . . . . . . . . . . . . 23
4.2 D3 experiments . . . . . . . . . . . . . . . . . . . . . . . . . . . . . . . . . . . . . 23
4.2.1 D3 chord experiment . . . . . . . . . . . . . . . . . . . . . . . . . . . . . . 23
4.2.2 D3 graph experiment . . . . . . . . . . . . . . . . . . . . . . . . . . . . . . 24
4.2.3 Discussion . . . . . . . . . . . . . . . . . . . . . . . . . . . . . . . . . . . . 25
4.3 Interaction experiments . . . . . . . . . . . . . . . . . . . . . . . . . . . . . . . . 25
4.3.1 Button detection within the browser . . . . . . . . . . . . . . . . . . . . . 25
4.3.2 Mouse movement within the browser . . . . . . . . . . . . . . . . . . . . . 26
4.3.3 User input interaction . . . . . . . . . . . . . . . . . . . . . . . . . . . . . 27
5 Results 28
5.1 D3 Experimental Results . . . . . . . . . . . . . . . . . . . . . . . . . . . . . . . 29
5.1.1 Chord experiment . . . . . . . . . . . . . . . . . . . . . . . . . . . . . . . 29
5.1.2 Graph Experiment . . . . . . . . . . . . . . . . . . . . . . . . . . . . . . . 30
5.2 User interaction Experimental Results . . . . . . . . . . . . . . . . . . . . . . . . 31
5.2.1 Textual and numerical input . . . . . . . . . . . . . . . . . . . . . . . . . 31
5.2.2 Dropdown menu input . . . . . . . . . . . . . . . . . . . . . . . . . . . . . 32
5.2.3 Fitts’ Law experiment . . . . . . . . . . . . . . . . . . . . . . . . . . . . . 33
5.2.4 Overall remarks . . . . . . . . . . . . . . . . . . . . . . . . . . . . . . . . . 34
6 Discussion 35
6.1 Main discussion . . . . . . . . . . . . . . . . . . . . . . . . . . . . . . . . . . . . . 37
6.2 D3 Experiment . . . . . . . . . . . . . . . . . . . . . . . . . . . . . . . . . . . . . 37
6.3 Interaction Experiments . . . . . . . . . . . . . . . . . . . . . . . . . . . . . . . . 37
5

7 Conclusion 397.1 Javascript support . . . . . . . . . . . . . . . . . . . . . . . . . . . . . . . . . . . 417.2 Visualization methods support . . . . . . . . . . . . . . . . . . . . . . . . . . . . 417.3 Experimental results . . . . . . . . . . . . . . . . . . . . . . . . . . . . . . . . . . 41
7.3.1 D3 experiments . . . . . . . . . . . . . . . . . . . . . . . . . . . . . . . . . 417.3.2 Interaction experiments . . . . . . . . . . . . . . . . . . . . . . . . . . . . 41
7.4 Final conclusion . . . . . . . . . . . . . . . . . . . . . . . . . . . . . . . . . . . . 42
6

7

8

CHAPTER 1
Introduction
Data visualization is used in practically all fields of work. Either in scientific visualization toprimarily represent three dimensional phenomena[1], or information visualization in order to rep-resent abstract data to reinforce human cognition[2]. Recently the field of abstract visualizationgained more interest, where interactive environments are used to visually explore data. Thisinterest is partially caused by the improved capabilities of current available hardware. Mainlythe increase in graphical hardware has resulted in a variety of visualization tools and softwarein order to visualize large complex datasets.While one could expect that these developments would gain a larger audience access to advanceddata visualization facilities, this is not the case. The main reason for this is the use of nonstandardized user interfaces on PCs. Inexperienced users are not able to make proper use ofthese interfaces resulting in a steep learning curve.The use of another computing platform such as game consoles, might provide better interfaces.Besides being optimized for graphical applications, game consoles provide a standardized way ofinteraction through their controllers.To find out if data visualization is indeed possible in a fast and easy way, two main aspects needto be looked at. Firstly, is the visualization process fast enough compared to the same visualiza-tion currently done on PCs. Secondly, is the interaction with data input and the visualizationsenhanced.In order to narrow down the visualization field this paper will mainly focuses on informationvisualization, looking at the D3js library as presented by Bostock[3] et al. For interaction themain indication of performance will be found by performing a Fitts’ Law experiment, as proposedby Paul Fitts [4].
9

10
CHAPTER 2
Personal Computers verse Game Consoles
2.1 Specifications
In order to create an expectation in performance for each game console, hardware specificationsare required. When comparing these game console specifications to that of current personal com-puters, an assumption can be made on the performance of each game console for visualizing data.This will not guarantee that better specifications will result in faster visualization performance,but it will indicate if each game console should be able to perform in the same way as a personalcomputer.The most interesting aspects to compare are the central processing unit (CPU) and its graphicalprocessing unit (GPU) specifications, because those are the components that will be used mostlywhen visualizing data. Low-demanding visualizations will not need a good GPU, while 3D visualdata, or bigger models will require a good working, preferably high-end, GPU.Another main aspect is the difference in user interaction. What are the main differences betweeneach game console’s controller and how do they compare towards a mouse and keyboard.
2.1.1 CPUs and GPUs in personal computers
Current personal computers are often equipped with an Intel CPU. These hardware componentsallow for a reasonable performance. Current CPUs have either four or eight cores, capable ofrunning between four and eight threads on each core. The CPUS that are currently on themarket are capable of around 7.8 GFLOP/s up to 20.8 GFLOP/s. While this is quite decent formost users, it is usually not enough for the visualization of big data sets. In order to enhancethe performance of large visualizations, most computers are equipped with an additional GPU.GPUs provide much more performance power to a computer. Ranging from 72 GFLOP/s up to5100 GFLOP/s for the currently available GPUs, the performance compared to that of a CPU issignificantly higher. While the best performing GPU comes with great specifications, it shouldbe noted that it is unlikely for most consumers to have such a GPU at their disposal. It is morelikely that most current PCs are equipped with a GPU that is capable of around 600 GFLOP/sto around 1500 GFLOP/s1. These GPUs cost roughly around 80 to 200 USD.
2.1.2 Game console specifications
Several game consoles exist on the market today. Most known are the Xbox, the PlayStationand the Nintendo Wii. All three of which have different generations. Besides these “main gameconsoles”, recently a smaller game console producer appeared on the market: OUYA is a newlydeveloped game console, running on Android 4.1. The main specifications for each game consolecan be found in table 2.1.While the older generations have specifications which are not very special compared to currentlyused and sold personal computers, the newer generations specifications are quite impressive.Especially the number of Floating Point Operations per second that can be handled by both theXbox one and the PlayStation 4 are currently quite high compared to the most used graphicscards on personal computers.When looking at these specifications, two of the game consoles pop-out: these being the XboxOne and the PlayStation 4. This is no surprise, since these game consoles are the latest on
1Based on GPUs inside PCs that are currently most sold on the market
11

the market. The Wii U takes a solid third place, but falls far behind when looking at thespecifications of both the Xbox One and the PlayStation 4.The OUYA has the worst specifications of all game consoles. While the CPU comes in range ofthe older generations game consoles, the GPU lacks performance power even compared to theolder generation game consoles. The OUYA will therefore most likely not perform well whenvisualizing difficult visual data.From these hardware specifications we can assume that either the Xbox One or the PlayStation4 should be able to perform the best from this list of game consoles. To find out which of thegame consoles is capable of good performing data visualization, actual experiments should beconducted.
Table 2.1: Specifications of current game consoles[5][6][7][8].
Gameconsole
Xbox 360 PlayStation3
NintendoWii
NintendoWii U
OUYA PlayStation4
Xbox One
Date ofrelease
2005,November22
2006,November17
2006,November19
2012,November18
2012, De-cember 28
2013,November15
2013,November22
CurrentPrice
$199.99 ore199
$199.99 ore179
$100 ore119
$299.99 ore299.99
$99 ore129
$399.99 ore399
$499.99 ore499
CPU 3.2GHzXenonprocessor,3 dual-threadedcores
3.2GHz Cellprocessor,7 single-threadedcores (plus1 backupcore)
729 MHzIBM”Broad-way”-processor
1.24GHzTri-CorePowerPC”Espresso”processor
1.7 GHzQuad-CoreARMCortex-A9
1.6GHzAMD”Jaguar”processor, 8cores
1.75GHzAMD”Jaguar”processor,8 cores
GPU ATI Xenos RSX ”Real-ity Synthe-sizer”
ATI ”Hol-lywood”
AMD”Latte”GPU
NvidiaULPGeForce
AMDRadeonGraphicsCoree
853 MHzAMDRadeonGPU
PeakGPUspeed
230GFLOP/s
192GFLOP/s
11GFLOP/s
352GFLOP/s
8GFLOP/s
1840GLOP/s
1231GFLOP/s
2.1.3 Game console controllers
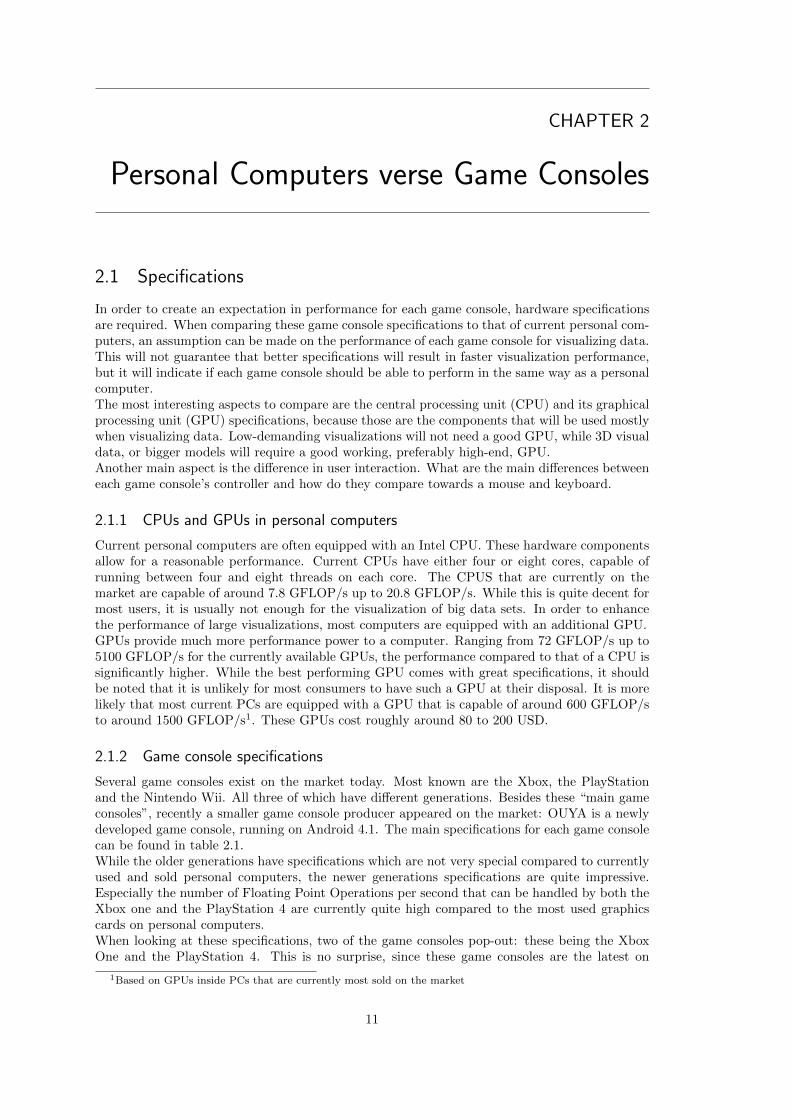
Each game console has its own controller. Each controller has around the same amount of buttonsas shown in figure 2.1. The controller buttons are:
• Two rotating sticks
• Four Arrow buttons
• Four buttons for interaction
• Two “triggers” buttons (on top of the controller)
• Two “bumper” buttons (on top of the controller)
The PlayStation 4 , the OUYA and the Wii U come with another interaction possibility. ThePlayStation 4 and the OUYA have a touchpad integrated into the controller above the sticks.Currently this touchpad is not used by many developers yet. But in theory it can be used as asingle button that can create different types of interaction, because the touchpad can recognizethe location of where it is pressed and movement made on the touch pad. It might be possibleto use this touch pad for interaction with data visualizations.
12
The Wii U has a 6.2 inch touch screen in the middle of the controller. This controller is currentlyused in games for multiple functions. In some cases the screen provides additional informationto the user or the screen is used to perform actions in a way of a mini game. This controller cantherefore also be seen as a tablet, which allows for a whole range of new interaction methods.While user interaction on a mouse and keyboard is done by assigning certain keys to an in-teraction. Since the keyboard has so many keys, no standardized button mapping was everconstructed. Controllers on the other have the same amount of buttons, developers thereforemostly map certain interactions to the same button on each game console. This creates a stan-dardized button mapping, which might allow for a lower learning curve and thus be easier to useby inexperienced users.
Figure 2.1: A variety of controllers2. In the top row from left to right: the Xbox One, thexbox 360, the Nintendo Wii U. In the bottom row from left to right: left the PlayStation 4, thePlayStation 3, the OUYA controller. On the far right the Nintendo Wii.
2.2 Discussion
When comparing the specifications of game consoles to specifications of currently used PC hard-ware, only a few differences can be noticed. While PCs support multithreading, most gameconsoles only come with single threaded cores, therefore having worse CPUs than PCs.However game consoles are mainly used for visual representation. Therefore the GPU is the moreimportant aspect inside a game console. When comparing the performance of floating point op-erations of each game console and the date each game console was released, it becomes clear thatgame consoles consist of very good performing GPUs as can be seen in figure 2.2. This benefitsthe idea of the capability of game consoles to visualize data, since this mostly requires graphicalpower. Even though GPUs are becoming faster every month, consumers will not always haveaccess to these latest GPUs. Therefore the current available game consoles will perform well forthe coming period of time.
2original images:http://compass.xboxlive.com/assets/31/30/31300e32-18a7-4efa-9a53-a8ae8d879776.jpg?n=controller_
screen01.jpg
http://compass.xboxlive.com/assets/4e/31/4e316212-86a6-4142-bfb7-4023dec04ef5.jpg?n=
WirelessControllerTransformingDPad_F-screen.jpg
http://wiiudaily.com/wp-content/uploads/2011/06/wii-u-controller1.jpg?af4e70
http://media.engadget.com/img/product/30/nk1/wii-remote-plus-2imt-800.jpg
http://www.panotur.com/wp-content/uploads/2013/02/ps4-controller-hd-wallpaper.jpg
http://www.joypadcontroller.com/wp-content/uploads/2012/06/ds3_wc_4_lg.jpg
http://www.classicretrocorner.com/wp-content/uploads/2013/06/ouya-controller.jpg
13

Another main difference is the method of interaction between the user and the machine. WhilePCs mostly use a mouse and keyboard, the game console makes use of a controller, as explainedin the previous section. While a keyboard is mostly used for typing, a game console does notreally focus on this feature, and is therefore not equipped with a keyboard. Because of thisthe number of buttons is much lower than there are keys on a keyboard, allowing for a morestandardized way of interaction between user and machine.Finally the price for each game console is considerably lower than the price of a PC with decentspecifications. This mainly comes because of the fact that game consoles are mass producedwith the same hardware, lowering their retail price. Compared to less produced and more inter-changeable hardware inside computer systems. Another issue is the fact that when buying a PCyou need to install an OS, which could increase the price even more.Considering these differences, it seems reasonable to assume that game consoles could be usedfor data visualization. In order to find out if game consoles indeed perform as is expected, aseries of test have to be conducted. These will be explained in the following chapter.
14

Figure 2.2: Performance comparison (in GFLOP/s) of Intel CPUs, nVidia GPUs, AMD GPUsand game console GPUs against their release time. 3
3original image from: http://www.karlrupp.net/wp-content/uploads/2013/06/gflops-sp.png
15

16

CHAPTER 3
Data visualization on Game Consoles
3.1 Data visualization developments options
To create data visualization on game consoles, two possibilities can be considered: the develop-ment of native applications and the development of a browser based solution. The developmentof native applications for each game console poses some problems. Each game console needs theirown implementation for the same visualization. Besides that the use of development toolkits foreach game console require payment to the game console manufacturer. Native applications how-ever do provide optimized usages of the game consoles hardware.The use of a browser based solution on the other hand would only need a single implementationin order to work on each game console. A browser based solution also does not require anydevelopment toolkits, lowering the developments costs. The hardware of the game console mighthowever not be used in an optimized way for every visualization method.Since all game consoles on the market today provide an internet browser1, this seems like a goodapproach.
3.2 Web-based data visualization development options
Even though the field of visualization methods is narrowed down by the use of a web browser,nowadays a variety of methods can be found for data visualizations on a web browser. To createplots, charts, graphs and other two dimensional visualizations, a JavaScript library called D3 hasrecently gained increased interest. This data visualization method was published by Bostock[3]et al. explaining the variety of visualizations that could be created using this utility. The D3library is maintained and improved by a large number of people, is well documented and easyto use. The library uses JavaScript, SVG (Scalable Vector Graphics), HTML5 and CSS3 for itsvisualizations. These visualizations are build up from different kinds of shapes. Every shape canbe given a variety of attributes and styles. These element attributes are given to the D3 objectby selecting the proper element and appending the attributes in one go.
Figure 3.1: A D3 example. A randomly generated histogram2.
1The Xbox 360 and Xbox One required a Gold membership for Windows Live in order to make use of theinternet browser. This will however will be changed in an upcoming update.http://www.ign.com/articles/2014/05/13/microsoft-may-end-gold-membership-requirement-for-streaming-apps
2Source: http://bl.ocks.org/mbostock/3048450
17

Since D3 is mainly used for data visualization some shapes should be given certain scales. Thisis mainly done for the axes on a chart. By using this scaling method, data points for examplecan be easily placed along these axes. In addition to adding static attributes, it is possible tocreate attribute functions. This allows for more dynamic interaction with the attributes in orderto create different attributes for element within a single dataset. These functions can be givenarguments from within this dataset. Therefore it is for example possible to give different groupsinside the same dataset a different color or a different shape. Current web browsers all supportthese methods, but some older web browsers might not be able to use all of these standards.To create more complex visualizations, the recently created WebGL[9] standard could be a pos-sibility. Because WebGL utilizes the machines GPU more intensively, visualizations should berepresented in a faster way using WebGL. This allows for bigger visualizations and three dimen-sional visualizations, which opens up the way to scientific visualization possibilities.Although WebGL is quite new, all current PC web browsers support WebGL. It is however notclear if game consoles support WebGL. The recently released PlayStation 4 allegedly uses WebGLin its user interface3. WebGL therefore seems like a good way to go for complex visualizations.WebGL uses the HTML5 canvas to show its visualizations. The visualizations are created bymaking JavaScript calls and making use of the Document Object Model (DOM) interfaces.
3.3 Validation of development options
In order to test the support of these visualization methods, experiments should be created foreach visualization methods. These experiments should create an overview of the possibilities foreach method. To start off, a test should be done to check if the methods even work. For D3, thisis as simple as opening a set of web pages showing some D3 visualizations and check if they areshown correctly or not. For WebGL it is even easier to check if it is supported in the browser ornot. The creators of WebGL constructed a test page4 that shows the user if WebGL is supportedon the browser or what the problems might be if it is not supported.Before any experiments are completely constructed, we first test out each game console for thesupport of each library.
Figure 3.2: A WebGL example. An intractable globe showing the world’s population in 19955.
3http://siliconangle.com/blog/2013/11/20/webgl-graphics-technology-powers-sony-playstation-4-ui/4Support page for WebGL: http://http://get.webgl.org/5Source: http://workshop.chromeexperiments.com/globe/
18

3.4 Discussion
While D3 seems to be supported by all game consoles, some better than others, WebGL is notsupported by any game console at all. Even the PlayStation 4, which is known to have workingWebGL parts in its user interface does not support WebGL in its web browser. No officialcomments from the constructors of each game console can be found on why they do not supportWebGL in their game consoles.There was however a member of the main OUYA development team, Al Sutton, that commentedon questions[10] from users on whether WebGL would be supported on the OUYA any time soon.His response was that the main focus currently lies with creating native games and not browserbased games and therefore WebGL would not become an available option in its browser any timesoon.This is most likely the same reason why other game console producers do not allow their webbrowsers to use WebGL. They prefer that user play and buy their games instead of using thegiven web browser to play games.Because WebGL is not an option for browser based visualization on game consoles, the mainfocus will be on the D3 library. Now that it is known to work, additional experiments shouldbe created to test its full possibilities. These experiments must test the performance and theinteraction possibilities for each visualization per game console.Since it is clear that only the D3 library is a valid method for data visualization at this point, aseries of experiments have be constructed in order to test the performance of the D3 library oneach game console.Performance can be tested by running a variety of experiments a number of times. By increasingthe difficulty of these experiments a few times, plots can be created to show the increase intime to create certain visualizations per game console. This should not be done for just onevisualization but on a number of visualizations, in order to test multiple aspects of D3. Besidesthe visualization testing, some other aspects of D3 should be tested in order to find out if eachgame console can make use of the functions D3 has to offer or if there are any restrictions present.Besides experimenting with the D3 library, the interaction aspect of each game console has to betested out as well. A number of experiments should be done to test the interaction possibilities ona web browser. First off, an overview is needed to see which game console keys are recognized bythe browser. Secondly, the interaction between the user and the browser should be measured insome way. The D3 and interaction experiments are explained in more detail in the next chapter.
19

20
CHAPTER 4
Experiments
4.1 Support experiments
In order to construct proper working experiments for D3 three aspects of JavaScript have to belooked at: a work around has to be found for long running JavaScript programs in order to keepthe web browser active, the support of high resolution timing on game consoles and the supportof JavaScript event calls has to be researched for each game console. In addition it is useful tofind out if D3 file reading is supported by each game console. We also research the use of anexternal library that allows for user interaction through a gamepad controller on a web browser.
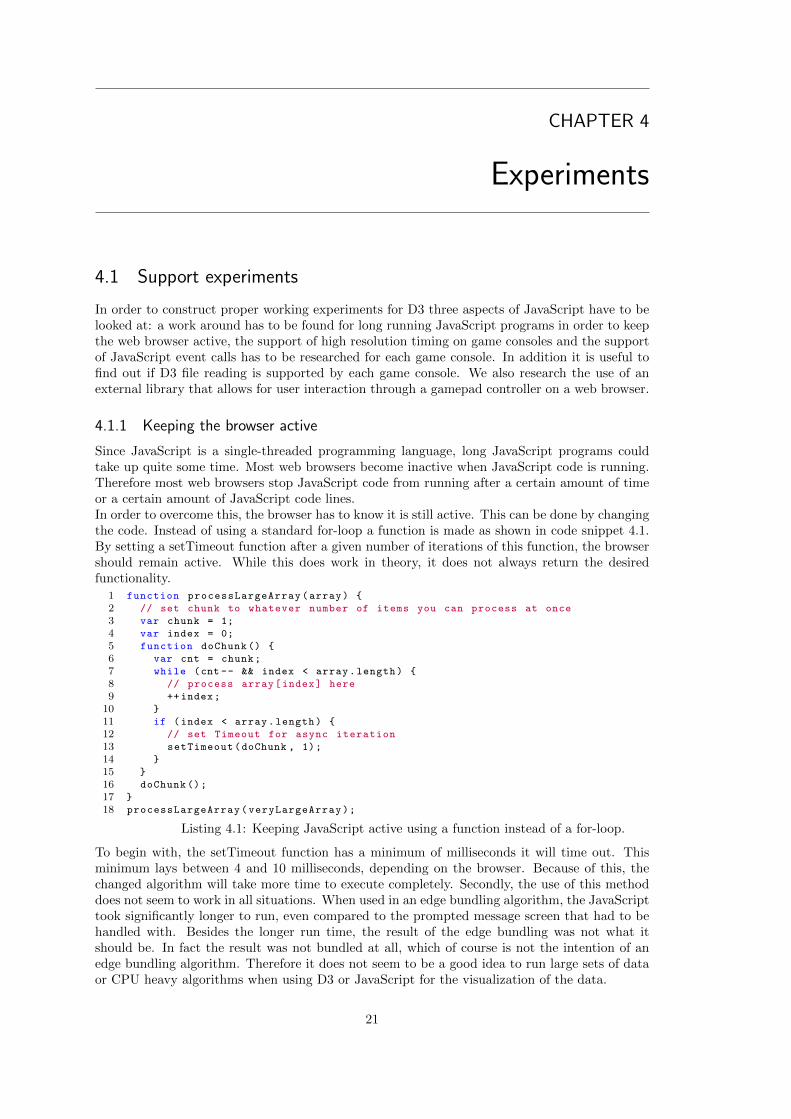
4.1.1 Keeping the browser active
Since JavaScript is a single-threaded programming language, long JavaScript programs couldtake up quite some time. Most web browsers become inactive when JavaScript code is running.Therefore most web browsers stop JavaScript code from running after a certain amount of timeor a certain amount of JavaScript code lines.In order to overcome this, the browser has to know it is still active. This can be done by changingthe code. Instead of using a standard for-loop a function is made as shown in code snippet 4.1.By setting a setTimeout function after a given number of iterations of this function, the browsershould remain active. While this does work in theory, it does not always return the desiredfunctionality.
1 function processLargeArray(array) {
2 // set chunk to whatever number of items you can process at once
3 var chunk = 1;
4 var index = 0;
5 function doChunk () {
6 var cnt = chunk;
7 while (cnt -- && index < array.length) {
8 // process array[index] here
9 ++index;
10 }
11 if (index < array.length) {
12 // set Timeout for async iteration
13 setTimeout(doChunk , 1);
14 }
15 }
16 doChunk ();
17 }
18 processLargeArray(veryLargeArray);
Listing 4.1: Keeping JavaScript active using a function instead of a for-loop.
To begin with, the setTimeout function has a minimum of milliseconds it will time out. Thisminimum lays between 4 and 10 milliseconds, depending on the browser. Because of this, thechanged algorithm will take more time to execute completely. Secondly, the use of this methoddoes not seem to work in all situations. When used in an edge bundling algorithm, the JavaScripttook significantly longer to run, even compared to the prompted message screen that had to behandled with. Besides the longer run time, the result of the edge bundling was not what itshould be. In fact the result was not bundled at all, which of course is not the intention of anedge bundling algorithm. Therefore it does not seem to be a good idea to run large sets of dataor CPU heavy algorithms when using D3 or JavaScript for the visualization of the data.
21
4.1.2 High resolution timing
To measure the execution time of each experiment, we need a reliable and accurate timer. Nowa-days, most PC browsers come with a form of high resolution timing (HRT), allowing for time mea-surements in microsecond precision. It is desirable to have this option available when conduct-ing experiments. However when testing out the fairly standard performance.now() JavaScriptfunction for HRT, it became clear that none of the game consoles support this form of timemeasurement. Therefore, experiments should be conducted that run long enough to make useof the “old fashion” Date.now() JavaScript timer function, which provides timing in millisecondprecision.
4.1.3 JavaScript event call support and behavior
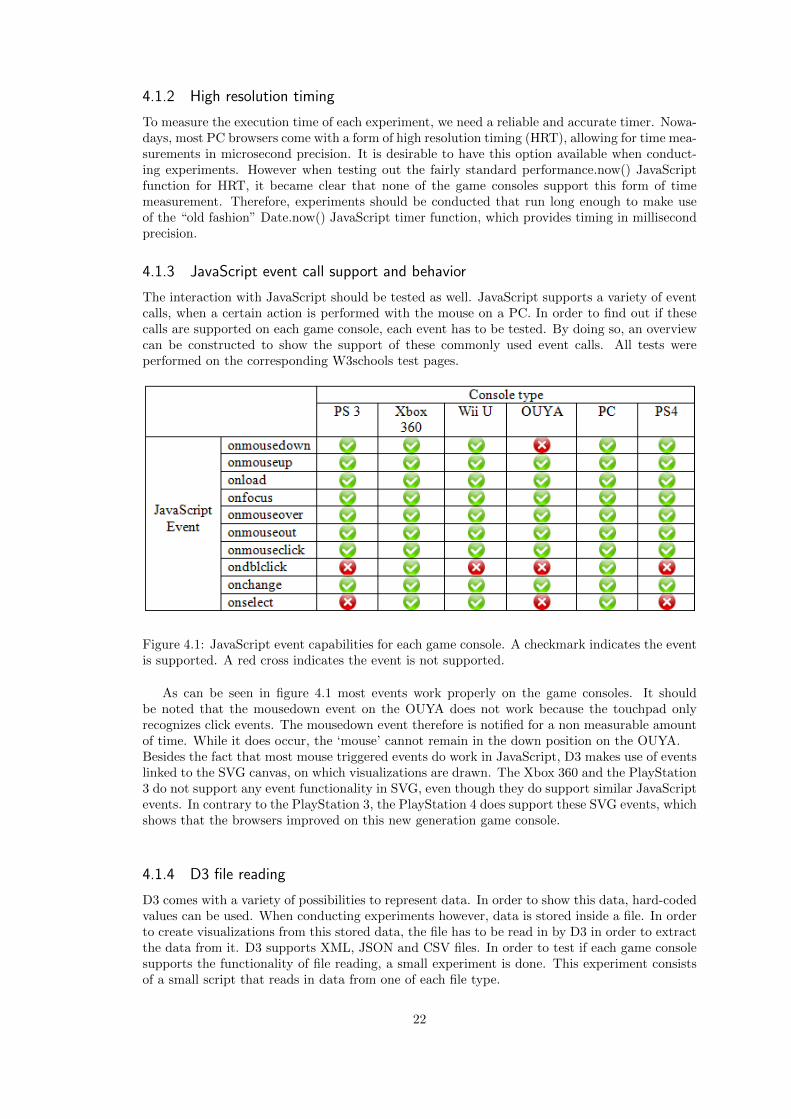
The interaction with JavaScript should be tested as well. JavaScript supports a variety of eventcalls, when a certain action is performed with the mouse on a PC. In order to find out if thesecalls are supported on each game console, each event has to be tested. By doing so, an overviewcan be constructed to show the support of these commonly used event calls. All tests wereperformed on the corresponding W3schools test pages.
Figure 4.1: JavaScript event capabilities for each game console. A checkmark indicates the eventis supported. A red cross indicates the event is not supported.
As can be seen in figure 4.1 most events work properly on the game consoles. It shouldbe noted that the mousedown event on the OUYA does not work because the touchpad onlyrecognizes click events. The mousedown event therefore is notified for a non measurable amountof time. While it does occur, the ‘mouse’ cannot remain in the down position on the OUYA.Besides the fact that most mouse triggered events do work in JavaScript, D3 makes use of eventslinked to the SVG canvas, on which visualizations are drawn. The Xbox 360 and the PlayStation3 do not support any event functionality in SVG, even though they do support similar JavaScriptevents. In contrary to the PlayStation 3, the PlayStation 4 does support these SVG events, whichshows that the browsers improved on this new generation game console.
4.1.4 D3 file reading
D3 comes with a variety of possibilities to represent data. In order to show this data, hard-codedvalues can be used. When conducting experiments however, data is stored inside a file. In orderto create visualizations from this stored data, the file has to be read in by D3 in order to extractthe data from it. D3 supports XML, JSON and CSV files. In order to test if each game consolesupports the functionality of file reading, a small experiment is done. This experiment consistsof a small script that reads in data from one of each file type.
22
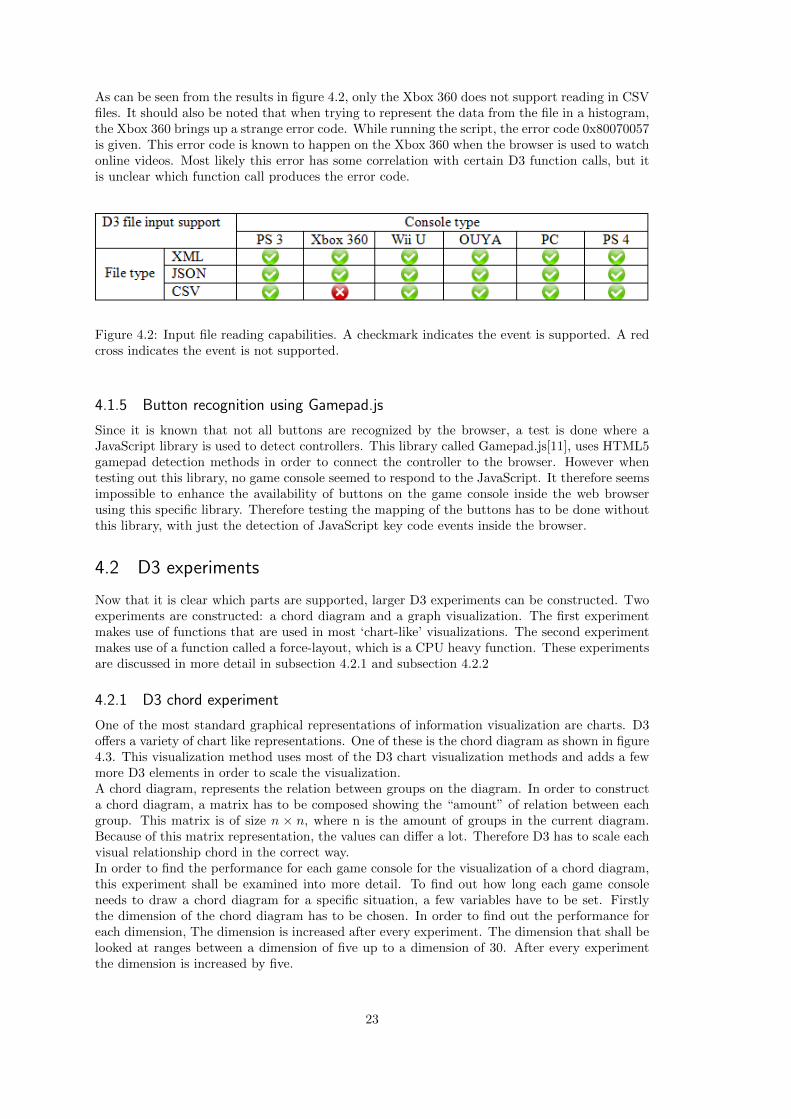
As can be seen from the results in figure 4.2, only the Xbox 360 does not support reading in CSVfiles. It should also be noted that when trying to represent the data from the file in a histogram,the Xbox 360 brings up a strange error code. While running the script, the error code 0x80070057is given. This error code is known to happen on the Xbox 360 when the browser is used to watchonline videos. Most likely this error has some correlation with certain D3 function calls, but itis unclear which function call produces the error code.
Figure 4.2: Input file reading capabilities. A checkmark indicates the event is supported. A redcross indicates the event is not supported.
4.1.5 Button recognition using Gamepad.js
Since it is known that not all buttons are recognized by the browser, a test is done where aJavaScript library is used to detect controllers. This library called Gamepad.js[11], uses HTML5gamepad detection methods in order to connect the controller to the browser. However whentesting out this library, no game console seemed to respond to the JavaScript. It therefore seemsimpossible to enhance the availability of buttons on the game console inside the web browserusing this specific library. Therefore testing the mapping of the buttons has to be done withoutthis library, with just the detection of JavaScript key code events inside the browser.
4.2 D3 experiments
Now that it is clear which parts are supported, larger D3 experiments can be constructed. Twoexperiments are constructed: a chord diagram and a graph visualization. The first experimentmakes use of functions that are used in most ‘chart-like’ visualizations. The second experimentmakes use of a function called a force-layout, which is a CPU heavy function. These experimentsare discussed in more detail in subsection 4.2.1 and subsection 4.2.2
4.2.1 D3 chord experiment
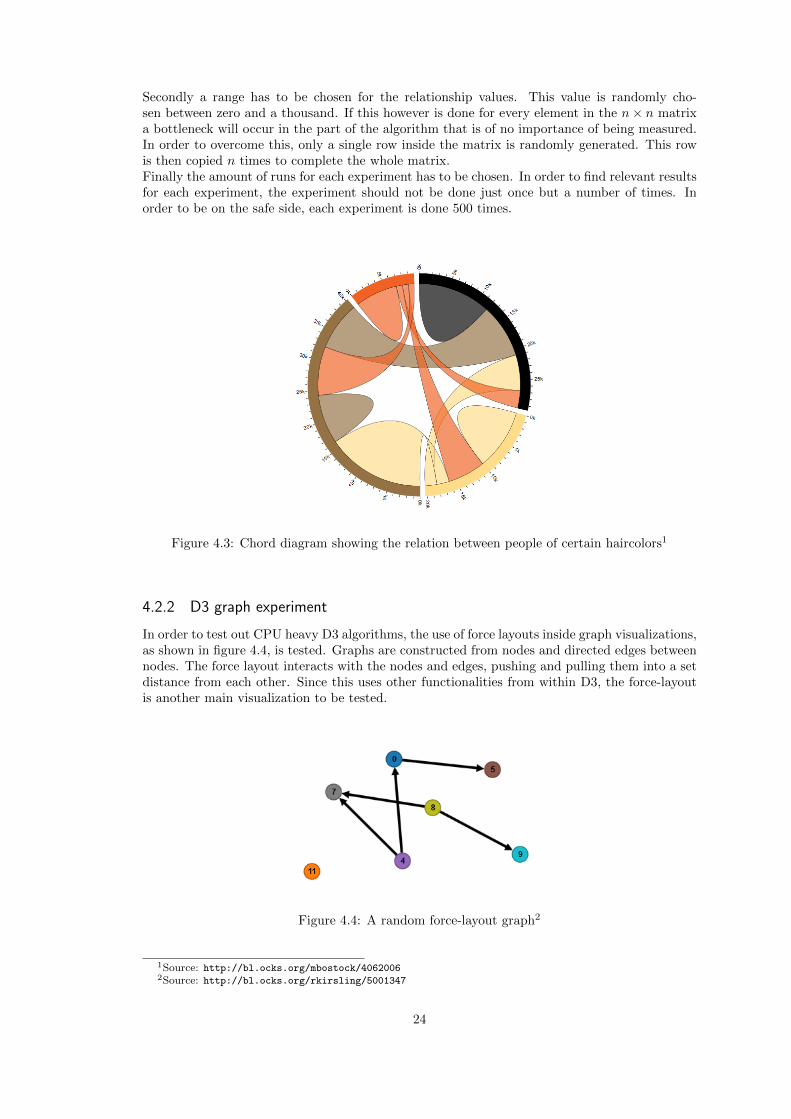
One of the most standard graphical representations of information visualization are charts. D3offers a variety of chart like representations. One of these is the chord diagram as shown in figure4.3. This visualization method uses most of the D3 chart visualization methods and adds a fewmore D3 elements in order to scale the visualization.A chord diagram, represents the relation between groups on the diagram. In order to constructa chord diagram, a matrix has to be composed showing the “amount” of relation between eachgroup. This matrix is of size n × n, where n is the amount of groups in the current diagram.Because of this matrix representation, the values can differ a lot. Therefore D3 has to scale eachvisual relationship chord in the correct way.In order to find the performance for each game console for the visualization of a chord diagram,this experiment shall be examined into more detail. To find out how long each game consoleneeds to draw a chord diagram for a specific situation, a few variables have to be set. Firstlythe dimension of the chord diagram has to be chosen. In order to find out the performance foreach dimension, The dimension is increased after every experiment. The dimension that shall belooked at ranges between a dimension of five up to a dimension of 30. After every experimentthe dimension is increased by five.
23
Secondly a range has to be chosen for the relationship values. This value is randomly cho-sen between zero and a thousand. If this however is done for every element in the n× n matrixa bottleneck will occur in the part of the algorithm that is of no importance of being measured.In order to overcome this, only a single row inside the matrix is randomly generated. This rowis then copied n times to complete the whole matrix.Finally the amount of runs for each experiment has to be chosen. In order to find relevant resultsfor each experiment, the experiment should not be done just once but a number of times. Inorder to be on the safe side, each experiment is done 500 times.
Figure 4.3: Chord diagram showing the relation between people of certain haircolors1
4.2.2 D3 graph experiment
In order to test out CPU heavy D3 algorithms, the use of force layouts inside graph visualizations,as shown in figure 4.4, is tested. Graphs are constructed from nodes and directed edges betweennodes. The force layout interacts with the nodes and edges, pushing and pulling them into a setdistance from each other. Since this uses other functionalities from within D3, the force-layoutis another main visualization to be tested.
Figure 4.4: A random force-layout graph2
1Source: http://bl.ocks.org/mbostock/40620062Source: http://bl.ocks.org/rkirsling/5001347
24

4.2.3 Discussion
For each D3 visualization, the Xbox 360 returns the script error code 0x80070057. This erroroccurs randomly, but seems to happen mostly around the part of code where a random color isset. Therefore a minor change to the code is made, which checks for the use of Internet Exploreras a browser, since the Xbox 360 uses Internet Explorer as its browser. When Internet Exploreris used, no random color is given to the chord diagram and the error does not occur as frequentas before. The error still occurs sporadically, but does not seem to interrupt the experiment inany way. However it could still interfere with any found results. It should also be clear thatwithout the use of colors, the chord diagram loses a lot of functionality. This is due to the factthat the relation the chord shows between groups, can be differed from one another by the colorof the chords.In addition to the problems with the Xbox 360, the D3 graph visualization does not work on thePlayStation 3. The PlayStation 3 only constructs an empty canvas, but does not show any formof graph inside of it. It is unclear why this happens.
4.3 Interaction experiments
In order to find out how well each game console controller performs compared to a mouse andkeyboard the following tests are conducted: a textual input test, a numerical input test, adropdown menu test, a Fitts’ Law test. Before these tests can be conducted however, the buttoninteraction possibilities inside the web browser have to be researched for each game console.
4.3.1 Button detection within the browser
Since interaction is needed for certain visualizations, it is necessary to have a number of buttonsavailable on a controller in order to perform interaction with. Since every game console hasits own controller and web browser, an overview should be made to check how buttons on thecontrollers are mapped and recognized inside the web browser. By doing so, it should becomemore clear what possibilities are present to interact with visualizations inside the web browser.The main issue with the key codes that are detected, is the built-in functionality assigned tothese buttons. The results of both the number of JavaScript key codes that are detected in totaland the number of key codes that can be used by each game console are shown in table 4.1.
Table 4.1: Number of buttons detected by each game console and the JavaScript key codes ofthese buttons, followed by the usable buttons and key codes for interaction.
Game console Xbox 360 PlayStation 3 NintendoWii U
OUYA PlayStation 4
Number of de-tected buttons
0 5 5a 5 10
JavaScript keycodes
- 27, 37, 38, 39,40
13, 37, 38,39, 40
13, 37, 38,39, 40
27, 37, 38, 39,40, (116, 117,118)b
Number of us-able buttons
0 4 5 5 10
Usable buttonkey JavaScriptkey codes
- 37, 38, 39, 40 13, 37, 38,39, 40
13, 37, 38,39, 40
37, 38, 39, 40,113, 116, 117,118, 119
aOnly 5 JavaScript key code events, but a lot more buttons are recognized using Nintendo Wii U JavaScriptcalls.
bOnly usable if no next page, previous page or tab located to the left is present.
25

While the Nintendo Wii U only recognizes five JavaScript key codes there are JavaScript func-tions available in order to recognize more buttons on the Nintendo Wii U. Apart from recognizingbuttons, these functions are capable of reading out other values from the gamepad as well, suchas the orientation or the movement that is currently being made with the gamepad. A completeoverview of these key codes and function calls can be found on a fan based wiki[12].
4.3.2 Mouse movement within the browser
Moving the mouse around the browser is slightly different for each game console. On the Xbox360 the mouse pointer has to be moved using the left ‘stick’. Clickable objects can be pressedby using the ‘A’ button, this however does not generate a JavaScript key code. The virtualkeyboard uses these same methods to provide input.The PlayStation 3 also makes use of the left stick in order to move around the mouse button.The arrow buttons can be used to ‘jump’ around clickable objects. Clickable objects can bepressed by using the ‘cross’ button. The virtual keyboard can be used by either moving aroundthe keyboard with the left stick, or by jumping from key to key with the arrow buttons. ThePlayStation 4 works the same as the PlayStation 3 inside the web browser. In addition to that,the touchpad can also be used to move around the mouse pointer.The OUYA does not continuously show a visible mouse pointer on screen. To bring up the mousepointer the touchpad has to be used. The arrow keys can be used in order to jump around betweenclickable objects. When using the virtual keyboard the arrow keys can be used to jump aroundthe characters, in addition the touchpad can also be used to move around between characters.The Nintendo Wii U completely relies on the use of the stylus. The mousepointer can be moved,objects can be clicked and the virtual keyboard has to be operated using the stylus.
Figure 4.5: Used setup while experimenting
26

4.3.3 User input interaction
While the possibilities of what each controller can do is made clear, this does not provide ananswer on what controller will perform best when it comes to user interaction. In order totest out the actual user interaction, a series of experiments is made. These experiments mainlymeasure the time needed in order to perform an interaction with the game console. From thesemeasurements a ranking can be made to show which controller performs best.When creating visualizations, two main interaction methods come to mind. The input of textor variables and the use of buttons or other ‘clickable’ objects. In order to test user input, threetests are constructed. The first test asks for the input of text, the second test asks for numericalinput and the third test exist of a dropdown menu from which a selection must be made. Totest the use of buttons, a Fitts’ Law test is used.The textual input test is constructed by asking the user to fill in five randomly generated words.These words are constructed from five random letters. While these letters are chosen randomly,one restriction is present. It is not allowed to have the same letter twice in a row. When thisrestriction would not be present, time measurement could be disrupted, since the input key isalready selected by the user at that point. In order to make sure that the time is measured in acorrect way, the timer will start after the user opened the first input field. The timer will stopwhen all input fields consist of five letters each.The numerical input test differs from the textual input test, because some virtual keyboard needto switch between character sets in order to insert numerical input. Therefore, in order to knowif this makes a lot of difference in order of time, this test is created as well. The numerical inputtest is constructed in the same way as the textual input test. Five random numbers are chosenfor every word with the restriction that no duplicate numbers consists after each other in a word.The drop down menu experiment looks a lot like the previous two experiments. Again fiverandomly generated words are created. The user is given a drop down menu which has to bepressed. The user then has to find the same word in a list of five words inside the dropdownmenu. The timer will start when the first drop down menu is pressed and will end when the lastselection was made.Finally the Fitts Law experiment. This experiment was originally thought out by Paul Fitts[4]in 1954. The experiment is mainly used to test certain graphical lay outs to see if they are userfriendly or not. The test however can also be used to create a so called index of performance for avariety of interaction methods. Fitts law was formulated a number of times. The most commonusage is the so called Shannon-formulation proposed by MacKenzie[13] et al. for movement alonga single dimension. The formula looks as follows:
MT = a + b ∗ ID
Where
• MT : the measured time, the time needed to complete the given movement.
• a: the formula’s intercept with the y axis
• b: the slope of the formula
• ID: The index of difficulty, defined as log2(1 + DW )
• D: the distance between the starting point and the center of the target
• W : the width of the target in the measured dimension
The index of difficulty and the measured time are known after the test is done. In order tosay something about the performance of each controller, a regression line has to be created tofind the slope of the formula. From the slope we can find the Index of performance, which isdefined as 1
b . The index of performance will become higher if the slope is smaller. The sloperepresent the time needed to perform an action of a certain difficulty and the higher the indexof performance, the better the performance.
27

28
CHAPTER 5
Results
5.1 D3 Experimental Results
In order to compare the results properly, an additional test was done on a PC. The PC used hadthe following hardware specifications: an Intel 3.4GHZ I7-3770 processor with 8 GB RAM andan nVidia GeForce GTX 660, capable of a theoretical 1881.6 GFLOP/s. These specifications area little above the standard of PCs that are currently on the market.
5.1.1 Chord experiment
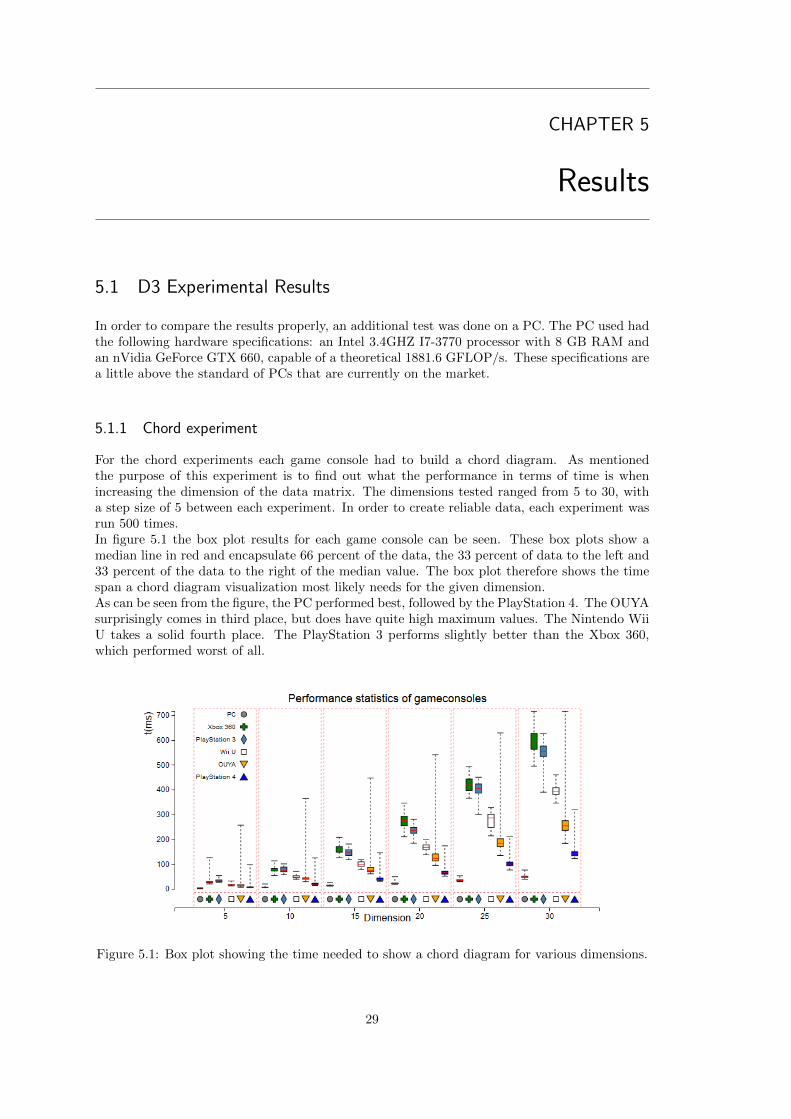
For the chord experiments each game console had to build a chord diagram. As mentionedthe purpose of this experiment is to find out what the performance in terms of time is whenincreasing the dimension of the data matrix. The dimensions tested ranged from 5 to 30, witha step size of 5 between each experiment. In order to create reliable data, each experiment wasrun 500 times.In figure 5.1 the box plot results for each game console can be seen. These box plots show amedian line in red and encapsulate 66 percent of the data, the 33 percent of data to the left and33 percent of the data to the right of the median value. The box plot therefore shows the timespan a chord diagram visualization most likely needs for the given dimension.As can be seen from the figure, the PC performed best, followed by the PlayStation 4. The OUYAsurprisingly comes in third place, but does have quite high maximum values. The Nintendo WiiU takes a solid fourth place. The PlayStation 3 performs slightly better than the Xbox 360,which performed worst of all.
Figure 5.1: Box plot showing the time needed to show a chord diagram for various dimensions.
29
5.1.2 Graph Experiment
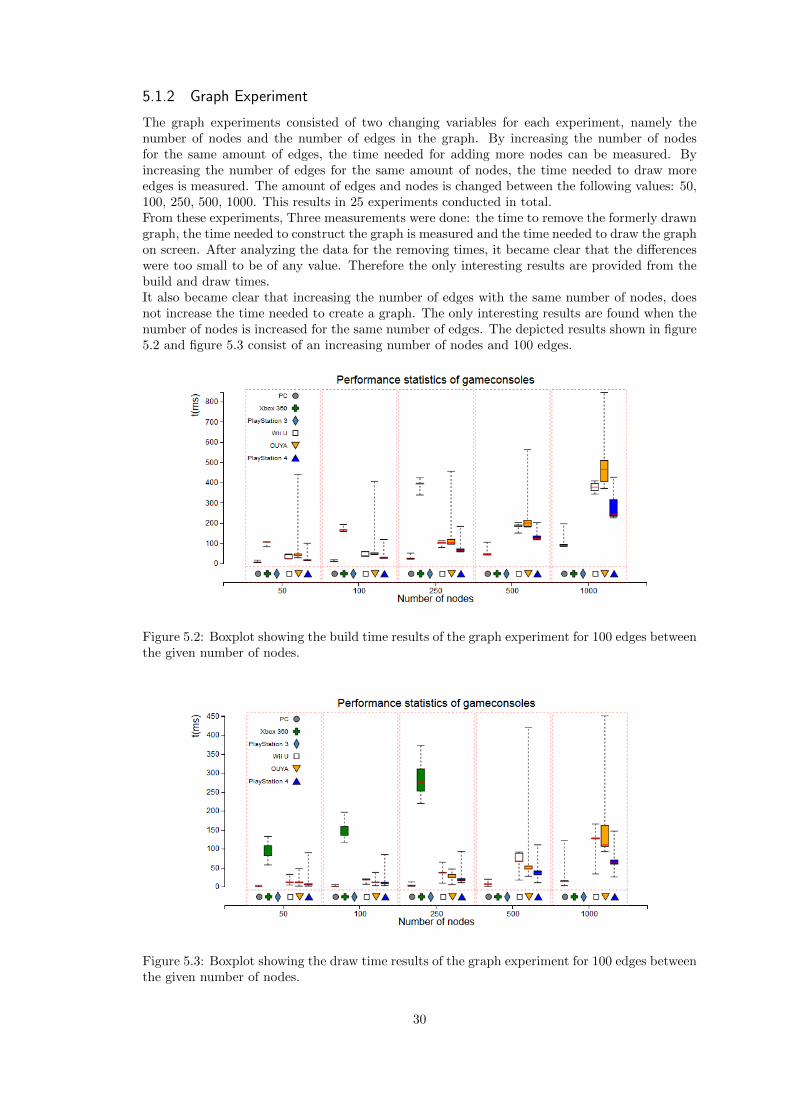
The graph experiments consisted of two changing variables for each experiment, namely thenumber of nodes and the number of edges in the graph. By increasing the number of nodesfor the same amount of edges, the time needed for adding more nodes can be measured. Byincreasing the number of edges for the same amount of nodes, the time needed to draw moreedges is measured. The amount of edges and nodes is changed between the following values: 50,100, 250, 500, 1000. This results in 25 experiments conducted in total.From these experiments, Three measurements were done: the time to remove the formerly drawngraph, the time needed to construct the graph is measured and the time needed to draw the graphon screen. After analyzing the data for the removing times, it became clear that the differenceswere too small to be of any value. Therefore the only interesting results are provided from thebuild and draw times.It also became clear that increasing the number of edges with the same number of nodes, doesnot increase the time needed to create a graph. The only interesting results are found when thenumber of nodes is increased for the same number of edges. The depicted results shown in figure5.2 and figure 5.3 consist of an increasing number of nodes and 100 edges.
Figure 5.2: Boxplot showing the build time results of the graph experiment for 100 edges betweenthe given number of nodes.
Figure 5.3: Boxplot showing the draw time results of the graph experiment for 100 edges betweenthe given number of nodes.
30
As can be seen from these results the time needed to build a graph and draw the graph bothincrease when the number of nodes is being increased. The shown graph does not show resultsfor the Xbox 360 for all number of nodes. As mentioned before, the Xbox 360 showed errorswhen conducting these experiments. While the experiments on the Xbox 360 did not crash, theexperiments were not completely done, because the browser did not seem to respond after toomany edges or nodes were added to the graph.
5.2 User interaction Experimental Results
It should be noted that the use of the term PC inside the figures do not necessarily representthe use of a PC as interaction method but as the mouse and keyboard. Since the tests with themouse and keyboard were done on a PC, this term was used in the results.
5.2.1 Textual and numerical input
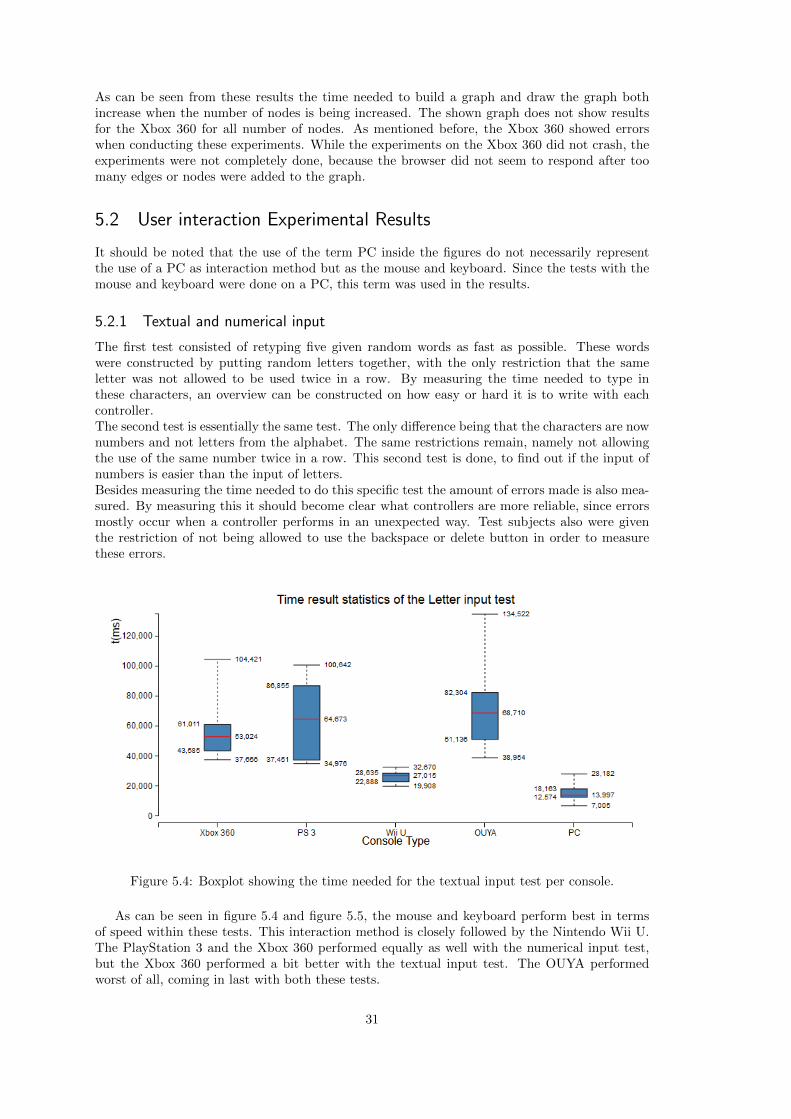
The first test consisted of retyping five given random words as fast as possible. These wordswere constructed by putting random letters together, with the only restriction that the sameletter was not allowed to be used twice in a row. By measuring the time needed to type inthese characters, an overview can be constructed on how easy or hard it is to write with eachcontroller.The second test is essentially the same test. The only difference being that the characters are nownumbers and not letters from the alphabet. The same restrictions remain, namely not allowingthe use of the same number twice in a row. This second test is done, to find out if the input ofnumbers is easier than the input of letters.Besides measuring the time needed to do this specific test the amount of errors made is also mea-sured. By measuring this it should become clear what controllers are more reliable, since errorsmostly occur when a controller performs in an unexpected way. Test subjects also were giventhe restriction of not being allowed to use the backspace or delete button in order to measurethese errors.
Figure 5.4: Boxplot showing the time needed for the textual input test per console.
As can be seen in figure 5.4 and figure 5.5, the mouse and keyboard perform best in termsof speed within these tests. This interaction method is closely followed by the Nintendo Wii U.The PlayStation 3 and the Xbox 360 performed equally as well with the numerical input test,but the Xbox 360 performed a bit better with the textual input test. The OUYA performedworst of all, coming in last with both these tests.
31

Figure 5.5: Boxplot showing the time needed for the numerical input test per console.
The results for the total number of made errors are quite close to one another as can be seen infigure 5.6. For the input test the only game console that differed from the rest was the PlaySta-tion 3, on which a lot more errors were made than on the other game consoles. The least errorswere made on the Nintendo Wii U.For the number input test, the results look quite similar to one another. However the NintendoWii U performs a bit better than the rest. Overall the Nintendo Wii U performs best in termsof least errors.
Figure 5.6: Overview of the number of errors made for the textual and numerical input tests.
Most errors occurred when misreading letters. Subjects for example changed the letter ‘q’for the letter ‘g’ or the letter ‘i’ for the letter ‘j’, resulting in single errors. Double errors weremade when people switched the order of two letters.
5.2.2 Dropdown menu input
The third test consisted of selecting the right value inside a dropdown menu. Again a randomword of letter characters was created in the same way as was done in the first test. Additionally5 random words are generated that will represent the values inside the dropdown menu. One ofthese values randomly gets replaced by the word that has to be selected.With this test most test subjects did not make any errors. The amount of errors were so low,that they can be disregarded. If errors were made, it only occurred once within the test, sinceevery dropdown menu is different from one another.As can be seen in figure 5.7 the mouse and keyboard performed best. The gap with the NintendoWii U is a bit bigger this time, but it still holds the second place firmly compared to the rest.Third best was the PlayStation 3, closely followed by the Xbox 360. The worst performing gameconsole is again the OUYA.
32
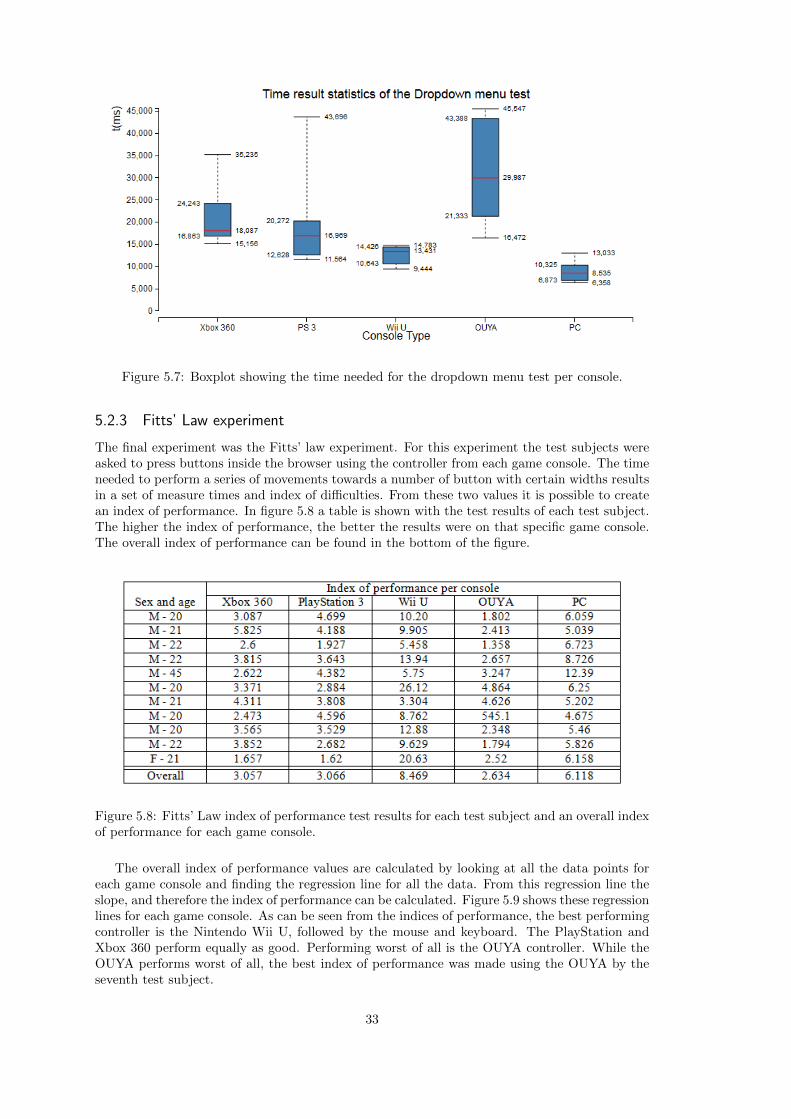
Figure 5.7: Boxplot showing the time needed for the dropdown menu test per console.
5.2.3 Fitts’ Law experiment
The final experiment was the Fitts’ law experiment. For this experiment the test subjects wereasked to press buttons inside the browser using the controller from each game console. The timeneeded to perform a series of movements towards a number of button with certain widths resultsin a set of measure times and index of difficulties. From these two values it is possible to createan index of performance. In figure 5.8 a table is shown with the test results of each test subject.The higher the index of performance, the better the results were on that specific game console.The overall index of performance can be found in the bottom of the figure.
Figure 5.8: Fitts’ Law index of performance test results for each test subject and an overall indexof performance for each game console.
The overall index of performance values are calculated by looking at all the data points foreach game console and finding the regression line for all the data. From this regression line theslope, and therefore the index of performance can be calculated. Figure 5.9 shows these regressionlines for each game console. As can be seen from the indices of performance, the best performingcontroller is the Nintendo Wii U, followed by the mouse and keyboard. The PlayStation andXbox 360 perform equally as good. Performing worst of all is the OUYA controller. While theOUYA performs worst of all, the best index of performance was made using the OUYA by theseventh test subject.
33

Figure 5.9: Visual representation for the time needed versus thel index of difficulty for each gameconsole.
While this shows that it is possible to perform well using the OUYA, this is quite an exceptionaloutlier. The time needed to perform a single action on the OUYA is also considerably larger thanon any other game console. But since the performance is measured according to the slope, thetime needed to perform an action is not taken into consideration within the index of performance.
5.2.4 Overall remarks
When asked what the test subjects found the most easy way of browser interaction, most ofthem chose the mouse and keyboard. The main reason why test subjects made this decisionwas because they were used to the way of interaction through this method. Figure 5.10 showsthe most liked and disliked game consoles according to the test subjects1. When asked whatcontroller they preferred, most of the test subjects answered the Nintendo Wii U, followed by thePlayStation 3. The Nintendo Wii U was mostly liked because it was the easiest game console ofthe four to perform interaction with. The PlayStation 3 was mostly chosen because people werealready familiar with that specific game console. The most disliked controller of all was by farthe OUYA. Test subjects complained about the touch pad not corresponding properly, callingthe touch pad too sensitive at some moments. This made it harder for users to select the inputfield.
Figure 5.10: Like and dislike table according to test subjects.
1Test subjects were allowed to choose a game console as well when they preferred the PC above the others.One test subject could not decide between two game consoles and was allowed a double choice.
34

35

36

CHAPTER 6
Discussion
6.1 Main discussion
In order to test out more possibilities for each game console, experiments should be conductedusing native applications for each game console. This way the hardware of each device can beused in an optimal way. This will also allow for more difficult visualizations, which WebGLcould not provide inside the web browsers. Additionally other game consoles could be tested.Mainly the Xbox One should be researched, because this game console is one of the most recentlyreleased ones.
6.2 D3 Experiment
The made experiments could be enhanced by searching for the cause of the errors in both thePlayStation 3 and the Xbox 360. If it is possible to overcome these errors, the experiments couldhave more reliable results. While the Xbox 360 mainly seems to have trouble with the styleattributes within D3, there are still parts that create the 0x80070057 error. For the PlayStation3 it is not known where the problems within the graph experiment might come from. It couldalso be a good idea to research the support of SVG events and methods for each game consolein order to localize possible problems which can also occur from within D3.In addition to the made experiments, other D3 visualizations could be tested in order to see ifthey work or not. In terms of performance, the results found in the made experiments will mostlikely stay the same.
6.3 Interaction Experiments
Additional experiments could be constructed in order to create a larger overview of interactionmethods. Actual interactions with the visualizations was not compared properly yet. In additionto these additional experiments, a larger group of test subjects should be considered. The groupof test subjects used for this paper did not show major differences in age or sex. The main partof the test subjects were around the same age. There also was just one female test subject withinthis group.Besides that, in order to come up with a good overview, more test subjects are needed thathave experience with each controller type. Currently only a few people knew one or more of thecontrollers. Making it impossible to make any conclusions based on the fact that they mightknow one controller better than the other.It could also be considered to check out other analysis methods for the Fitts’ Law method. Thecurrently used method does not take the intercept of the regression line into account, while someother methods do. The current method was used because the overall results will not result inmajor differences if the intercept is taken into account. But when experimenting on a larger testgroup, this might become an issue. The test subjects came up with a large variety of feedback,which can be taken in account if a repetition is made for the interaction experiments. A list ofthese feedback comments can be found below.
37
• The mouse and keyboard were the easiest to use, because I use them all the time.
• Wii U interaction is nice due to the fact that you can just use the stylus instead of sticksor keys.
• Not so easy to use the OUYA controller because of its location on the controller.
• The OUYA controller is quite heavy.
• Each game console is significantly different from one another
• The font on some game consoles made me misread some characters in the input test,resulting in errors
• The button that does not yet have to be pressed in the Fitts’ test is already possible, whichlets me prepare my next move in advance.
• The color used for the Fitts’ test button that had to be pressed was too aggressively red.
• The PlayStation 3 browser does not fill the complete screen, the parts that are not coveredmove and distracted me during the tests.
• When using the OUYA, the button within the Fitts’ test can be pressed while not hoveringdirectly aboce the button with the mouse pointer.
• The OUYA is annoying to use
• The Fitts’ Law test becomes boring over time
• Repetition of the Fitts’ test makes me get used to the movement.
• The values in some dropdown menus looked similar, which made me think longer beforemaking a decision.
• The PlayStation 3 is easier to use because I was familiar with the Xbox 360.
• When putting the OUYA controller on a table, the touchpad became more easy to use.
38

39

40
CHAPTER 7
Conclusion
7.1 Javascript support
Three JavaScript experiments were conducted from which the following can be concluded. JavaScriptcode has to be rewritten in order to keep the browser active. The use of JavaScript High Res-olution Timers is not supported on any game console. Therefore any constructed JavaScriptexperiments have to be conducted with the Date.now timer function which allows for millisecondprecision. Finally it can be concluded that almost all JavaScript event calls can be used on gameconsoles, with exception of the ‘on double click’ and the ‘on select event’ calls.
7.2 Visualization methods support
From the support experiments it became clear that WebGL is not supported by any gameconsole.It is strange that game console manufacturers do not support WebGL as a visualization methodinside the web browser. Especially for the PlayStation 4, that seemingly supports WebGL outsidethe web browser for its user interface.D3 however is supported on all game consoles in some way. The PlayStation 3 supported theleast of the visualization possibilities, followed by the Xbox 360. This is most likely due to thefact that these are the oldest tested game consoles. All the other game consoles supported D3,as far was tested out, completely.
7.3 Experimental results
7.3.1 D3 experiments
From the conducted D3 experiments we can conclude that the older a game console is the worse itwill perform within D3. It also becomes clear that current available PCs perform better than anygame console in terms of speed. The most interesting performance, compared to its hardware,comes from the OUYA, which performs quite well. The OUYA however does have the biggestoutliers, showing a downside of this game console.
7.3.2 Interaction experiments
The interaction experiments showed that test subjects performed best when using a mouse andkeyboard. The best game console controller by far is the Nintendo Wii U. This controller had theleast amount of errors and performed quicker than any other game console within all conductedexperiments.The worst game console controller is the OUYA. The main reason for this is the fact that in orderto perform user input, the OUYA has to be controlled by using its touchpad. The touchpad onthe OUYA is quite sensitive resulting in unpredictable movements form time to time.The game console controllers for both the Xbox 360 and the PlayStation 3 performed roughlythe same throughout all interaction experiments. This is most likely due to the fact that theinteraction with these consoles is quite similar and most people were familiar with one of theseconsoles.
41

Even though some controllers were not performing good in terms of user interaction, it couldbe a possibility to attach a mouse and keyboard to these game consoles in order to provide aneasier way of user input.
7.4 Final conclusion
All in all the objectives of this paper have been disproven. The use of game consoles to realizedata visualizations within the web browser of a game console is not a well performing way togo. Only a limited amount of methods is available when performing data visualization on theweb browsers, making the use of a PC for data visualizations more attractive. In terms of per-formance, all game consoles performed worse when creating visualizations than a PC. The bestperforming game console is the PlayStation 4, which is the latest released game consoles thatwas tested.Beside not being able to perform equally as well as a PC when creating data visualization, theinteraction with the browser is not easier when using a game console controller. The use of amouse and keyboard is seemingly the easiest and most natural interaction method to people.The closest result compared to the traditional mouse and keyboard is the use of the NintendoWii U gamepad, which is essentially a tablet.If a game console is used for data visualization, the PlayStation 4 will provide the best perfor-mance result in terms of time, while the Nintendo Wii U will provide easy to use interactionmethods. In conclusion it can be stated that the use of data visualizations through a web browsershould, for the time being, be conducted on a PC. This is mainly due to the fact of limited visual-ization methods that are available for game consoles using a web browser. While the PlayStation4 does already support WebGL in some way, the use of WebGL in the web browser is not yetrealized by any game console developer. Therefore data visualizations using a game console webbrowser are not yet a desired way to go.
42

43

44

Bibliography
[1] M. Friendly and D. J. Denis, “Milestones in the history of thematic cartography, statisticalgraphics, and data visualization,” Seeing Science: Today American Association for theAdvancement of Science, 2008.
[2] http://en.wikipedia.org/wiki/Information_visualization. [Online; accessed 9-June-2014].
[3] M. Bostock, V. Ogievetsky, and J. Heer, “D3 data-driven documents,” Visualization andComputer Graphics, IEEE Transactions on, vol. 17, no. 12, pp. 2301–2309, 2011.
[4] P. M. Fitts, “The information capacity of the human motor system in controlling the am-plitude of movement.,” Journal of experimental psychology, vol. 47, no. 6, p. 381, 1954.
[5] http://www.ign.com/articles/2010/08/26/xbox-360-vs-playstation-3-the-hardware-throwdown.[Online; accessed 9-June-2014].
[6] http://www.ign.com/wikis/xbox-one/PS4_vs._Xbox_One_vs._Wii_U_Comparison_
Chart. [Online; accessed 9-June-2014].
[7] http://www.ign.com/wikis/ouya/Hardware_Specs. [Online; accessed 9-June-2014].
[8] http://kyokojap.myweb.hinet.net/gpu_gflops/. [Online; accessed 9-June-2014].
[9] K. group, “WebGL.” http://www.khronos.org/webgl/. [Online; accessed 9-June-2014].
[10] A. Sutton, “WebGL and OUYA.” http://forums.ouya.tv/discussion/119/
webgl-and-ouya, 2013. [Online; accessed 9-June-2014].
[11] S. Graham, “Gamepad.js.” http://www.gamepadjs.com/. [Online; accessed 9-June-2014].
[12] W. Brew, “Wii U browser wiki.” http://wiiubrew.org/wiki/Internet_Browser. [Online;accessed 9-June-2014].
[13] I. S. MacKenzie, “Fitts’ law as a research and design tool in human-computer interaction,”Human-computer interaction, vol. 7, no. 1, pp. 91–139, 1992.
45