data warehousing data warehouse design & multi-dimensional ... · data vault modeling the data...
TRANSCRIPT
FS 2020 Slide 1
Data Warehousing
Data Warehouse Design &
Multi-dimensional Models
FS 2020Dr. Andreas [email protected]
© Andreas Geppert FS 2020 Slide 2
Outline of the Course
� Introduction
� DWH Architecture
� DWH-Design and multi-dimensional data models
� Extract, Transform, Load (ETL)
� Metadata
� Data Quality
� Analytic Applications and Business Intelligence
� Implementation and Performance
� (Security and Privacy)

© Andreas Geppert FS 2020 Slide 3
Content
1. Application Development in Data Warehouses
2. Schema Design for Data Warehouses
3. Multi-dimensional Data Models
4. Logical Design for Data Marts
5. Appendix: Conceptual Design for Data Marts

© Andreas Geppert FS 2020 Slide 4
Motivation
� complex facts are represented in the DWH
� DWH supports integration and analysis
– databases must be modeled accordingly
– without complete and adequate data models, DWH will not be a success
� analytic databases (data marts) use multidimensional concepts
– how do you systematically design these databases?
– what is the analogon to the Entity Relationship Model and to the mapping ER →
RM ?
� notations and conceptual (meta) data models
� modeling approaches

© Andreas Geppert FS 2020 Slide 5
Reference Architecture V4 Applications
� build "seed" IL containing most-needed data and integrated most important
sources
GUI
…
Reusable Selection,
Aggregation,
Calculation
Web/App
Servers
Integration, Historization Reporting,
OLAP,
Data Mining
Selection,
Aggregation,
Calculation
Data
Sources
DataIntegration
DataEnrichment
Analysis
Applications
Encapsulation

© Andreas Geppert FS 2020 Slide 6
logic;
extract, transform, load
logic
(no ETL)Legend:
GUI
…
Metadata Management
Reusable Selection,
Aggregation,
Calculation
Web/App
Servers
Integration, Historization
Lan
din
g
Zo
ne
Reporting,
OLAP,
Data Mining
Selection,
Aggregation,
Calculation
data
flow
Data
Sources
Sta
gin
g
Are
a
Su
bje
ct
Ma
tte
r A
rea
s
Re
usa
ble
M
ea
sure
s &
D
ime
nsi
on
s A
rea
s
relational
databasemultidimensional
databasefile
Layer:Data
IntegrationData
EnrichmentAnalysis
DWH Data Universe Data MartsAnalysisServices
PresentationFrontEnd
DWH Application Development
� start with requirements of analysis applications

© Andreas Geppert FS 2020 Slide 7
General Approach & Data Model Hierarchy
� modeling-driven approach
� model/specify on abstract level and derive (or even
generate) lower-level constructs
� distinguish conceptual, logical, and physical model
� the same hierarchy is applied to ETL processes /
mappings
Analysis
Conceptual design
Logical design
Logical model
Conceptual model
Physical design
Physical model
Requirements

© Andreas Geppert FS 2020 Slide 8
Data Models: Conceptual
� The Conceptual Data Model serves the following purposes:– Unambiguously represent business information structures and rules, enabling communication of this
understanding to the entire development team– Provide an implementation-independent set of requirements as input to the logical data model, and
to the physical data model– Clearly and uniquely identify all business entities in the system
� Note that the conceptual data model should not be considered as an intermediate design document to be disregarded after logical and physical design; rather it should remain as a part of the database specifications, organized with a variety of documents that also describe in detail the requirement acquisition and design process
� Finally one of the possibly most important advantages of conceptual design shows up during the operation of the database when the conceptual model and its documentation ease the understanding of data schemas and of applications that use them and thus facilitate their transformation and maintenance.
© Andreas Geppert FS 2020 Slide 9
Data Models: Logical
� The Logical Data Model (LDM) is a database-near data model that hides details of data storage and DBMS-specific idiosyncrasies but can nevertheless be implemented straightforward on a computer system
� Its main purpose is to ensure a proper mapping from a high-level conceptual data model (i.e., an Entity Relationship Model) that focuses exclusively on business entities and their relationships to the (principal) schema constructs used by a class of DBMSs (e.g., relational DBMSs). In other words logical design is conducted in the same way for all relational DBMSs (e.g., Oracle, DB2 etc.) because they all implement the relational data model. As a consequence a specific relational logical model can be used "as is" to design the physical data model of DB2, Oracle, SQL Server etc. whereas it cannot be used to design the physical data model for an IMS System.

© Andreas Geppert FS 2020 Slide 10
Data Models: Physical
� The purpose of the Physical Database Design is to ensure that
database transactions and queries meet performance requirements
while reflecting the semantics of the Logical Data Model
� While the Logical Data Model contains the information requirements
of the system in a normalized form, a direct implementation of the
model is unlikely to meet performance requirements
� Physical Database Design takes into account data and transaction
volume as well as typical queries to produce a schema and
environment that will meet necessary performance requirements.

© Andreas Geppert FS 2020 Slide 11
Application Development Processes Big Picture
analysis application development process
integration application development process
analyze
info req
derive
data req
determine
reuse potentialdetermine
technology
model
data mart
model
mappings
design
logical schema
design
mappings
implement
data mart
implement
ETL process
develop
reports
analyze
data req
analyze
sourcedef. incom.
interf.
extend
staging area
model
SMA
model
mappings
define
quality checks
design
SMA
design
ETL
implement
SMA
implement
ETL
def. outgoing
interfaces
implement
interfaces
enrichment application development process
design
mappings
implement
log. schema
implement
mappings
def. outgoing
interfaces
implement
interfaces
analyze
info req
derive
data req
model
RMDA
model
mappings
design
logical schema
© Andreas Geppert FS 2020 Slide 12
Content
1. Application Development in Data Warehouses
2. Schema Design for Data Warehouses
3. Multi-dimensional Data Models
4. Logical Design for Data Marts
5. Appendix: Conceptual Design for Data Marts

© Andreas Geppert FS 2020 Slide 13
Schema Design for Data Warehouses
■ database design must support goals of the data warehouse
■ integration– schema integration
– target of ETL processes
■ historization
■ data quality
■ granularity
■ in most architectural styles (Hub-and-Spoke, etc.) the DWH is implemented relationally
on the logical level (3NF)
■ the ER Model can/should be used for conceptual modeling
© Andreas Geppert FS 2020 Slide 14
Schema Design for Data Warehouses
■ Requirements to the data warehouse result from requirements analysis of the
analysis/reporting application
■ are the data that an application under construction needs already in the data
warehouse (integration layer) and can be sourced from there?
– if not, those data have to be sourced from one or more data sources /
operational systems
■ it is absolutely crucial to maintain accurate, timely, and complete information
about the data in the data warehouse
– data in the DWH must be modeled ( conceptual schemas !)
– semantics of data must be understood
– data ownership must be defined
© Andreas Geppert FS 2020 Slide 15
Integration
� the data warehouse integrates data from different sources– different aspects of the same business entities are managed in different business processes
with disjoint databases
– different business processes over the same business entity operate on disjoint databases
– the same business process is implemented by multiple applications (e.g., because of mergers
and acquisitions); e.g., multiple CRM systems
� "vertical" integration: integrate attributes from different sources
into the same entity
� "horizontal" integration: integrate entities from different sources
into the same entity collection (logically: relation)
© Andreas Geppert FS 2020 Slide 16
Key Generation and Integration
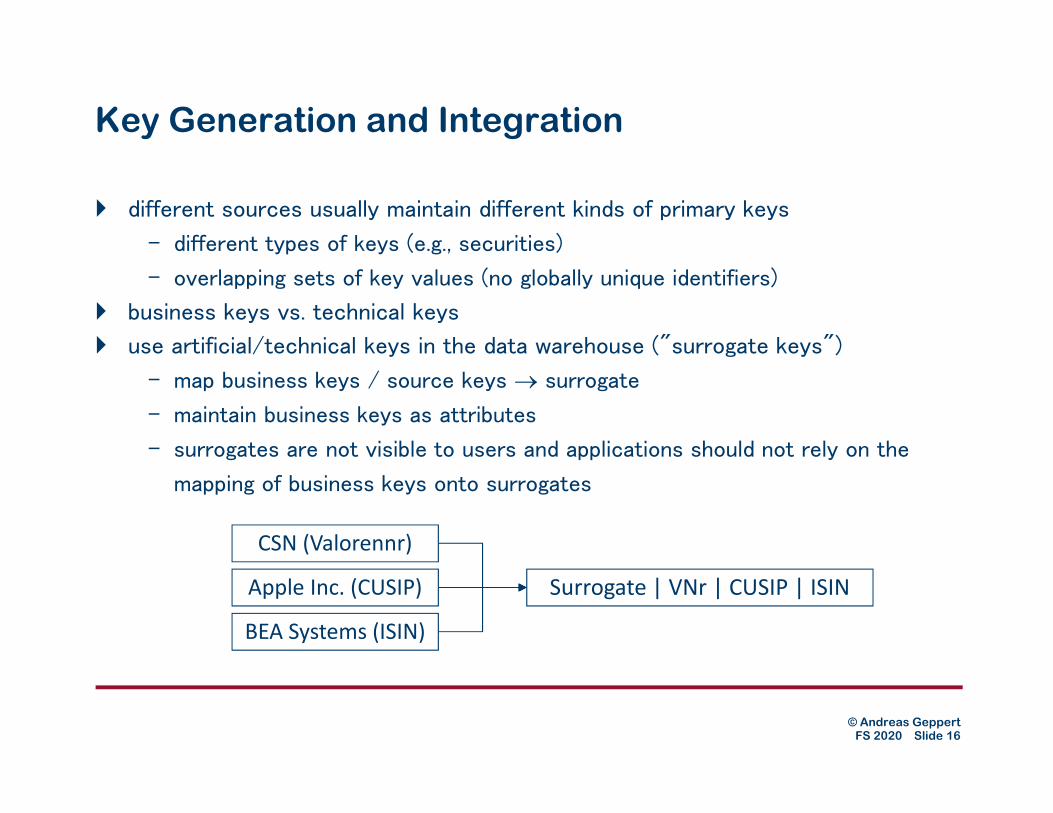
� different sources usually maintain different kinds of primary keys
– different types of keys (e.g., securities)
– overlapping sets of key values (no globally unique identifiers)
� business keys vs. technical keys
� use artificial/technical keys in the data warehouse ("surrogate keys")
– map business keys / source keys surrogate
– maintain business keys as attributes
– surrogates are not visible to users and applications should not rely on the
mapping of business keys onto surrogates
CSN (Valorennr)
Apple Inc. (CUSIP)
BEA Systems (ISIN)
Surrogate | VNr | CUSIP | ISIN

© Andreas Geppert FS 2020 Slide 17
Historization
� DWH must represent historical evolution of objects
� differing states of objects on the timeline
� bi-temporal time notion (temporal databases)
� Validity time: Interval, during which an object has been in a specific state (e.g.,
during which an attribute has had a certain value)
� Transaction time: point in time when the state of an object changed (e.g., an
attribute has been modified). Could also be an interval.

© Andreas Geppert FS 2020 Slide 18
Historization (2)
� Customer Calvin has been living in Basel for a long time
� On April 1, he moved to Bern. He announced his move one week in advance
– this change is reflected by an update (closing the validity interval of the old address) and an insert
(containing the new address with an infinite valid_until_date)
� On November 11, we learned that Calvin was deleted from the customer
database as per November 1.
– This change is reflected by an update (update of the transaction time and closing of the validity
interval)
Customer Name Address TX_Time Valid_From Valid_Until
12345 Calvin Basel 2004-04-04 2004-04-01 9999-12-31
2019-03-31
12345 Calvin Bern 2019-03-24
2019-11-11
2019-04-01 9999-12-31
9999-12-31 2019-11-01
© Andreas Geppert FS 2020 Slide 19
Modeling of "Time"
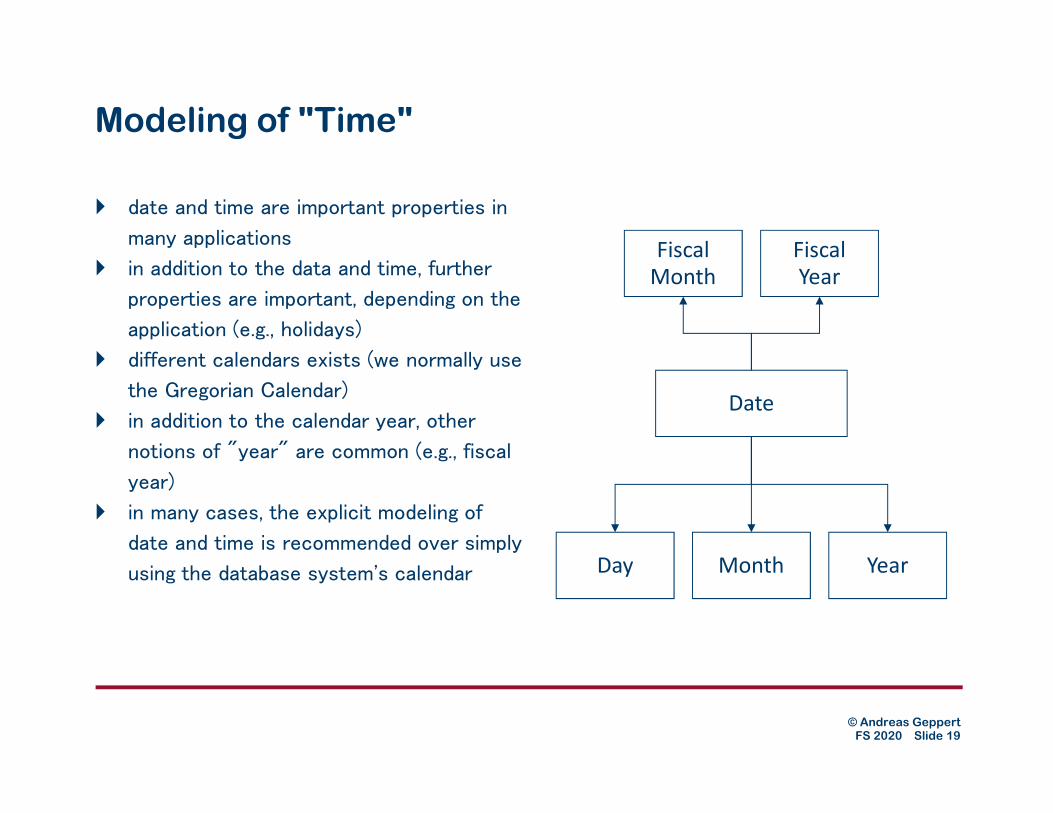
� date and time are important properties in
many applications
� in addition to the data and time, further
properties are important, depending on the
application (e.g., holidays)
� different calendars exists (we normally use
the Gregorian Calendar)
� in addition to the calendar year, other
notions of "year" are common (e.g., fiscal
year)
� in many cases, the explicit modeling of
date and time is recommended over simply
using the database system's calendar
Date
Day Month Year
Fiscal
Month
Fiscal
Year

© Andreas Geppert FS 2020 Slide 20
Data Vault Modeling
� The Data Vault technique has been introduced in the 1990s
� Today it is used in many DWH projects
� Previous techniques (3NF-based data models) have issues with
changing sources. Data Vault modeling has been designed to better
cope with such changes
� The Data Vault main components:
� Hubs
� Link Tables
� Satellites
© Andreas Geppert FS 2020 Slide 21
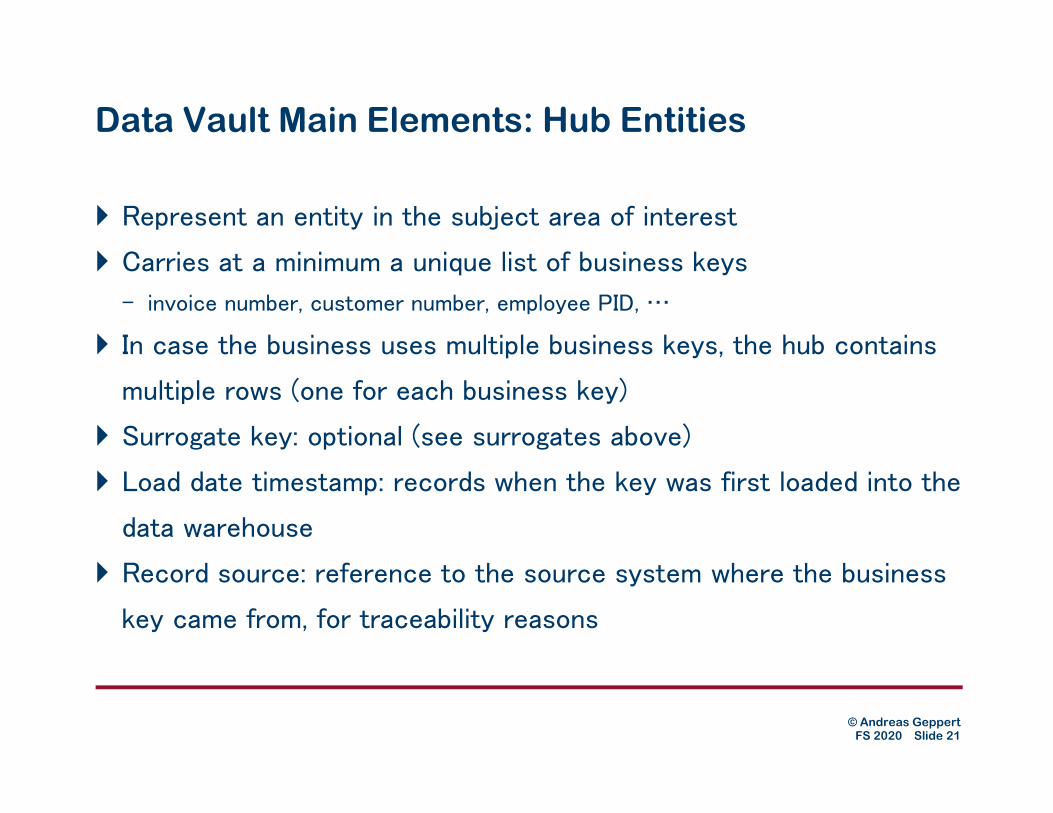
Data Vault Main Elements: Hub Entities
� Represent an entity in the subject area of interest
� Carries at a minimum a unique list of business keys
– invoice number, customer number, employee PID, …
� In case the business uses multiple business keys, the hub contains
multiple rows (one for each business key)
� Surrogate key: optional (see surrogates above)
� Load date timestamp: records when the key was first loaded into the
data warehouse
� Record source: reference to the source system where the business
key came from, for traceability reasons
© Andreas Geppert FS 2020 Slide 22
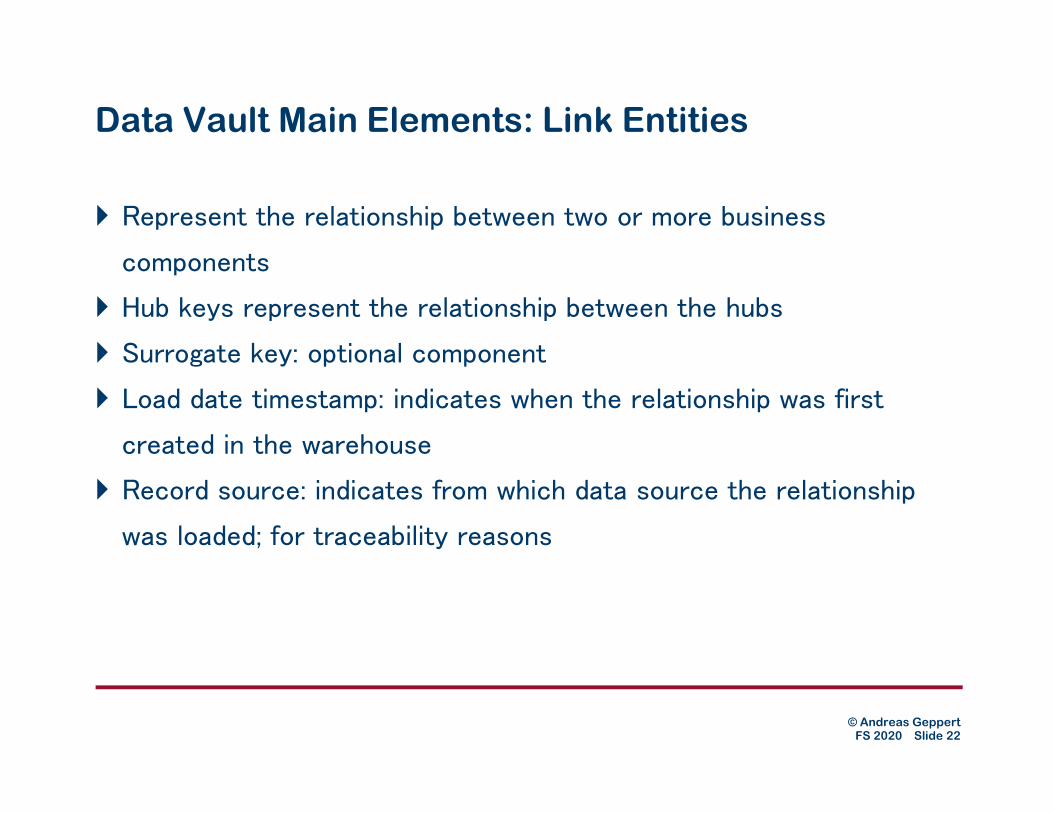
Data Vault Main Elements: Link Entities
� Represent the relationship between two or more business
components
� Hub keys represent the relationship between the hubs
� Surrogate key: optional component
� Load date timestamp: indicates when the relationship was first
created in the warehouse
� Record source: indicates from which data source the relationship
was loaded; for traceability reasons

© Andreas Geppert FS 2020 Slide 23
Data Vault Main Elements: Satellite Entities
� hub key context (descriptive) information
� satellite data are subject to change over time; therefore the
structure must be capable of storing new or altered data
� Satellite primary key: Hub or link primary key
� Load date timestamp: indicates when the context information was
first created in the warehouse
� Sequence surrogate number: optional. Useful for Satellites that have
multiple values
� Record source: indicates from which data source the satellite was
loaded; for traceability reasons

© Andreas Geppert FS 2020 Slide 24
Data Vault Example
source: https://danlinstedt.com/solutions-2/data-vault-basics/
© Andreas Geppert FS 2020 Slide 25
Inhalt
1. Application Development in Data Warehouses
2. Schema Design for Data Warehouses
3. Multi-dimensional Data Models
4. Logical Design for Data Marts
5. Appendix: Conceptual Design for Data Marts
© Andreas Geppert FS 2020 Slide 26
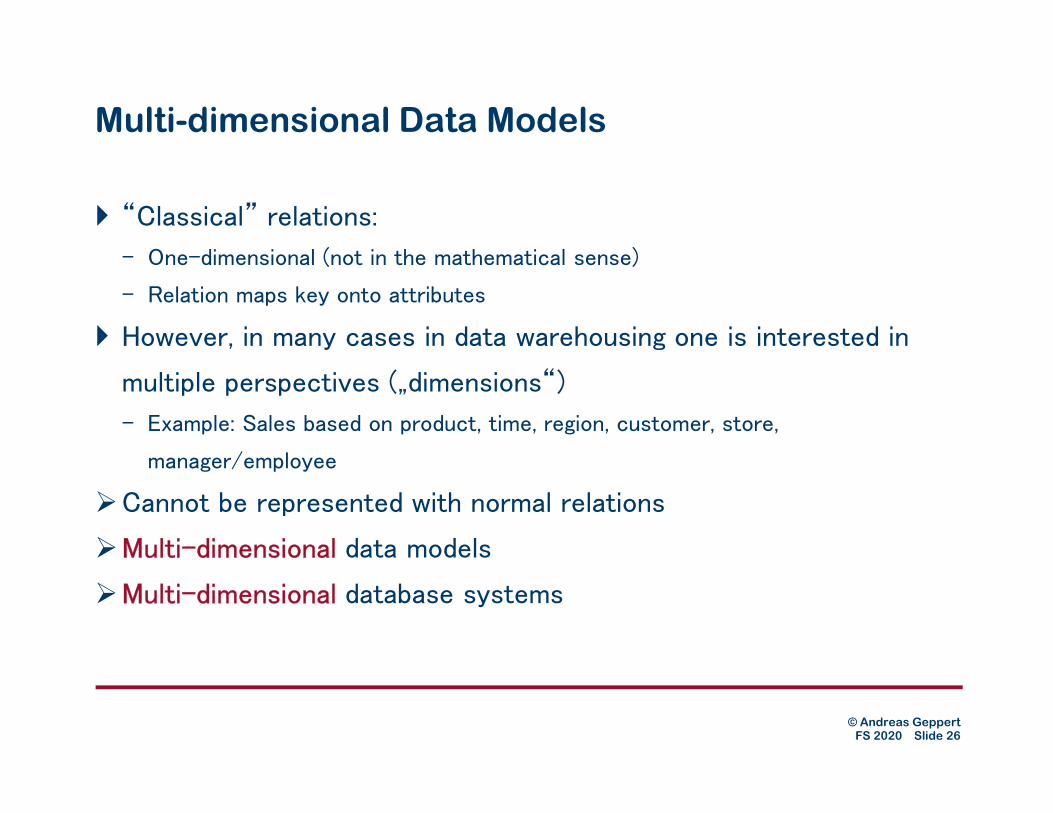
Multi-dimensional Data Models
� “Classical” relations:
– One-dimensional (not in the mathematical sense)
– Relation maps key onto attributes
� However, in many cases in data warehousing one is interested in
multiple perspectives („dimensions“)
– Example: Sales based on product, time, region, customer, store,
manager/employee
Cannot be represented with normal relations
Multi-dimensional data models
Multi-dimensional database systems

© Andreas Geppert FS 2020 Slide 27
Comparison: relational vs. Multi-dimensional DM
relational model
■Simple, little semantics
■Application-neutral
■Less ostensive modeling ( ERM)
■standardized
Multi-dimensional data models
■More complex, more semantics
■Well-suited only for specific
applications
■Ostensive modeling user-
friendly
■Caution: the multi-dimensional data
model does not exist– No uniform query language
– No standards
– No uniform formalization
© Andreas Geppert FS 2020 Slide 28
Content
1. Application Development in Data Warehouses
2. Schema Design for Data Warehouses
3. Multi-dimensional Data Models
– Dimensions, Measures, Facts, Cubes
– Operators
4. Logical Design for Data Marts
5. Appendix: Conceptual Design for Data Marts

© Andreas Geppert FS 2020 Slide 29
Multi-dimensional Data: Cubes
� Multi-dimensional data are seen and represented as data cubes
� More precisely: Hypercubes
11
45
99
45
5
23
8
56
19
44
16
39
8
7
20
56
24
23
28
11
61 94 62
Regio
nPro
du
kt
Quartal
Distinction into
– Qualifying and
– Quantifying information
Qualifying information identifies cell
or sub-cube
Quantifying information contains
numbers
© Andreas Geppert FS 2020 Slide 30
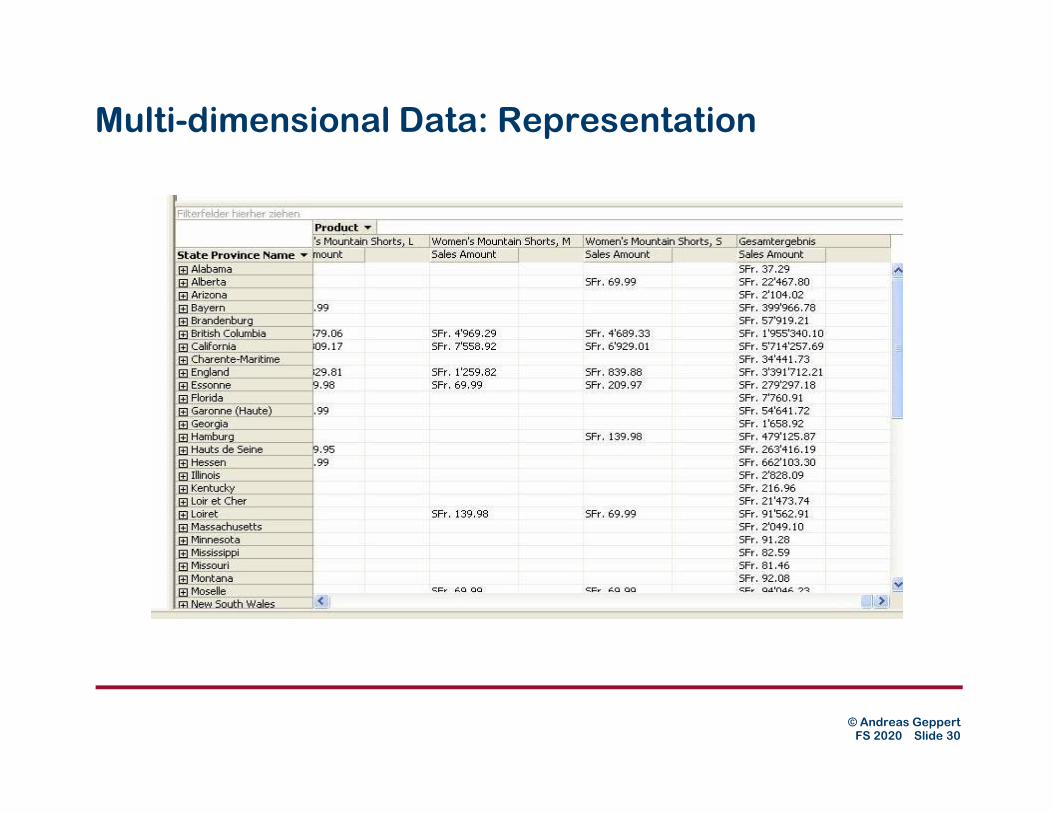
Multi-dimensional Data: Representation
© Andreas Geppert FS 2020 Slide 31
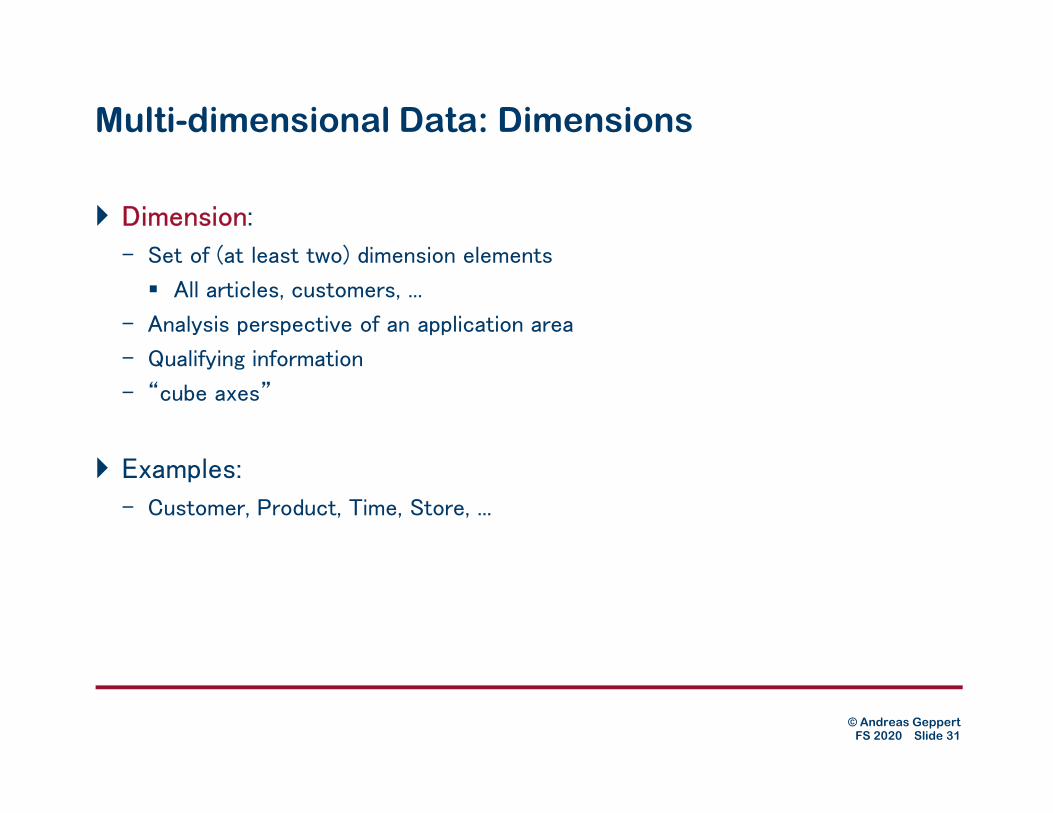
Multi-dimensional Data: Dimensions
� Dimension:
– Set of (at least two) dimension elements
All articles, customers, ...
– Analysis perspective of an application area
– Qualifying information
– “cube axes”
� Examples:
– Customer, Product, Time, Store, ...

© Andreas Geppert FS 2020 Slide 32
Multi-dimensional Data: Dimensions (2)
■Dimensions are rarely flat
■Attributes form a classification hierarchy
■Examples: - Month Quarter Year
- City Canton Region
- Product Product family Product group Area
Camcorder
Heimelektronik
Video Audio Haushaltsgeräte
Waschmaschinen Trockner
Grossgeräte
TR
-75
TS
-78
A2
00
Duett
La
va
mat
AB
1043
Prin
cess
Sup
erI
So
ny
So
ny
JV
C
Sie
me
ns
Zug
Mie
le
Bo
sch
Sie
me
ns
ArtikelNr
Bereich
Gruppe
Familie
Marke
Geschäft
Region
Kanton
StadtHeimrekorder
V-2
01
Cla
ssic
I
JV
C
Gru
nd
ig
Monat
Jahr
Quartal
Total Total TotalAll
© Andreas Geppert FS 2020 Slide 33
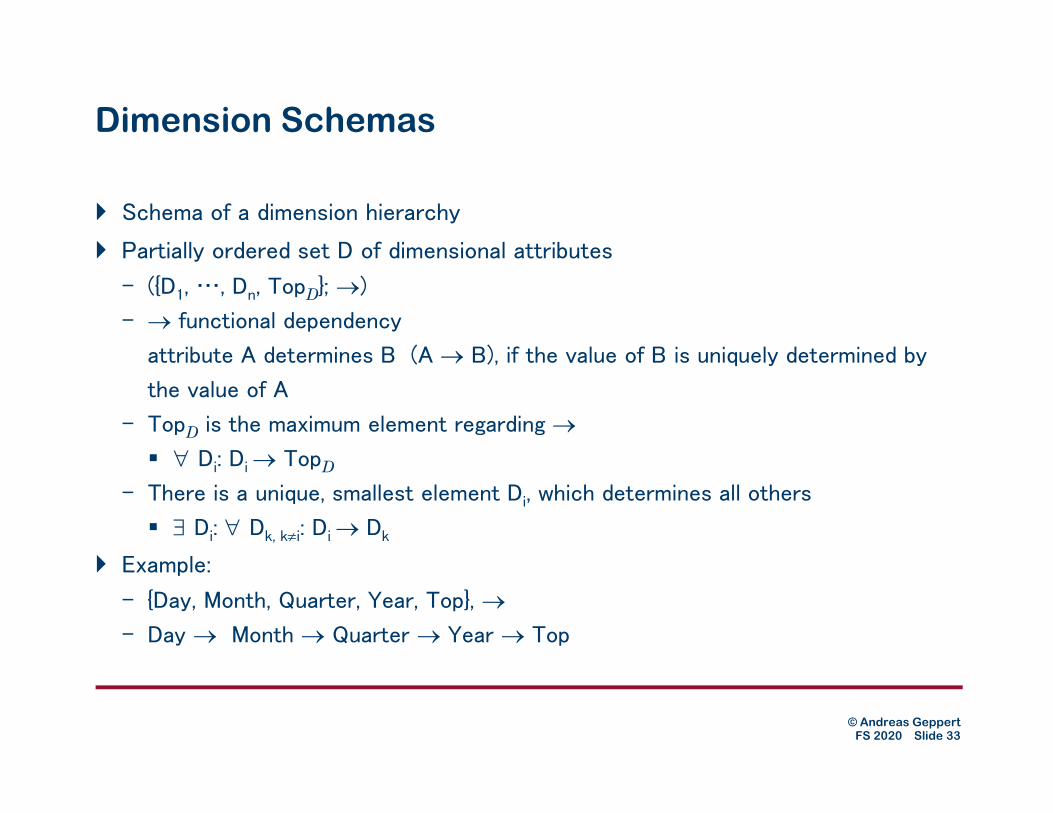
Dimension Schemas
� Schema of a dimension hierarchy
� Partially ordered set D of dimensional attributes
– ({D1, …, Dn, TopD}; )
– functional dependency
attribute A determines B (A B), if the value of B is uniquely determined by
the value of A
– TopD
is the maximum element regarding
Di: Di TopD
– There is a unique, smallest element Di, which determines all others
Di: Dk, ki: Di Dk
� Example:
– {Day, Month, Quarter, Year, Top},
– Day Month Quarter Year Top
© Andreas Geppert FS 2020 Slide 34
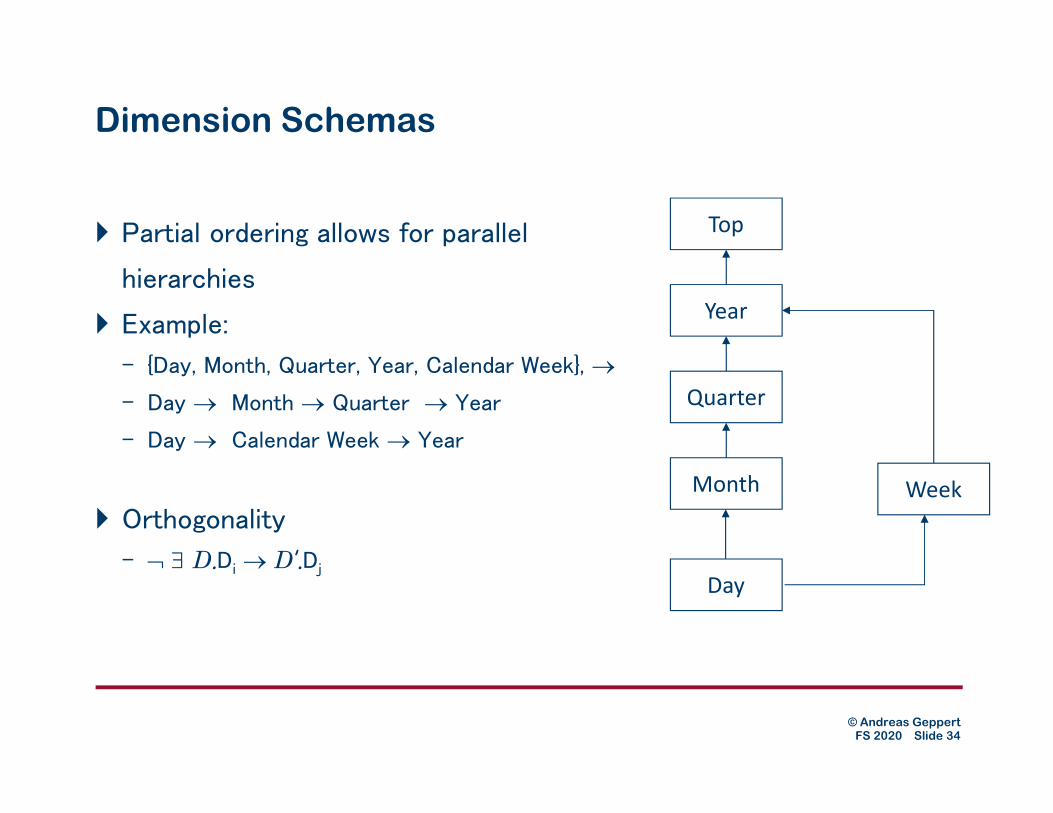
Dimension Schemas
� Partial ordering allows for parallel
hierarchies
� Example:
– {Day, Month, Quarter, Year, Calendar Week},
– Day Month Quarter Year
– Day Calendar Week Year
� Orthogonality
– D.Di D’.Dj
Top
Year
Quarter
Month Week
Day
© Andreas Geppert FS 2020 Slide 35
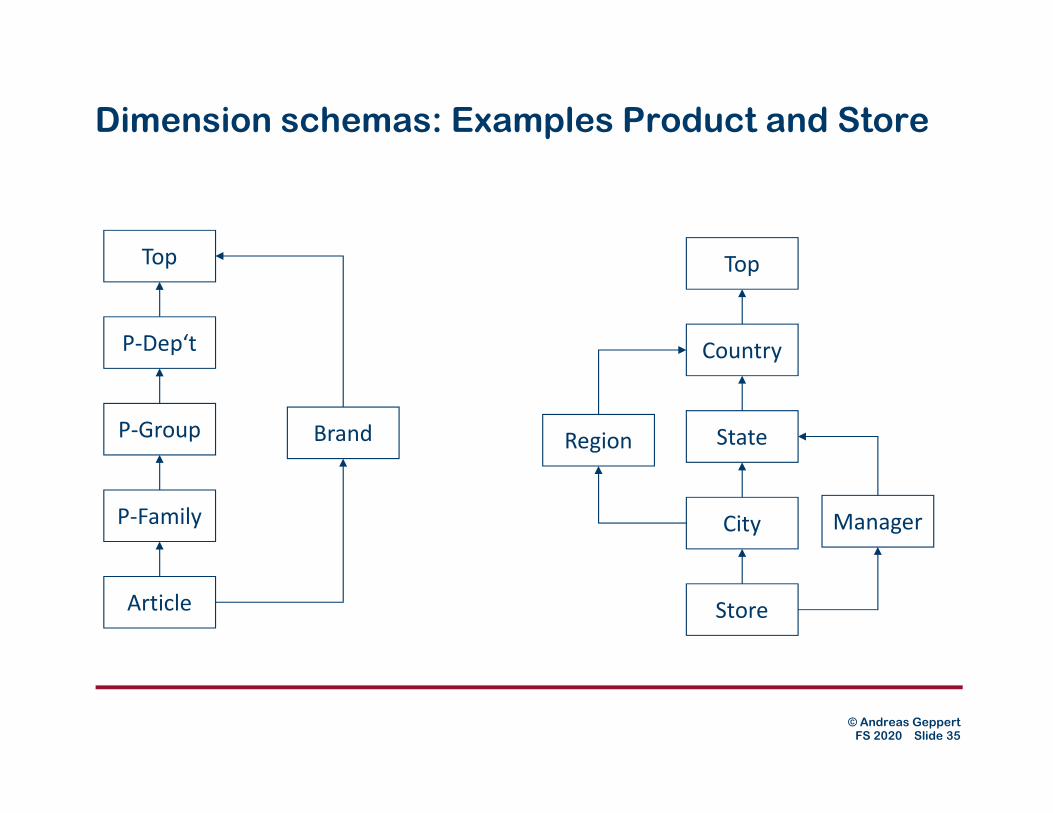
Dimension schemas: Examples Product and Store
Top
P-Dep‘t
P-Group
P-Family
Article
Brand
Top
Country
State
City
Store
Manager
Region

© Andreas Geppert FS 2020 Slide 36
Dimension schemas and Instances
ProductsAll
HomeVCR Camcorder
Video Audio Computers
Brown Goods White Goods
Article
Family
Group
Area
Top
Functional dependencies determine instances structures
– 1:n relationships
– Path to the root: consolidation path
Camcorder Video Brown Goods All

© Andreas Geppert FS 2020 Slide 37
Dimension Schemas: Special Cases
� Relationships between hierarchy levels not always 1:n
� Element node has more than one predecessor
– No tree structure anymore, but acyclic graph
– Example: Product � Promotion
� Gaps in the ancestor relation
– Node on level n+1 does not have predecessor on level n
– Tree is no longer balanced
– Example: Shop City State
© Andreas Geppert FS 2020 Slide 38
Multi-dimensional Data: Measures
� Quantifying information
– Usually numeric
� Key figures, measures
� Examples:
– sales figures
– turnover
– Measurements (temperature, rainfall, …)

© Andreas Geppert FS 2020 Slide 39
Characteristics of Measures
� Name, data type, range
� Aggregation type
– Defines which aggregation operation are meaningful (hence, allowed)
– FLOW: can be aggregated in arbitrary ways (sales, turnover)
– Stock: cannot be summed up over time (inventory, ...)
– VPU (Value per Unit): cannot be summed up at all (price, tax, ...)
� Average, minimum, maximum are always possible
– When semantically meaningful

© Andreas Geppert FS 2020 Slide 40
Multi-dimensional Data: Facts
� A fact is an element of the multi-dimensional space
� Associates a set of dimension elements with measures
� „cube cell“
– Granularity is given by dimension elements
– Fact is uniquely identified through a combination of dimension elements
� Qualifying and quantifying information
� Interesting occurrences
Sometimes misleading use of terms
Facts and measures are sometimes confused, but are not the same
Fact Cell, Measure cell content

© Andreas Geppert FS 2020 Slide 41
Multi-dimensional Data: Cubes
� A data cube is a multi-dimensional space of facts
� Cubes, Hypercubes
11
45
99
45
5
23
8
56
19
44
16
39
8
7
20
56
24
23
28
11
61 94 62
Regio
nPro
du
kt
Quartal

© Andreas Geppert FS 2020 Slide 42
Data Cube Instances
� Cube domain:
– dom(C) = ((dom(G1) … dom(Gn))
((dom(M1) … dom(Mm))
� Instance:
– All cube cells from the cube domain
– Not: subset of existing facts as in the relational
model
� „cube“ is more like a metaphor
– Rarely all cells are really present (in the sense of facts that occurred in the real
world)
– Implementation as null or 0
S hopD a y
Art
icle
S a les T u rn o ver

© Andreas Geppert FS 2020 Slide 43
Content
1. Application Development in Data Warehouses
2. Schema Design for Data Warehouses
3. Multi-dimensional Data Models
– Dimensions, Measures, Facts, Cubes
– Operators
4. Logical Design for Data Marts
5. Appendix: Conceptual Design for Data Marts

© Andreas Geppert FS 2020 Slide 44
Multi-dimensional Operators: Slice and Dice
� Cuts a cube
– Specification of a hierarchy node
– Example: sales in Germany
� Selection of a sub-cube
– Specification of nodes in the
dimension hierarchies
– Sales for Consumer Electric in
Germany in 1997
Time
Locatio
n
Pro
duct
1997
Co
ns.
Ele
ctr
ic
Germ
any
gro
up
fam
ily
art
icle day
month
year
shop
regio
nco
untry

© Andreas Geppert FS 2020 Slide 45
Multi-dimensional Operators: Navigation
� Drill-Down
– Start at coarser granularity
– Navigate to a representation with finer granularity (i.e., more detailed)
– Sums will be broken up in partial sums
– Example: Sales [Year, Kanton] -> Sales [Quarter, Kanton]
Drill down

© Andreas Geppert FS 2020 Slide 46
Multi-dimensional Operators: Navigation (2)
� Roll-up
– Start at finer granularity
– Navigate to a representation with coarser granularity (i.e., less detailed)
– Possibly first expansion of the data
– Example: Sales per year and state (2005, CA)
Sales per year and country (2005, USA)
Roll up

© Andreas Geppert FS 2020 Slide 47
Multi-dimensional Operators: Pivot
� Changes orientation of the dimensions
� Rather an operation on presentation level, not of the data model
Location
Tim
e
Product
Loca
tio
nPivot
© Andreas Geppert FS 2020 Slide 48
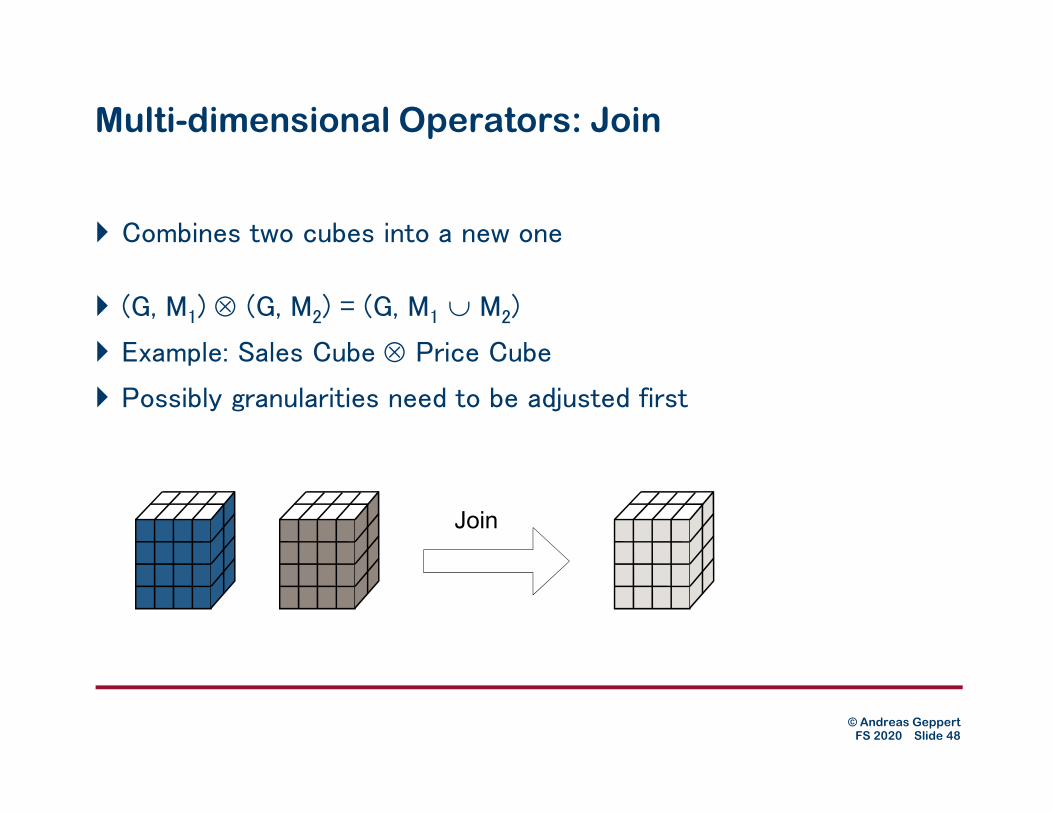
Multi-dimensional Operators: Join
� Combines two cubes into a new one
� (G, M1) (G, M2) = (G, M1 M2)
� Example: Sales Cube Price Cube
� Possibly granularities need to be adjusted first
Join

© Andreas Geppert FS 2020 Slide 49
Multi-dimensional Operators: Aggregation
� Aggregation happens (implicitly) whenever granularity changes (e.g.,
rollup)
– By default, sums are computed
– Other standard aggregation operators are possible as well: average, minimum,
maximum, count
– Further, application-specific calculations
– A multi-dimensional DBS can be used as a calculation engine

© Andreas Geppert FS 2020 Slide 50
Multi-dimensionale Data Models: Summary
� Several multi-dimensional data models
� Dimensions & hierarchies, measures, facts, cubes
� Cubes as the basis for ...
– Analysis
– Calculations
� Some (subtle) restrictions
� „Cube" is a concept, there are different instantiations on logical and
physical level

© Andreas Geppert FS 2020 Slide 51
Content
1. Application Development in Data Warehouses
2. Schema Design for Data Warehouses
3. Multi-dimensional Data Models
4. Logical Design for Data Marts
5. Appendix: Conceptual Design for Data Marts
© Andreas Geppert FS 2020 Slide 52
Logical Design
� Derive logical schema from conceptual one
� express logical schema with the means of the logical (meta) data model (!)
– logical data model can be relational or multidimensional
� Requirements (to logical (meta) data models and DBMSs
– adequate representation of data (types)
dimensions and hierarchies
facts
– operators support analysis adequately
– DBMS aspects
large volumes of data
performance
multi user access
security, ...

© Andreas Geppert FS 2020 Slide 53
Relational Mapping of Multidimensional Structures
Storage of multidimensional data
– in relations
– only existing cube cells
Separation of structure and content (unlike as in cubes)
– central fact table(s)
– dimension tables
– facts reference dimension tables
– fact table contains measuresZeit
Pro
dukt 27
11. 11. 2001MediaMarkt
TR-75 Produkt Geschäft Zeit Verkäufe
TR-75 MediaMarkt 11. 11. 2001 27
AC300 ProMarkt 23. 12. 2001 39
... ... ... ...
© Andreas Geppert FS 2020 Slide 54
Snowflake Schemas
� (central) fact table, dimension tables
� dimension tables are normalized
� n dimension hierarchy levels (within a dimension) n dimension
relations for this dimension
� foreign key/primary key relationship between fact and dimension
tables: fact table references dimension table representing most
granular hierarchy level
� primary key of fact table is composed out of foreign keys (i.e.,
primary keys of dimensions)
� foreign key/primary key relationship between dimension tables
(representing the hierarchy levels)

© Andreas Geppert FS 2020 Slide 55
Snowflake Schema: Example
RegionID
Region
State
...
StateID
State
Country
...
ShopID
ShopType
Region
... ArticleID
Family
VSys
…
Load
Temp
ArticleID
ShopID
Day
Sales
Stock
Turnover
FamilyID
Family
Group
...
GroupID
Group
Area
...
Month
Quarter
...
Quarter
Year
...
Day
Month
...

© Andreas Geppert FS 2020 Slide 56
Snowflake Schemas: Implications for Queries
■Example: Sum of sales by region, by month, by product group
■7 join operations:
– 3 between fact table and (most granular) dimension tables
– 4 for rollup to higher hierarchy levels

© Andreas Geppert FS 2020 Slide 57
Snowflake Schemas: Properties
� correct update of dimension tables is easier
– because of normalization
– normalization avoids update anomalies
� schema design is easier
– depending on conceptual design, snowflake design is obtained as a result of an
automatic transformation
� performance is worse
– many joins are required
– one join per involved dimension + one join per "rollup"
� no redundancy
– again, because of normalization

© Andreas Geppert FS 2020 Slide 58
Star Schemas
� central fact table
� one table per dimension, regardless of the number of hierarchy
levels within the dimensions
� denormalized dimension tables
� foreign key/primary key relationship between fact and dimension
tables: fact table references dimension tables
� primary key of fact table is composed out of foreign keys (i.e.,
primary keys of dimensions)

© Andreas Geppert FS 2020 Slide 59
Star Schema: Example
ShopID
Region
State
Country
ShopType
Region
...
ArticleID
Family
Group
Area
Brand
VSys
…
Load
Temp
ArticleID
ShopID
Day
Sales
Stock
TurnoverDay
Month
Quarter
Year
...

© Andreas Geppert FS 2020 Slide 60
Star Schemas: Properties
� Redundancy
– because of denormalization
– update anomalies are possible
� Performance
– smaller number of joins
– because of denormalization
� intuitive

© Andreas Geppert FS 2020 Slide 61
Star Schemas: Implications for Queries
■Example: Sum of sales by region, by
month, by product group
■3 join operations
– 3 between fact table and dimension
tables
– no joins for rollup to higher hierarchy
levels
ShopID
Region
State
Country
ShopType
Region
...
ArticleID
Family
Group
Area
Brand
VSys
…
Load
Temp
ArticleID
ShopID
Day
Sales
Stock
TurnoverDay
Month
Quarter
Year
...
© Andreas Geppert FS 2020 Slide 62
Comparison: Star vs. Snowflake
� Advantages of Star schemas
faster query evaluation
no difference between star and snowflake when for each dimension only the most
granular hierarchy level is needed
but: analytic queries are more often than not on a high (coarse) aggregation level
one join per rollup
simpler structure
important for the generation of OLAP-queries
additional data volume is negligible
updates to classifications are rare
update anomalies are less of an issue

© Andreas Geppert FS 2020 Slide 63
Special Cases: Factless Fact Tables
■Fact table contains dimensions and
measures
■Special case:
– no measure
existence statement without numeric
attributes
■recording of events
■Example: student attends course held
by a lecturer on a certain day
StudentKey
VorlesungKey
DozentKey
ZeitKey
© Andreas Geppert FS 2020 Slide 64
Factless Fact Tables (2)
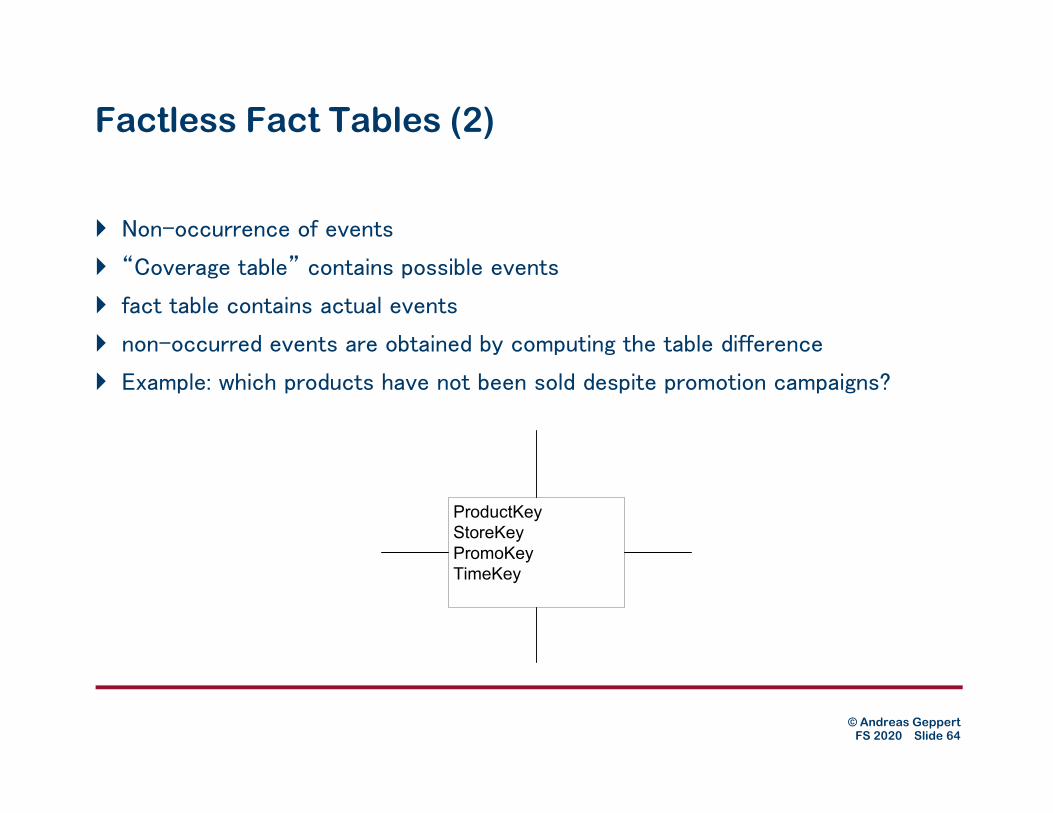
� Non-occurrence of events
� “Coverage table” contains possible events
� fact table contains actual events
� non-occurred events are obtained by computing the table difference
� Example: which products have not been sold despite promotion campaigns?
ProductKey
StoreKey
PromoKey
TimeKey

© Andreas Geppert FS 2020 Slide 65
Galaxy Schemas
� multiple independent fact tables
� fact tables share some (but not all) dimension tables

© Andreas Geppert FS 2020 Slide 66
Fact Constellation
� Measures are needed on different aggregation levels within an
analysis scenario
� Computation of aggregated measures always possible, but possibly
expensive
� possible optimization: materialization of aggregate values
� option 1: addition of aggregate values to fact table
– additional attribute for each aggregate value
– additional discriminator attribute
– correct linkage to dimension tables?

© Andreas Geppert FS 2020 Slide 67
Fact Constellation (2)
� Option 2: separate table for aggregate values (fact constellation)
� „smaller“ fact table
� also smaller dimension tables possible
� more efficient queries against detailed and aggregated data
Customer
Product
Date
MonthDate
Sales
SalesbyMonth

© Andreas Geppert FS 2020 Slide 68
Monster Dimensions
� common problem: very big dimension tables
� many attributes, many rows
� example: product dimension
– 10K-100K product articles, 20-50 attributes (warehouses, retail)
� example: customer dimension
– up to 100M customers, many attributes
� demography: often queried, rather frequent modifications
– example income, marital status
© Andreas Geppert FS 2020 Slide 69
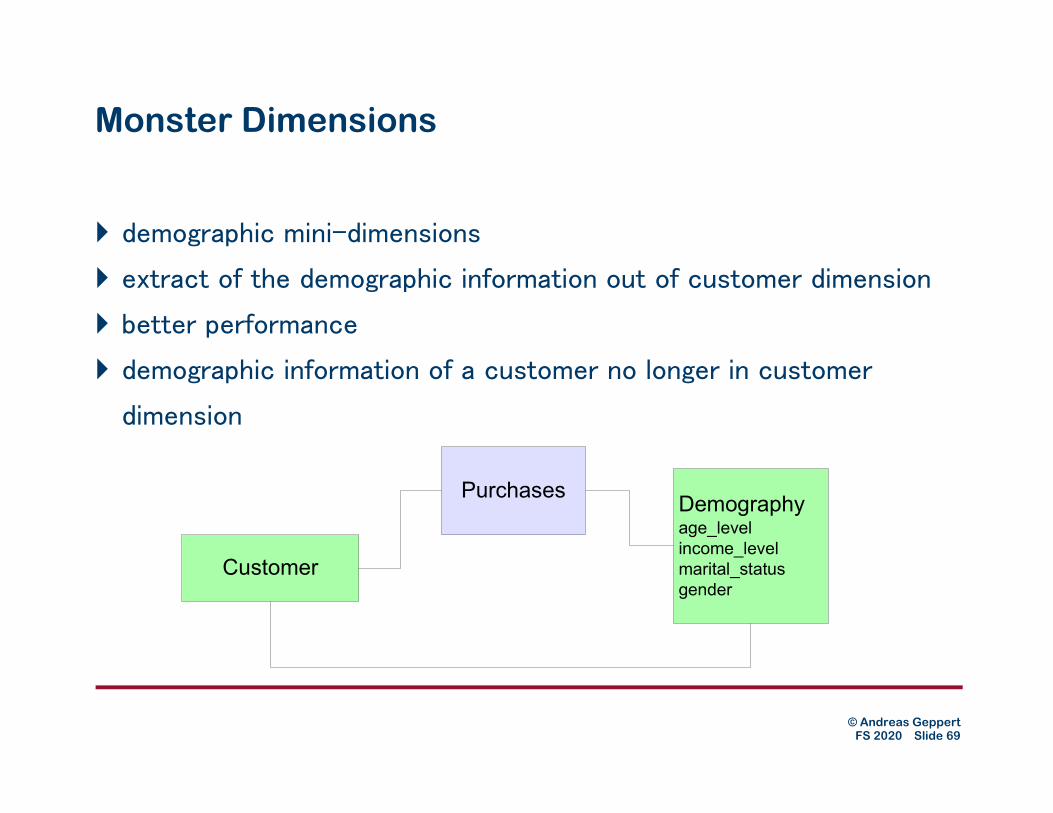
Monster Dimensions
� demographic mini-dimensions
� extract of the demographic information out of customer dimension
� better performance
� demographic information of a customer no longer in customer
dimension
Purchases
Customer
Demographyage_level
income_level
marital_status
gender

© Andreas Geppert FS 2020 Slide 70
Versioning of Dimension Tables
� Problem: changes in dimension tables
� Examples:
– Customers change address, name, marital status, ...
– products are abandoned
– product properties (classification) change
� Dimensions are yet "rather constant"
– slowly changing dimensions (SCD)
� changes are permitted in OLTP applications, because there the current state is
of (sole) interest
– old values are overridden, update-in-place
� changes are problematic in a DWH, they can lead to misleading, erroneous
analysis results

© Andreas Geppert FS 2020 Slide 71
Versioning of Dimension Tables (2)
� Versioning of Dimension Tables: Solutions
1. Update-in-place
– old values are lost
– simple to implement
– no history is available
– misleading analysis results are possible
– SCD Type 1
Customer_key name status
1234 Joe Cool single married
© Andreas Geppert FS 2020 Slide 72
Versioning of Dimension Tables (3)
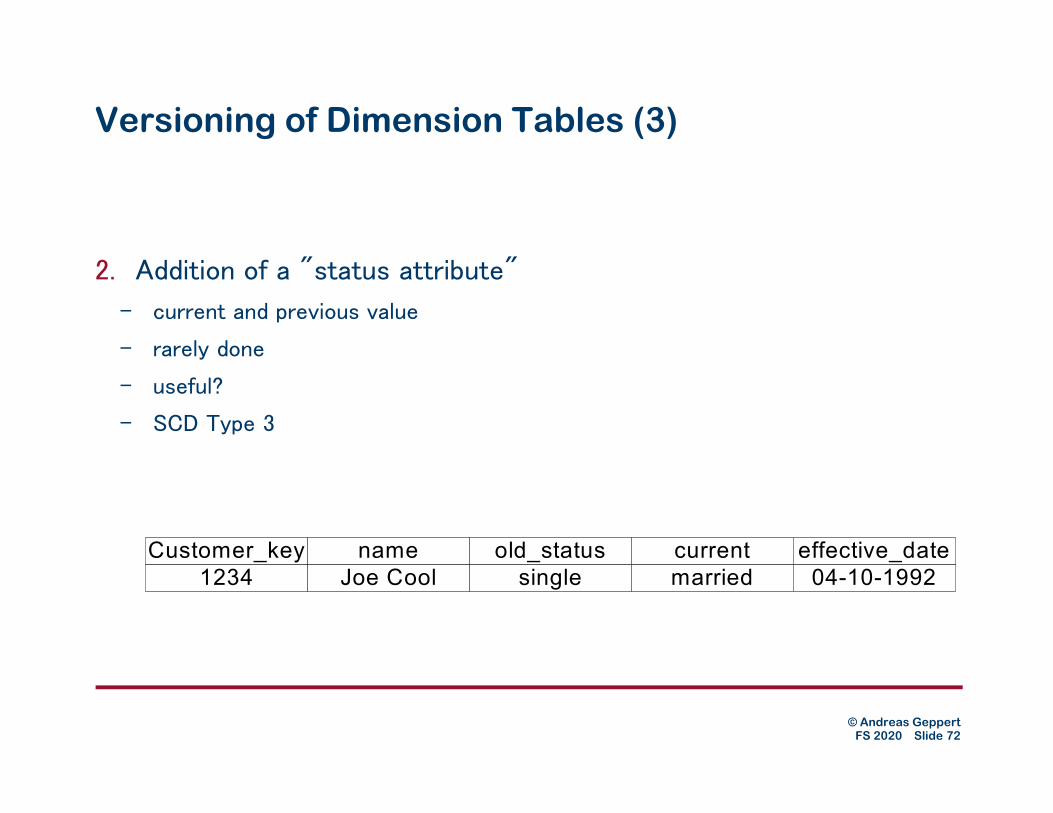
2. Addition of a "status attribute"
– current and previous value
– rarely done
– useful?
– SCD Type 3
Customer_key name old_status current effective_date
1234 Joe Cool single married 04-10-1992
© Andreas Geppert FS 2020 Slide 73
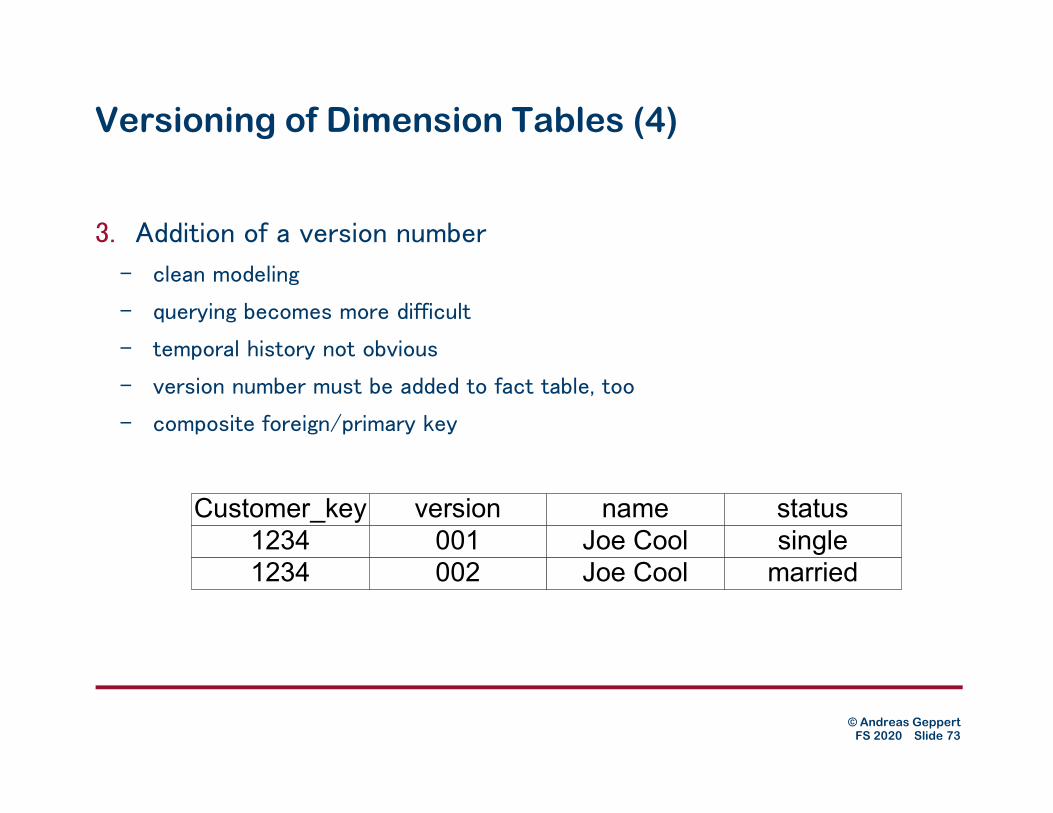
Versioning of Dimension Tables (4)
3. Addition of a version number
– clean modeling
– querying becomes more difficult
– temporal history not obvious
– version number must be added to fact table, too
– composite foreign/primary key
Customer_key name status
1234 Joe Cool single
version
001
1234 002 Joe Cool married

© Andreas Geppert FS 2020 Slide 74
Versioning of Dimension Tables (5)
4. extension of primary key with version number
– questionable from a modeling point of view
– unique identification and reference, for instance for aggregation?

© Andreas Geppert FS 2020 Slide 75
Versioning of Dimension Tables (6)
5. explicit addition of validity intervals
– eases historical and time-based queries
– at least one of the timestamps must be added to primary key
– or referential integrity cannot be maintained
– SCD Type 2

© Andreas Geppert FS 2020 Slide 76
Summary
� DWH application development
� "standard" approach for DWH itself (ER-based)
� conceptual data mart design
– no established notation (a la ER)
– patterns of logical design are used for conceptual one ("dimensional modeling")
� relational implementation
– Star and Snowflake schemas
– Galaxy schema & Fact Constellation Schema
– Factless Fact Tables
– Slowly Changing Dimensions

© Andreas Geppert FS 2020 Slide 77
APPENDIX

© Andreas Geppert FS 2020 Slide 78
Content
1. Application Development in Data Warehouses
2. Schema Design for Data Warehouses
3. Multi-dimensional Data Models
4. Logical Design for Data Marts
5. Appendix: Conceptual Design for Data Marts

© Andreas Geppert FS 2020 Slide 79
Conceptual Design for Data Marts
Multidimensional concepts: basic support considered in DWH and
OLAP systems
no common, widely accepted model
no standardized modeling language and notation
no common formalization
methods and guidelines based on experience
© Andreas Geppert FS 2020 Slide 80
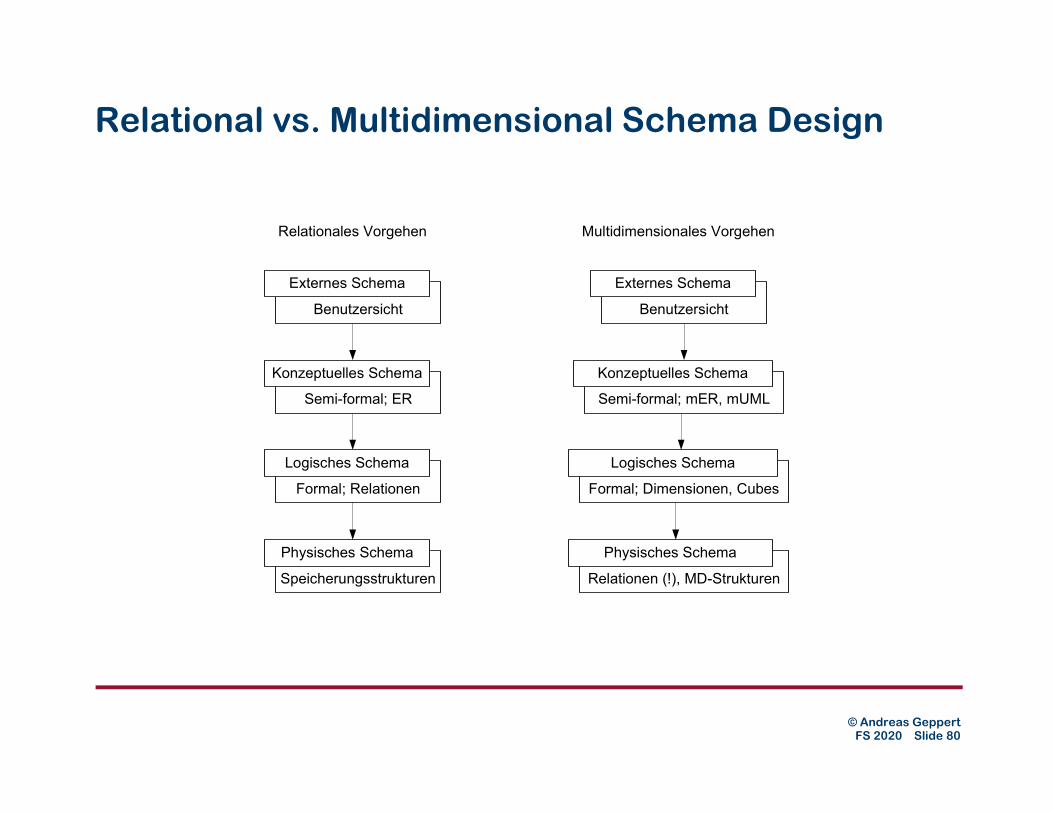
Relational vs. Multidimensional Schema Design
Benutzersicht
Externes Schema
Semi-formal; ER
Konzeptuelles Schema
Formal; Relationen
Logisches Schema
Speicherungsstrukturen
Physisches Schema
Relationales Vorgehen Multidimensionales Vorgehen
Benutzersicht
Externes Schema
Semi-formal; mER, mUML
Konzeptuelles Schema
Formal; Dimensionen, Cubes
Logisches Schema
Relationen (!), MD-Strukturen
Physisches Schema

© Andreas Geppert FS 2020 Slide 81
Conceptual Design: Variants
� Use of existing notations (and methods, tools)
– possibly with adapted semantics
– currently prevalent approach in practice
� Extensions of existing notations
– ER
– UML
– typically academic/research proposals
� Development of new notations
– typically academic/research proposals
can be designed to optimally meet requirements
additional notation

© Andreas Geppert FS 2020 Slide 82
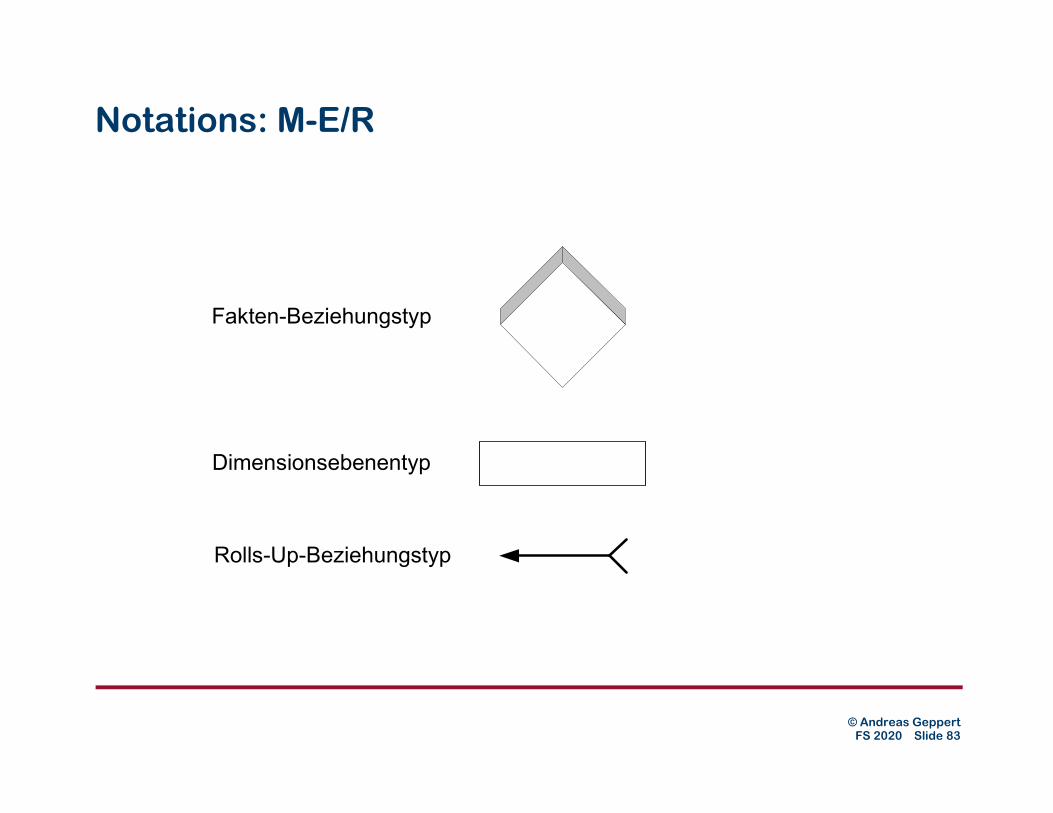
Notations: M-E/R
� Extension of the ER model
� additional entity type representing dimension hierarchy level
� additional relationship types:
– relationship between dimension hierarchy levels
– relationship between dimensions and hierarchies
© Andreas Geppert FS 2020 Slide 83
Notations: M-E/R
Fakten-Beziehungstyp
Dimensionsebenentyp
Rolls-Up-Beziehungstyp

© Andreas Geppert FS 2020 Slide 84
M-E/R: Example
Tag
Woche
Jahr Quartal Monat
ArtikelP.Kategorie P.Familie P.Gruppe
FilialeRegion Bezirk StadtLand
© Andreas Geppert FS 2020 Slide 85
Gold: Notation
� developed on the basis of the Unified Modeling Language (UML)
� Approach by Trujillo et al., prototypically implemented in the "Gold"
tool
Usage of UML constructs for the modeling of:
� fact classes
� dimensions
� relationships between– facts and dimensions
– dimension hierarchy levels
� cardinalities
© Andreas Geppert FS 2020 Slide 86
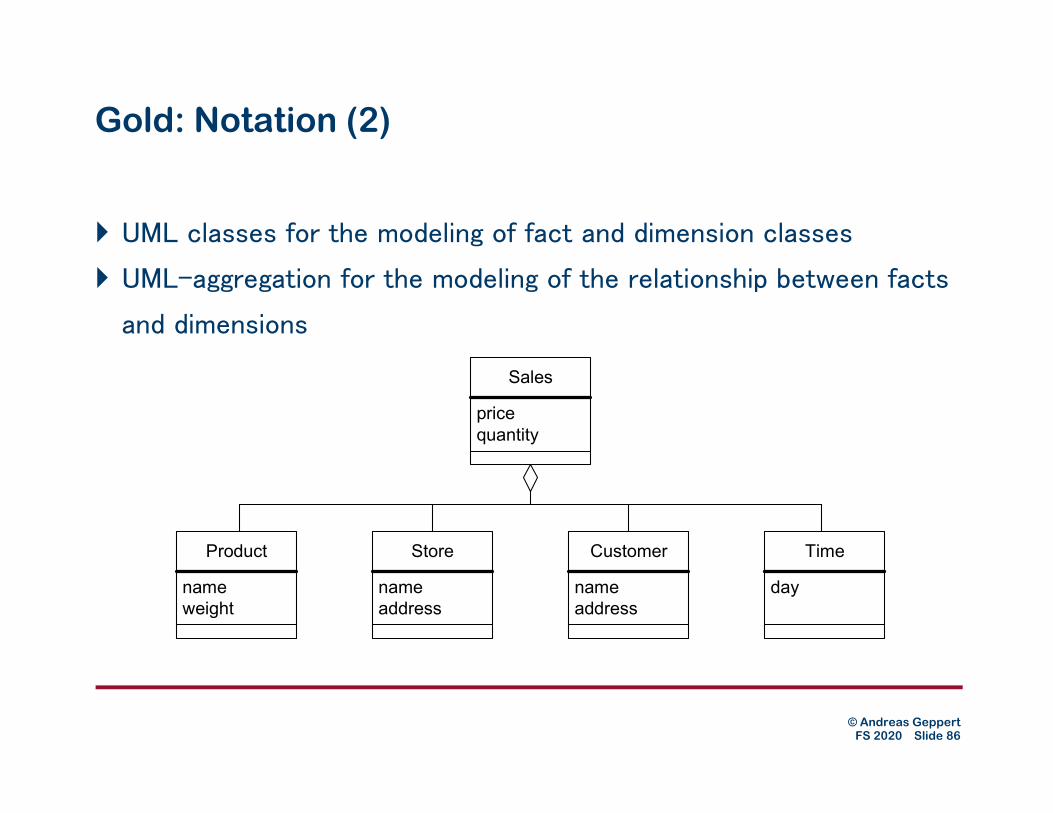
Gold: Notation (2)
� UML classes for the modeling of fact and dimension classes
� UML-aggregation for the modeling of the relationship between facts
and dimensions
Sales
price
quantity
Product
name
weight
Store
name
address
Customer
name
address
Time
day
© Andreas Geppert FS 2020 Slide 87
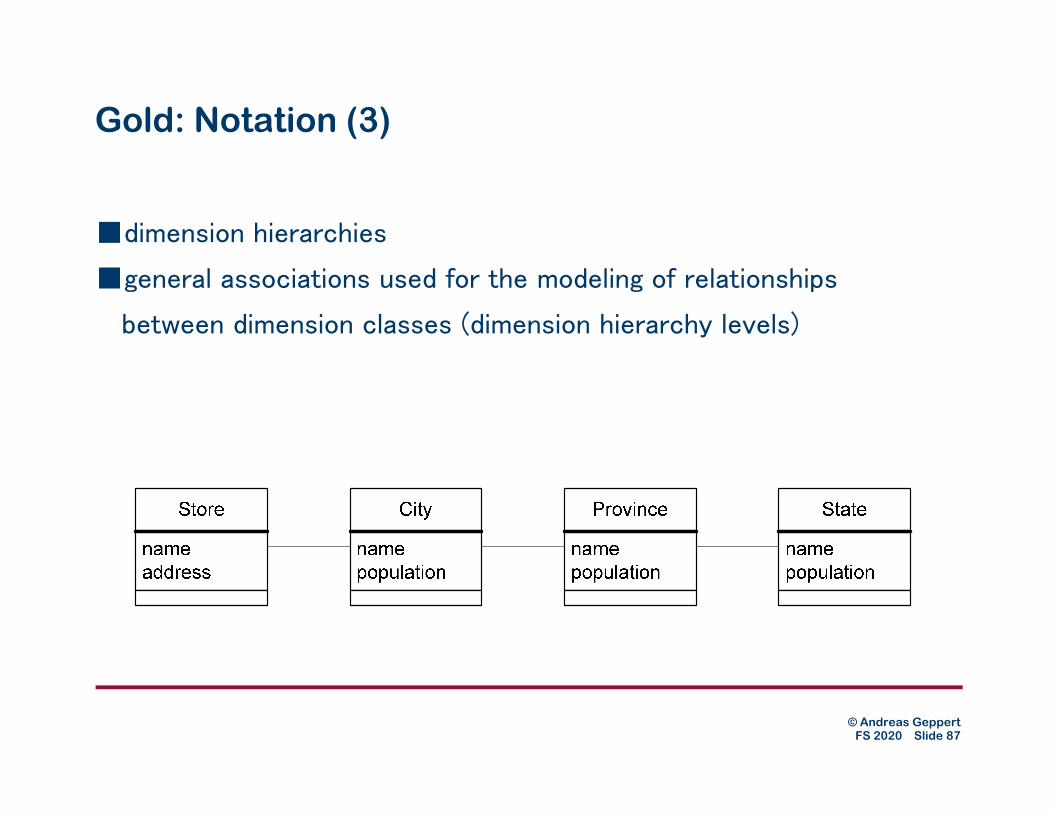
Gold: Notation (3)
■dimension hierarchies
■general associations used for the modeling of relationships
between dimension classes (dimension hierarchy levels)

© Andreas Geppert FS 2020 Slide 88
Gold: Notation (4)
■Gold supports shared hierarchies

© Andreas Geppert FS 2020 Slide 89
Gold: Notation (5)
■Gold supports parallel hierarchies
Store
name
address
City
name
population
Province
name
population
State
name
population
SalesRegion
name
population
© Andreas Geppert FS 2020 Slide 90
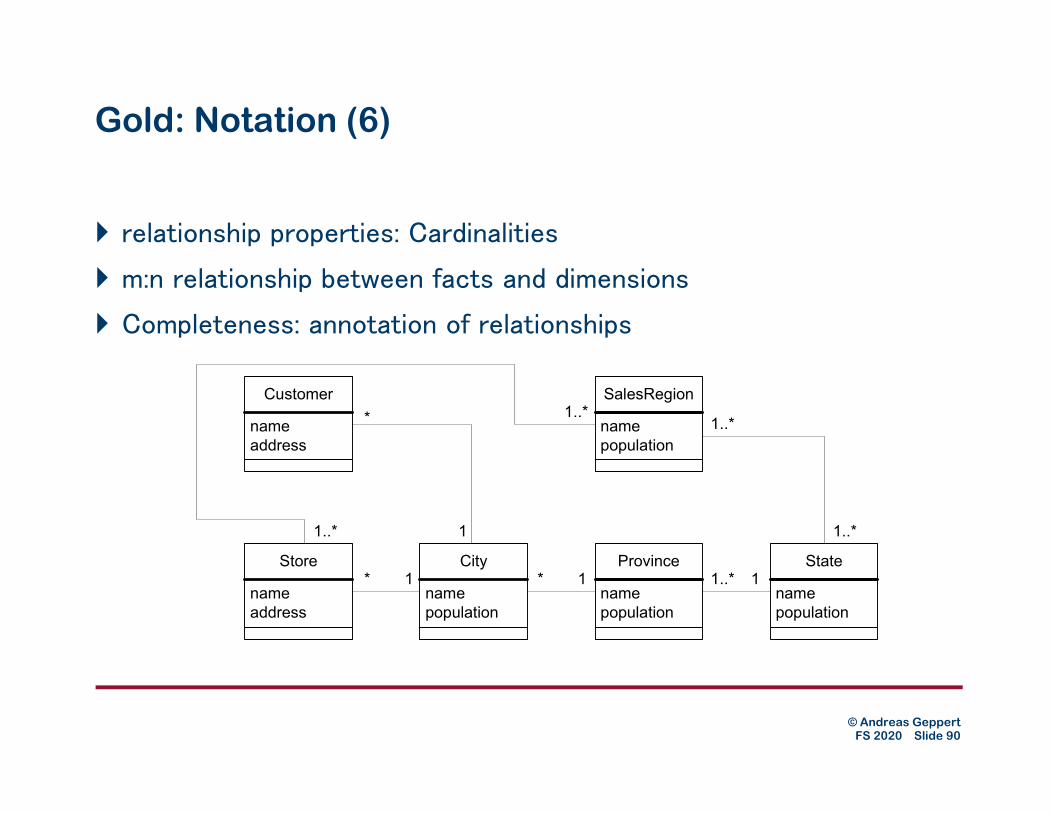
Gold: Notation (6)
� relationship properties: Cardinalities
� m:n relationship between facts and dimensions
� Completeness: annotation of relationships
Store
name
address
City
name
population
Province
name
population
State
name
population
Customer
name
address
SalesRegion
name
population
1* 1* 11..*
1..*
1..*1..*
1
*
1..*

© Andreas Geppert FS 2020 Slide 91
Gold: Notation (7)
� Specialization of dimension
classes using UML
specialization
� problem: which circumstances
should be modeled as a
classification hierarchy, which
as a specialization hierarchy
Cleaning
...
Grocery
expire_date
Beverage
volume
Food
preparation
Alcohol
percentage
SoftDrink
sparkling
Product
name
weight

© Andreas Geppert FS 2020 Slide 92
Adapt
� Application Design for Analytical Processing Technologies
� Trademark of Symmetry Corp.
� intended as a conceptual model for OLAP-Applications– Star schemas presume implementation
– ER and "dimensional Modeling" are biased towards relational implementations
Hypercube
Dimension
© Andreas Geppert FS 2020 Slide 93
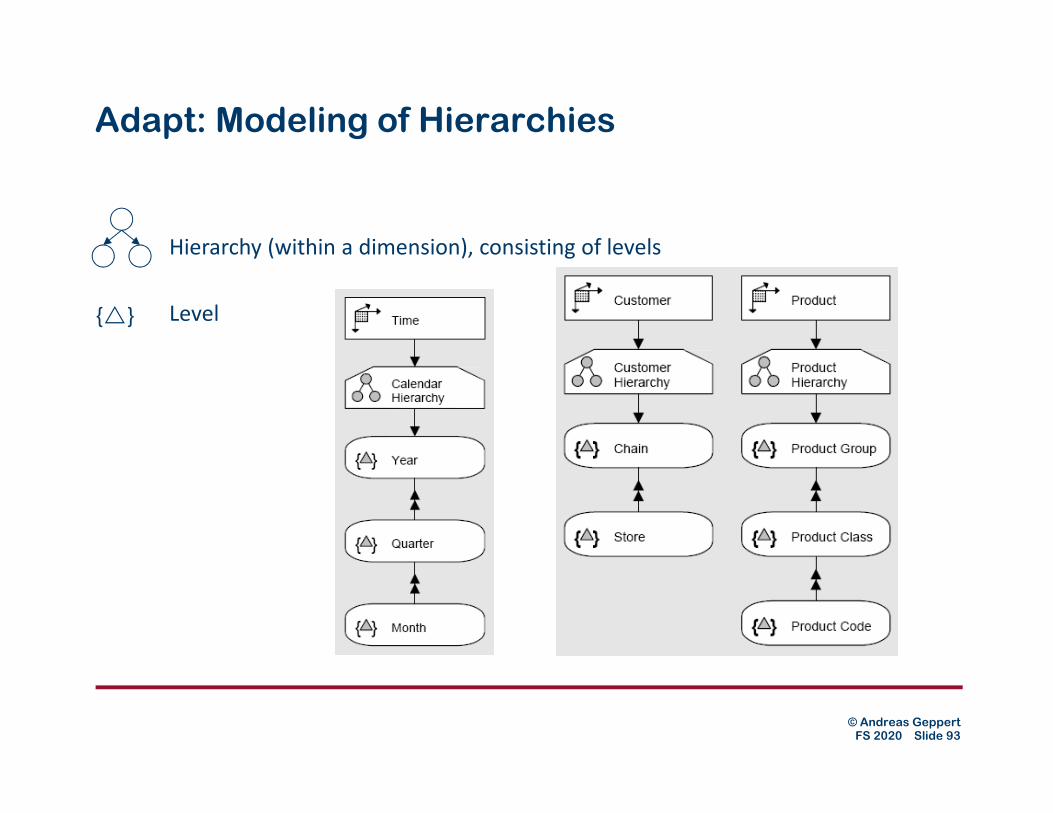
Adapt: Modeling of Hierarchies
Hierarchy (within a dimension), consisting of levels
Level{�}
© Andreas Geppert FS 2020 Slide 94
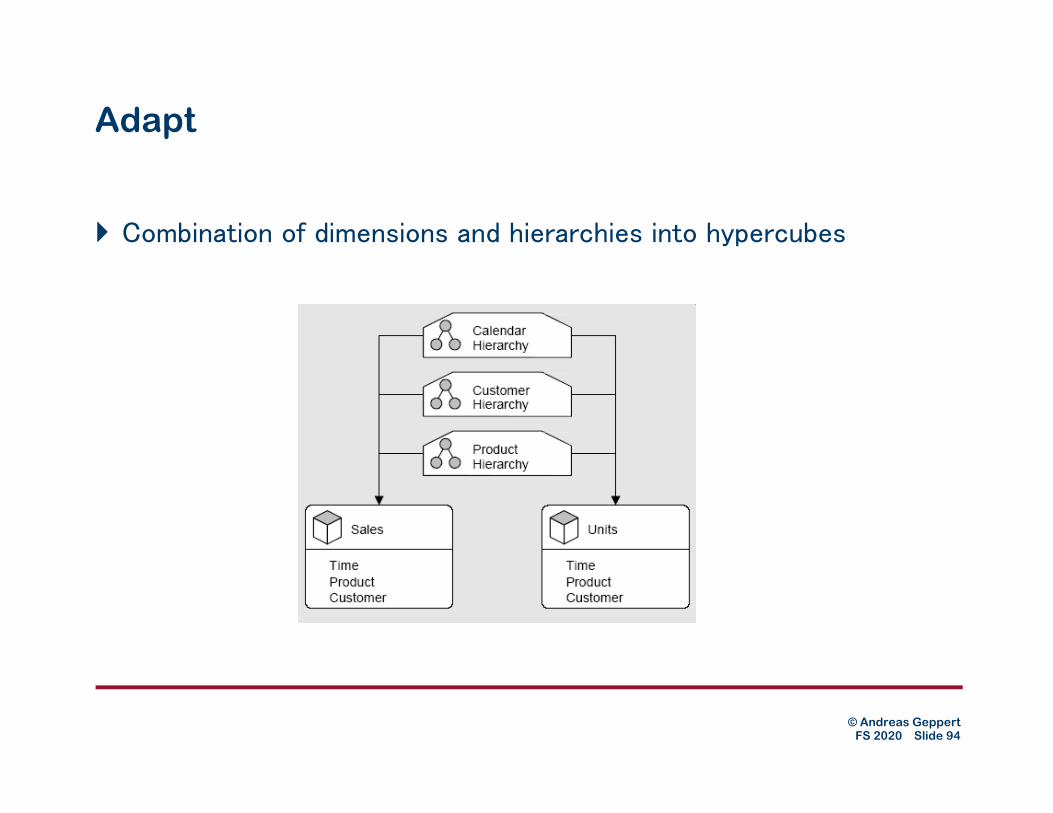
Adapt
� Combination of dimensions and hierarchies into hypercubes

© Andreas Geppert FS 2020 Slide 95
Adapt: Modeling of dimension details
Member{�}
Attribute
© Andreas Geppert FS 2020 Slide 96
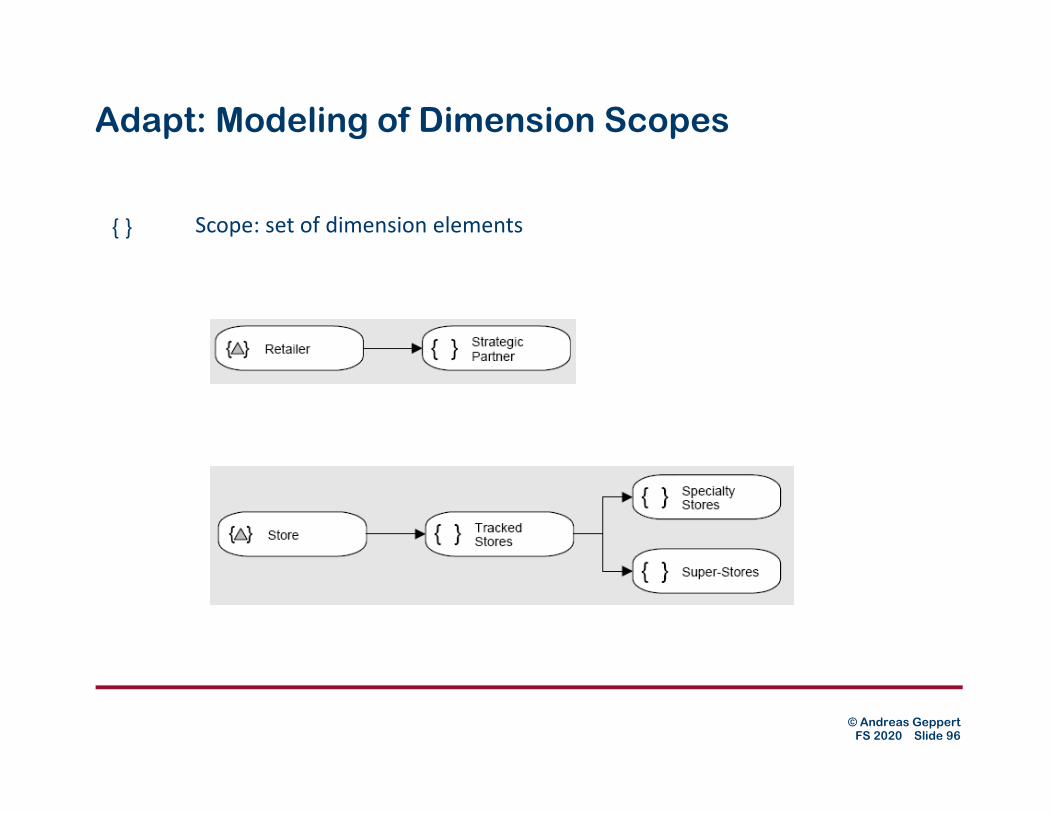
Adapt: Modeling of Dimension Scopes
Scope: set of dimension elements{ }

© Andreas Geppert FS 2020 Slide 97
Adapt: Modeling of Calculations
algebraic processes model calculationsf ( )

© Andreas Geppert FS 2020 Slide 98
Adapt: Sample Product Dimension