data warehousing - unibz · data warehousing and data mining lecture dates (subject to change): ......
TRANSCRIPT
© M. Böhlen, Free University of Bolzano, DWDM08
Data Warehousing and Data Mining
Lecture dates (subject to change):• November 13, 14, 27, 28• December 4, 5, 11, 12, 18, 19• January 8, 9
© M. Böhlen, Free University of Bolzano, DWDM08 2
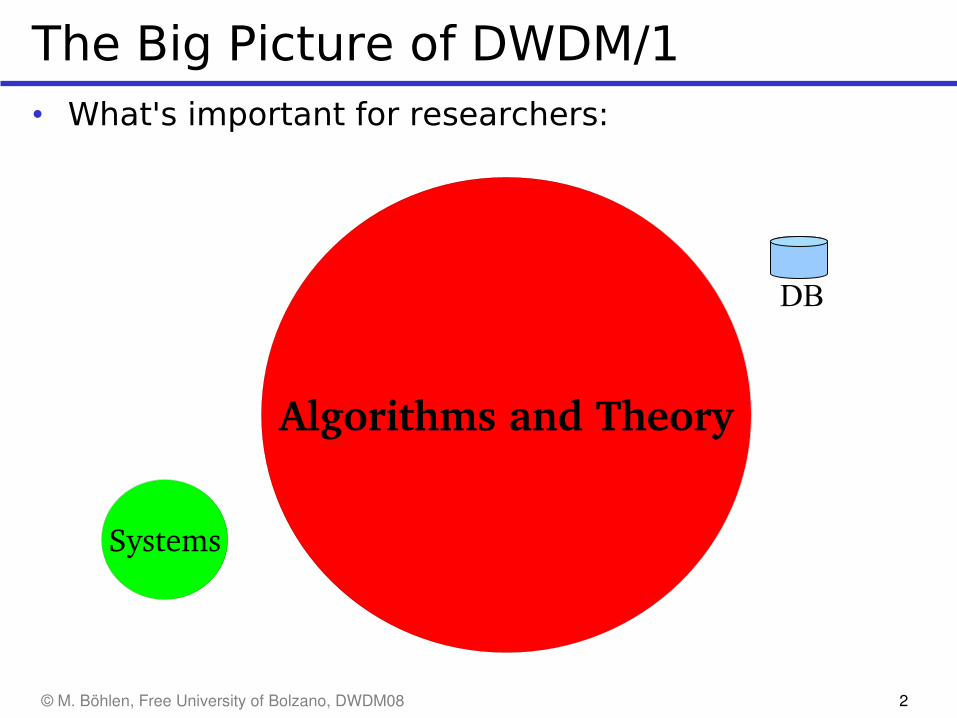
The Big Picture of DWDM/1
Algorithms and Theory
Systems
• What's important for researchers:
DB
© M. Böhlen, Free University of Bolzano, DWDM08 3
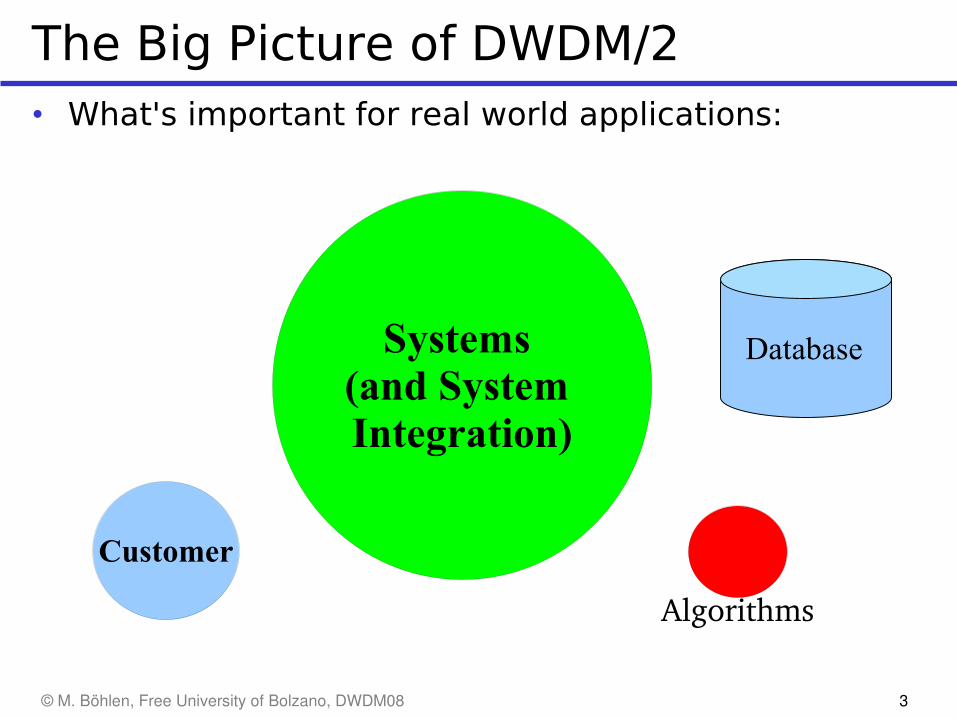
The Big Picture of DWDM/2
Database
Customer
Systems (and System Integration)
Algorithms
• What's important for real world applications:
© M. Böhlen, Free University of Bolzano, DWDM08 4
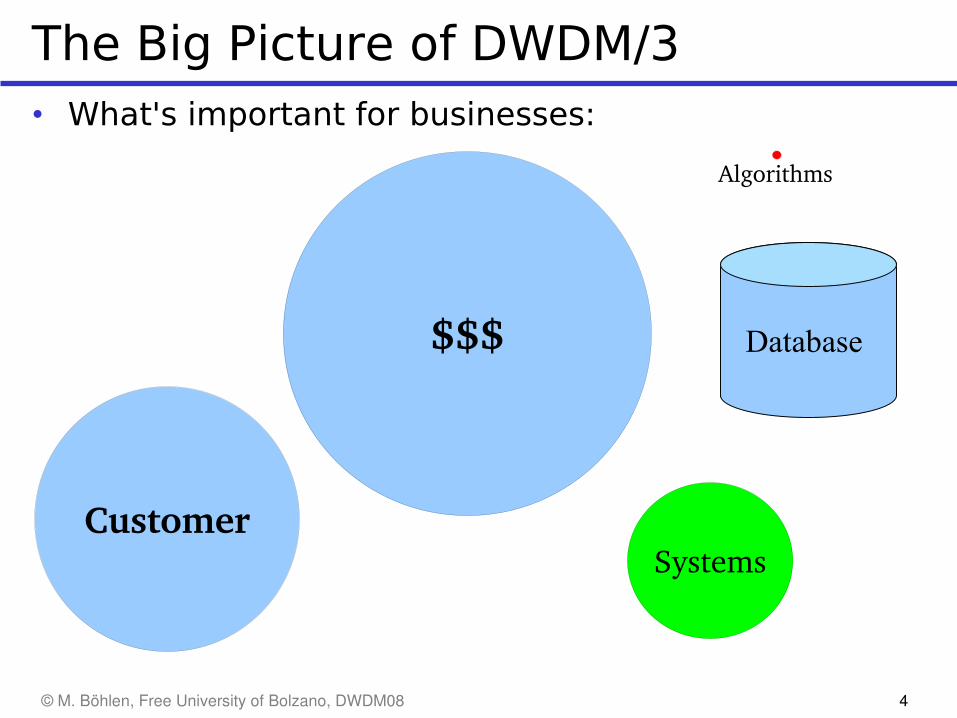
The Big Picture of DWDM/3
$$$
CustomerSystems
Algorithms
• What's important for businesses:
Database
© M. Böhlen, Free University of Bolzano, DWDM08 5
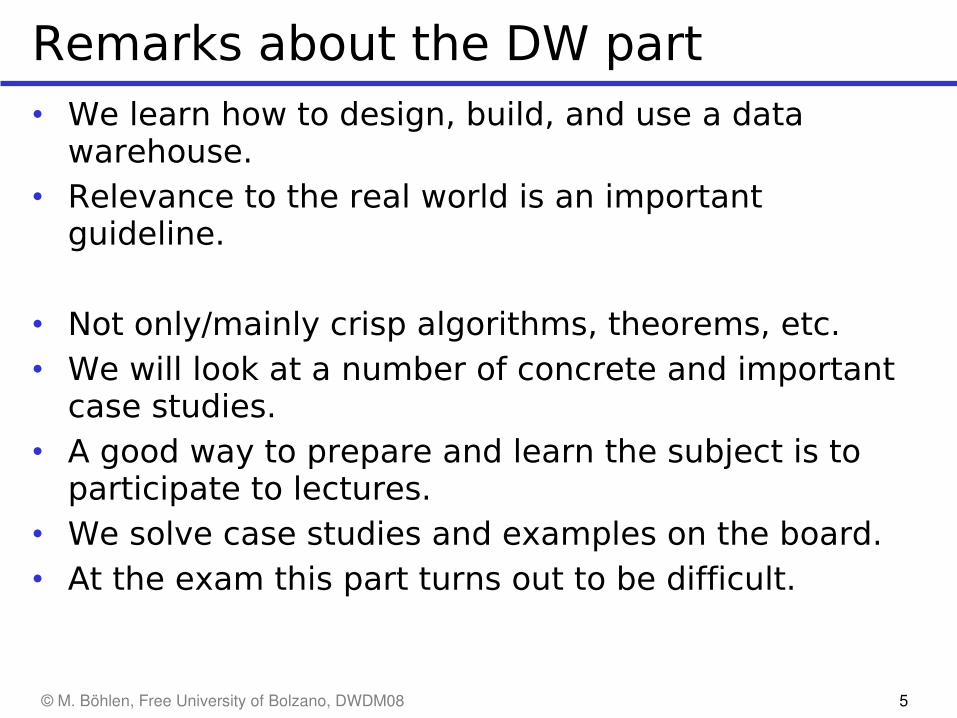
Remarks about the DW part• We learn how to design, build, and use a data
warehouse.• Relevance to the real world is an important
guideline.
• Not only/mainly crisp algorithms, theorems, etc.• We will look at a number of concrete and important
case studies.• A good way to prepare and learn the subject is to
participate to lectures.• We solve case studies and examples on the board.• At the exam this part turns out to be difficult.
© M. Böhlen, Free University of Bolzano, DWDM08 6
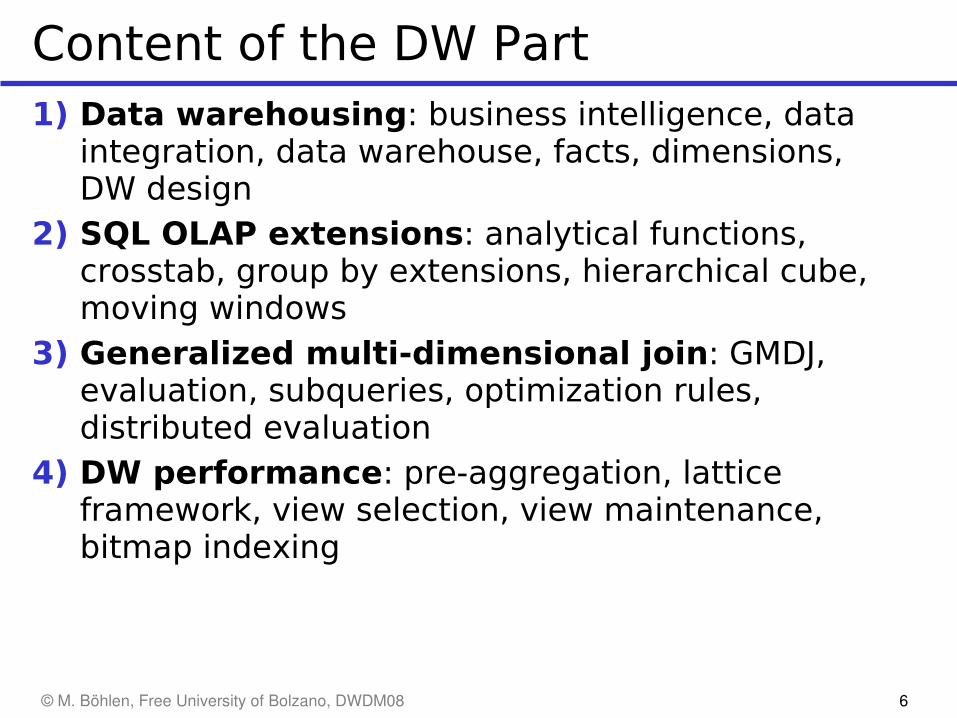
Content of the DW Part1) Data warehousing: business intelligence, data
integration, data warehouse, facts, dimensions, DW design
2) SQL OLAP extensions: analytical functions, crosstab, group by extensions, hierarchical cube, moving windows
3) Generalized multi-dimensional join: GMDJ, evaluation, subqueries, optimization rules, distributed evaluation
4) DW performance: pre-aggregation, lattice framework, view selection, view maintenance, bitmap indexing

© M. Böhlen, Free University of Bolzano, DWDM08 7
Remember...• At the end of the course (aka exam) you have to
present your knowledge in terms of an example.• The exact plan for a presentation must be
prepared in advance.• Choose the example wisely (talking a lot decreases
your score; get to the key points).• Prepare summaries and presentation plans
throughout the course; at the end there will not be enough time.
• It often happens that people know the material but fail to present it.
• The details are important.
© M. Böhlen, Free University of Bolzano, DWDM08
Data Warehousing
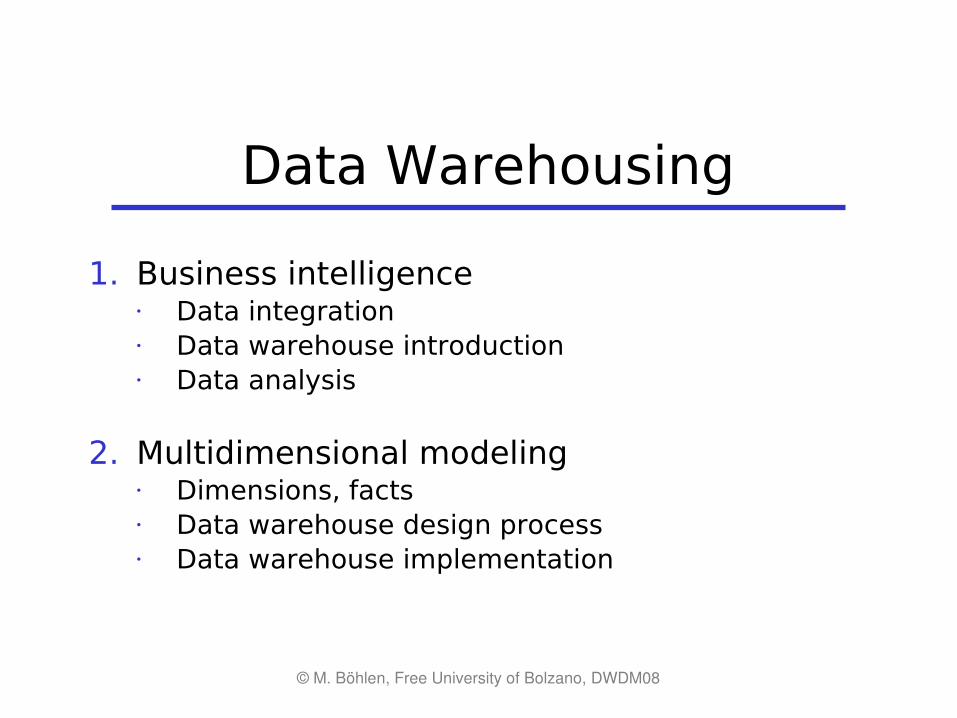
1. Business intelligence• Data integration• Data warehouse introduction• Data analysis
2. Multidimensional modeling• Dimensions, facts• Data warehouse design process• Data warehouse implementation
© M. Böhlen, Free University of Bolzano, DWDM08 9
Goals• Be able to design a data warehouse for a given real
world problem description.• Understand the key issues of multidimensional
models.• Know state of the art solutions for key problems of
multidimensional modeling.
© M. Böhlen, Free University of Bolzano, DWDM08 10
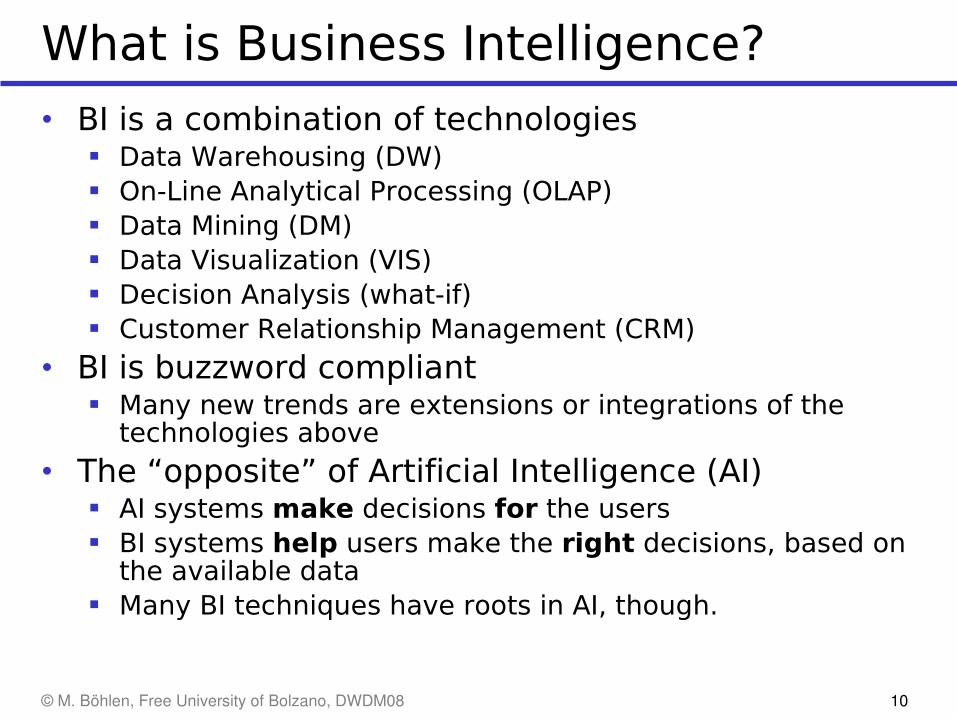
What is Business Intelligence?
• BI is a combination of technologies Data Warehousing (DW) On-Line Analytical Processing (OLAP) Data Mining (DM) Data Visualization (VIS) Decision Analysis (what-if) Customer Relationship Management (CRM)
• BI is buzzword compliant Many new trends are extensions or integrations of the
technologies above
• The “opposite” of Artificial Intelligence (AI) AI systems make decisions for the users BI systems help users make the right decisions, based on
the available data Many BI techniques have roots in AI, though.
© M. Böhlen, Free University of Bolzano, DWDM08 11
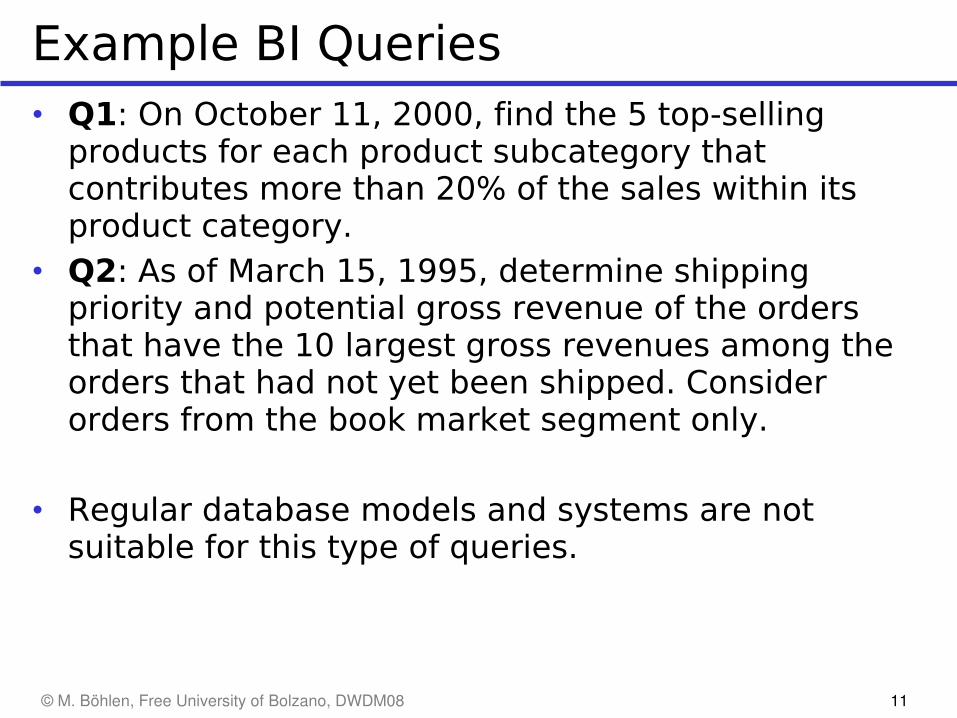
Example BI Queries• Q1: On October 11, 2000, find the 5 top-selling
products for each product subcategory that contributes more than 20% of the sales within its product category.
• Q2: As of March 15, 1995, determine shipping priority and potential gross revenue of the orders that have the 10 largest gross revenues among the orders that had not yet been shipped. Consider orders from the book market segment only.
• Regular database models and systems are not suitable for this type of queries.
© M. Böhlen, Free University of Bolzano, DWDM08 12
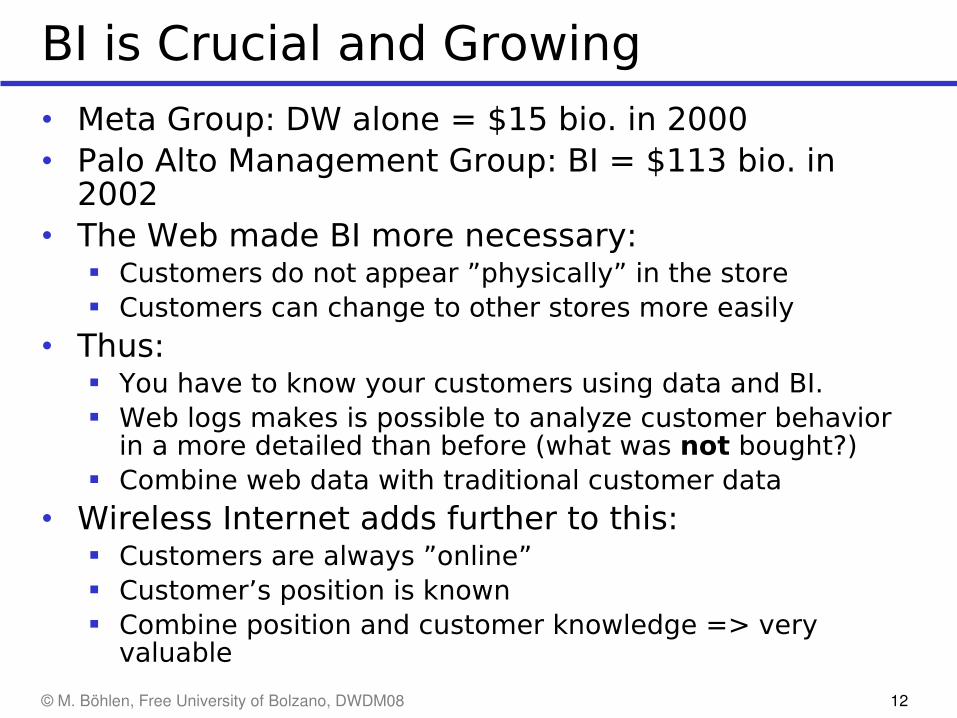
BI is Crucial and Growing
• Meta Group: DW alone = $15 bio. in 2000• Palo Alto Management Group: BI = $113 bio. in
2002• The Web made BI more necessary:
Customers do not appear ”physically” in the store Customers can change to other stores more easily
• Thus: You have to know your customers using data and BI. Web logs makes is possible to analyze customer behavior
in a more detailed than before (what was not bought?) Combine web data with traditional customer data
• Wireless Internet adds further to this: Customers are always ”online” Customer’s position is known Combine position and customer knowledge => very
valuable
© M. Böhlen, Free University of Bolzano, DWDM08 13
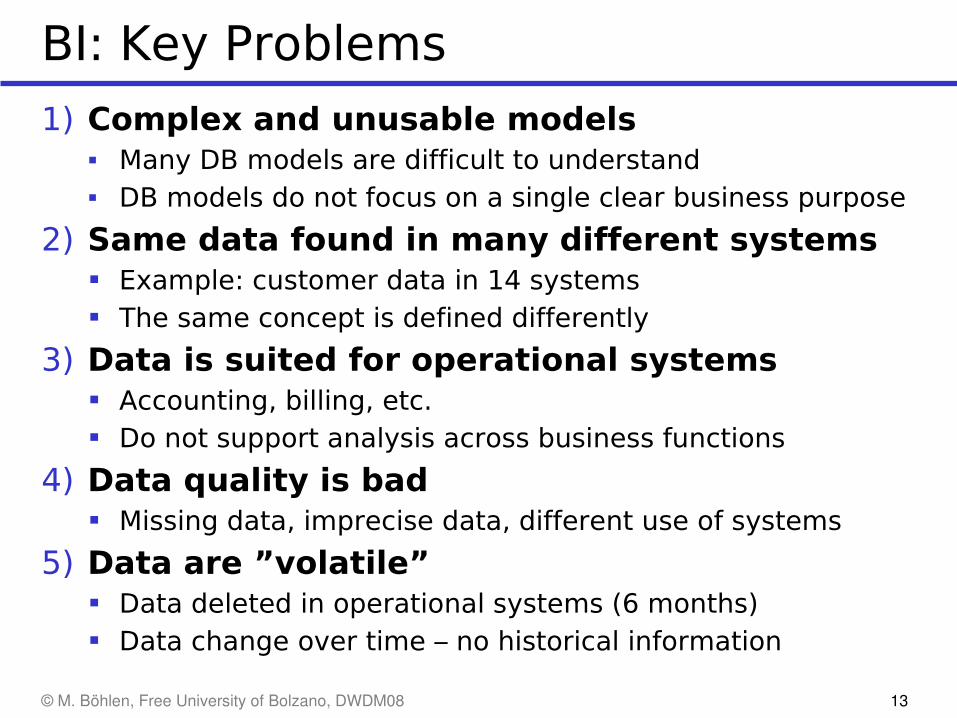
BI: Key Problems
1) Complex and unusable models Many DB models are difficult to understand DB models do not focus on a single clear business purpose
2) Same data found in many different systems Example: customer data in 14 systems The same concept is defined differently
3) Data is suited for operational systems Accounting, billing, etc. Do not support analysis across business functions
4) Data quality is bad Missing data, imprecise data, different use of systems
5) Data are ”volatile” Data deleted in operational systems (6 months) Data change over time – no historical information
© M. Böhlen, Free University of Bolzano, DWDM08 14
BI: Solution
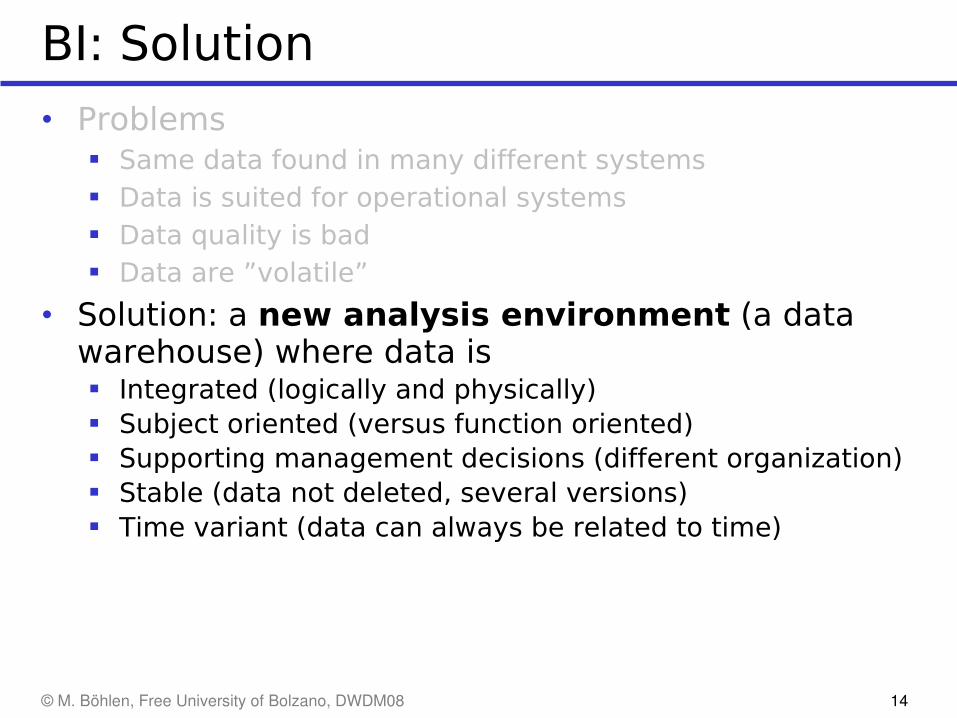
• Problems Same data found in many different systems Data is suited for operational systems Data quality is bad Data are ”volatile”
• Solution: a new analysis environment (a data warehouse) where data is Integrated (logically and physically) Subject oriented (versus function oriented) Supporting management decisions (different organization) Stable (data not deleted, several versions) Time variant (data can always be related to time)
© M. Böhlen, Free University of Bolzano, DWDM08 15
Data Integration
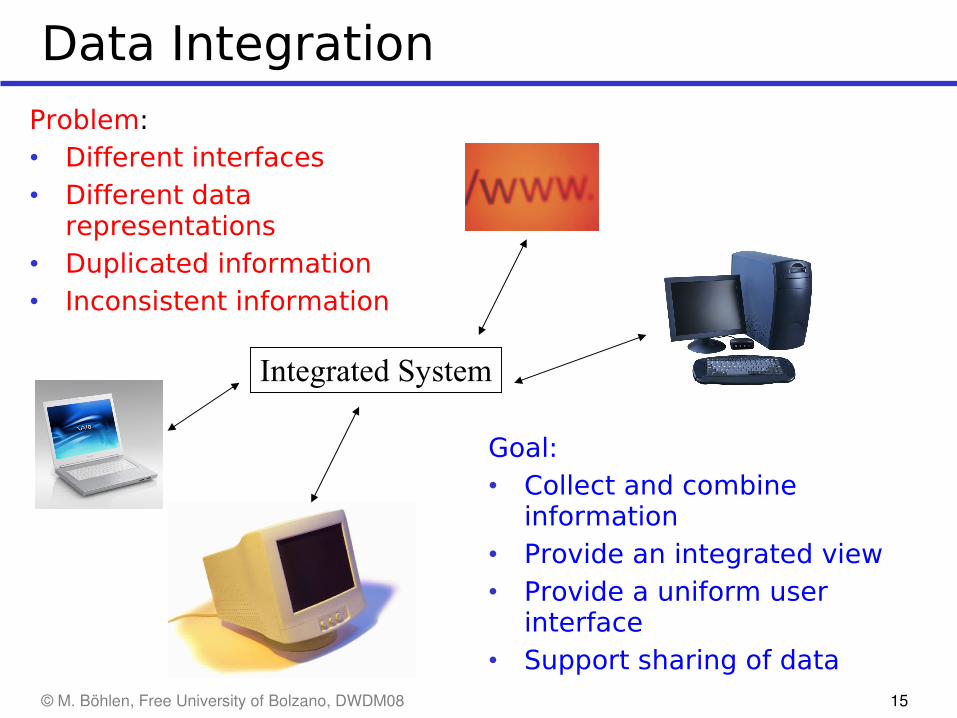
Goal:• Collect and combine
information• Provide an integrated view• Provide a uniform user
interface• Support sharing of data
Integrated System
Problem:• Different interfaces• Different data
representations• Duplicated information• Inconsistent information
© M. Böhlen, Free University of Bolzano, DWDM08 16
Query-Driven Data Integration
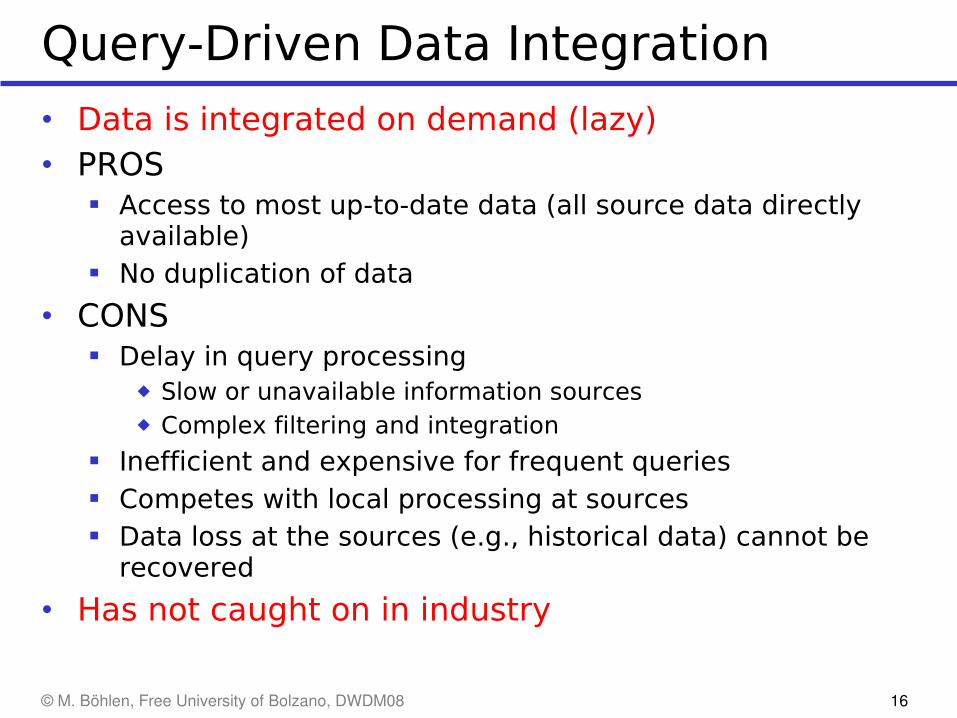
• Data is integrated on demand (lazy)• PROS
Access to most up-to-date data (all source data directly available)
No duplication of data
• CONS Delay in query processing
◆ Slow or unavailable information sources◆ Complex filtering and integration
Inefficient and expensive for frequent queries Competes with local processing at sources Data loss at the sources (e.g., historical data) cannot be
recovered
• Has not caught on in industry
© M. Böhlen, Free University of Bolzano, DWDM08 17
Warehouse-Driven Data Integration
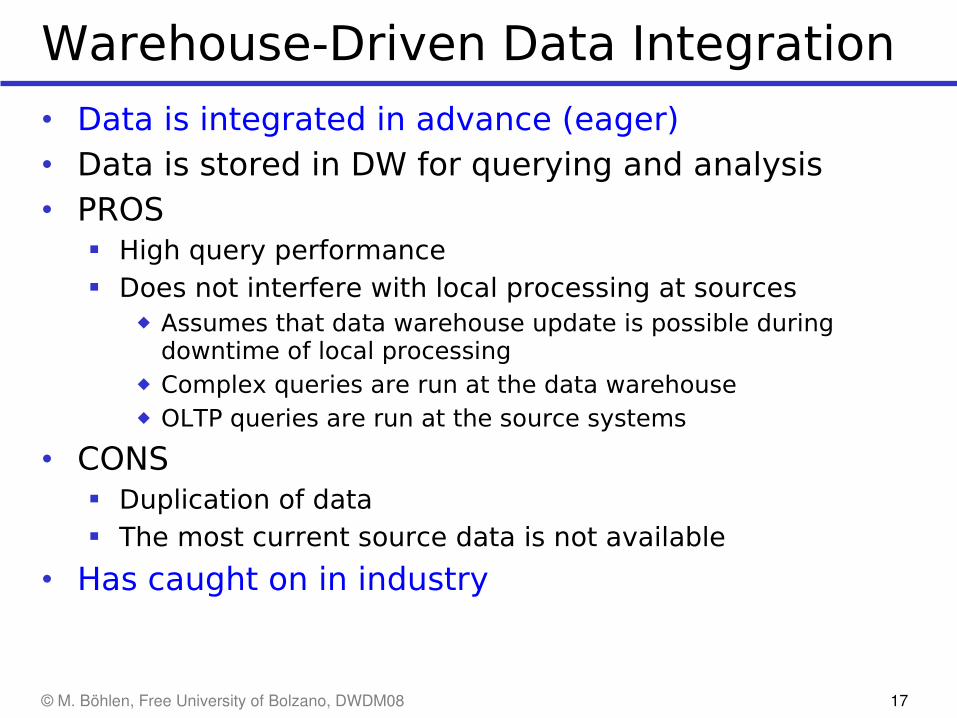
• Data is integrated in advance (eager)• Data is stored in DW for querying and analysis• PROS
High query performance Does not interfere with local processing at sources
◆ Assumes that data warehouse update is possible during downtime of local processing
◆ Complex queries are run at the data warehouse◆ OLTP queries are run at the source systems
• CONS Duplication of data The most current source data is not available
• Has caught on in industry
© M. Böhlen, Free University of Bolzano, DWDM08 18
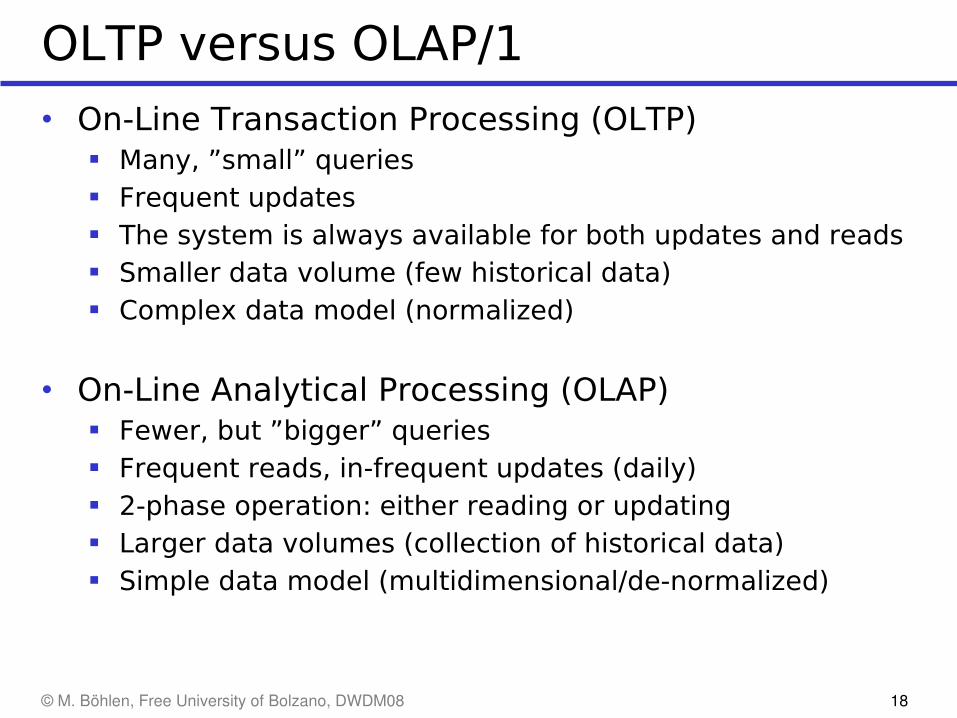
OLTP versus OLAP/1• On-Line Transaction Processing (OLTP)
Many, ”small” queries Frequent updates The system is always available for both updates and reads Smaller data volume (few historical data) Complex data model (normalized)
• On-Line Analytical Processing (OLAP) Fewer, but ”bigger” queries Frequent reads, in-frequent updates (daily) 2-phase operation: either reading or updating Larger data volumes (collection of historical data) Simple data model (multidimensional/de-normalized)
© M. Böhlen, Free University of Bolzano, DWDM08 19
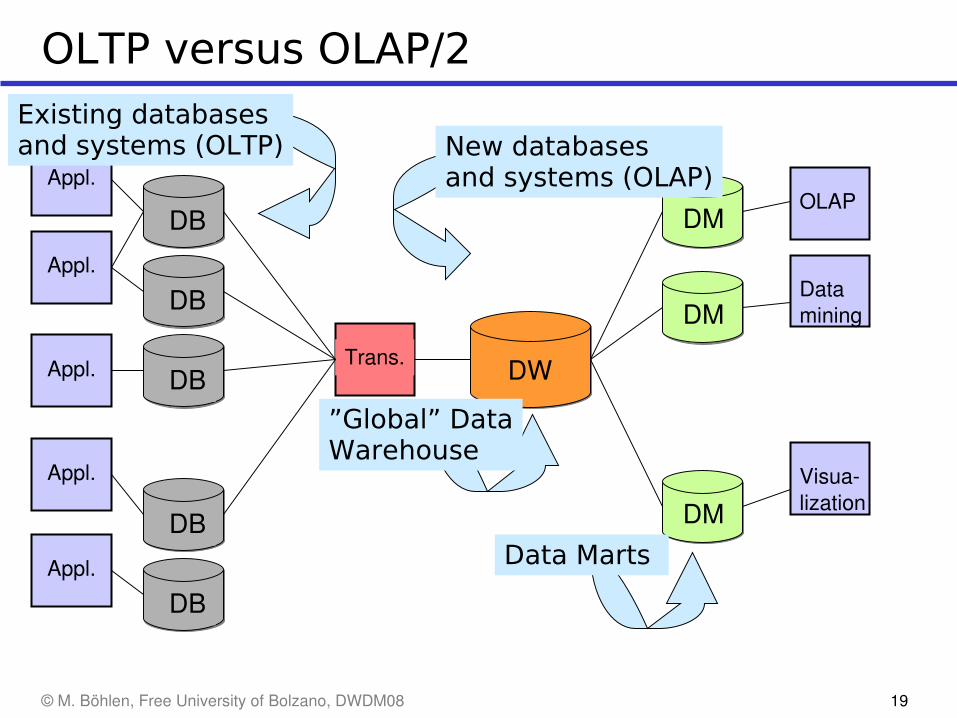
OLTP versus OLAP/2
DB
DB
DB
DB
DB
Appl.
Appl.
Appl.
Trans. DW
DM
DM
DM
OLAP
Visualization
Appl.
Appl.
Data mining
Data Marts
”Global” DataWarehouse
Existing databasesand systems (OLTP) New databases
and systems (OLAP)
© M. Böhlen, Free University of Bolzano, DWDM08 20
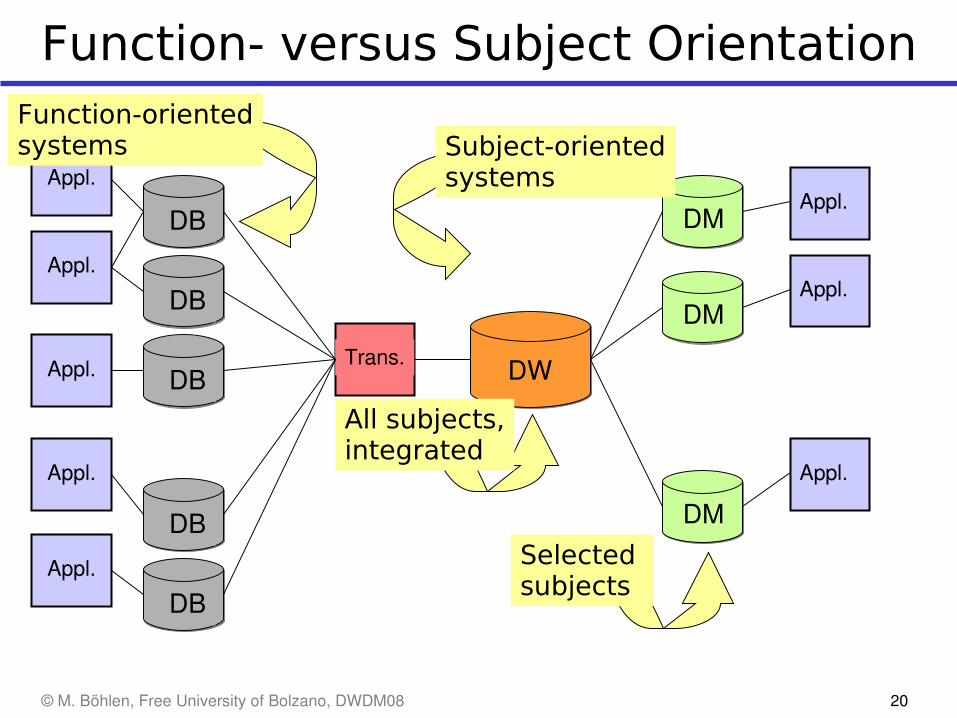
Function- versus Subject Orientation
DB
DB
DB
DB
DB
Appl.
Appl.
Appl.
Trans. DW
DM
DM
DM
Appl.
Appl.
Appl.
Appl.
Appl.
Function-orientedsystems
Selected subjects
All subjects,integrated
Subject-orientedsystems
© M. Böhlen, Free University of Bolzano, DWDM08 21
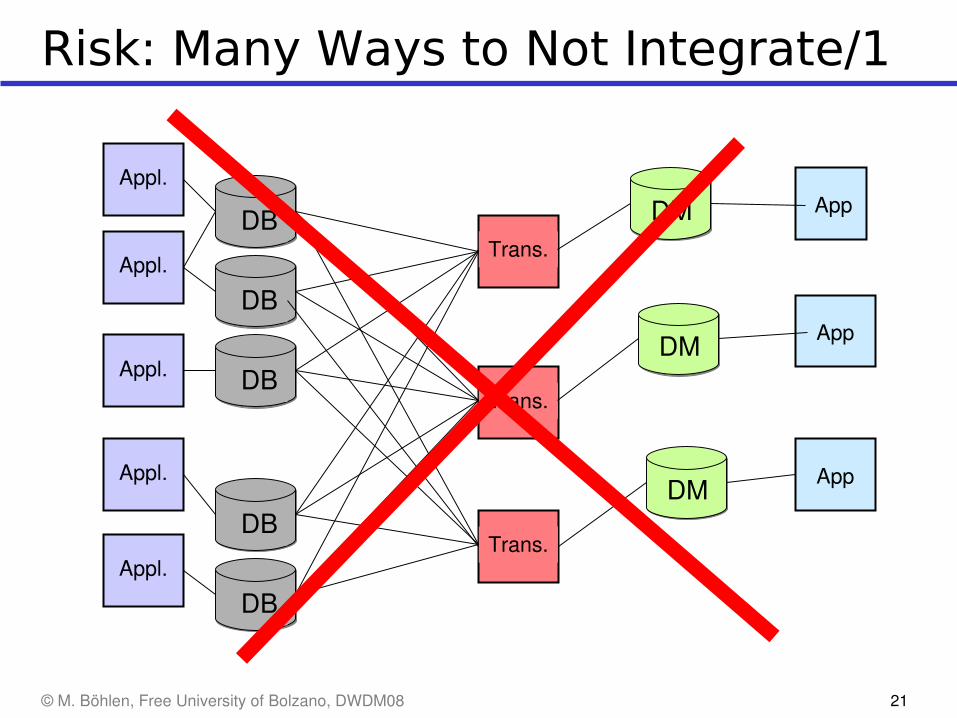
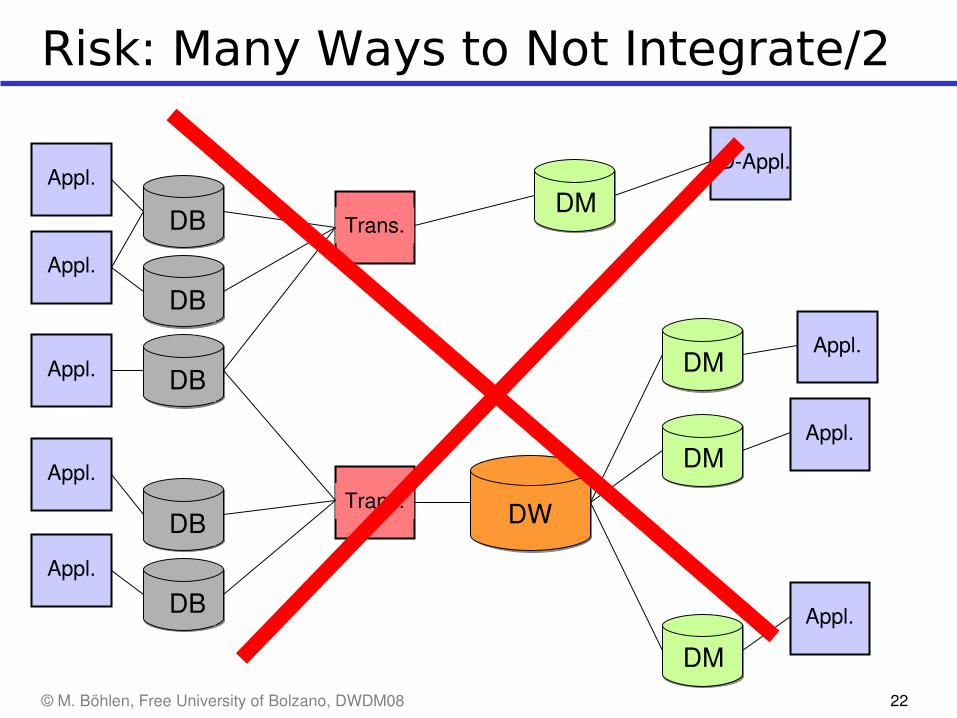
Risk: Many Ways to Not Integrate/1
DB
DB
DB
DB
DB
Appl.
Appl.
Appl.
Trans.
DM
Appl.
Appl.
App
Trans.
App
Trans.
DM
DM App
© M. Böhlen, Free University of Bolzano, DWDM08 22
Risk: Many Ways to Not Integrate/2
DB
DB
DB
DB
DB
Appl.
Appl.
Appl.
Trans.DM
Appl.
Appl.
DAppl.
Trans. DW
DM
DM
DM
Appl.
Appl.
Appl.
© M. Böhlen, Free University of Bolzano, DWDM08 23
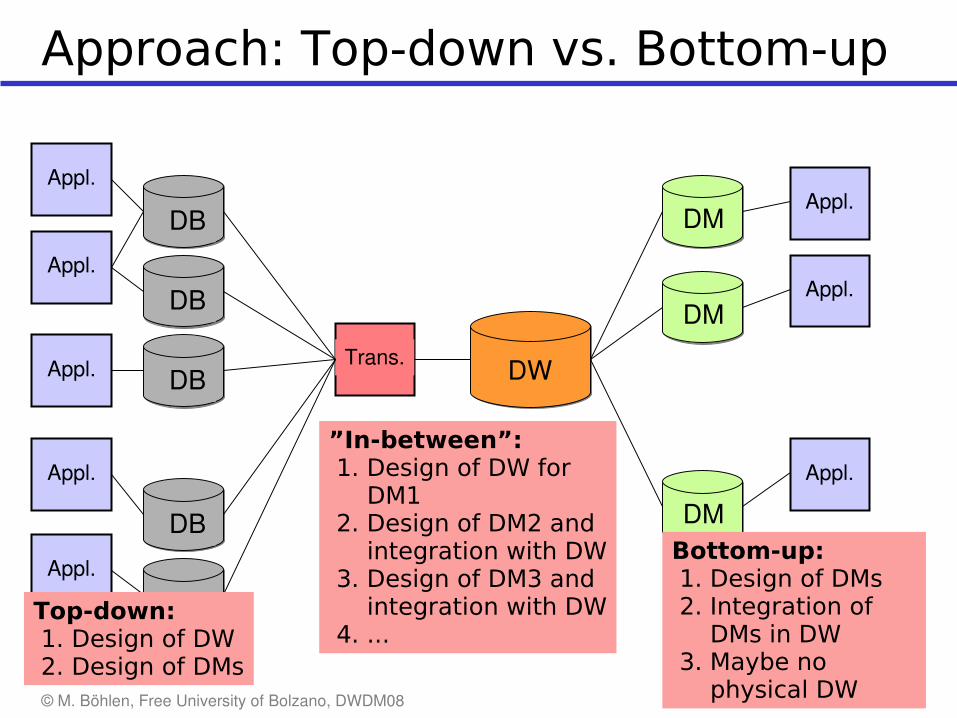
Approach: Top-down vs. Bottom-up
DB
DB
DB
DB
DB
Appl.
Appl.
Appl.
Trans. DW
DM
DM
DM
Appl.
Appl.
Appl.
Appl.
Appl.
Top-down: 1. Design of DW 2. Design of DMs
Bottom-up: 1. Design of DMs 2. Integration of DMs in DW 3. Maybe no physical DW
”In-between”: 1. Design of DW for DM1 2. Design of DM2 and integration with DW 3. Design of DM3 and integration with DW 4. ...
© M. Böhlen, Free University of Bolzano, DWDM08 24
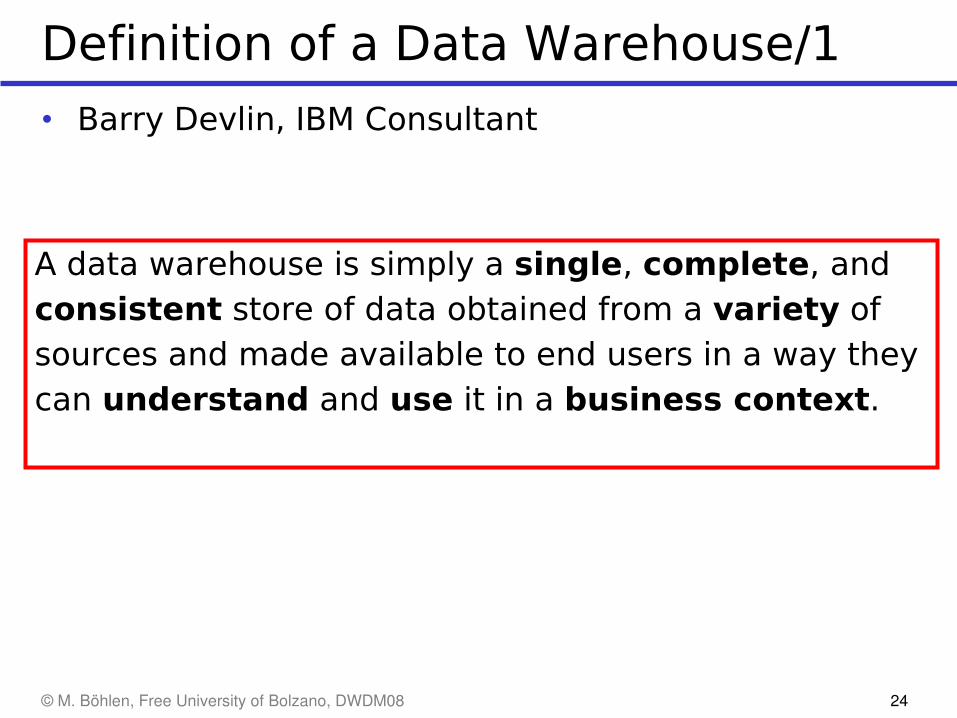
Definition of a Data Warehouse/1
• Barry Devlin, IBM Consultant
A data warehouse is simply a single, complete, and consistent store of data obtained from a variety of sources and made available to end users in a way they can understand and use it in a business context.
© M. Böhlen, Free University of Bolzano, DWDM08 25
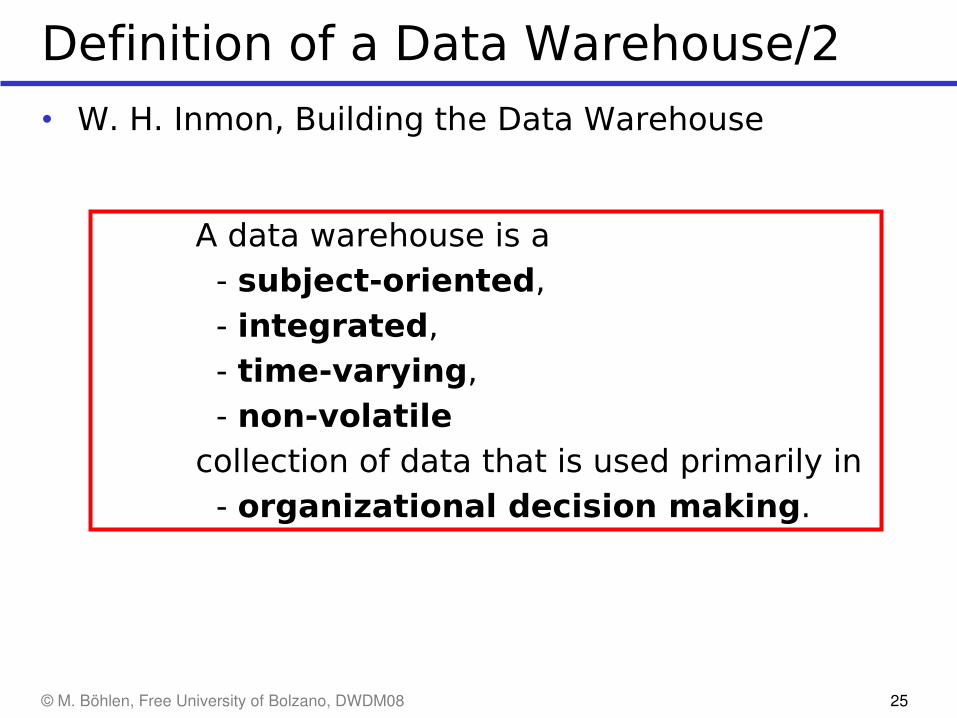
Definition of a Data Warehouse/2
• W. H. Inmon, Building the Data Warehouse
A data warehouse is a - subject-oriented, - integrated, - time-varying, - non-volatile collection of data that is used primarily in - organizational decision making.
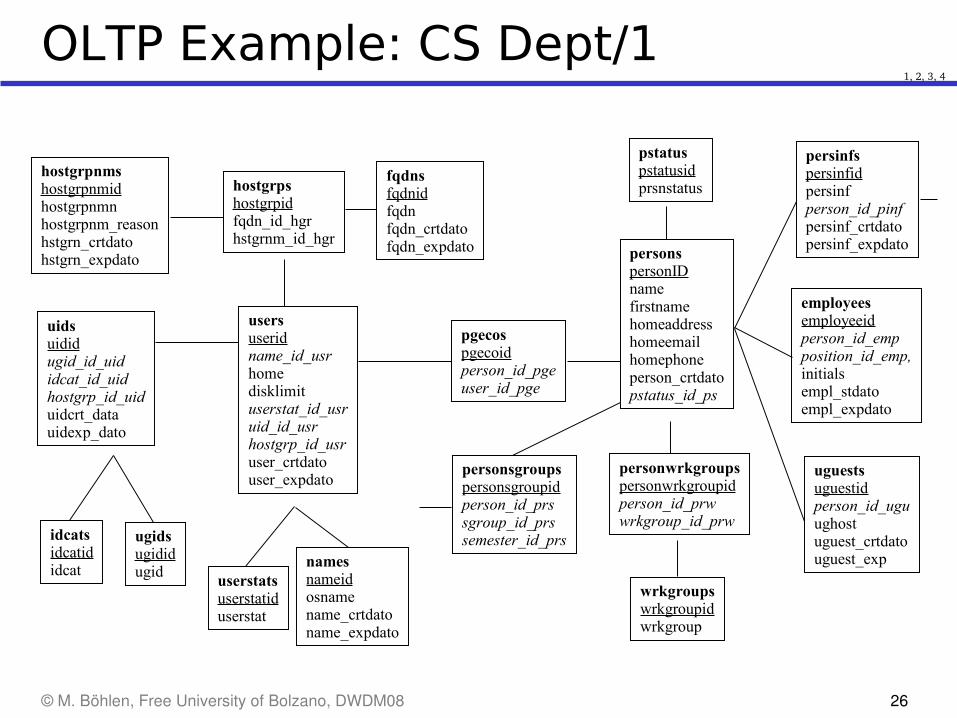
© M. Böhlen, Free University of Bolzano, DWDM08 26
employees employeeidperson_id_empposition_id_emp,initialsempl_stdatoempl_expdato
persinfspersinfidpersinfperson_id_pinfpersinf_crtdatopersinf_expdato
personspersonIDnamefirstnamehomeaddresshomeemailhomephoneperson_crtdatopstatus_id_ps
personsgroupspersonsgroupidperson_id_prssgroup_id_prssemester_id_prs
personwrkgroupspersonwrkgroupidperson_id_prwwrkgroup_id_prw
uguestsuguestidperson_id_uguughostuguest_crtdatouguest_exp
pgecospgecoidperson_id_pgeuser_id_pge
pstatuspstatusidprsnstatus
hostgrpnmshostgrpnmidhostgrpnmnhostgrpnm_reasonhstgrn_crtdatohstgrn_expdato
fqdns fqdnidfqdnfqdn_crtdatofqdn_expdato
hostgrpshostgrpidfqdn_id_hgrhstgrnm_id_hgr
namesnameidosnamename_crtdatoname_expdato
ugidsugididugid
usersuseridname_id_usrhomedisklimituserstat_id_usruid_id_usrhostgrp_id_usruser_crtdatouser_expdato
userstatsuserstatiduserstat
uidsuididugid_id_uididcat_id_uidhostgrp_id_uiduidcrt_datauidexp_dato
idcatsidcatididcat
wrkgroupswrkgroupidwrkgroup
OLTP Example: CS Dept/11, 2, 3, 4
© M. Böhlen, Free University of Bolzano, DWDM08 27
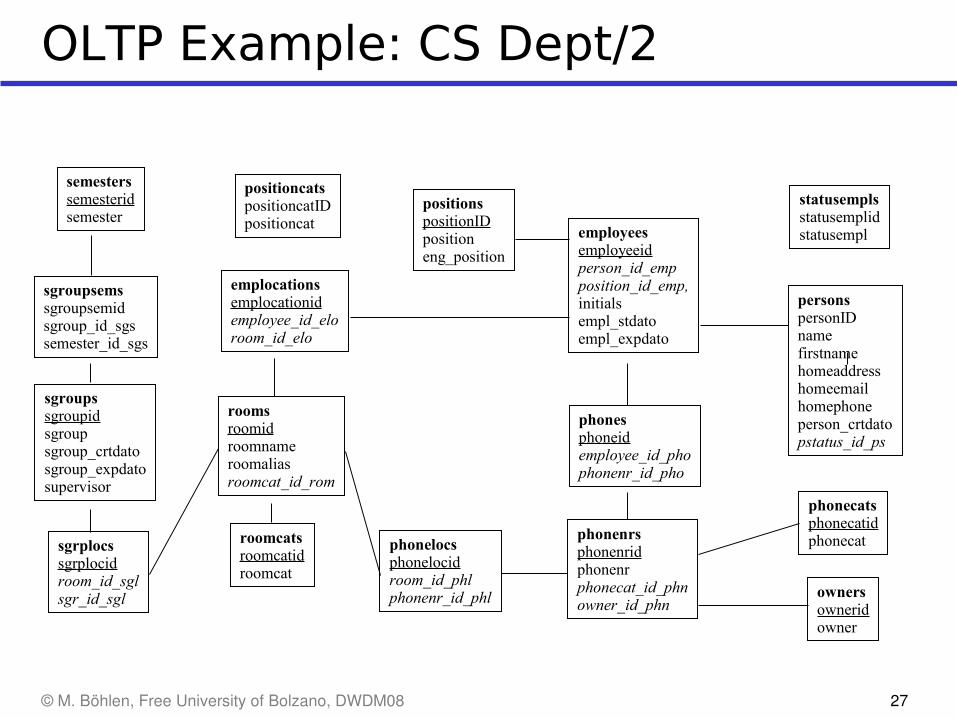
employees employeeidperson_id_empposition_id_emp,initialsempl_stdatoempl_expdato
ownersowneridowner
phonecatsphonecatidphonecatphonelocs
phonelocidroom_id_phlphonenr_id_phl
phonenrsphonenridphonenrphonecat_id_phnowner_id_phn
positionspositionIDpositioneng_position
personspersonIDnamefirstnamehomeaddresshomeemailhomephoneperson_crtdatopstatus_id_ps
phonesphoneidemployee_id_phophonenr_id_pho
roomsroomidroomnameroomaliasroomcat_id_rom
emplocationsemplocationidemployee_id_eloroom_id_elo
sgrplocssgrplocidroom_id_sglsgr_id_sgl
roomcatsroomcatidroomcat
semesterssemesteridsemester
sgroupssgroupidsgroupsgroup_crtdatosgroup_expdatosupervisor
sgroupsemssgroupsemidsgroup_id_sgssemester_id_sgs
statusemplsstatusemplidstatusempl
positioncatspositioncatIDpositioncat
OLTP Example: CS Dept/2
© M. Böhlen, Free University of Bolzano, DWDM08 28
Summary
• Business intelligence is well-recognized and is a combination of a number of techniques.
• Real data analysis problems are good drivers.• The data warehouse (DW) stores the data.• Applications that use the DW
OLAP Data mining Visualization
• BI can provide many advantages to your organization A good DW is a prerequisite for BI But, a DW is a means rather than a goal…it is only a
success if it is heavily used
© M. Böhlen, Free University of Bolzano, DWDM08 29
Multidimensional Modeling
• Motivation• Cubes• Dimensions• Facts• Measures• Data warehouse queries• Relational design• Redundancy• Strengths and weaknesses of the multidimensional
model
© M. Böhlen, Free University of Bolzano, DWDM08 30
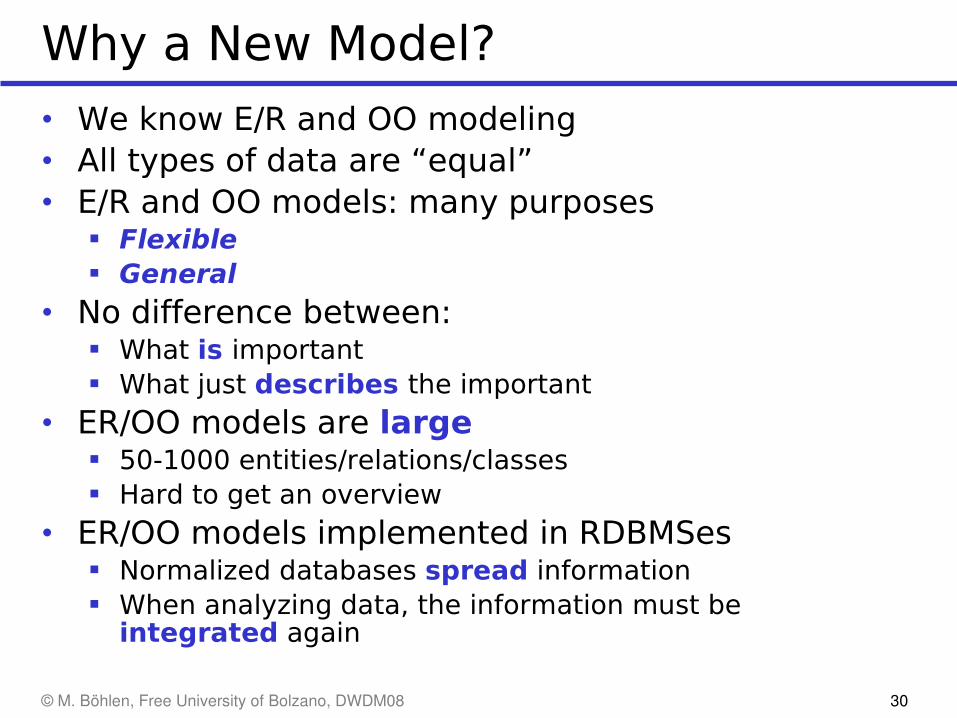
Why a New Model?
• We know E/R and OO modeling• All types of data are “equal”• E/R and OO models: many purposes
Flexible General
• No difference between: What is important What just describes the important
• ER/OO models are large 50-1000 entities/relations/classes Hard to get an overview
• ER/OO models implemented in RDBMSes Normalized databases spread information When analyzing data, the information must be
integrated again
© M. Böhlen, Free University of Bolzano, DWDM08 31
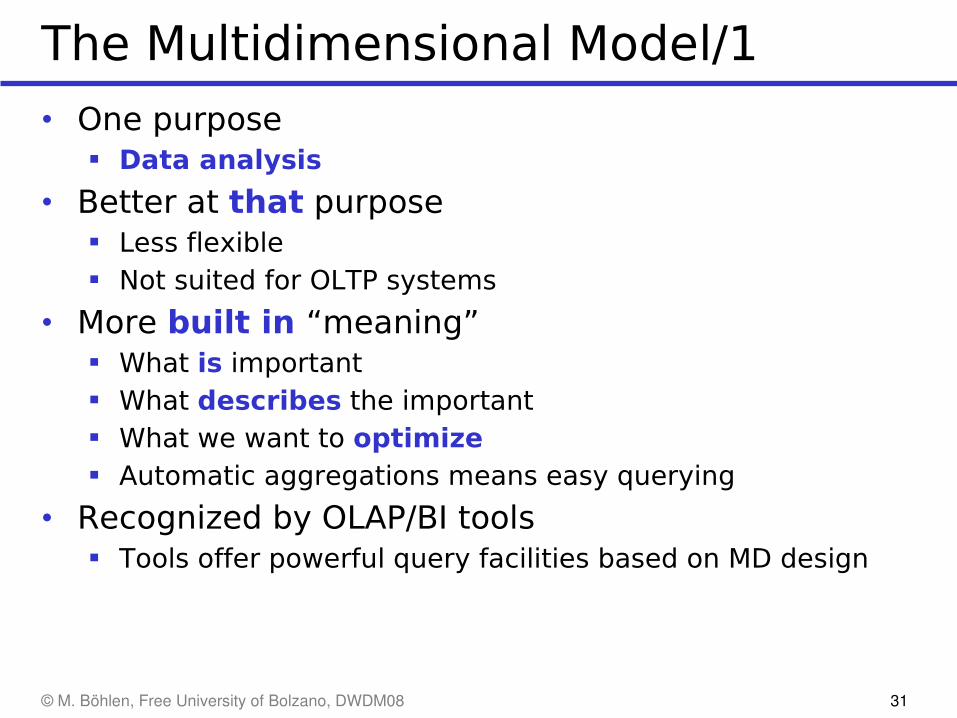
The Multidimensional Model/1
• One purpose Data analysis
• Better at that purpose Less flexible Not suited for OLTP systems
• More built in “meaning” What is important What describes the important What we want to optimize Automatic aggregations means easy querying
• Recognized by OLAP/BI tools Tools offer powerful query facilities based on MD design
© M. Böhlen, Free University of Bolzano, DWDM08 32
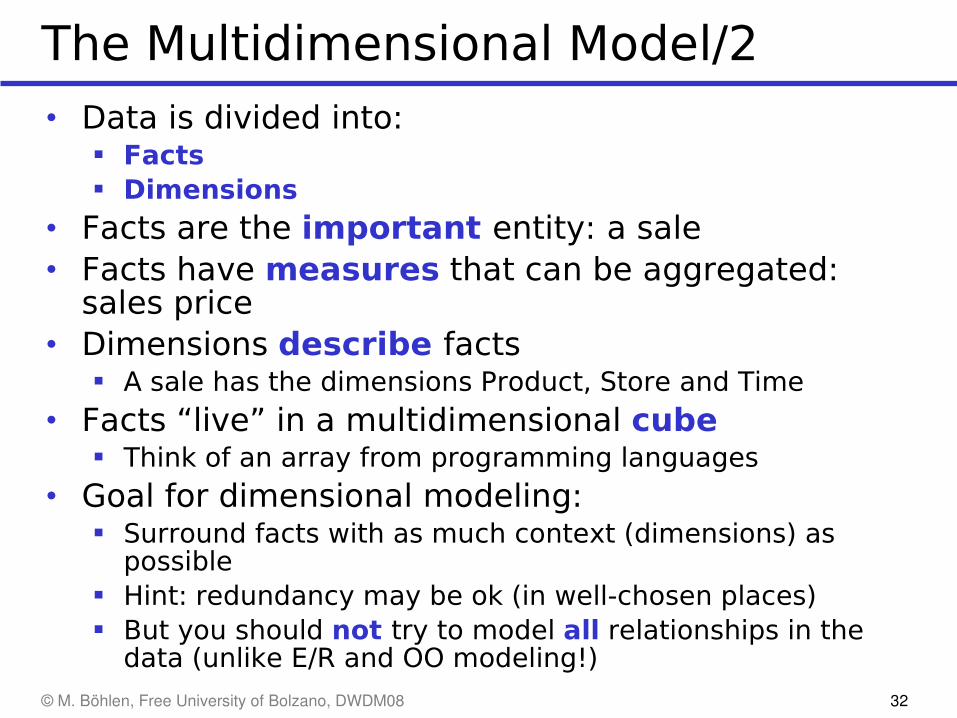
The Multidimensional Model/2• Data is divided into:
Facts Dimensions
• Facts are the important entity: a sale• Facts have measures that can be aggregated:
sales price• Dimensions describe facts
A sale has the dimensions Product, Store and Time
• Facts “live” in a multidimensional cube Think of an array from programming languages
• Goal for dimensional modeling: Surround facts with as much context (dimensions) as
possible Hint: redundancy may be ok (in well-chosen places) But you should not try to model all relationships in the
data (unlike E/R and OO modeling!)
© M. Böhlen, Free University of Bolzano, DWDM08 33
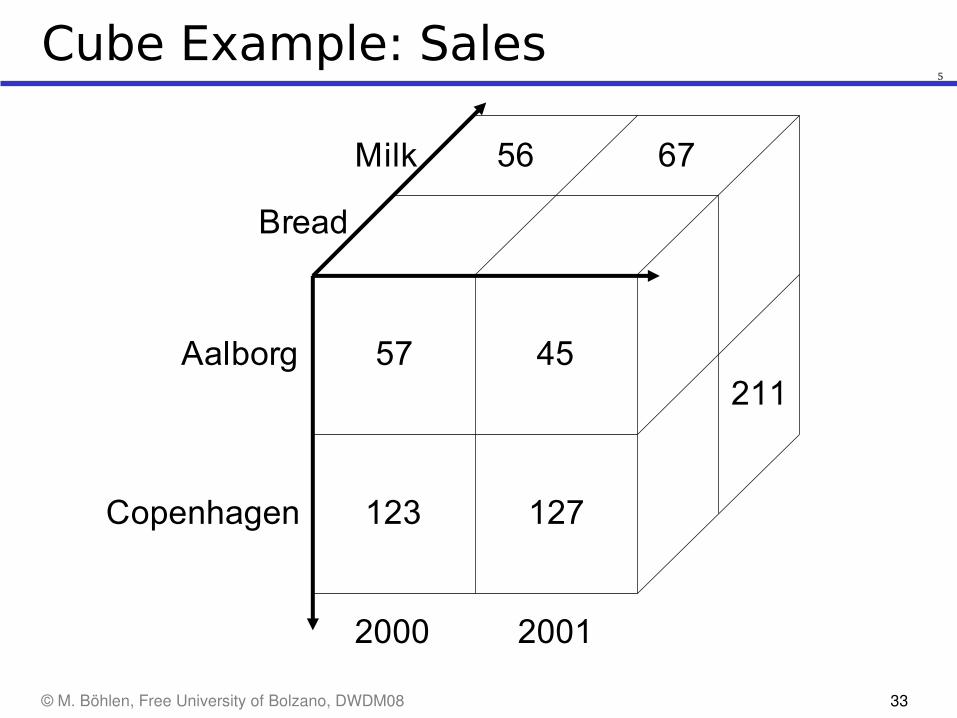
Cube Example: Sales
2000 2001
Aalborg
Copenhagen
Milk
Bread
123 127
57 45
56 67
211
5
© M. Böhlen, Free University of Bolzano, DWDM08 34
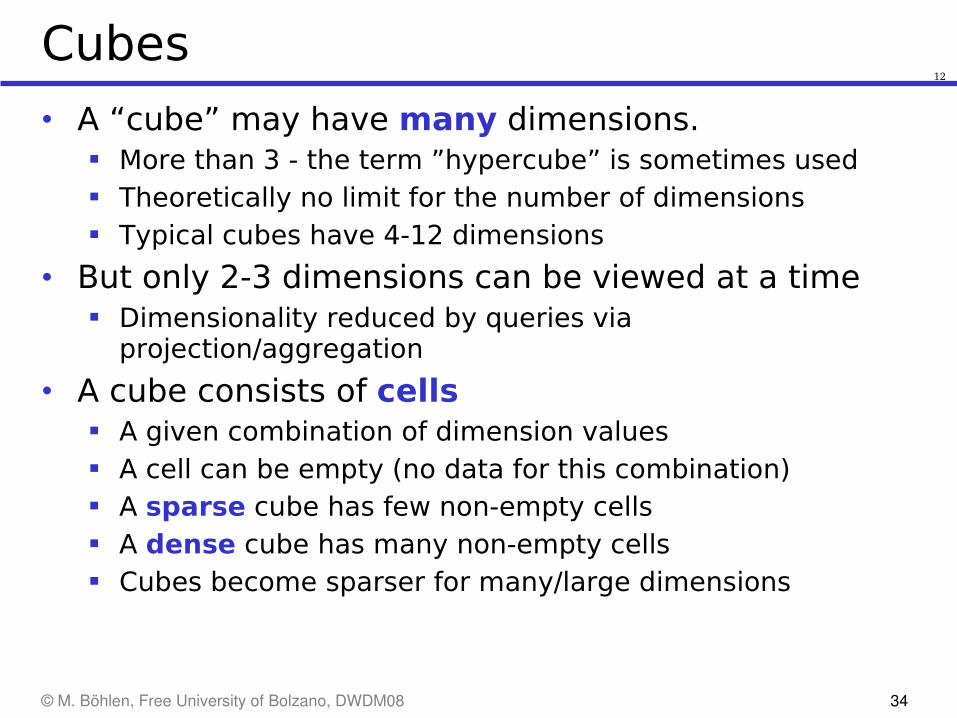
Cubes
• A “cube” may have many dimensions. More than 3 - the term ”hypercube” is sometimes used Theoretically no limit for the number of dimensions Typical cubes have 4-12 dimensions
• But only 2-3 dimensions can be viewed at a time Dimensionality reduced by queries via
projection/aggregation
• A cube consists of cells A given combination of dimension values A cell can be empty (no data for this combination) A sparse cube has few non-empty cells A dense cube has many non-empty cells Cubes become sparser for many/large dimensions
12
© M. Böhlen, Free University of Bolzano, DWDM08 35
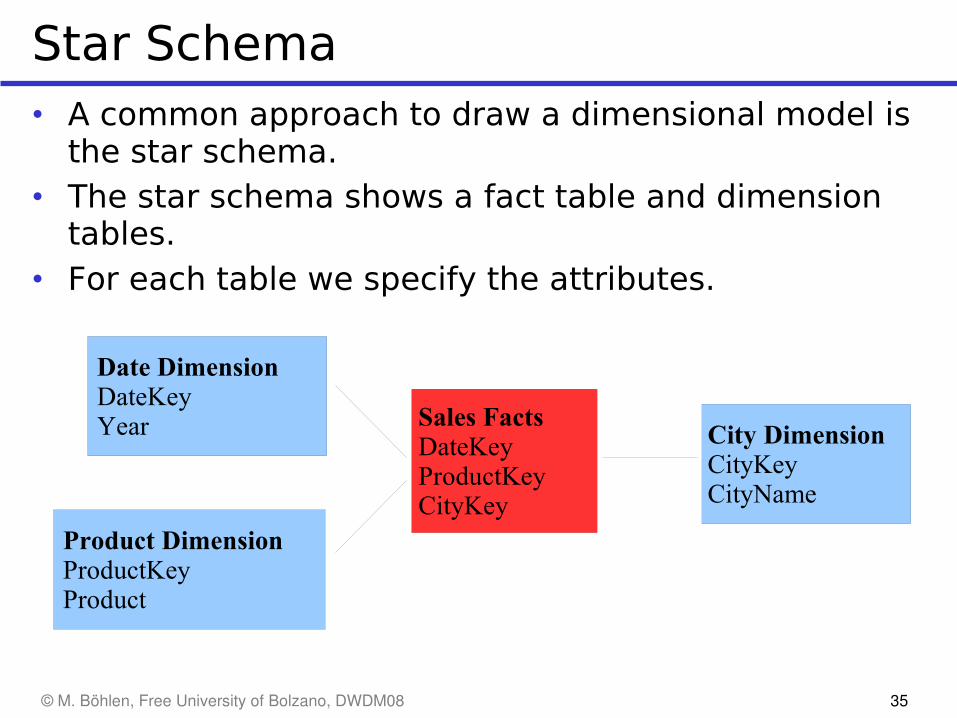
Star Schema• A common approach to draw a dimensional model is
the star schema.• The star schema shows a fact table and dimension
tables.• For each table we specify the attributes.
Date DimensionDateKeyYear Sales Facts
DateKeyProductKeyCityKey
Product DimensionProductKeyProduct
City Dimension CityKeyCityName
© M. Böhlen, Free University of Bolzano, DWDM08 36
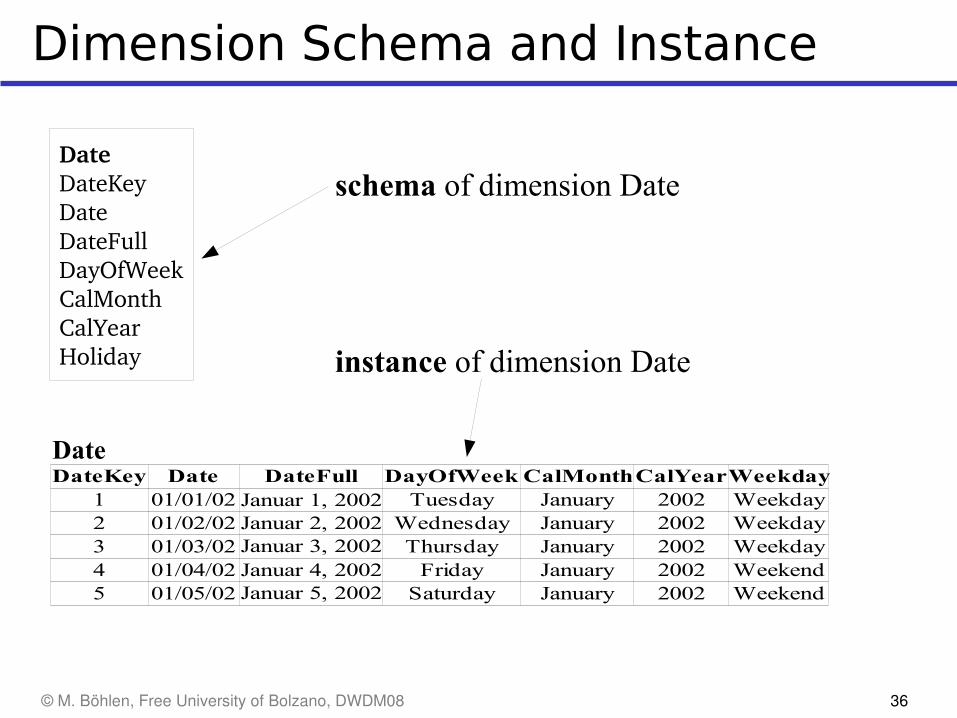
Dimension Schema and Instance
Date Weekday1 01/01/02 Tuesday January 2002 Weekday2 01/02/02 Wednesday January 2002 Weekday3 01/03/02 Thursday January 2002 Weekday4 01/04/02 Friday January 2002 Weekend5 01/05/02 Saturday January 2002 Weekend
DateKey DateFull DayOfWeek CalMonthCalYearJanuar 1, 2002Januar 2, 2002Januar 3, 2002Januar 4, 2002Januar 5, 2002
DateDateKeyDateDateFullDayOfWeekCalMonthCalYearHoliday
schema of dimension Date
instance of dimension Date
Date
© M. Böhlen, Free University of Bolzano, DWDM08 37
Dimensions/1
• Dimensions are the core of multidimensional databases Other types of databases do not support dimensions
• Dimensions are used for Selection of data Grouping of data at the right level of detail
• Dimensions consist of dimension values Product dimension has values ”milk”, ”cream”, … Time dimension has values ”1/1/2001”, ”2/1/2001”,…
• Dimension values may have an ordering Used for comparing cube data across values Example: ”percent sales increase compared with last
month” Especially used for Time dimension
© M. Böhlen, Free University of Bolzano, DWDM08 38
Dimensions/2
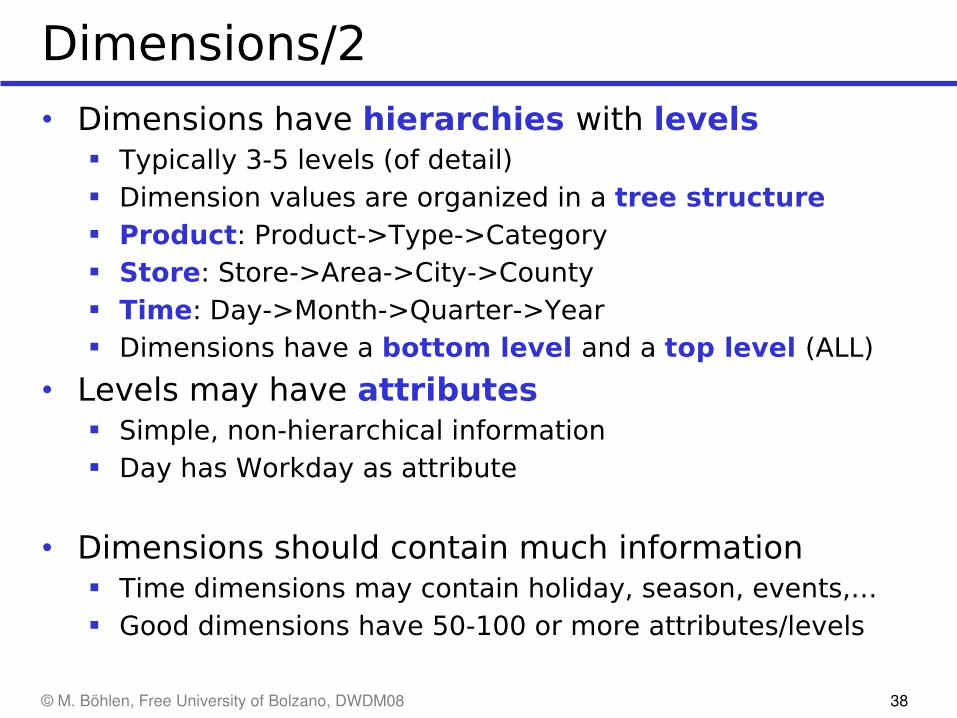
• Dimensions have hierarchies with levels Typically 3-5 levels (of detail) Dimension values are organized in a tree structure Product: Product->Type->Category Store: Store->Area->City->County Time: Day->Month->Quarter->Year Dimensions have a bottom level and a top level (ALL)
• Levels may have attributes Simple, non-hierarchical information Day has Workday as attribute
• Dimensions should contain much information Time dimensions may contain holiday, season, events,… Good dimensions have 50-100 or more attributes/levels
© M. Böhlen, Free University of Bolzano, DWDM08 39
Facts
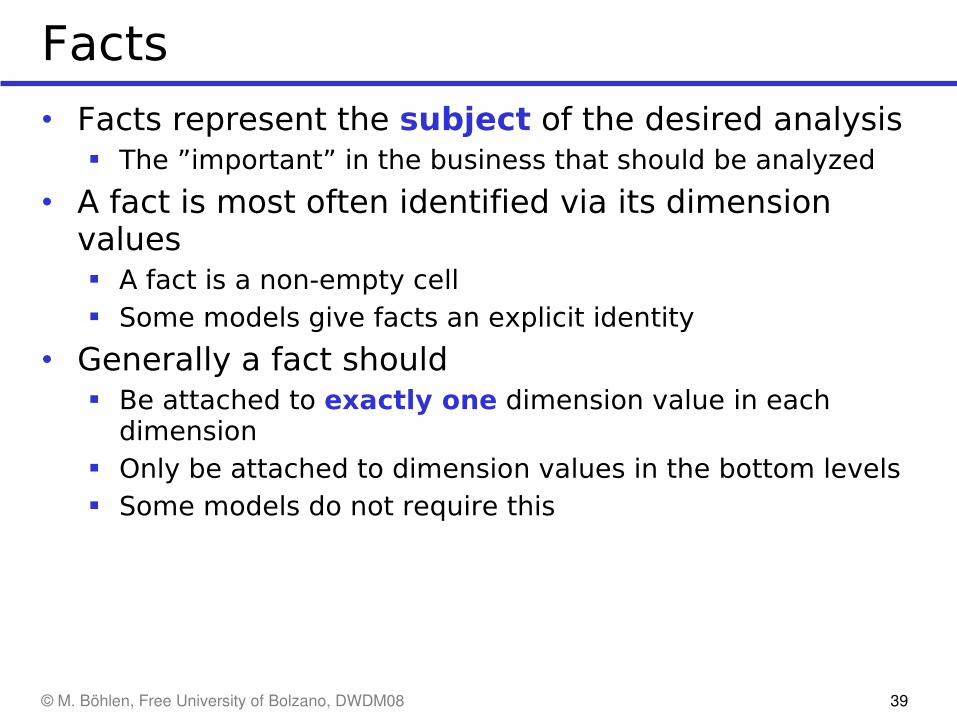
• Facts represent the subject of the desired analysis The ”important” in the business that should be analyzed
• A fact is most often identified via its dimension values A fact is a non-empty cell Some models give facts an explicit identity
• Generally a fact should Be attached to exactly one dimension value in each
dimension Only be attached to dimension values in the bottom levels Some models do not require this
© M. Böhlen, Free University of Bolzano, DWDM08 40
Granularity
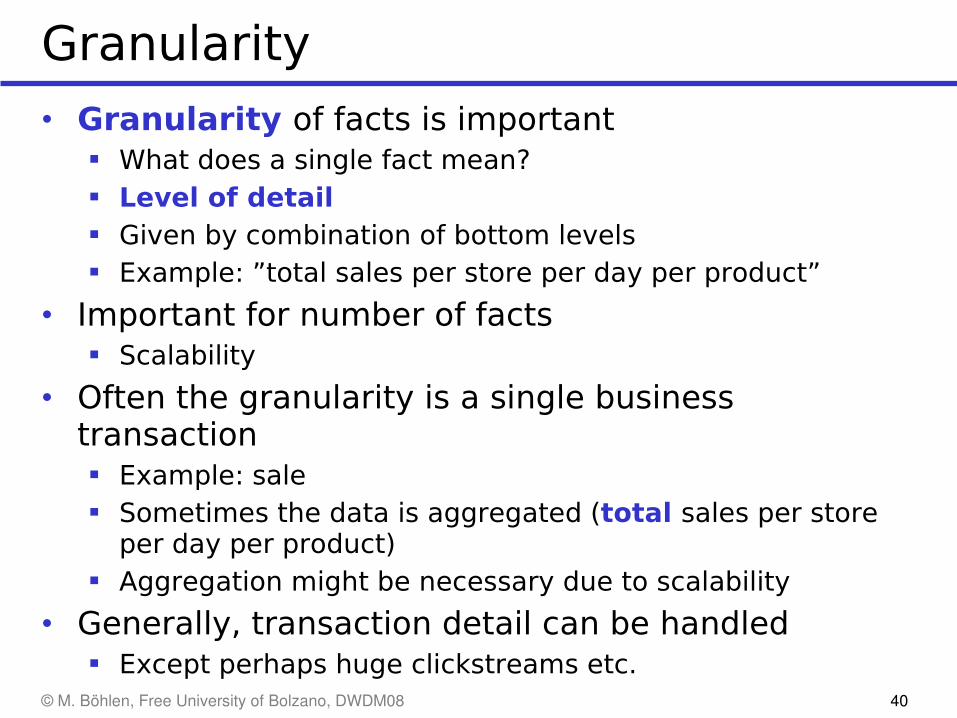
• Granularity of facts is important What does a single fact mean? Level of detail Given by combination of bottom levels Example: ”total sales per store per day per product”
• Important for number of facts Scalability
• Often the granularity is a single business transaction Example: sale Sometimes the data is aggregated (total sales per store
per day per product) Aggregation might be necessary due to scalability
• Generally, transaction detail can be handled Except perhaps huge clickstreams etc.
© M. Böhlen, Free University of Bolzano, DWDM08 41
Measures
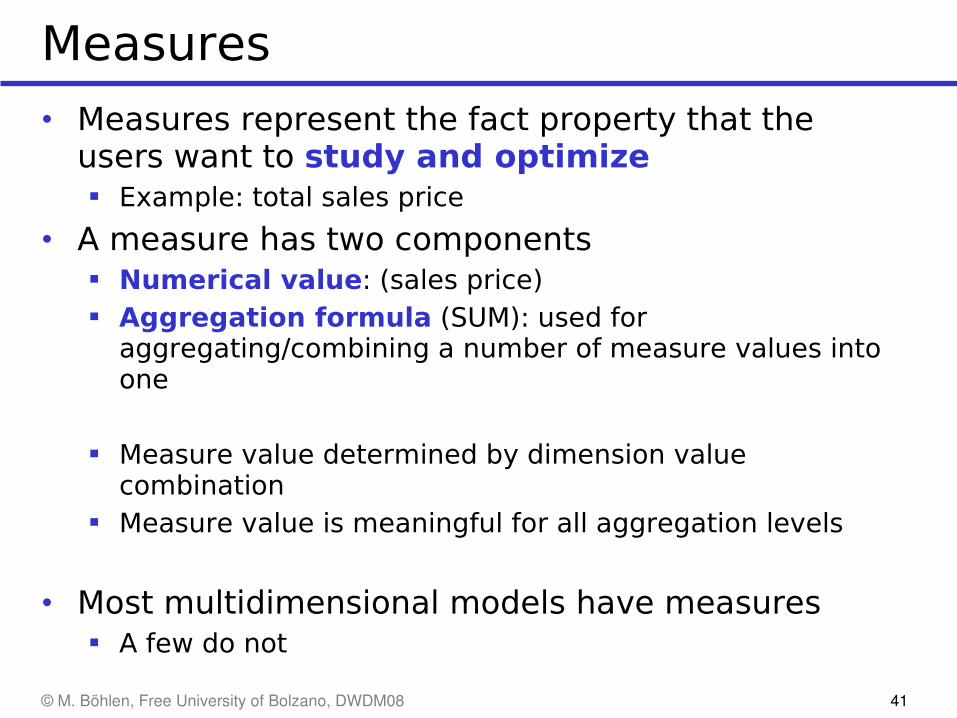
• Measures represent the fact property that the users want to study and optimize Example: total sales price
• A measure has two components Numerical value: (sales price) Aggregation formula (SUM): used for
aggregating/combining a number of measure values into one
Measure value determined by dimension value combination
Measure value is meaningful for all aggregation levels
• Most multidimensional models have measures A few do not
© M. Böhlen, Free University of Bolzano, DWDM08 42
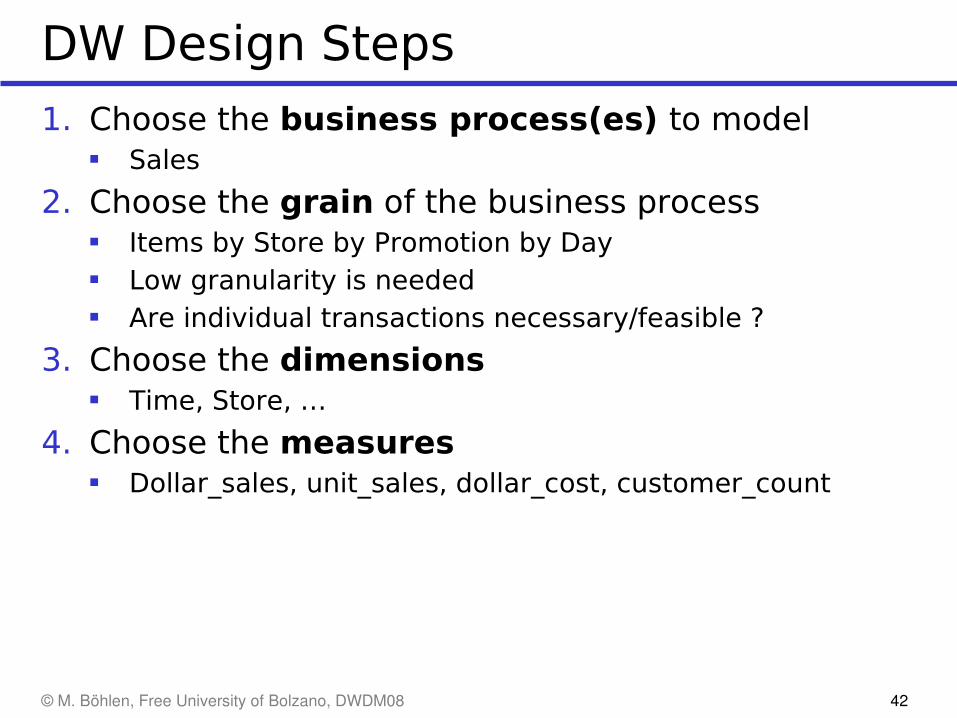
DW Design Steps
1. Choose the business process(es) to model Sales
2. Choose the grain of the business process Items by Store by Promotion by Day Low granularity is needed Are individual transactions necessary/feasible ?
3. Choose the dimensions Time, Store, …
4. Choose the measures Dollar_sales, unit_sales, dollar_cost, customer_count
© M. Böhlen, Free University of Bolzano, DWDM08 43
The Grocery Store Example/1
• A grocery chain. 500 stores spread over a five-state area. Each of the stores is a typical modern supermarket with a full complement of departments including grocery, frozen foods, dairy, meat, bakery, hard goods, liquor, and drugs. Each store has roughly 60’000 individual products on its shelves.
• The individual products are called stock keeping units (SKUs). About 40’000 of the SKU come from outside manufacturers and have bar codes imprinted on the product package. These bar codes are called universal product codes (UPCs). UPCs are at the same grain as individual SKUs. Each different package variation of a product has a separate UPC and hence is a separate SKU.
© M. Böhlen, Free University of Bolzano, DWDM08 44
The Grocery Store Example/2
• The remaining 20’000 SKUs come from departments like meat or bakery departments and do not have nationally recognized UPC codes. The grocery store assigns SKU numbers to these products by sticking scanner labels on the items. Although the bar codes are not UPCs they are certainly SKU numbers.
• Data is collected at several places in a grocery store. Some of the most useful data is collected at the cash registers as customers purchase products. Our modern grocery store scans the bar codes directly into the point-of-sale (POS) system. The POS system is at the front door of the grocery store where customer takeaway is measured. The back door, where vendors make deliveries, is another interesting data-collection point.
6
© M. Böhlen, Free University of Bolzano, DWDM08 45
The Grocery Store Example/3
• At the grocery store, management is concerned with the logistics of ordering, stocking the shelves, and selling the products while maximizing the profit at each store. The profit ultimately comes from charging as much as possible for each product, lowering costs for product acquisition and overhead, and at the same time attracting as many customers as possible.
• The most significant decisions have to do with pricing and promotions. Both store management and headquarters marketing spend a great deal of time tinkering with pricing and running promotions. Promotions in a grocery store include temporary price reductions, ads in newspapers and newspaper inserts, displays in the grocery store, and coupons.
7, 8
© M. Böhlen, Free University of Bolzano, DWDM08 46
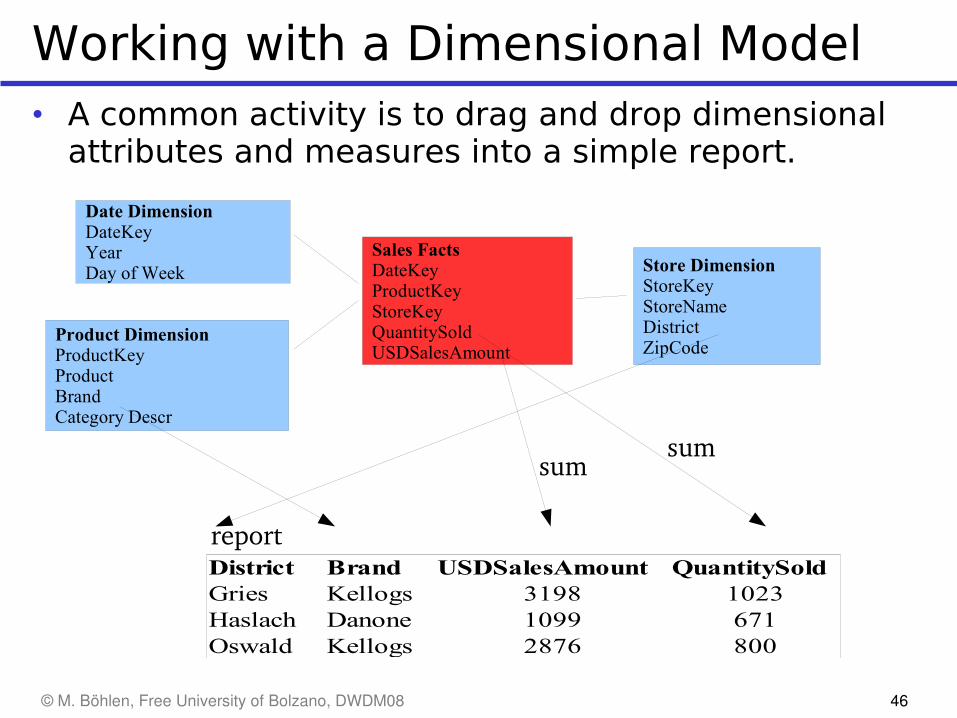
Working with a Dimensional Model• A common activity is to drag and drop dimensional
attributes and measures into a simple report.
Date DimensionDateKeyYearDay of Week
Sales Facts DateKeyProductKeyStoreKeyQuantitySoldUSDSalesAmount
Product DimensionProductKeyProductBrandCategory Descr
Store Dimension StoreKeyStoreNameDistrictZipCode
District Brand USDSalesAmount QuantitySoldGries Kellogs 3198 1023Haslach Danone 1099 671Oswald Kellogs 2876 800
report
sumsum
© M. Böhlen, Free University of Bolzano, DWDM08 47
The Grocery Store
• Stock Keeping Units (SKUs)• Universal Product Codes (UPCs)• Point Of Sale (POS) system• Stores• Promotions
• Grain: sales of SKUs
9
© M. Böhlen, Free University of Bolzano, DWDM08 48
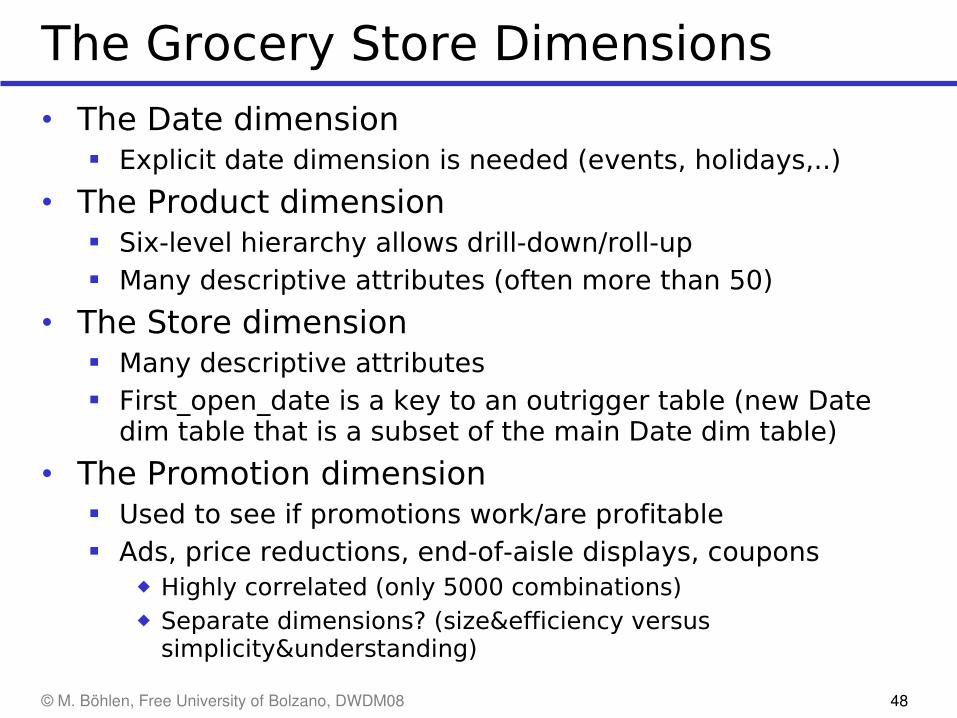
The Grocery Store Dimensions
• The Date dimension Explicit date dimension is needed (events, holidays,..)
• The Product dimension Six-level hierarchy allows drill-down/roll-up Many descriptive attributes (often more than 50)
• The Store dimension Many descriptive attributes First_open_date is a key to an outrigger table (new Date
dim table that is a subset of the main Date dim table)
• The Promotion dimension Used to see if promotions work/are profitable Ads, price reductions, end-of-aisle displays, coupons
◆ Highly correlated (only 5000 combinations)◆ Separate dimensions? (size&efficiency versus
simplicity&understanding)
© M. Böhlen, Free University of Bolzano, DWDM08 49
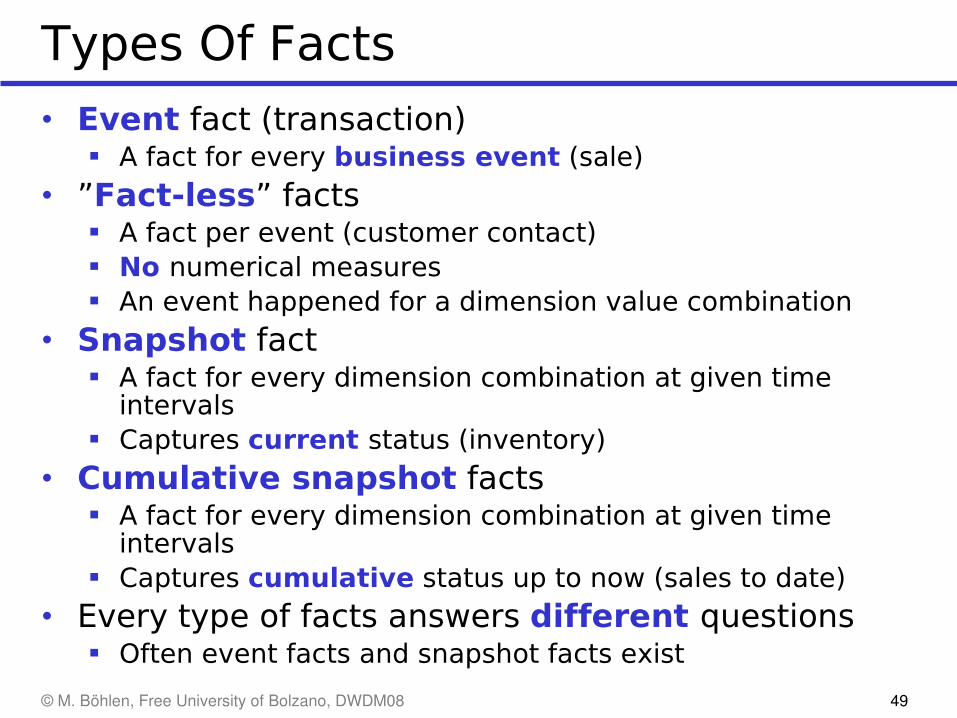
Types Of Facts
• Event fact (transaction) A fact for every business event (sale)
• ”Fact-less” facts A fact per event (customer contact) No numerical measures An event happened for a dimension value combination
• Snapshot fact A fact for every dimension combination at given time
intervals Captures current status (inventory)
• Cumulative snapshot facts A fact for every dimension combination at given time
intervals Captures cumulative status up to now (sales to date)
• Every type of facts answers different questions Often event facts and snapshot facts exist
© M. Böhlen, Free University of Bolzano, DWDM08 50
Types Of Measures
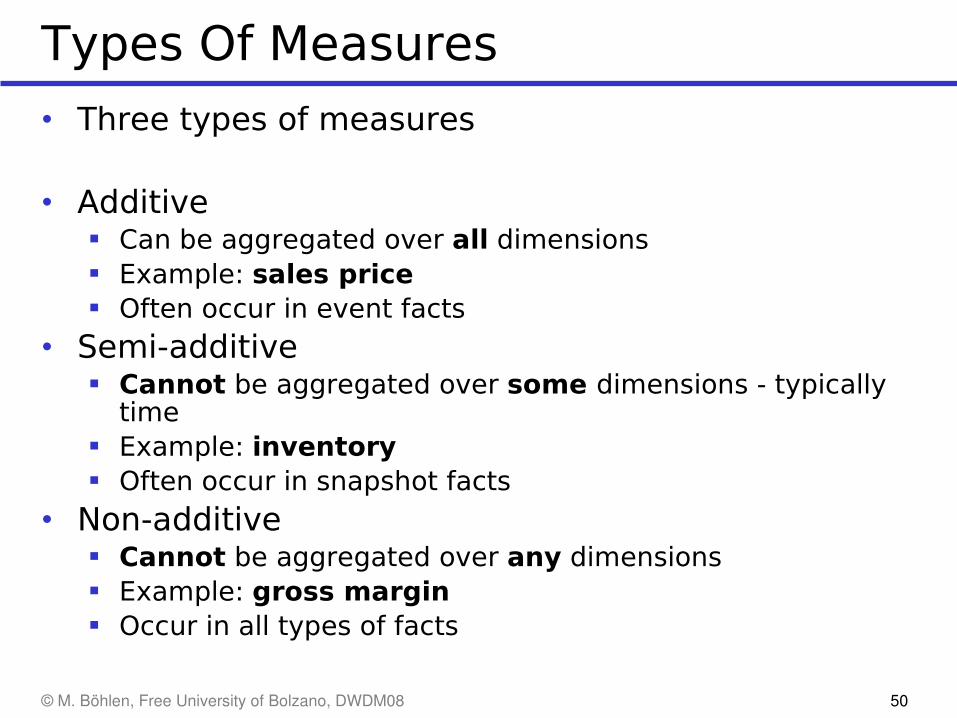
• Three types of measures
• Additive Can be aggregated over all dimensions Example: sales price Often occur in event facts
• Semi-additive Cannot be aggregated over some dimensions - typically
time Example: inventory Often occur in snapshot facts
• Non-additive Cannot be aggregated over any dimensions Example: gross margin Occur in all types of facts
© M. Böhlen, Free University of Bolzano, DWDM08 51
The Grocery Store Measures
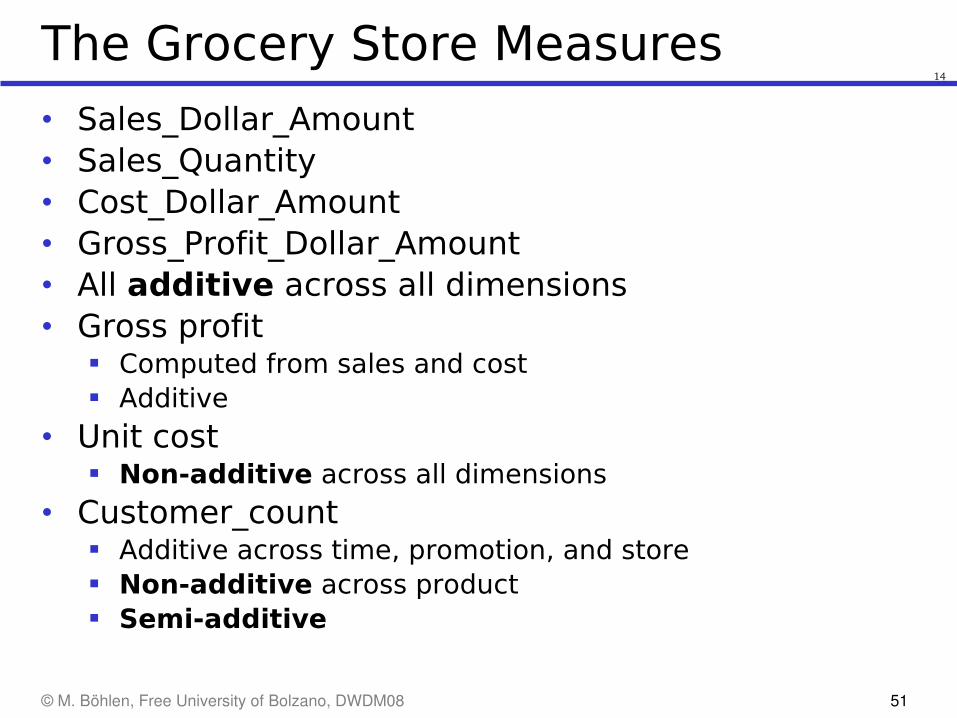
• Sales_Dollar_Amount• Sales_Quantity• Cost_Dollar_Amount• Gross_Profit_Dollar_Amount• All additive across all dimensions• Gross profit
Computed from sales and cost Additive
• Unit cost Non-additive across all dimensions
• Customer_count Additive across time, promotion, and store Non-additive across product Semi-additive
14
© M. Böhlen, Free University of Bolzano, DWDM08 52
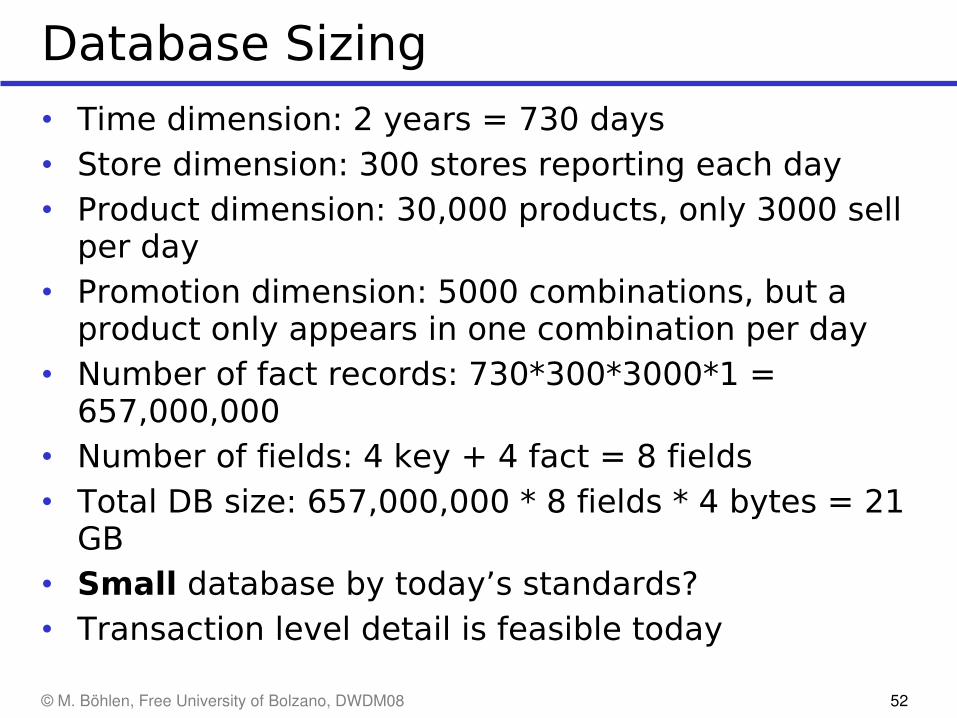
Database Sizing
• Time dimension: 2 years = 730 days• Store dimension: 300 stores reporting each day• Product dimension: 30,000 products, only 3000 sell
per day• Promotion dimension: 5000 combinations, but a
product only appears in one combination per day• Number of fact records: 730*300*3000*1 =
657,000,000• Number of fields: 4 key + 4 fact = 8 fields• Total DB size: 657,000,000 * 8 fields * 4 bytes = 21
GB• Small database by today’s standards?• Transaction level detail is feasible today
© M. Böhlen, Free University of Bolzano, DWDM08 53
DW Applications: OLAP
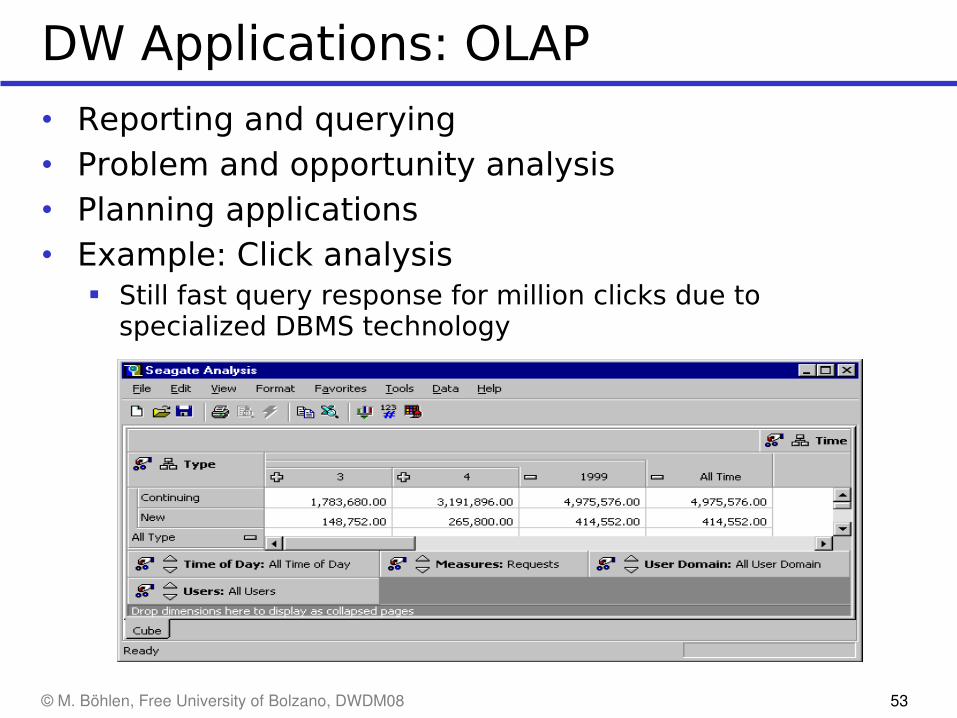
• Reporting and querying• Problem and opportunity analysis• Planning applications• Example: Click analysis
Still fast query response for million clicks due to specialized DBMS technology
© M. Böhlen, Free University of Bolzano, DWDM08 54
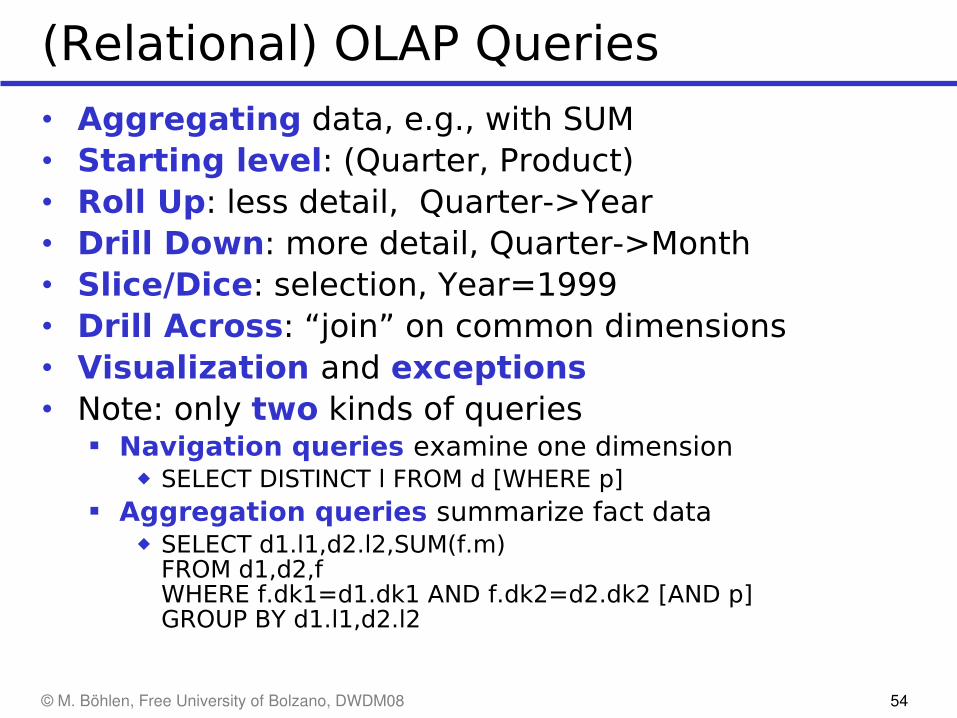
(Relational) OLAP Queries
• Aggregating data, e.g., with SUM• Starting level: (Quarter, Product)• Roll Up: less detail, Quarter->Year• Drill Down: more detail, Quarter->Month• Slice/Dice: selection, Year=1999• Drill Across: “join” on common dimensions• Visualization and exceptions• Note: only two kinds of queries
Navigation queries examine one dimension ◆ SELECT DISTINCT l FROM d [WHERE p]
Aggregation queries summarize fact data ◆ SELECT d1.l1,d2.l2,SUM(f.m)
FROM d1,d2,fWHERE f.dk1=d1.dk1 AND f.dk2=d2.dk2 [AND p] GROUP BY d1.l1,d2.l2
© M. Böhlen, Free University of Bolzano, DWDM08 55
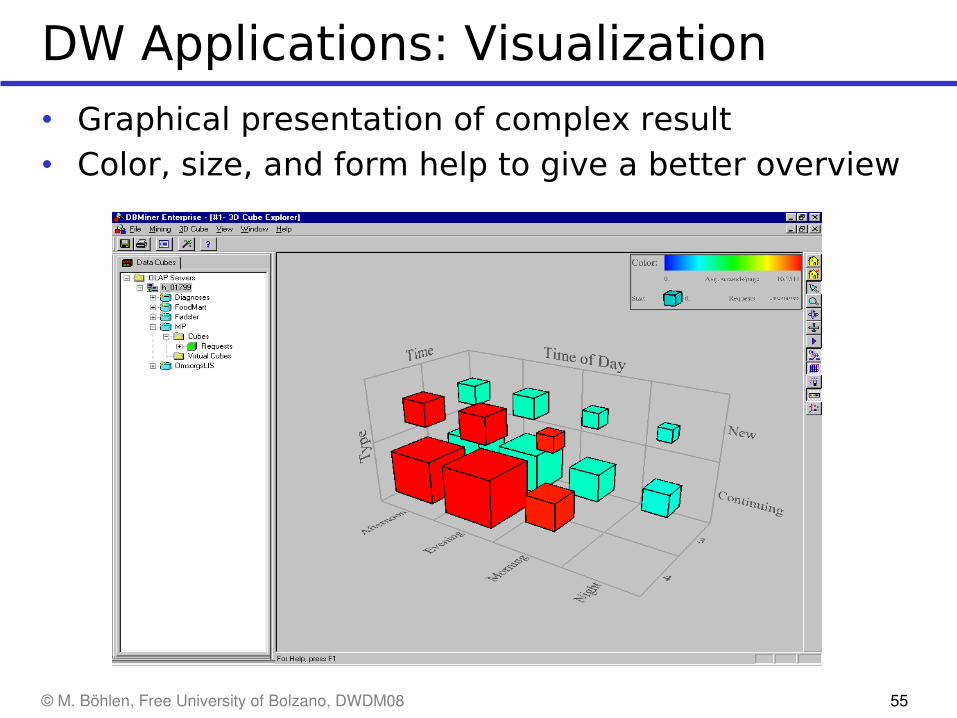
DW Applications: Visualization
• Graphical presentation of complex result• Color, size, and form help to give a better overview
© M. Böhlen, Free University of Bolzano, DWDM08 56
DW Applications: Data Mining/1
• Data mining is automatic knowledge discovery• Roots in AI and statistics• Classification
Partition data into pre-defined classes
• Prediction Predict/estimate unknown value based on similar cases
• Clustering Partition data into groups so the similarity within individual
groups are greatest and the similarity between groups are smallest
• Affinity grouping/associations Find associations/dependencies between data Rules: A -> B (c%,s%): if A occurs, B occurs with
confidence c and support s
• Important to choose the granularity for mining Too small granularity gives no good results (shirt brand,..)
© M. Böhlen, Free University of Bolzano, DWDM08 57
DW Applications: Data Mining/2
• Wal-Mart: USA’s largest supermarket chain Has DW with all ticket item sales for the last 2 years (big!) Use DW and mining heavily to gain business advantages Analysis of association within sales tickets
◆ Discovery: Beer and diapers on the same ticket◆ Men buy diapers, and must ”just have a beer”◆ Put the expensive beers next to the diapers ◆ Put beer at some distance from diapers with chips, videos in-
between! Wal-Mart's suppliers use the DW to optimize delivery
◆ The supplier puts the product on the shelf◆ The supplier only get paid when the product is sold
• Web log mining What is the association between time of day and
requests? What user groups use my site? How many requests does my site get in a month? (Yahoo)
© M. Böhlen, Free University of Bolzano, DWDM08 58
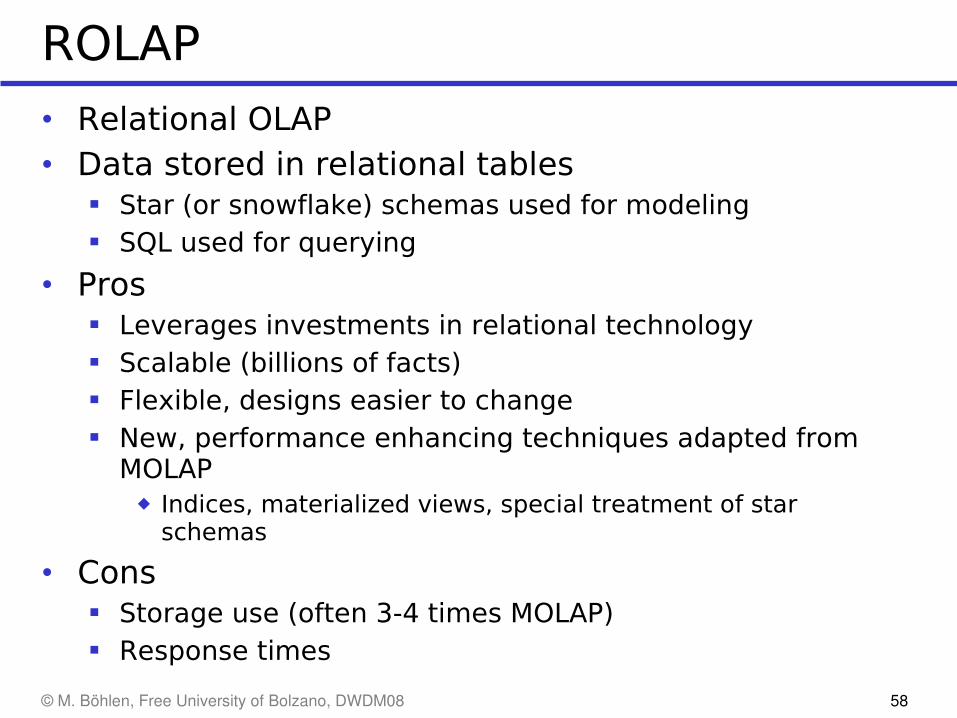
ROLAP
• Relational OLAP• Data stored in relational tables
Star (or snowflake) schemas used for modeling SQL used for querying
• Pros Leverages investments in relational technology Scalable (billions of facts) Flexible, designs easier to change New, performance enhancing techniques adapted from
MOLAP◆ Indices, materialized views, special treatment of star
schemas
• Cons Storage use (often 3-4 times MOLAP) Response times
© M. Böhlen, Free University of Bolzano, DWDM08 59
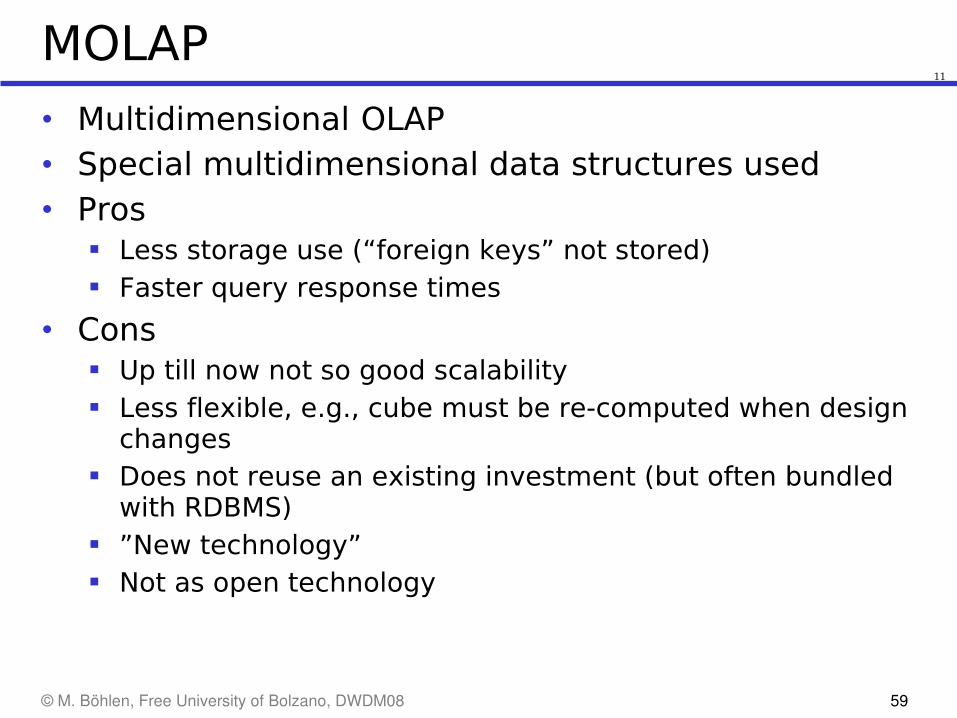
MOLAP
• Multidimensional OLAP• Special multidimensional data structures used• Pros
Less storage use (“foreign keys” not stored) Faster query response times
• Cons Up till now not so good scalability Less flexible, e.g., cube must be re-computed when design
changes Does not reuse an existing investment (but often bundled
with RDBMS) ”New technology” Not as open technology
11
© M. Böhlen, Free University of Bolzano, DWDM08 60
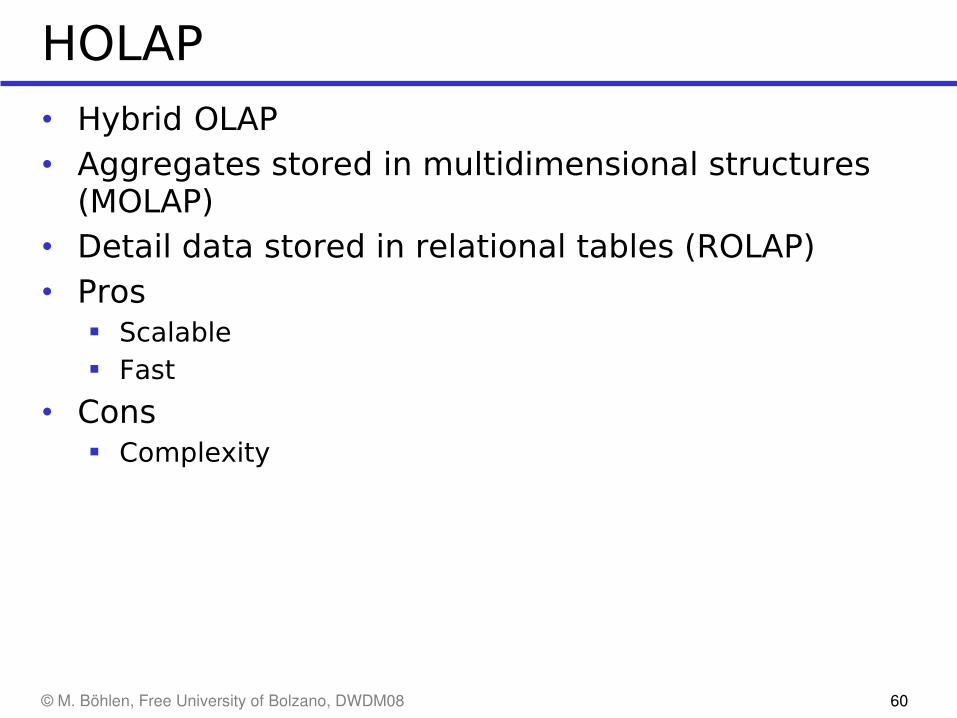
HOLAP
• Hybrid OLAP• Aggregates stored in multidimensional structures
(MOLAP)• Detail data stored in relational tables (ROLAP)• Pros
Scalable Fast
• Cons Complexity
© M. Böhlen, Free University of Bolzano, DWDM08 61
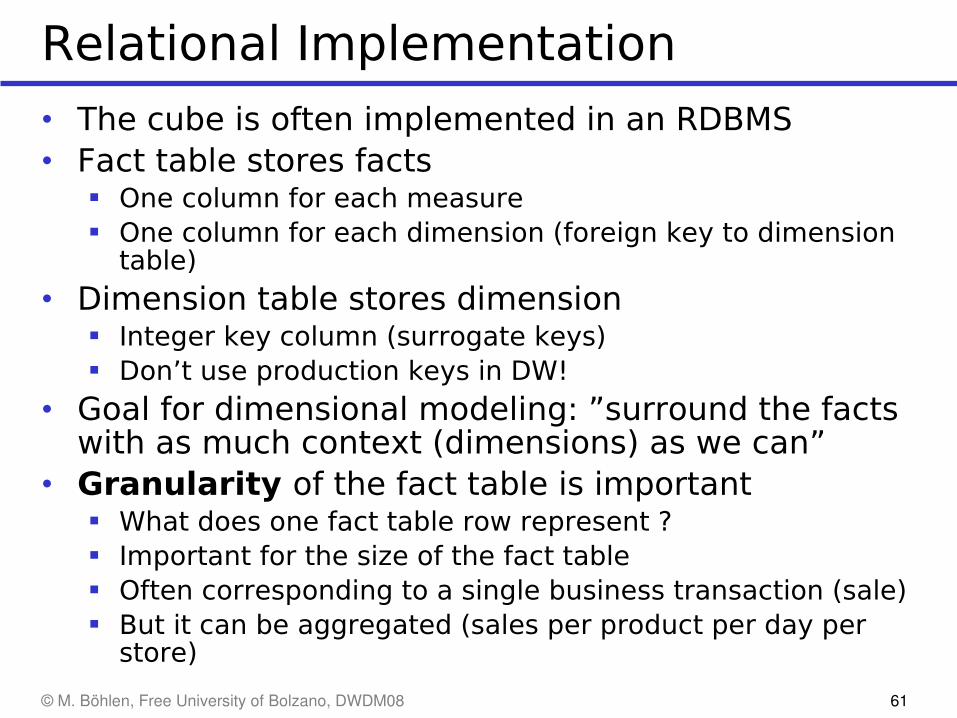
Relational Implementation
• The cube is often implemented in an RDBMS• Fact table stores facts
One column for each measure One column for each dimension (foreign key to dimension
table)
• Dimension table stores dimension Integer key column (surrogate keys) Don’t use production keys in DW!
• Goal for dimensional modeling: ”surround the facts with as much context (dimensions) as we can”
• Granularity of the fact table is important What does one fact table row represent ? Important for the size of the fact table Often corresponding to a single business transaction (sale) But it can be aggregated (sales per product per day per
store)
© M. Böhlen, Free University of Bolzano, DWDM08 62
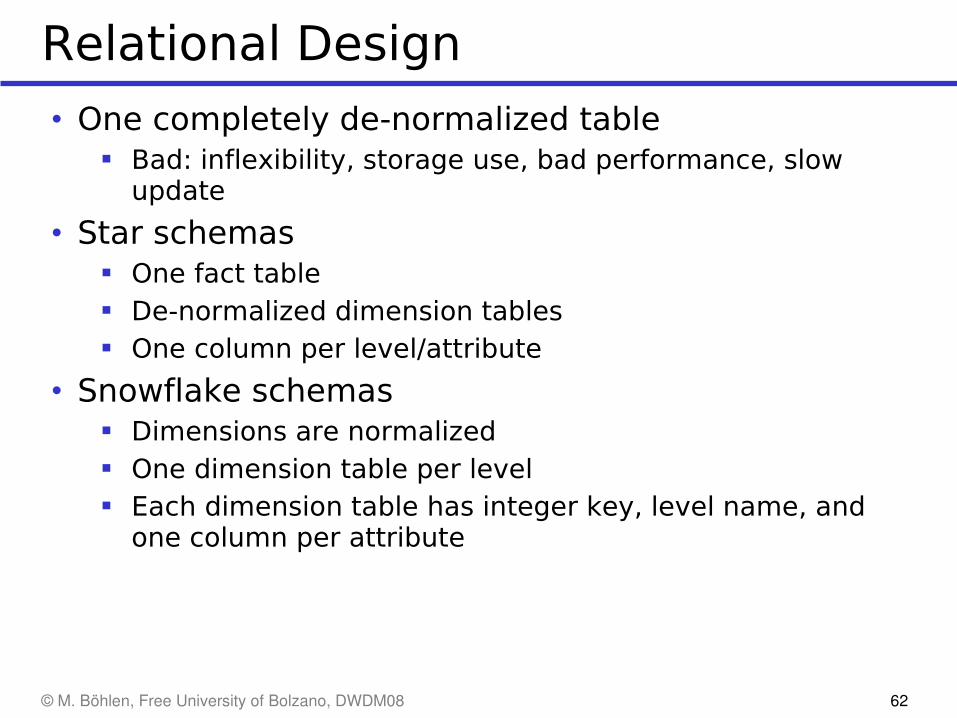
Relational Design
• One completely de-normalized table Bad: inflexibility, storage use, bad performance, slow
update
• Star schemas One fact table De-normalized dimension tables One column per level/attribute
• Snowflake schemas Dimensions are normalized One dimension table per level Each dimension table has integer key, level name, and
one column per attribute
© M. Böhlen, Free University of Bolzano, DWDM08 63
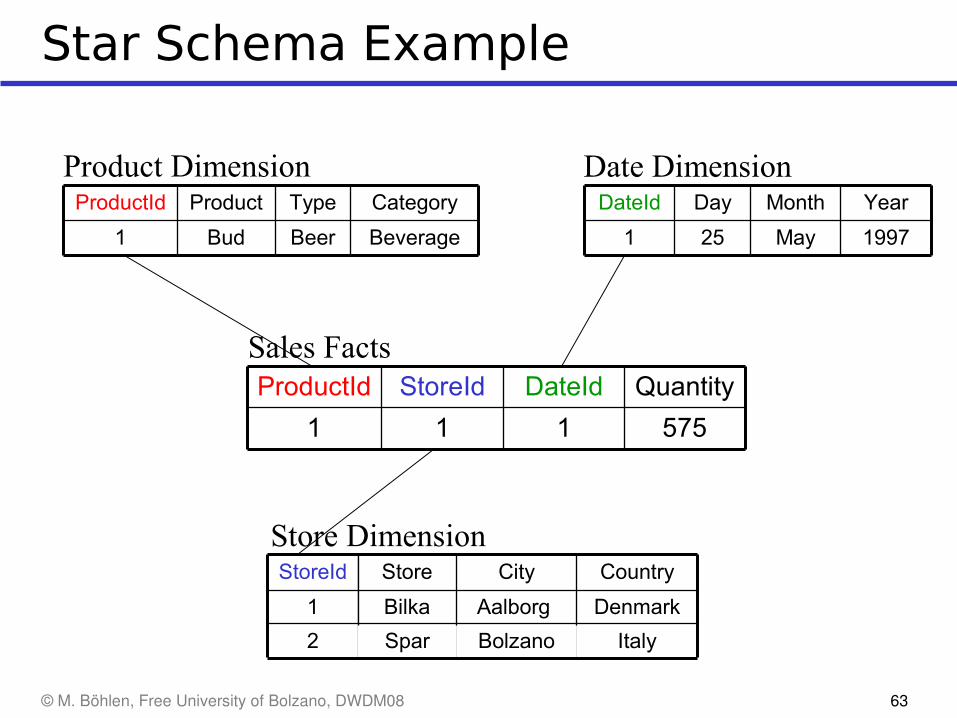
Star Schema Example
575111
QuantityDateIdStoreIdProductId
DenmarkAalborg Bilka1
CountryCityStoreStoreId
1997May251
YearMonthDayDateId
BeverageBeerBud1
CategoryTypeProductProductId
Product Dimension Date Dimension
Sales Facts
Store Dimension
ItalyBolzanoSpar2
© M. Böhlen, Free University of Bolzano, DWDM08 64
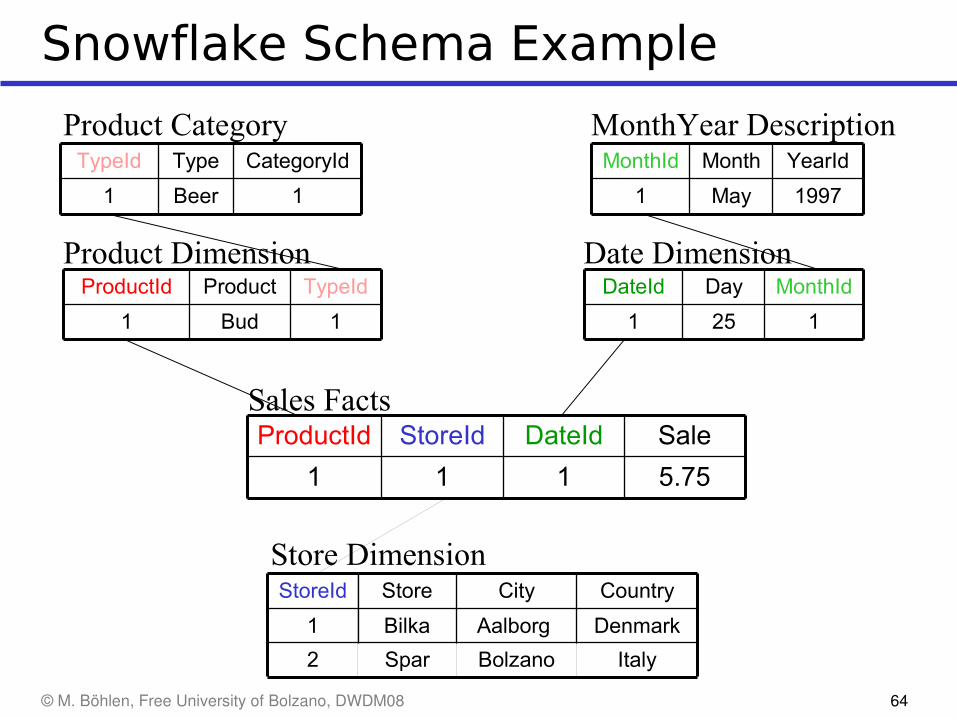
Snowflake Schema Example
5.75111
SaleDateIdStoreIdProductId
1251
MonthIdDayDateId
1Bud1
TypeIdProductProductId
1Beer1
CategoryIdTypeTypeId
1997May1
YearIdMonthMonthId
Product Dimension
Product Category
Sales Facts
Date Dimension
DenmarkAalborg Bilka1
CountryCityStoreStoreId
Store Dimension
ItalyBolzanoSpar2
MonthYear Description
© M. Böhlen, Free University of Bolzano, DWDM08 65
Star Schemas
• + Simple and easy overview -> ease-of-use• + Relatively flexible• + Fact table is normalized• + Dimension tables often relatively small• + “Recognized” by many RDBMSes -> good
performance• - Hierarchies are ”hidden” in the columns• - Dimension tables are de-normalized
© M. Böhlen, Free University of Bolzano, DWDM08 66
Snow-flake Schemas
• + Hierarchies are made explicit/visible• + Very flexible• + Dimension tables use less space• - Harder to use due to many joins• - Worse performance
© M. Böhlen, Free University of Bolzano, DWDM08 67
Inventory Example
• Advanced retail business requires inventory information. Making sure the right product is in the right store at the right time minimizes out-of-stocks and reduces overall inventory costs. The retailer needs the ability to analyze daily quantity-on-hand inventory levels by product and store.
• Design dimensional models that support the analysis of inventories for retail businesses (grocery stores).
13, 15
© M. Böhlen, Free University of Bolzano, DWDM08 68
Redundancy In The DW
• Only very little redundancy in fact tables Order head data copied to order line facts The same fact data (generally) only stored in one fact
table
• Redundancy is mostly in dimension tables Star dimension tables have redundant entries for the
higher levels
• Redundancy problems? Inconsistent data – the central load process helps with this Update time – the DW is optimized for querying, not
updates Space use: dimension tables typically take up less than
5% of DW
• So: controlled redundancy is good Up to a certain limit
© M. Böhlen, Free University of Bolzano, DWDM08 69
Limits And Strengths
• Many-to-one relationship from fact to dimension• Many-to-one relationships from lower to higher
levels in the hierarchies• Therefore, it is impossible to ”count wrong”• Hierarchies have a fixed height• Hierarchies don’t change?
© M. Böhlen, Free University of Bolzano, DWDM08 70
References• Ralph Kimball. The Data Warehouse Toolkit, Wiley, 1996• R. Kimball and Margy Ross. The Data Warehouse Toolkit,
Wiley, 2002• R. Kimball et al. The Data Warehouse Lifecycle Toolkit, Wiley, 1998• R. Kimball and R. Merz. The Data Webhouse Toolkit, Wiley, 2000.
• R. Kimball. Data Webhouse Column <intelligententerprise.com>
• Meta Group. 1999 DW Marketing Trends <metagroup.com>
• Palo Alto Management Group. 1999 BI and DW Program Competitive Analysis Report, <pamg.com>
• Erik Thomsen. OLAP Solutions, Wiley, 1997.• Erik Thomsen et al. Microsoft OLAP Solutions, Wiley, 1999.
• DBMiner Technology <dbminer.com>
• The OLAP Council <olapcouncil.org>
• The OLAP Report <olapreport.com>
• The Data Warehousing Information Center <dwinfocenter.org>
• DSS Lab <dsslab.com>
© M. Böhlen, Free University of Bolzano, DWDM08 71
Summary
• OLAP, Multidimensional cubes• Dimensions, Facts, Measures• Case study
Grocery store
• Relational design• Redundancy, strengths and weaknesses
16, 17, 18