database design project -...
TRANSCRIPT

Alicia Zecherle Ami Bigit
Ben Lewis Khoa Tran
Kimberly Lam Mana Nabati
Morgan Fabian Steven Belding
team #6
database design project ieor 115: final presentation

our client: Rachel Malsin founder of PROJECT: JUICE
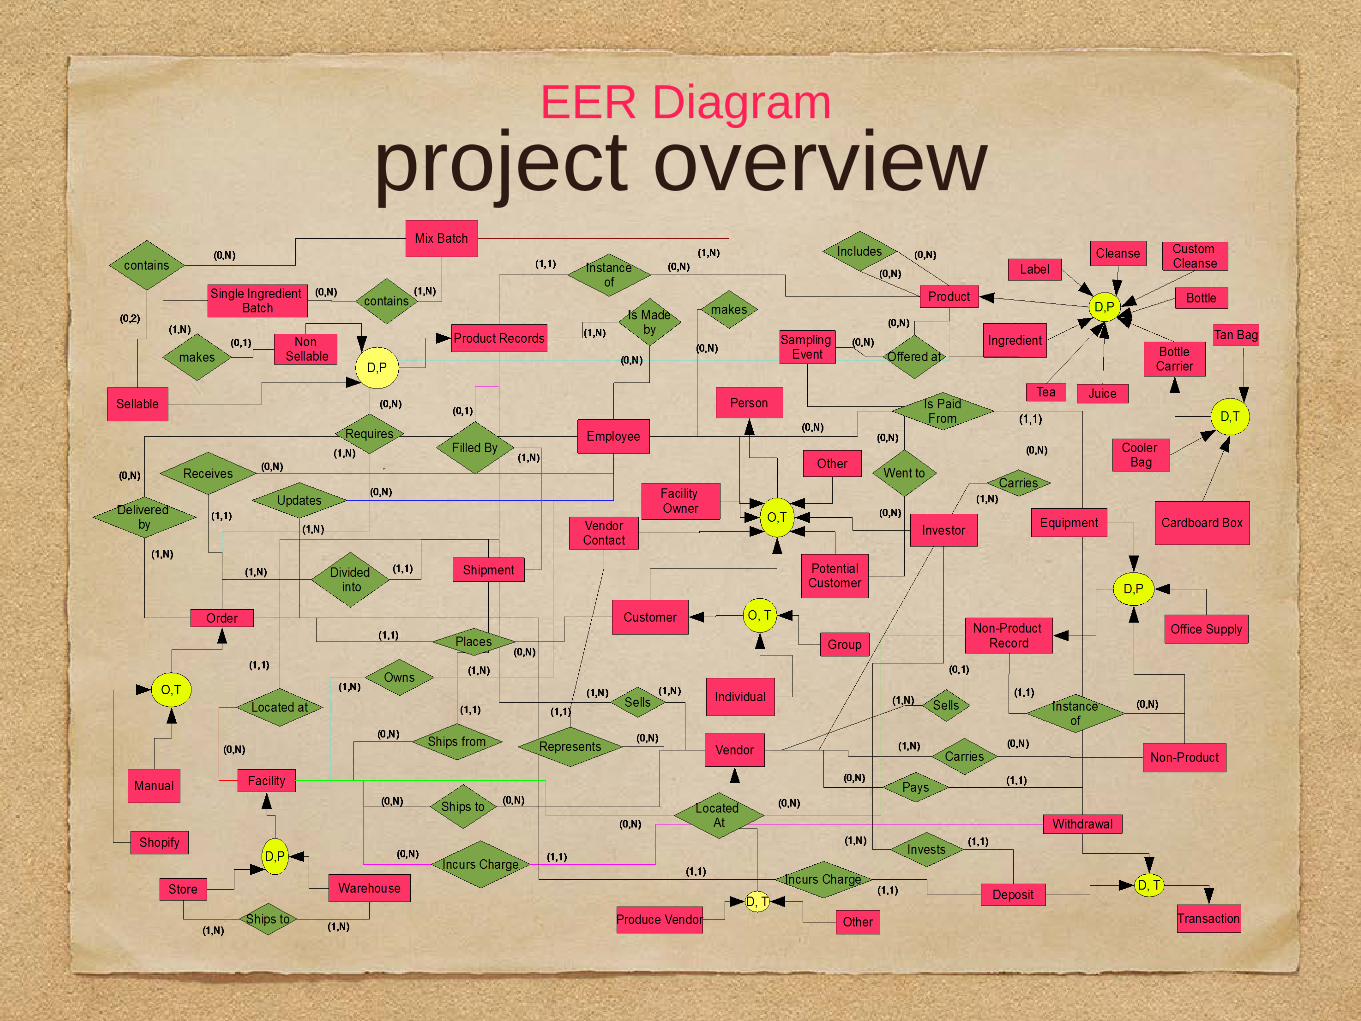
project overview EER Diagram

project overview 1. Person(PersonID, Lname, Fname, MI, Street, City, State, Zip, Telephone, Email) 2. Customer(CID1, Customer_Type, Group_Name, Bdate, Gender, Company, County, Tax_Rate, Note) 3. Employee(EID1, SSN, Bdate, Job_Title, Salary, Hourly_Wage) 4. Facility_ Owner(FOID1, Company_Name) 5. Potential_Customer(ContactID1, Place_of_Contact, Date_Of_Contact, Company_Name,
SamplingEvent20) 6. Vendor_Contact(ContactID1, Job_Title, Company_Name) 7. Investor(InvID1, Company_Name) 8. Other_Person(ContactID1, Description) 9. Order(OID, Date_Placed, Time_Placed, CID2, Input_Type, TID31, Recieved_By3) 10. Facility(FacilityID, Name, Street, City, State, Zip, Telephone, Facility_Type) 11. Vendor(VID, Company_Name, Type, ContactID6, Street, City, Zip, Telephone, Email) 12. Product(PID, Pname, Season) 13. Ingredient(PID12, Season) 14. Juice(PID12, Shelf_Life) 15. Tea(PID12, Shelf_Life) 16. Bottle(PID12, Size, Material, Cost, VendorID11) 17. Label(PID12, Size, Printed_At, For_Bottle_Size, Cost, VendorID11) 18. Bottle_Carriers(PID12, Carrier_Type, Color, Cost, Insulated) 19. Cleanse(PID12, Cleanse_Name, Number_of_Days, Price) 20. Sampling_Event(EventID, Date, Place, Event_Name, Type, Event_Description)
relational schema

project overview 21. Product_Record_Sellable(PID12, Date, Instance, Mixed_BID124,Mixed_BID224, Bottle16, Label_Type17,
Shipment25, VID11, Price) 22. Product_Record_NonSellable(PID13, Date_Bought, Instance, Weight, VID11, Cost, TID30) 23. Single_Ingredient_Batch(SI_BID, PID22, Date_Bought22, Instance22, Ingredient13, Original_Weight,
Produced_Volume, Date_Made, BagID27, BladeID27) 24. Mixed_Batch(Mixed_BID, BName, Date_Made, Date_Finalized, Date_Expires, PID12, Treatment,
Treatment_Date, Final_Volume) 25. Shipment (SID, OID9, Date, Delivered_By3, FedEx_Option, Bottle_Carrier18, Delivered_From10) 26. Non-Product(NID, Name, Type, Description, Restock_Every) 27. Equipment(EquipID26, EName, Type) 28. Office_Supplies(SupplyID26, OName, Type) 29. Non-Product_Record(NID26, Date_Purchased, Instance, Location10, VID11) 30. Transaction(TID, Amount, TDate, TTime) 31. Withdrawl(TID30, Type, SalaryEmployeeID3, Facility_Rent4, Refund_Order9, Vendor_Purchase11,
Amount) 32. Deposit(TID30, OID9, InvestorID7, Type, Amount) 33. Updates_Order(OID9, EID3, UDate, UTime) 34. Employee_Makes_SIBatch_With_Equip(EID3, SIBID23, EquipID27, Time_Started, Time_Ended) 35. Employee_Makes_MixedBatch_With_Equip(EID3, MixedBID24, EquipID27, Time_Started,
Time_Ended) 36. Employee_Makes_Sellable_Product(EID3, PID21, PDate21, Pinstance21) 37. Order_Details(OID9, PID12, Quantity) 38. Vendor_Contact_List(VID11, Vendor_Contact6)
relational schema
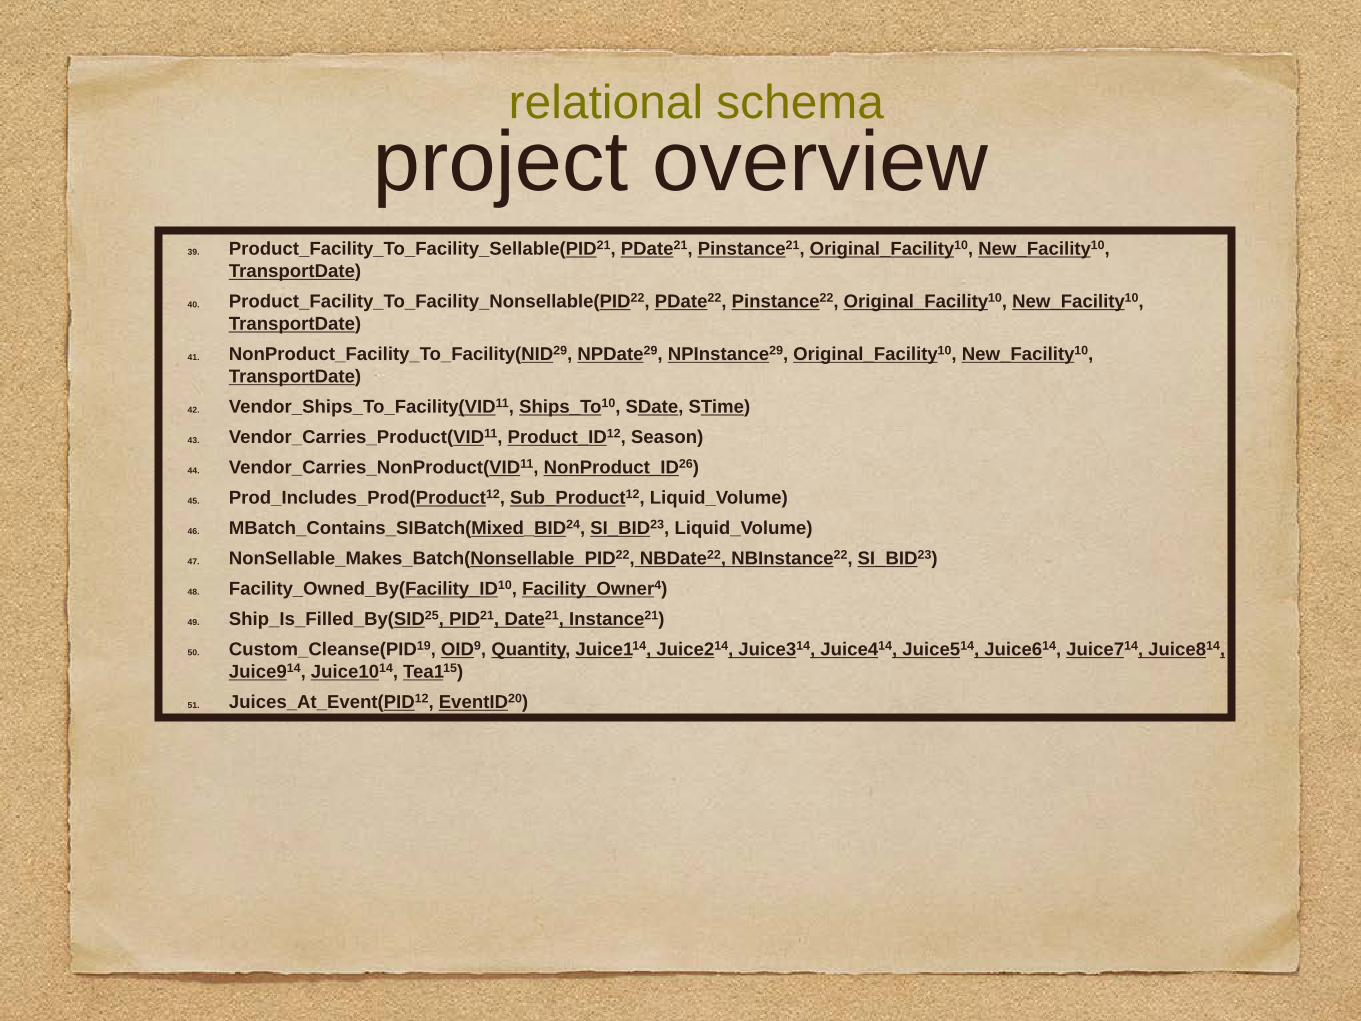
project overview 39. Product_Facility_To_Facility_Sellable(PID21, PDate21, Pinstance21, Original_Facility10, New_Facility10,
TransportDate) 40. Product_Facility_To_Facility_Nonsellable(PID22, PDate22, Pinstance22, Original_Facility10, New_Facility10,
TransportDate) 41. NonProduct_Facility_To_Facility(NID29, NPDate29, NPInstance29, Original_Facility10, New_Facility10,
TransportDate) 42. Vendor_Ships_To_Facility(VID11, Ships_To10, SDate, STime) 43. Vendor_Carries_Product(VID11, Product_ID12, Season) 44. Vendor_Carries_NonProduct(VID11, NonProduct_ID26) 45. Prod_Includes_Prod(Product12, Sub_Product12, Liquid_Volume) 46. MBatch_Contains_SIBatch(Mixed_BID24, SI_BID23, Liquid_Volume) 47. NonSellable_Makes_Batch(Nonsellable_PID22, NBDate22, NBInstance22, SI_BID23) 48. Facility_Owned_By(Facility_ID10, Facility_Owner4) 49. Ship_Is_Filled_By(SID25, PID21, Date21, Instance21) 50. Custom_Cleanse(PID19, OID9, Quantity, Juice114, Juice214, Juice314, Juice414, Juice514, Juice614, Juice714, Juice814,
Juice914, Juice1014, Tea115) 51. Juices_At_Event(PID12, EventID20)
relational schema

database implementation
FORMS Entering orders details Entering and editing product history Updating customers and contacts
REPORTS
Lists of daily orders Lists of orders by Zip Code for Tax Info Lists of reoccurring customer orders
QUERIES: Improving production, forecasting, and marketing strategy
how they will be using it:

database implementation: forms and switchboard
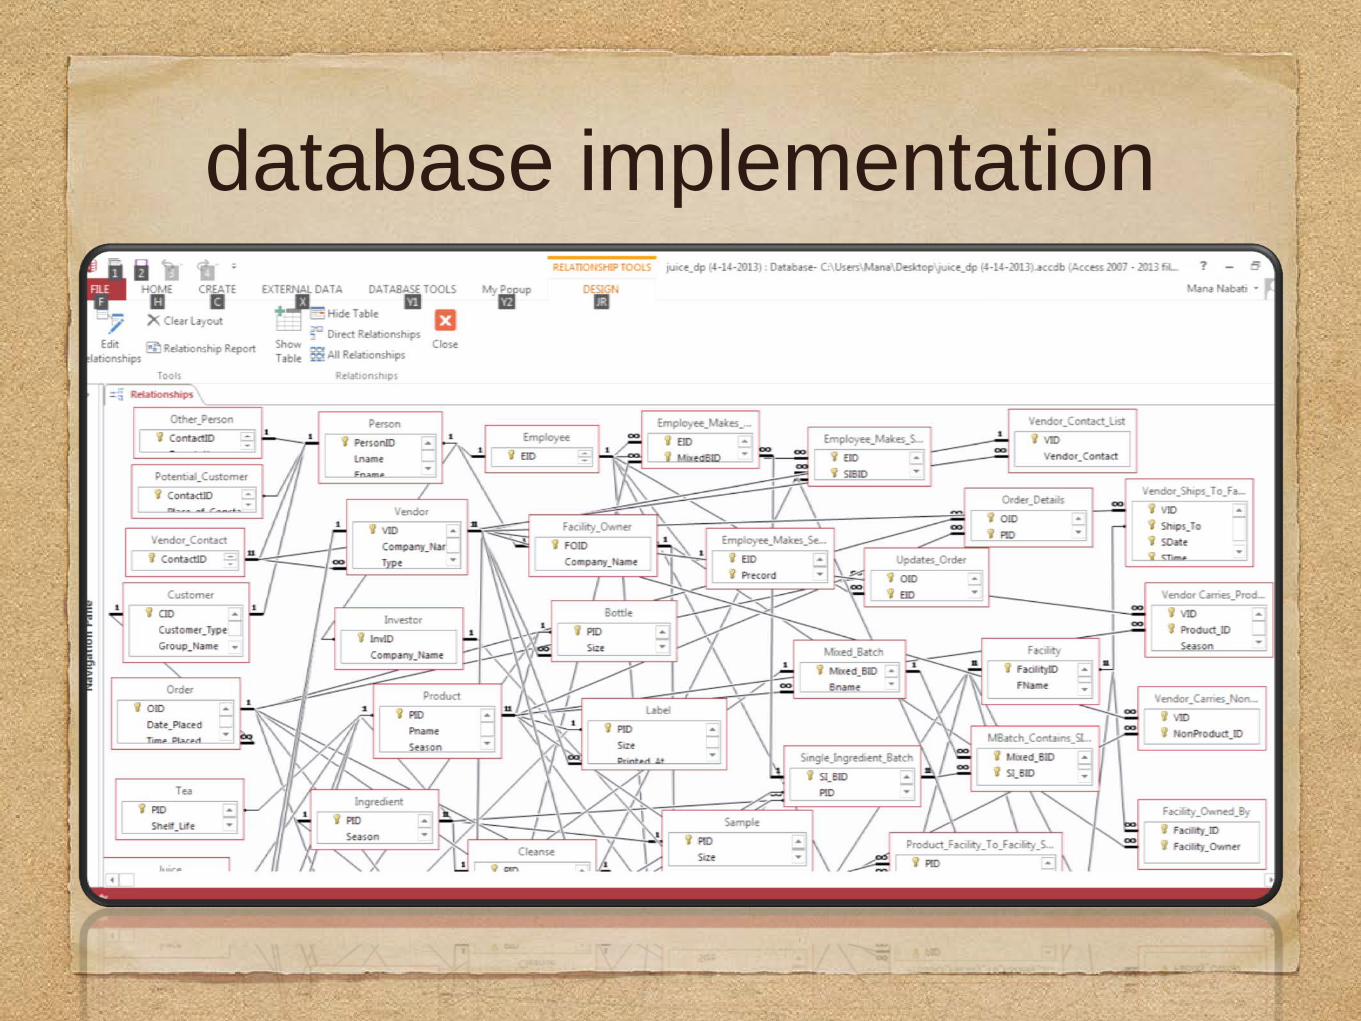
database implementation

why?
LOTS OF VENDOR
PRODUCE
Products
Customers
JUICES
query 1: contaminated batch
Given a particular customer complaint, find ALL customers that may have also been affected
DAMAGE CONTROL
query 1: contaminated batch

query 1: contaminated batch lines 1-45

query 1: contaminated batch lines 46-90
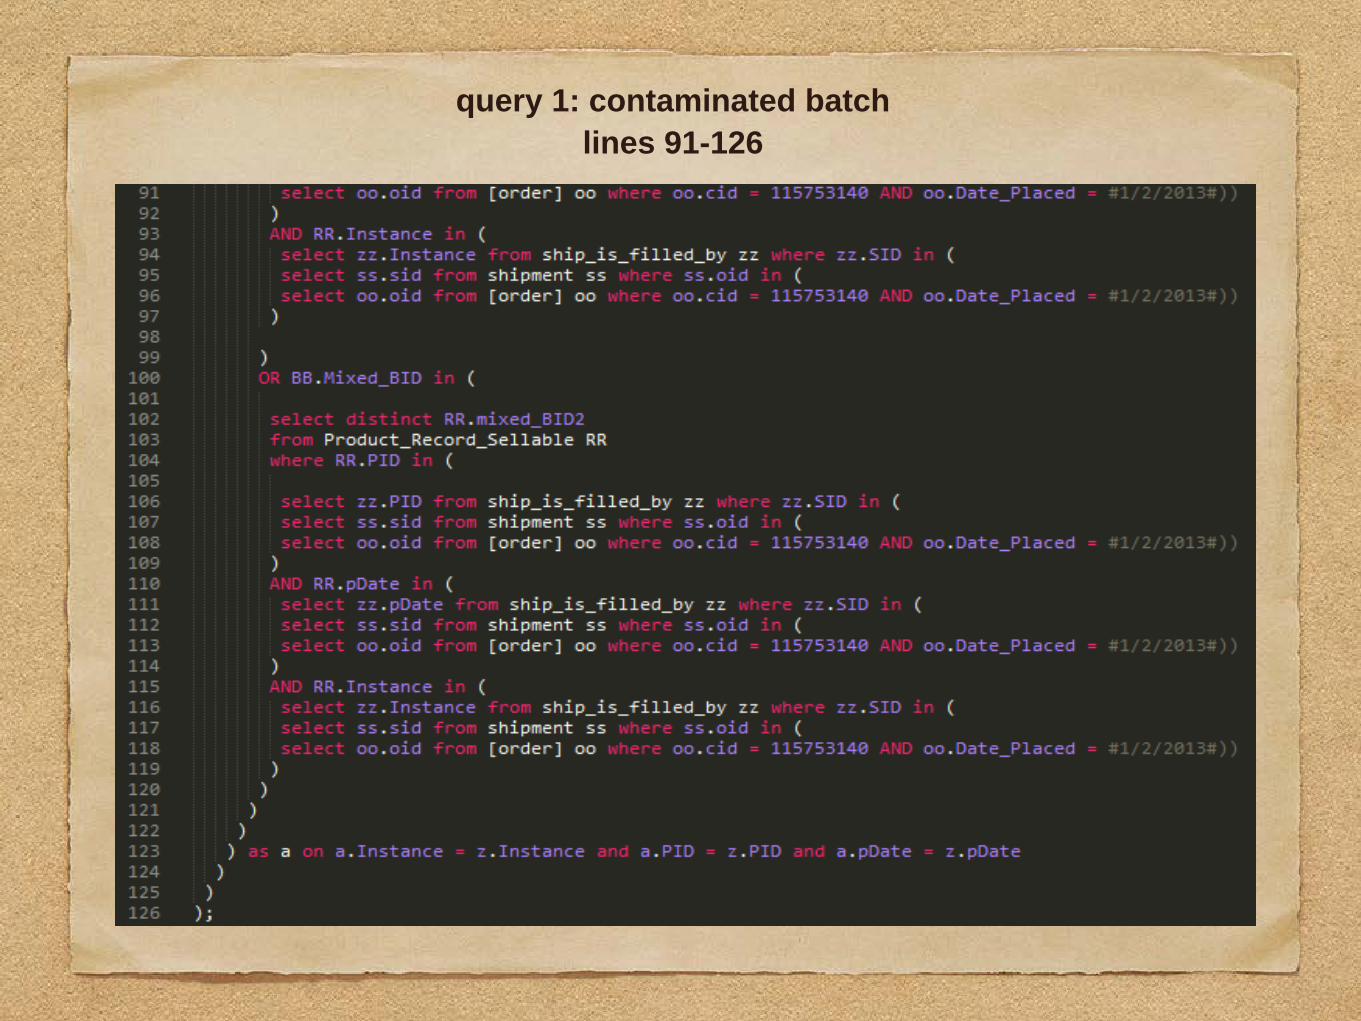
query 1: contaminated batch lines 91-126

Given a bad order, find ALL products that may have also been affected and the probability that they are also bad
query 1: contaminated batch
DAMAGE CONTROL Step 1: Find all possibly contaminated batches given a customer complaint.

query 1: contaminated batch
Step 2: Find all possibly contaminated single ingredient batches and customers with products containing those batches.

query 1: contaminated batch
Step 3: Determine which customers to contact and find the probability that they have a contaminated product.

why?
query 2: product profitability
Selling Price – (Cost of Ingredients + Cost
of Label/Bottle + Cost of Employee Time)

Generate list and graph profitability of each product over the span of a year to account for seasonal changes.
COST-BENEFIT
query 2: product profitability

query 2: product profitability Step 1: Find the cost of all single ingredient batches. SELECT SIB.SI_BID AS SI_BID, ((SIB.Original_Weight*PRN.Cost) + E.Hourly_Wage*(EM.Time_Ended - EM.Time_Started)/60) AS Cost FROM EMPLOYEE AS E, PRODUCT_RECORD_NONSELLABLE AS PRN, SINGLE_INGREDIENT_BATCH AS SIB, EMPLOYEE_MAKES_SIBATCH_WITH_EQUIP AS EM WHERE PRN.PID = SIB.Ingredient_PID AND EM.BID = SIB.SI_BID AND EM.EID = E.EID;

query 2: product profitability Step 2: Find the cost of all mixed ingredient batches. SELECT MB.Mixed_BID AS Mix_BID, SUM((BCB.Liquid_Volume/SIB.Produced_Volume)*CSB.Cost) AS Cost FROM MIXED_BATCH AS MB, MBATCH_CONTAINS_SIBATCH AS BCB, costSingleBatch AS CSB, SINGLE_INGREDIENT_BATCH AS SIB WHERE MB.Mixed_BID = BCB.Mixed_BID and BCB.SI_BID = CSB.SI_BID GROUP BY MB.Mixed_BID;

query 2: product profitability Step 3: Find the profit of each product instance, grouped by product. SELECT PRS.Pdate, PRS.PID, (PRS.Price-((B.Size/MBB.Final_Volume)*(MBC.Cost))) AS Profit FROM PRODUCT_RECORD_SELLABLE AS PRS, BOTTLE AS B, MIXED_BATCH AS MBB, costMixBatch AS MBC, Prod_Includes_Prod AS PIP WHERE PRS.PID = PIP.Product AND B.PID = PIP.Sub_Product AND PRS.Mixed_BID1 = MBB.Mixed_BID AND MBB.Mixed_BID = MBC.Mix_BID;

query 2: product profitability
Step 4: Total profit of each product. SELECT PP.PDate, PP.PID, Sum(PP.Profit) FROM ProductProfit AS PP GROUP BY PP.PID, PP.Pdate;

why? query 3: sampling events
WHAT MAKES IT SUCCESSFUL?
CUSTOMERS?
TYPE?
SAMPLES?

Selection of information regarding each sampling and testing the correlation between these factors and the
success of the event (customer yield).
MARKETING ANALYSIS
query 3: sampling events
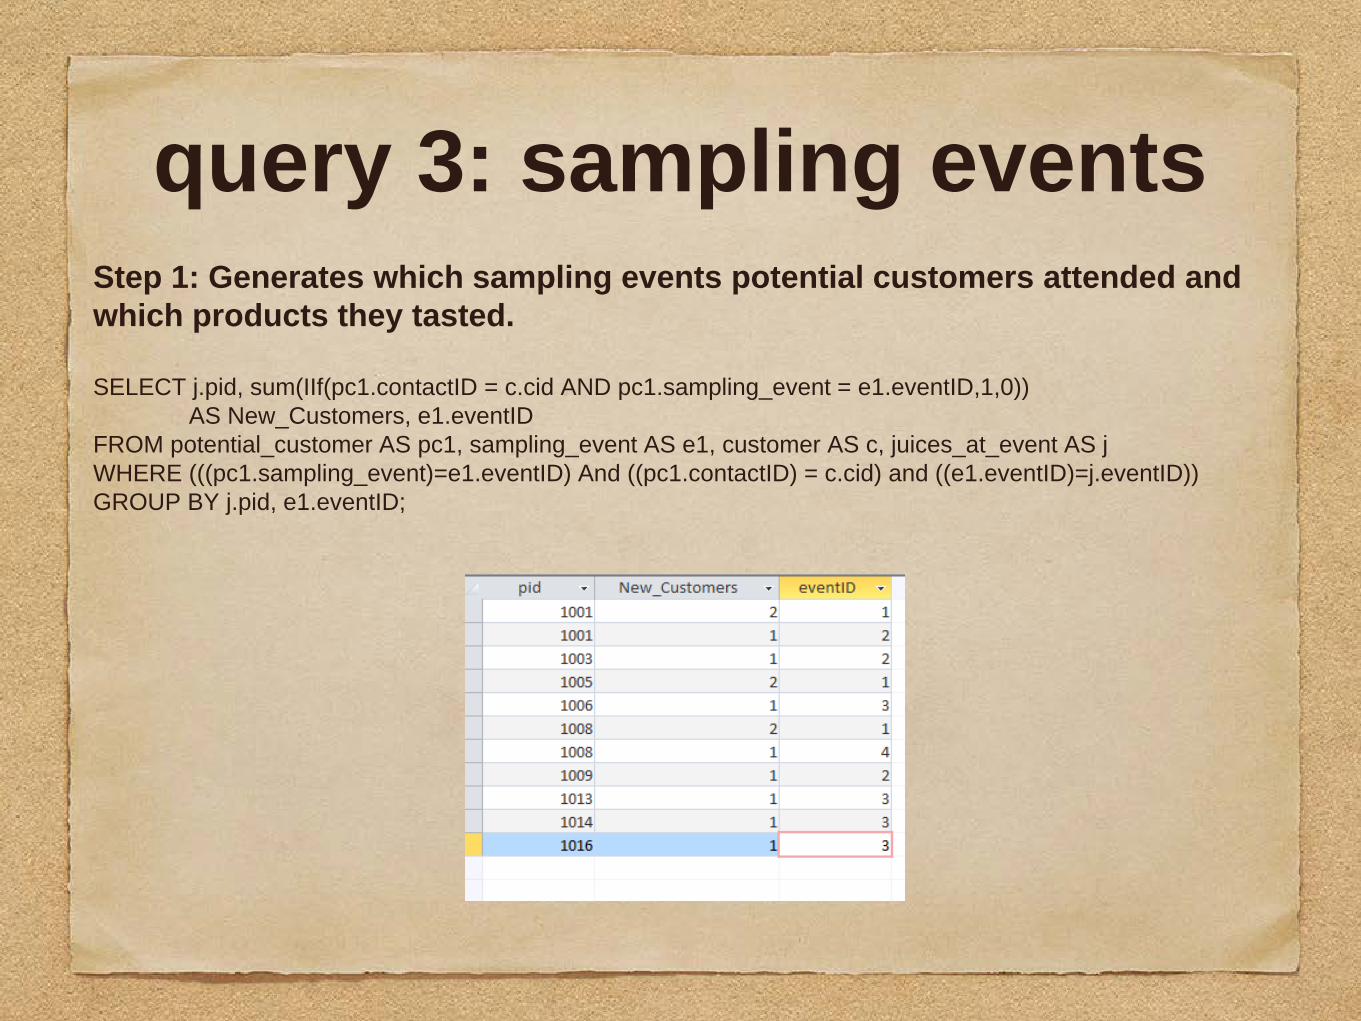
query 3: sampling events Step 1: Generates which sampling events potential customers attended and which products they tasted. SELECT j.pid, sum(IIf(pc1.contactID = c.cid AND pc1.sampling_event = e1.eventID,1,0)) AS New_Customers, e1.eventID FROM potential_customer AS pc1, sampling_event AS e1, customer AS c, juices_at_event AS j WHERE (((pc1.sampling_event)=e1.eventID) And ((pc1.contactID) = c.cid) and ((e1.eventID)=j.eventID)) GROUP BY j.pid, e1.eventID;

query 3: sampling events Step 2: Determines customer yield depending on type and product sampled. SELECT j.pid, Q3.New_Customers, Count(pc2.contactID) AS Event_Attendees, [Q3.New_Customers]/[Event_Attendees] AS customer_yield, e1.eventID, e1.type, e1.event_description FROM potential_customer AS pc2, sampling_event AS e1, juices_at_event AS j, query3 AS Q3 WHERE pc2.sampling_event = e1.eventID And e1.eventID=j.eventID GROUP BY j.pid, e1.eventID, e1.type, Q3.New_Customers, e1.event_description;

query 3: sampling events Multivariate regression in Excel with both product sampled and event type considered shows us that the product does not effect the yield, however…

query 3: sampling events Another regression shows us that the type of event does impact the new customer yield. Event types 2 (food events such as farmers’ markets) and 5 (health care related sampling events) produce the maximum yields (26.4% each)
why? query 4: custom cleanse
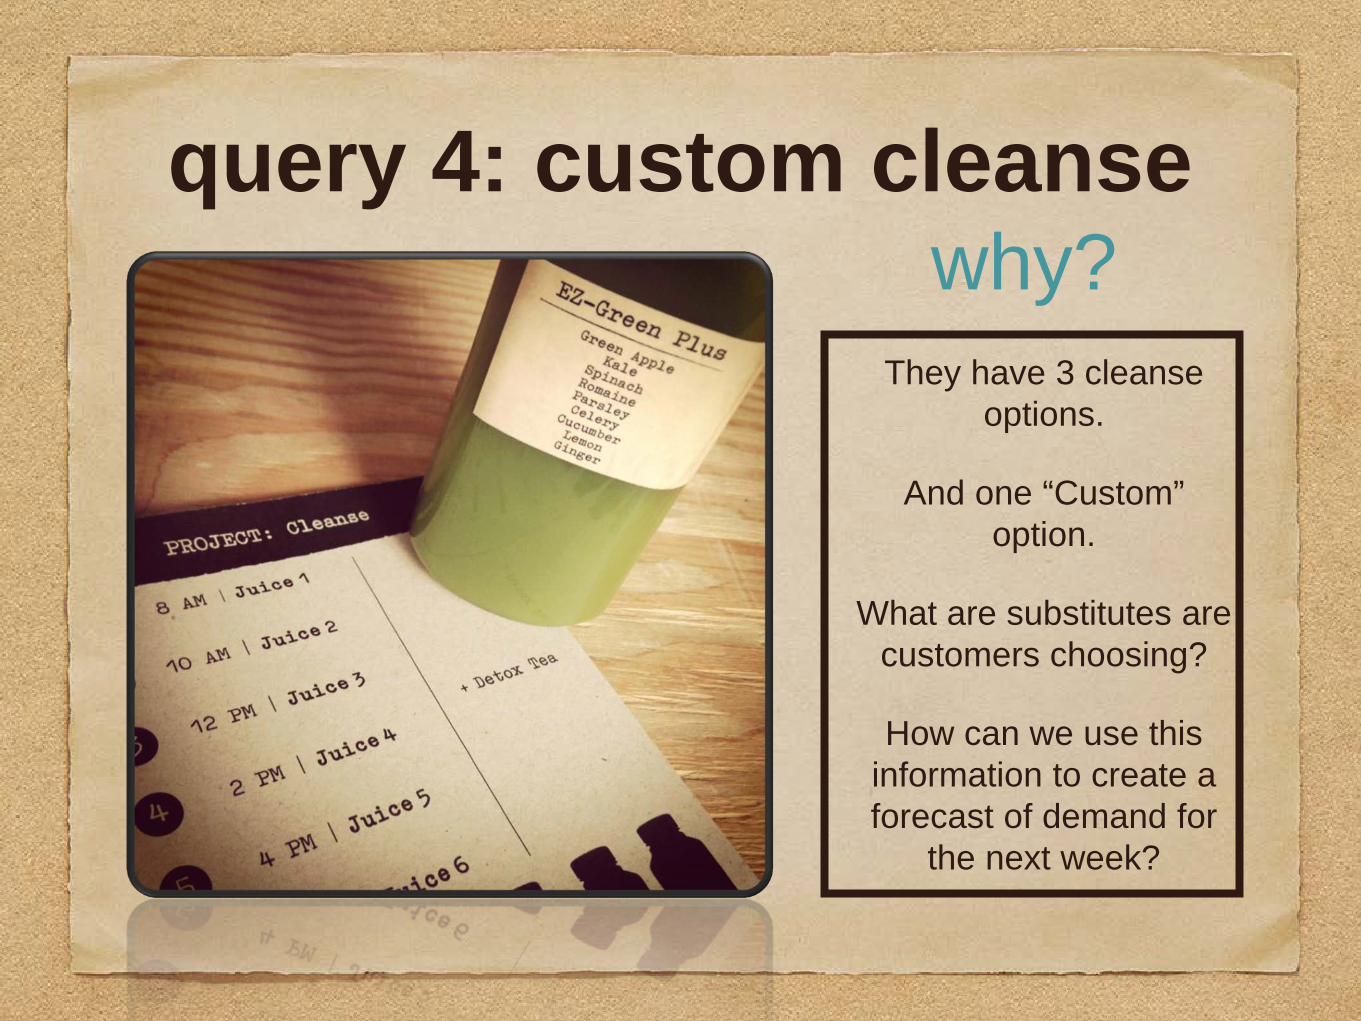
They have 3 cleanse options.
And one “Custom” option.
What are substitutes are customers choosing?
How can we use this information to create a forecast of demand for
the next week?
Find which juices are typically chosen in custom cleanses over those in standard cleanse in order to determine a list of juices are most popular and
which
CUSTOMER ANALYSIS
query 4: custom cleanse

query 4: custom cleanse Step 1: Find which juices are typically chosen in custom cleanses over those in a standard cleanse in order to determine a list of juices most likely to be replaced and which juices they are being replaced with.

query 4: custom cleanse
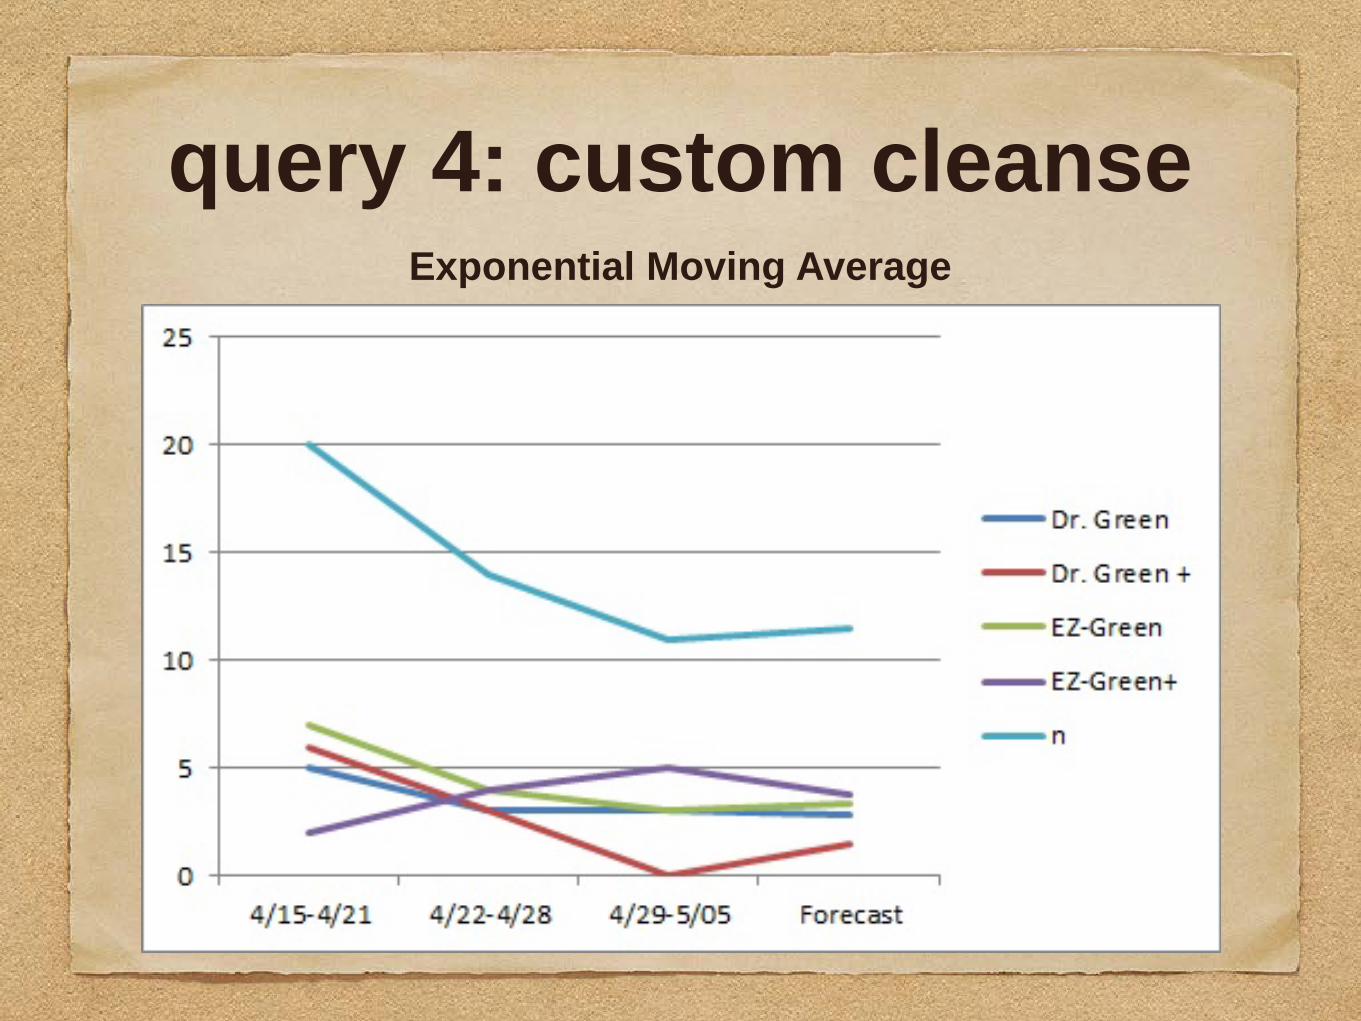
query 4: custom cleanse Exponential Moving Average

why?
DOES THE BAG OR BLADE
MATTER?
Bag A
Blade C
BLADES
BAGS
query 5: juice yield analysis

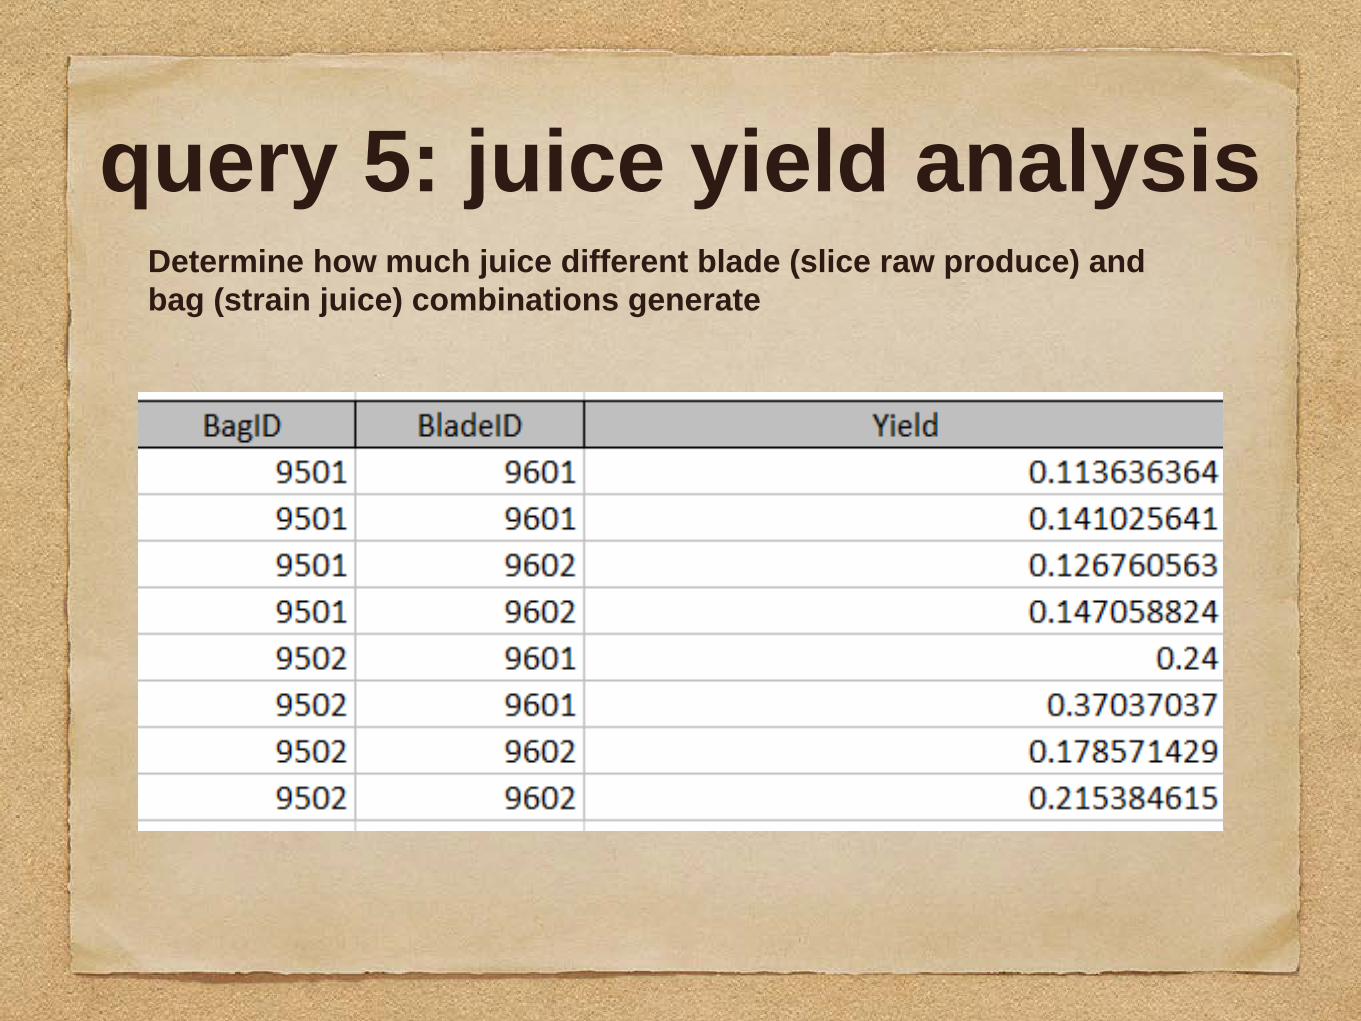
Determine how much juice different blade (slice raw produce) and bag (strain juice) combinations generate.
OPTIMIZATION and
HYPOTHESIS TESTING
query 5: juice yield analysis

query 5: juice yield analysis Determine how much juice different blade (slice raw produce) and
bag (strain juice) combinations generate.
SELECT s.BagID, s.BladeID, Avg(s.Produced_Volume/s.Original_Weight) AS [Yield(Mean)], STDEV(s.Produced_Volume/s.Original_Weight) AS [Standard Dev], COUNT(s.si_bid) AS n FROM single_ingredient_batch AS s WHERE (s.ingredient_PID=3001) And s.Date_Made Between #1/1/2012# And #12/30/2012# GROUP BY s.BagID, s.BladeID ORDER BY Avg(s.Produced_Volume/s.Original_Weight) DESC;
query 5: juice yield analysis Determine how much juice different blade (slice raw produce) and bag (strain juice) combinations generate

query 5: juice yield analysis Use MS Excel to generate two factor ANOVA with Replication

query 5: juice yield analysis Determine that bag choice is significant, the choice of blade is not.
Conclusion: It does not matter which blade we use, it is important to use bag 9502 when pressing ingredient 3001 (carrots). This will increase yield, decrease waste, and minimize production time.
BagID BladeID Yield(Mean) Standard Dev n
9501 9601 0.127331002331002
1.93671437737573E-02
2
9501 9602 0.141024372750992
1.24014756541644E-02
3
9502 9601 0.305185185185185
9.21857729546907E-02
2
9502 9602 0.196978021978022
2.60308540326914E-02
2

Normalization analysis
Partial Dependence 1. Cleanse(PID12, Cleanse_Name, Number_of_Days, Price)
1. CleansePrice(PID12, Number_of_Days, Price) 2. CleanseName(PID12, Cleanse_Name)
Transitive Dependence 2. Customer(CID1, Customer_Type, Group_Name, Bdate,
Gender, Company, County, Tax_Rate, Notes) 1. Customer(CID1, Customer_Type, Group_Name, Bdate,
Gender, Company, County, Notes) 2. County(County, Tax_Rate)
On tables Cleanse and Customer

Thank you!