database systems journal board director prof. ion lungu, phd
TRANSCRIPT
Database Systems Journal BOARD
Director Prof. Ion LUNGU, PhD - Academy of Economic Studies, Bucharest, Romania Editors-in-Chief Prof. Adela Bara, PhD - Academy of Economic Studies, Bucharest, Romania Prof. Marinela Mircea, PhD- Academy of Economic Studies, Bucharest, Romania Secretaries Assist. Iuliana Botha - Academy of Economic Studies, Bucharest, Romania Lecturer Anda Velicanu Academy of Economic Studies, Bucharest, Romania Editorial Board Prof Ioan Andone, A. I. Cuza University, Iasi, Romania Prof Emil Burtescu, University of Pitesti, Pitesti, Romania Joshua Cooper, PhD, Hildebrand Technology Ltd., UK Prof Marian Dardala, Academy of Economic Studies, Bucharest, Romania Prof. Dorel Dusmanescu, Petrol and Gas University, Ploiesti, Romania Prof Marin Fotache, A. I. Cuza University Iasi, Romania Dan Garlasu, PhD, Oracle Romania Prof Marius Guran, Polytehnic University, Bucharest, Romania Prof. Dimitri Konstantas, University of Geneva, Faculty of Social Sciences and Economics, Switzerland Prof. Mihaela I. Muntean, West University, Timisoara, Romania Prof. Stefan Nithchi, Babes-Bolyai University, Cluj-Napoca, Romania Prof. Corina Paraschiv, University of Paris Descartes, Paris, France Davian Popescu, PhD., Milan, Italy Prof Gheorghe Sabau, Academy of Economic Studies, Bucharest, Romania Prof Nazaraf Shah, Coventry University, Coventry, UK Prof Ion Smeureanu, Academy of Economic Studies, Bucharest, Romania Prof. Traian Surcel, Academy of Economic Studies, Bucharest, Romania Prof Ilie Tamas, Academy of Economic Studies, Bucharest, Romania Silviu Teodoru, PhD, Oracle Romania Prof Dumitru Todoroi, Academy of Economic Studies, Chisinau, Republic of Moldova Prof. Manole Velicanu, PhD, Academy of Economic Studies, Bucharest, Romania Prof Robert Wrembel, University of Technology, Poznań, Poland Lecturer Ticiano Costa Jordão, PhD-C, University of Pardubice, Pardubice, Czech Republic Contact Calea Dorobanţilor, no. 15-17, room 2017, Bucharest, Romania Web: http://dbjournal.ro E-mail: [email protected]

2 Database Systems Journal vol. III, no. 3/2012
Contents:
ERP and E-Business Application Deployment in Open Source Distributed Cloud Systems...................................................................................................................................... 3 George SUCIU, Traian-Lucian MILITARU, Gyorgy TODORAN Management information systems. A case study over the last eight years in the Romanian organizations........................................................................................................ 13 Eduard EDELHAUSER, Lucian LUPU – DIMA Pentaho Business Analytics: a Business Intelligence Open Source Alternative............... 23 Diana TÂRNĂVEANU New e-learning method using databases .............................................................................. 35 Andreea IONESCU Integrated Information System for Higher Education Qualifications.............................. 47 Catalin Ionut SILVESTRU, Codrin-Florentin NISIOIU, Bogdan GHILIC MICU, Ramona Camelia BERE, Adina-Maria DAN, Robert MIHAILA Cloud Computing and Smart Grids ..................................................................................... 57 Janina POPEANGĂ Data mining in Cloud Computing ........................................................................................ 67 Ruxandra-Ştefania PETRE

Database Systems Journal vol. III, no.3/2012 3
ERP and E-Business Application Deployment in Open Source Distributed Cloud Systems
George SUCIU1, Traian-Lucian MILITARU2,3, Gyorgy TODORAN3
1, 2 Faculty of Electronics, Telecommunications and Information Technology, POLITEHNICA University of Bucharest
3 Quality Department, POLITEHNICA University of Bucharest [email protected], [email protected], [email protected]
In this paper we present the way in which we combine SlapOS, the fist open source operating system for distributed cloud computing, and Enterprise Resource Modeling (ERP) to provide an simple, unified API for E-Business Applications based on Iaas, PaaS and SaaS models. SlapOS is based on a grid computing daemon – called slapgrid – which is capable of installing any software on a PC and instantiate any number of processes of potentially infinite duration of any installed software using a master-slave model. SlapOS Master follows an ERP model to handle at the same time process allocation optimization and billing. Keywords: Cloud, ERP, IaaS, PaaS, SaaS, Open Source
Introduction W
SlapOe will introduce in this article S, the first open source operating
system for Distributed Cloud Computing and ERP5, the open Source e-Business suite. SLAP stands for “Simple Language for Accounting and Provisioning” and uses Slapgrid daemon that receives requests from a central scheduler the SlapOS Master which collects back accounting information from each process. In this paper we present the way in which we combine open source grid computing for distributed cloud computing and Enterprise Resource Modeling (ERP) to provide Infrastructure as a Service (IaaS), Platform as a Service (PaaS) and Software as a Service (SaaS) through a simple, unified API for E-Business Applications. Researches in cloud computing and standardizing efforts in the IT industry are presenting the layered cloud model as shown in Figure 1. IaaS offers the infrastructure of virtual machines and storage. PaaS is built on top of IaaS and offers platform services such as operating systems, application servers and data bases. SaaS is the layer that offers services to the final user in the form of various applications: Customer
Relationship Management (CRM), ERP systems, communication systems, blogs, multimedia application systems, etc.
Figure 1. The General Cloud Model ERP systems are said to enable organizations to manage their resources efficiently and effectively by providing a total and integrated solution for their information processing needs. Due to technical and economical restrictions, ERP systems traditionally have been focused on larger organizations. In recent years however, a turn of the market towards Small and Medium Enterprises (SMEs) can be
1

4 ERP and E-Business Application Deployment in Open Source Distributed Cloud Systems
observed [1]. This shows that SMEs are as likely to be interested in ERP as multinational organizations. ERP packages are being viewed as a key factor for gaining competitive advantage in the SME sector and empirical findings confirm these expectations [2]. Business models, where SMEs access ERP functionalities through the Internet instead of purchasing them could alleviate the problems of lack of human and financial resources and broaden the ERP market. Recently Software as a Service (SaaS) is associated to this kind of business model [3]. By providing applications directly through the Internet, SaaS eliminates installation and update tasks, thus saving clients from maintenance work and reducing IT expenses by on-demand pricing [4]. Another “disruptive business model” mentioned by Hofmann [3] is that of
open source companies. Free / open source ERP systems might be an alternative for SMEs as they tackle their specific problems. They not only help to save license costs, but they also prevent lock-in. As their source code is free to everyone they lower the barrier for third parties to perform modifications [5]. 2 Characteristics of SlapOS Distributed Cloud Computing Platform SlapOS is an open source Cloud Operating system which was inspired by recent research in Grid Computing and in particular by BonjourGrid a meta Desktop Grid middleware for the coordination of multiple instances of Desktop Grid middleware. It is based on the motto that ”everything is a process”. SlapOS is now an OW2 project. Figure 2 shows the current cloud architecture model [6].
Figure 2. The SlapOS Cloud Architecture Model SlapOS defines two types of servers: SlapOS Nodes and SlapOS Master. SlapOS Nodes can be installed inside data centers or at home. Their role is to install software and run processes. SlapOS Master acts as a central directory of all SlapOS Nodes, knowing where each SlapOS Node is located and which software can be installed on each node. The role of SlapOS Master is to allocate processes to SlapOS Nodes by using the SLAP protocol.
2.1. SlapOS Architecture SlapOS Nodes and SlapOS Master exchange are interconnected through the HTTP and XML based SLAP protocol. SlapOS Master sends to each SlapOS Node a description of which software should be installed and executed. Each SlapOS Node sends to SlapOS Master a description of how much resources were used during a given period of time for accounting and billing purpose [7]. From a user point of view, SlapOS Node looks like an online shop for Cloud Computing resources. The user connects to

Database Systems Journal vol. III, no.3/2012 5
SlapOS Master through a simplified front end, selects which software he or she needs. SlapOS Master then allocates the software onto a SlapOS Node and provides the connection information to the user. The allocated software can be of any type: virtual machine, database server, application server, web cache front end, etc. 2.2. An example of SlapOS front-end From a developer point of view, as shown in Figure 3, SlapOS is a simple and universal API to create instances of any software daemon through a
programmatic interface. A simple code allows a developer to request a new instance of a memcache server by invoking the request method of SlapOS API. Memcache is a widely adopted key-value store protocol which is used to cache values in large scale web infrastructure. It is usually installed and configured by system administrators using packaging systems such RPM or DEB. In this example, a single method call does in a few seconds what a human system administrator would have done in few minutes at best.
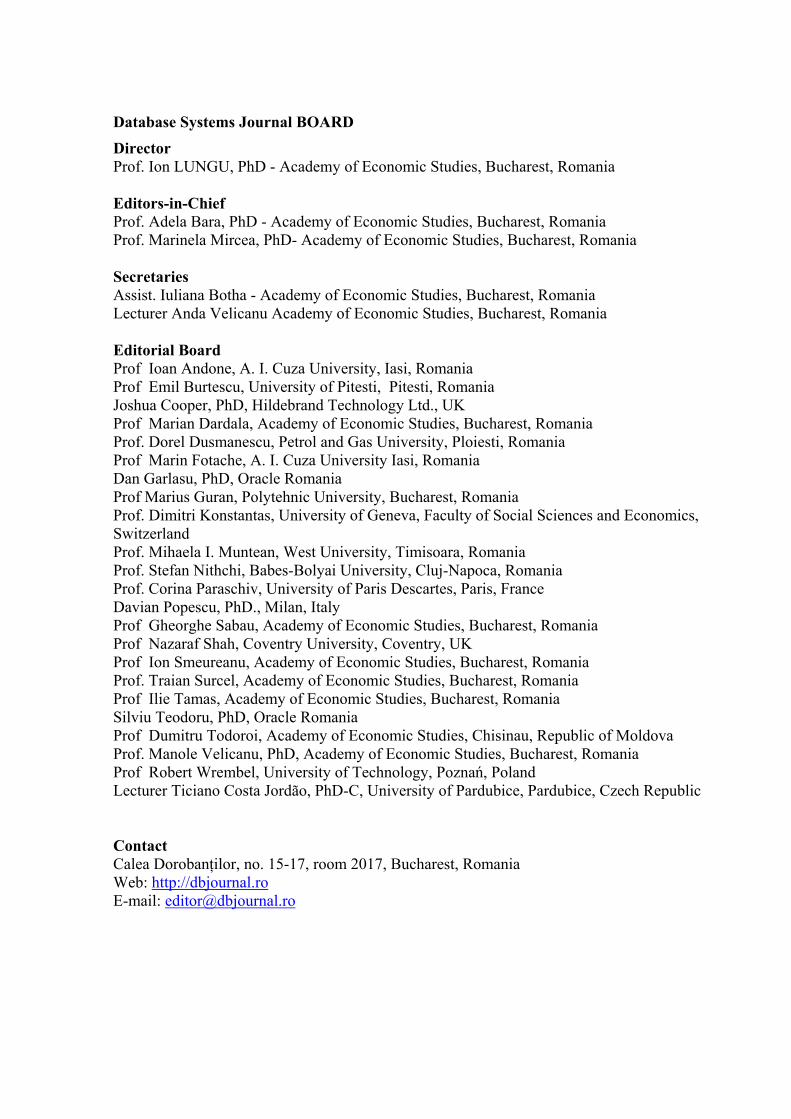
Figure 3. An example of SlapOS front-end 2.3. SlapOS Kernel SlapOS is implemented as an extension of widely adopted open source software: GNU/Linux, Buildout and Supervisord [6]. The only new software introduced by SlapOS is Slapgrid, a daemon in charge of implementing the SLAP protocol on each SlapOS Node with the functionality as depicted on Figure 4.
Each time slapgrid receives a request from SlapOS master to install a software, it downloads a description of that software in the form of so-called buildout profile. It then runs the buildout bootstrap process to install the software. Buildout is a Python-based build system for creating, assembling and deploying applications from multiple parts, some of which may be non-Python-based.
6 ERP and E-Business Application Deployment in Open Source Distributed Cloud Systems
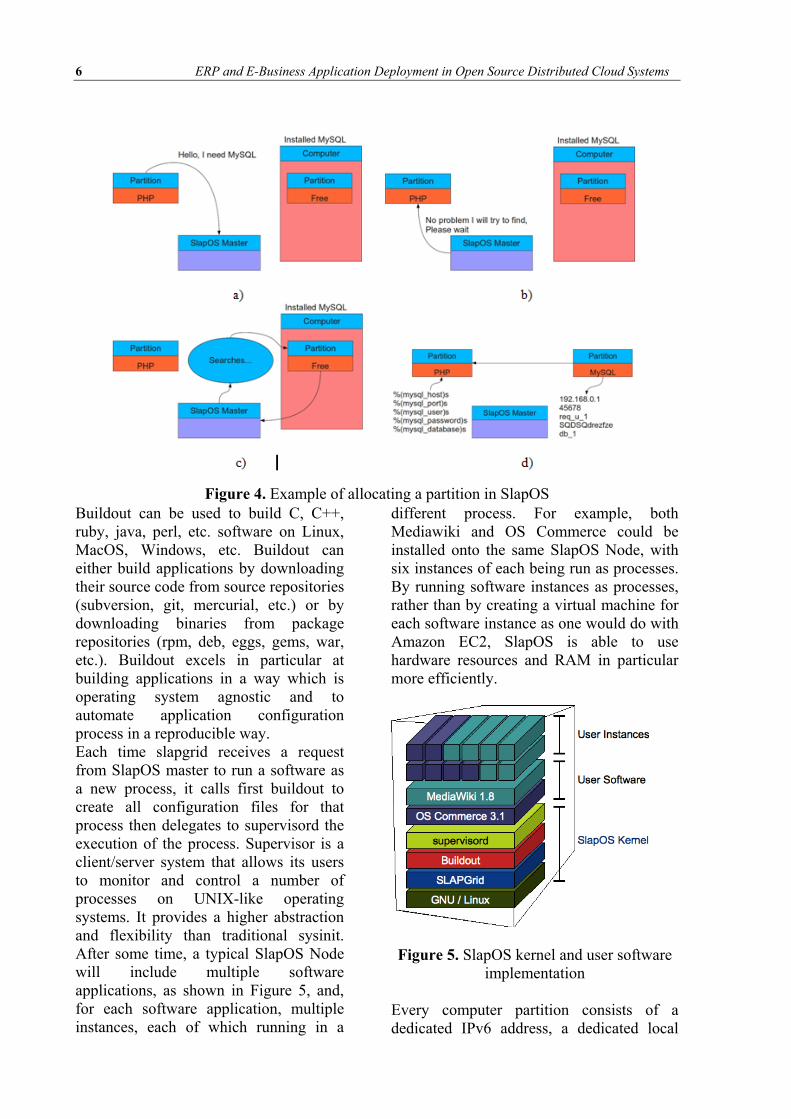
Figure 4. Example of allocating a partition in SlapOSBuildout can be used to build C, C++, ruby, java, perl, etc. software on Linux, MacOS, Windows, etc. Buildout can either build applications by downloading their source code from source repositories (subversion, git, mercurial, etc.) or by downloading binaries from package repositories (rpm, deb, eggs, gems, war, etc.). Buildout excels in particular at building applications in a way which is operating system agnostic and to automate application configuration process in a reproducible way. Each time slapgrid receives a request from SlapOS master to run a software as a new process, it calls first buildout to create all configuration files for that process then delegates to supervisord the execution of the process. Supervisor is a client/server system that allows its users to monitor and control a number of processes on UNIX-like operating systems. It provides a higher abstraction and flexibility than traditional sysinit. After some time, a typical SlapOS Node will include multiple software applications, as shown in Figure 5, and, for each software application, multiple instances, each of which running in a
different process. For example, both Mediawiki and OS Commerce could be installed onto the same SlapOS Node, with six instances of each being run as processes. By running software instances as processes, rather than by creating a virtual machine for each software instance as one would do with Amazon EC2, SlapOS is able to use hardware resources and RAM in particular more efficiently.
Figure 5. SlapOS kernel and user software
implementation Every computer partition consists of a dedicated IPv6 address, a dedicated local

Database Systems Journal vol. III, no.3/2012 7
IPv4 address, a dedicated tap interface (slaptapN), a dedicated user (slapuserN) and a dedicated directory (/srv/slapgrid/slappartN). Optionally, a dedicated block device and routable IPv4 address can be defined. SlapOS is usually configured to use IPv6 addresses. Although use of IPv6 is not a requirement (an IPv4 only SlapOS deployment is possible) it is a strong recommendation. IPv6 simplifies greatly the deployment of SlapOS either for public Cloud applications or for private Cloud applications. In the case of public Clouds, use of IPv6 helps interconnecting SlapOS Slave Nodes hosted at home without having to setup tunnels or complex port redirections. In the case of private Cloud, IPv6 replaces existing corporate tunnels with a more resilient protocol which provides also a wider and flat corporate addressing space. IPv6 addressing helps allocating hundreds of IPv6 addresses on a single server. Each running process can thus be attached to a different IPv6 address, without having to change its default port settings. Accounting network traffic per computer partition is simplified. All this would of course be possible with IPv4 or through VPNs but it would be much more difficult or less resilient. The exhaustion of IPv4 addresses prevents in practice
allocation some many public IPv4 addresses to a single computer. After one year of experimentation with IPv6 in Romania, using IPv6 native Internet access (more than 50% of worldwide IPv6 traffic), we found that IPv6 is simple to use and creates the condition for many innovations which would else be impossible. 3 Open Source ERP and E-Business Application Deployment Prototype Thanks to its abstract model, ERP5 is a very generic application system, thus many ERP5 tailoring tasks can be accomplished solely by configuration and still have great effect on how ERP5’s functionalities behave. The deployment process that we followed contains analysis, implementation and test phases. Analysis is based on interviews and document research. Its purpose is to discover resource flows and decision flows in a company. It also aims to identify the demand for implementation of custom document types. The procedure is aligned to ERP5’s document-centric approach to implement business processes. SlapOS Master runs ERP5 Cloud Engine, a version of ERP5 open source ERP capable of allocating processes in relation with accounting and billing rules, as shown in Figure 6.
Figure 6. Example of allocating a ERP instance and sending access data to user

8 ERP and E-Business Application Deployment in Open Source Distributed Cloud Systems
Initial versions of SlapOS Master were installed and configured by human. The new versions of SlapOS Masters that we use in our prototype are implemented themselves as SlapOS Nodes, in a completely reflexive ways. A SlapOS Master can thus allocate a SlapOS Master which in turn can allocate another SlapOS Master, etc. The implementation process is supported by ERP5 through a series of tools for requirements, analysis, design and implementation as well as through general process related tools [8]. ERP5 has used from the design phase a single programming language for all the parts of the application: business logic,
database interface, scripts and additional modules. The ERP5 framework is implemented in Python, a general-purpose, interpreted high-level programming language. By using a single programming language for scripts as well as the base application we have the possibility of reusing the code originally written for scripts for integration in the code of the main application. The ERP5 application is built on top of open source technologies and takes up many of the characteristics of such solutions. Therefore a good knowledge of the architecture is necessary to understand the ERP5 framework, as presented in Figure 7
Figure 7. ERP5 technology implementation
The ERP5 framework is built on the Zope Application Server, an open source application that can run on different platforms, including Linux, Windows and MacOS [9]. Zope is similar to an Apache server but highly oriented on objects. ERP5 uses Zope to:
• Publish objects (images, html files, java scripts, etc) on the Web
• Authentication and authorization of users
• Easy integration of new modules in ERP5
For data storage Zope includes Zope Object Data Base (ZODB), an object oriented database. Objects can be imported / exported in ZODB in XML format. ERP5 allows the synchronization of objects in ZODB with similar objects from other ERP5 instances by using the SyncML protocol [10]. Zope provides also the management of the ERP5 application components through the
Database Systems Journal vol. III, no.3/2012 9
Zope Content Management Framework (CMF). The CMF provides:
• storage and access to the ERP5 components
• script add • workflow change of components • archiving of existing components
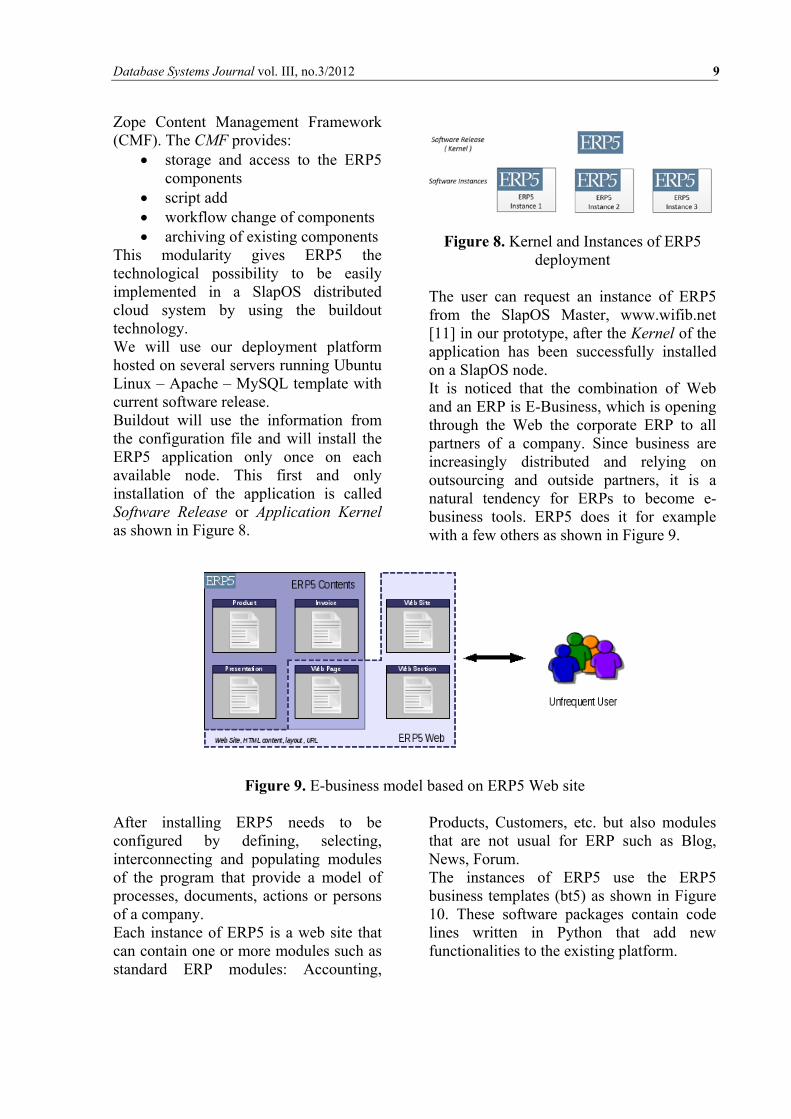
This modularity gives ERP5 the technological possibility to be easily implemented in a SlapOS distributed cloud system by using the buildout technology. We will use our deployment platform hosted on several servers running Ubuntu Linux – Apache – MySQL template with current software release. Buildout will use the information from the configuration file and will install the ERP5 application only once on each available node. This first and only installation of the application is called Software Release or Application Kernel as shown in Figure 8.
Figure 8. Kernel and Instances of ERP5 deployment
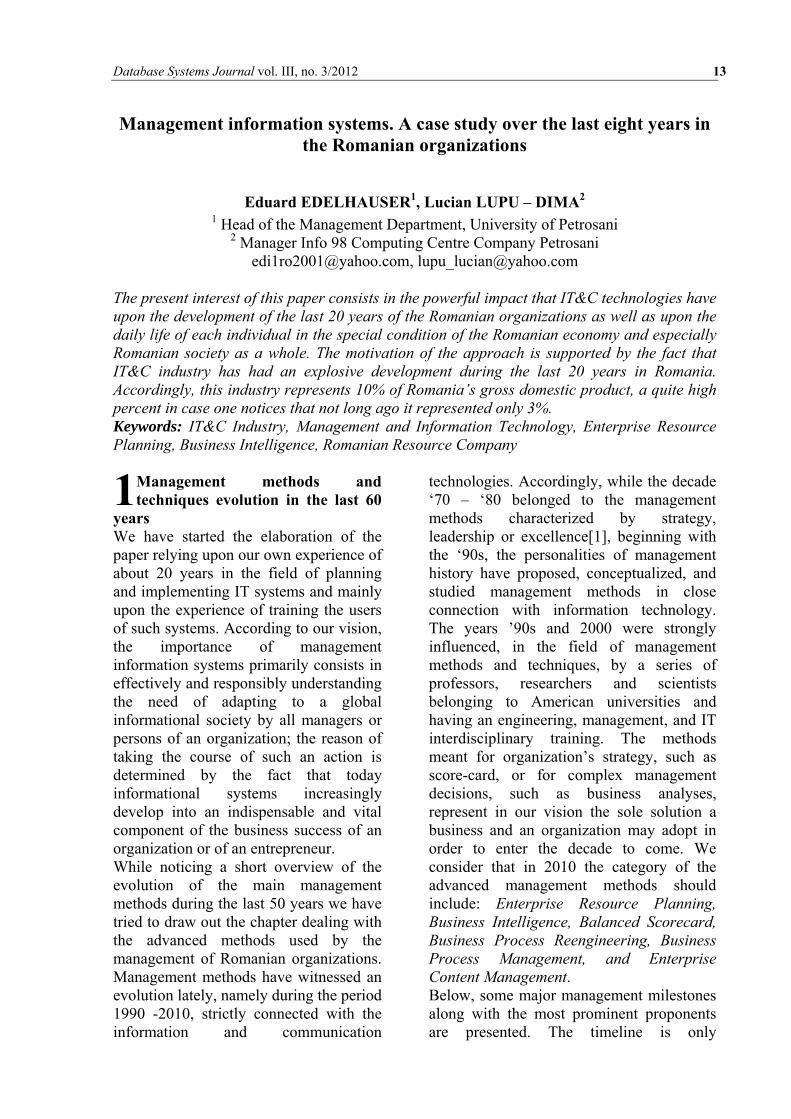
The user can request an instance of ERP5 from the SlapOS Master, www.wifib.net [11] in our prototype, after the Kernel of the application has been successfully installed on a SlapOS node. It is noticed that the combination of Web and an ERP is E-Business, which is opening through the Web the corporate ERP to all partners of a company. Since business are increasingly distributed and relying on outsourcing and outside partners, it is a natural tendency for ERPs to become e-business tools. ERP5 does it for example with a few others as shown in Figure 9.
Figure 9. E-business model based on ERP5 Web site
After installing ERP5 needs to be configured by defining, selecting, interconnecting and populating modules of the program that provide a model of processes, documents, actions or persons of a company. Each instance of ERP5 is a web site that can contain one or more modules such as standard ERP modules: Accounting,
Products, Customers, etc. but also modules that are not usual for ERP such as Blog, News, Forum. The instances of ERP5 use the ERP5 business templates (bt5) as shown in Figure 10. These software packages contain code lines written in Python that add new functionalities to the existing platform.

10 ERP and E-Business Application Deployment in Open Source Distributed Cloud Systems
Figure 10. ERP5 Business Templates
Based on the implemented scenario, several question rise regarding its performances and efficiency. SlapOS nodes report on resources used and trusting client to report billing values is a well-known security issue. The security mechanisms included in SlapOS are setup to prevent a node from cheating on billing values reported. However traffic on unencrypted links could be intercepted and it is possible for a node to join the cloud and start sniffing sensitive data. Also some time is needed before a new application gets installed on a node and becomes ready to use. Questions arise about slow response and how does the master node handle this delay? The specific provisioning strategy could be improved to always keep a buffer of ready-to-use applications. SlapOS uses buildout and a single URL to describe how to build and install software. This approach could be extended in different ways. Ideally, it should be possible to install software using other build systems or even by using packages (DEB, RPM). SlapOS should also soon serve as a platform for open source software publisher to turn their software into multi-tenant SaaS. On the other hand know how is attracted continuously by companies such as Google, Facebook and Microsoft where it remains secret. Nevertheless development is still needed for Slaprunner, the SlapOS buildout web based runner so that software profiles and release versions can be better managed and many other web-based applications
added to the software release directory. 5 Conclusions The research objective is to investigate the deployment of ERP and E-Business package on open source distributed cloud systems. This has been done on the basis of SlapOS that can leverage the resources of multiple, independent providers of computing power in order to create a resilient cloud and a single node can handle as much as 200 independent ERP databases running at the same time as tested on our deployment prototype. E-Business is in 2011 one of the very few fast growing businesses in IT and in industry. More than 1000 different solutions of E-Business are available, with fantastic open source packages available. However, E-Business integration is still difficult: people get orders from one place (ex. Ebay), follow clients on another place (ex. SalesForce CRM) and keep their accounting with Microsoft which can cost as much as 2000 Euro/seat and involves high risk of failure. Integration between the different aspects of business, on the Web or offline, is made by open source SlapOS and ERP5 to create a simple prototype in short time at low cost, because there are no license costs and is therefore probably the safest way to adopt an ERP or E-business. 6 Acknowledgment This paper is presented as part of the project “Valorificarea capitalului uman din cercetare prin burse doctorale (ValueDoc)” Project co-financed from the European

Database Systems Journal vol. III, no.3/2012 11
Social Fund through POSDRU, financing contract POSDRU/107/1.5/S/76909 and part of the project “Cloud Consulting”. References [1] A. Deep, P.Guttridge, S. Dani and N.
Burns, “Investigating factors affecting ERP selection in made-to-order SME sector,” Journal of Manufacturing Technology Management,19(4), pp. 430–446, 2008.
[2] S. C. L. Koh and M. Simpson, “Could enterprise resource planning create a competitive advantage for small businesses?,” Benchmarking: An International Journal, 14(1), pp. 59–76, 2007.
[3] P. Hofmann, “ERP is dead, long live ERP,” Internet Computing, IEEE, 12(4), pp. 84–88, July–August, 2008.
[4] L. Wang, J. Tao, M. Kunze, A. C. Castellanos, D. Kramer and W. Karl, “Scientific cloud computing: early definition and experience,” 10th IEEE international conference on High Performance Computing and Communications. New York, N.Y: Institute of Electrical and Electronics Engineers, pp. 825–830, 2008.
[5] R. Campos, R. Carvalho and J. S. Rodrigues, ”Enterprise modeling for development processes of open-source ERP,” 18th Production and Operation Management Society Conference, Dallas, TX, pp. 3-8, May 2007.
[6] J.-P. Smets, “ERP5 products documentation,” Nexedi SA. Retrieved
December 10, 2011, from https://www.myerp5.com/kb/documentation section/ (Restricted), pp. 1-9, December 2011.
[7] G. Suciu, O. Fratu, S. Halunga, C. G. Cernat, V. A. Poenaru and V. Suciu, “Cloud Consulting: ERP and Communication Application Integration in Open Source Cloud Systems,” 19th Telecommunications Forum - TELFOR 2011, IEEE Communications Society, pp. 578-581, Belgrade, Serbia, November 2011.
[8] R. Carvalho and R. M. Monnerat, “Development support tools for enterprise resource planning,” IT Professional, 10(5), pp. 39–45, Sept.–Oct. 2008.
[9] Zope site „ Zope Resources” [Online] Available at: http://www.zope.org, July 2012.
[10] A.Traud, J. Nagler-Ihlein, F. Kargl and M. Weber, “Cyclic Data Synchronization through Reusing SyncML,” The Ninth International Conference on Mobile Data Management MDM 2008, pp.165-172.
[11] J.-P.Smets-Solanes, C. Cérin and R. Courteaud, “SlapOS: A Multi-Purpose Distributed Cloud Operating System Based on an ERP Billing Model,” 2011 IEEE International Conference on Services Computing 2011 765-766.
George SUCIU graduated from the Faculty of Electronics, Telecommunications and Information Technology at the “Politehnica” University of Bucharest in 2004. He holds a Master diploma in Project Management from the Faculty of Cybernetics, Statistics and Economic Informatics of the Academy of Economic Studies Bucharest from 2010 and currently, he is a Ph.D. Student in the field of Electronics Engineering and Telecommunication. His scientific fields of interest include: project management, electronics and telecommunication, cloud computing, data

12 ERP and E-Business Application Deployment in Open Source Distributed Cloud Systems
acquisition and signal processing. Known languages: German, French, English; Experience and participation in research projects (FP7, Eureka, Eurostars, National Structural Funds), more than 10 years activity in information and telecommunication systems.
Traian-Lucian MILITARU graduated from the Faculty of Electronics, Telecommunications and Information Technology at the “Politehnica” University of Bucharest in 2004. He holds a Master diploma in Quality in Electrical Engineering from the “Politehnica” University of Bucharest from 2006 and currently he is a Ph.D. Student in the field of Quality Assurance. His research activity can be observed in many international proceedings. His scientific fields of interest include: quality assurance, telecommunication, programming and cloud computing. Currently, he is software engineer for more than 8 years, with vast experience in both
programming and quality assurance.
Gyorgy Todoran has graduated the Faculty of Electronics, Telecommunications at “Politehnica” University in Bucharest in 2000. He holds a Master degre in Quality Management (2001) and Strategic Management (2002) from the “Politehnica” University of Bucharest. Currently he is working on his Ph.D. thesis in security tehnologies with focus on open source, cloud computing, mobile and BYOD initiatives. He has more than 10 years experience in commercial and governmental telecommunication systems, mainly in system administration, system management, design, project management, consulting.
Database Systems Journal vol. III, no. 3/2012 13
Management information systems. A case study over the last eight years in the Romanian organizations
Eduard EDELHAUSER1, Lucian LUPU – DIMA2
1 Head of the Management Department, University of Petrosani 2 Manager Info 98 Computing Centre Company Petrosani
[email protected], [email protected]
The present interest of this paper consists in the powerful impact that IT&C technologies have upon the development of the last 20 years of the Romanian organizations as well as upon the daily life of each individual in the special condition of the Romanian economy and especially Romanian society as a whole. The motivation of the approach is supported by the fact that IT&C industry has had an explosive development during the last 20 years in Romania. Accordingly, this industry represents 10% of Romania’s gross domestic product, a quite high percent in case one notices that not long ago it represented only 3%. Keywords: IT&C Industry, Management and Information Technology, Enterprise Resource Planning, Business Intelligence, Romanian Resource Company
Management methods and techniques evolution in the last 60
years We have started the elaboration of the paper relying upon our own experience of about 20 years in the field of planning and implementing IT systems and mainly upon the experience of training the users of such systems. According to our vision, the importance of management information systems primarily consists in effectively and responsibly understanding the need of adapting to a global informational society by all managers or persons of an organization; the reason of taking the course of such an action is determined by the fact that today informational systems increasingly develop into an indispensable and vital component of the business success of an organization or of an entrepreneur. While noticing a short overview of the evolution of the main management methods during the last 50 years we have tried to draw out the chapter dealing with the advanced methods used by the management of Romanian organizations. Management methods have witnessed an evolution lately, namely during the period 1990 -2010, strictly connected with the information and communication
technologies. Accordingly, while the decade ‘70 – ‘80 belonged to the management methods characterized by strategy, leadership or excellence[1], beginning with the ‘90s, the personalities of management history have proposed, conceptualized, and studied management methods in close connection with information technology. The years ’90s and 2000 were strongly influenced, in the field of management methods and techniques, by a series of professors, researchers and scientists belonging to American universities and having an engineering, management, and IT interdisciplinary training. The methods meant for organization’s strategy, such as score-card, or for complex management decisions, such as business analyses, represent in our vision the sole solution a business and an organization may adopt in order to enter the decade to come. We consider that in 2010 the category of the advanced management methods should include: Enterprise Resource Planning, Business Intelligence, Balanced Scorecard, Business Process Reengineering, Business Process Management, and Enterprise Content Management. Below, some major management milestones along with the most prominent proponents are presented. The timeline is only
1
14 Management Information Systems. A Case Study over the last 8 Years in the Romanian Organizations
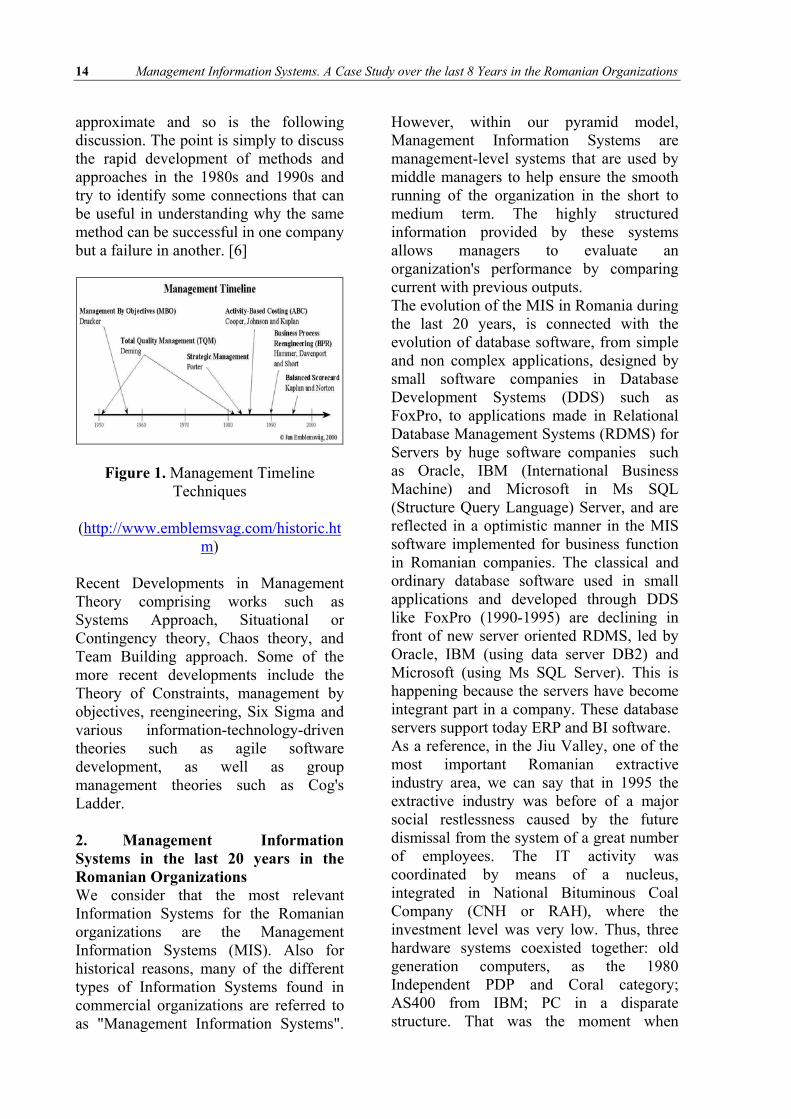
approximate and so is the following discussion. The point is simply to discuss the rapid development of methods and approaches in the 1980s and 1990s and try to identify some connections that can be useful in understanding why the same method can be successful in one company but a failure in another. [6]
Figure 1. Management Timeline Techniques
(http://www.emblemsvag.com/historic.htm)
Recent Developments in Management Theory comprising works such as Systems Approach, Situational or Contingency theory, Chaos theory, and Team Building approach. Some of the more recent developments include the Theory of Constraints, management by objectives, reengineering, Six Sigma and various information-technology-driven theories such as agile software development, as well as group management theories such as Cog's Ladder.
2. Management Information Systems in the last 20 years in the Romanian Organizations We consider that the most relevant Information Systems for the Romanian organizations are the Management Information Systems (MIS). Also for historical reasons, many of the different types of Information Systems found in commercial organizations are referred to as "Management Information Systems".
However, within our pyramid model, Management Information Systems are management-level systems that are used by middle managers to help ensure the smooth running of the organization in the short to medium term. The highly structured information provided by these systems allows managers to evaluate an organization's performance by comparing current with previous outputs. The evolution of the MIS in Romania during the last 20 years, is connected with the evolution of database software, from simple and non complex applications, designed by small software companies in Database Development Systems (DDS) such as FoxPro, to applications made in Relational Database Management Systems (RDMS) for Servers by huge software companies such as Oracle, IBM (International Business Machine) and Microsoft in Ms SQL (Structure Query Language) Server, and are reflected in a optimistic manner in the MIS software implemented for business function in Romanian companies. The classical and ordinary database software used in small applications and developed through DDS like FoxPro (1990-1995) are declining in front of new server oriented RDMS, led by Oracle, IBM (using data server DB2) and Microsoft (using Ms SQL Server). This is happening because the servers have become integrant part in a company. These database servers support today ERP and BI software. As a reference, in the Jiu Valley, one of the most important Romanian extractive industry area, we can say that in 1995 the extractive industry was before of a major social restlessness caused by the future dismissal from the system of a great number of employees. The IT activity was coordinated by means of a nucleus, integrated in National Bituminous Coal Company (CNH or RAH), where the investment level was very low. Thus, three hardware systems coexisted together: old generation computers, as the 1980 Independent PDP and Coral category; AS400 from IBM; PC in a disparate structure. That was the moment when

Database Systems Journal vol. III, no. 3/2012 15
FoxPro took place of older programming languages as Cobol and data processing for a number rather great of employees of RAH in a time of 10 times shorter than before, that was meant an unimaginable gain. In 1998-1999 because of the governmental requirements a move into another stage has been made, a stage that was considered as visionary, for that moment, and this was outsourcing. In fact, the externalization of IT services for the coal producer took place, by means of the detachment of that activity and the establishment of an independent company. The new economic conditions, corroborated with the technological progress made it possible for the number of PC to increase and then for them to develop into computer networks, easing the work not only of the software developers but also of the end users. AS400 had been used until 2001 only as an archiving system. Software instruments have been permanently developed so that in 2003 DOS application coexisted with the newer Windows applications. So, reports with many graphical elements, became much more accessible. This conditions predicted the development of integrated solutions, fact that was confirmed by the future reality. In order to demonstrate this 2004 market perspective, we have investigated the main Romanian extractive companies (most important one in coal, metal and salt - natural resources): [4] We made a managerial research, in 40 branches of these 5 companies through a variety of business functions such as manufacturing, supply chain management, financials, human resources and customer relationship management. In every business function we focus on 4, 5 or 6 important and usually applications. 3. A managerial research in the ERP field, for Romanian 2004 national natural resources companies
Methodology The instrument used for collecting data was the questionnaire. We used SPSS Statistics 17.0 to operate the answers. Using the sampling data we estimated the parameters of one regression model may be used to identify the determinants for PC and ERP applications used in a company. The managerial research is based on a questionnaire of 33 questions focused on hardware, O/S software, RDMS software endowment and implementation of the business software for five business function (manufacturing, SCM, financial, HRM and CRM). Data computing was based on data obtained from 40 firms, organized in 9 companies (90 % of the Romanian mining companies). We used regression analysis, as a statistical method to evaluate the relation between one independent variable and another continuous dependent variable. With this analysis tool we have performed a linear regression analysis using the method of the least square in order to plot a line by a set of observations. Thus we have perform the analysis of the dependence and we have appreciated the extent to which the independent variable influence the dependent. With linear regression we output the regression coefficients necessary to predict one variable from the other - that minimize error. Also we used linear regression for drawing a straight line for evaluating the dependency between independent variable called PERS and PERS_MRU, and dependent variable called PC and ACCESS_PERS_MRU. [2] To this purpose we have use the statistical analysis software SPSS as well as Excel graphs and tables. Thus the method used in data processing where the Excel tools, and the SPSS tools (multiple linear regression and curve estimation of regression lines). The questionnaire was built on the basis of a study made by professors and specialist of Auburn University of Alabama, study oriented on identifying the differences existing between the use of the information systems in the human resource management

16 Management Information Systems. A Case Study over the last 8 Years in the Romanian Organizations
in the public and private sector. In our case the questionnaire was extended over five business functions of a company, and contains eight general questions and five questions for each business function. [8] Respondents We have investigated the main national companies (most important one in coal, metal and salt - natural resources): CNH (National Bituminous Coal Company),CNLO (National Brown Coal Company), MINVEST (National Copper, Gold and Iron Company), SALROM (National Salt Company), and REMIN (National Precious Metal and Non-Ferrous Company).
Table 1. National Companies 2004 CNH 15,800 employees CNLO 16,500 employees MINVEST 4,700 employees SALROM 1,550 employees REMIN 5,200 employees
Results We used an econometrical model to explain the existing situation and the intensity of the link between the variables studied using the correlation analysis, while the regression analysis is used to estimate the value of a dependent variable taking in account the values of other independent variable, and appraise the degree wherein the effect can be explain by cause. Then we made a managerial research, through a variety of business functions such as manufacturing, supply chain management, financials, human resources and customer relationship management. In every business function we focus on 4, 5 or 6 important and usually applications. This second study was based only on the 4 biggest companies (CNH,CNLO, Minvest and Salrom) [4]
Table 2. Financial and CRM – SCM business function
Financials
AFC1 Accounts Payable and Receivable (Trial Balance, General Ledgers, Stocks )
AFC2 Business Transactions, Inventory AFC3 Fixed Assets AFC4 Others
Customer Relationship Management & Supply Chain Management
AC1 Invoices and Bills for Customers and Suppliers
AC2 Customer Management AC3 Loans AC4 Contracts AC5 Others
Figure 2. Financial and CRM – SCM
business function for the most important mining companies

Database Systems Journal vol. III, no. 3/2012 17
Table 3. Manufacturing business function for the most important mining companies
Table 4. Human resource and payroll business function for the most important mining companies Human Resource (HRM)
ARU1 Pay Roll, Flow Chart, Job Design
ARU2 Personal Record Employee ARU3 Work Book Contract ARU4 Human Resource Planning
and Scheduling ARU5 Human Resource Training
and Learning ARU6 Others
Payroll ( Wage & Remuneration ) AS1 Work Time Keeping, Time
Sheet AS2 Grid Wage AS3 Pay Rise, Weighting AS4 Job Changes AS5 Others
Figure 3. Human resource and payroll business function for the most important
mining companies
The research was focused on HRM and as we also predicted the payroll is almost 100 % implemented, but in the general HRM only the the most usual applications are implemented. [4] For most significant 22 firms (of 40), we have studied the correlation (R) between the independent variable PERS (the personal number of the firms), and the dependent variable PC (the number of personal computers owned by the firms). The following figure shows the evolution of linear regression computed through correlations and square average deviations. [2]
Figure 4. Linear regression analysis
between an independent variable called PERS and a dependent variable called PC
The quotient used for the statistical analysis shows a functional dependency between the two variable, in fact the correlation is 0.652 and the adjusted R square is 0.424. We can conclude that a linear correlation exist and the additional statistics parameter are estimates “constant” A=0.019 , and "slope" B=9.24, and the equation is linear. [2] The research has finally revealed the global IT and specific ERP implementing level in the Romanian natural resource companies as well as some problems that are country-wide valid. As we have supposed the financial business function through using ERP is
18 Management Information Systems. A Case Study over the last 8 Years in the Romanian Organizations
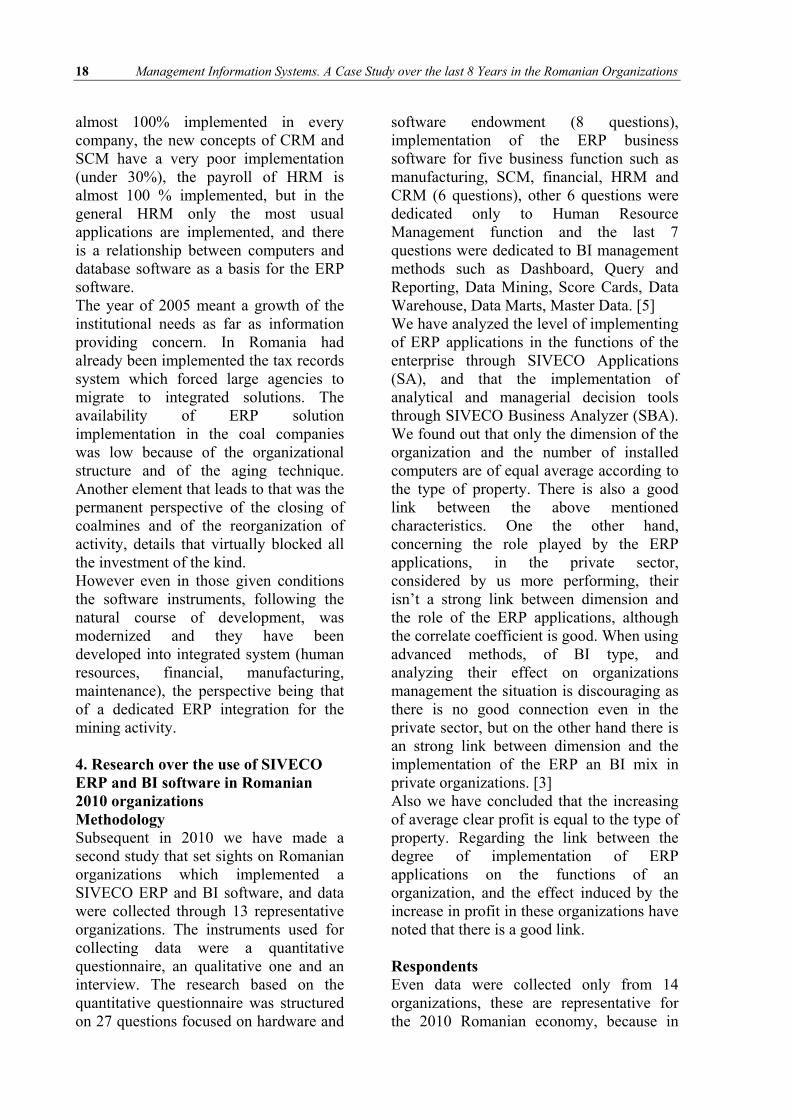
almost 100% implemented in every company, the new concepts of CRM and SCM have a very poor implementation (under 30%), the payroll of HRM is almost 100 % implemented, but in the general HRM only the most usual applications are implemented, and there is a relationship between computers and database software as a basis for the ERP software. The year of 2005 meant a growth of the institutional needs as far as information providing concern. In Romania had already been implemented the tax records system which forced large agencies to migrate to integrated solutions. The availability of ERP solution implementation in the coal companies was low because of the organizational structure and of the aging technique. Another element that leads to that was the permanent perspective of the closing of coalmines and of the reorganization of activity, details that virtually blocked all the investment of the kind. However even in those given conditions the software instruments, following the natural course of development, was modernized and they have been developed into integrated system (human resources, financial, manufacturing, maintenance), the perspective being that of a dedicated ERP integration for the mining activity. 4. Research over the use of SIVECO ERP and BI software in Romanian 2010 organizations Methodology Subsequent in 2010 we have made a second study that set sights on Romanian organizations which implemented a SIVECO ERP and BI software, and data were collected through 13 representative organizations. The instruments used for collecting data were a quantitative questionnaire, an qualitative one and an interview. The research based on the quantitative questionnaire was structured on 27 questions focused on hardware and
software endowment (8 questions), implementation of the ERP business software for five business function such as manufacturing, SCM, financial, HRM and CRM (6 questions), other 6 questions were dedicated only to Human Resource Management function and the last 7 questions were dedicated to BI management methods such as Dashboard, Query and Reporting, Data Mining, Score Cards, Data Warehouse, Data Marts, Master Data. [5] We have analyzed the level of implementing of ERP applications in the functions of the enterprise through SIVECO Applications (SA), and that the implementation of analytical and managerial decision tools through SIVECO Business Analyzer (SBA). We found out that only the dimension of the organization and the number of installed computers are of equal average according to the type of property. There is also a good link between the above mentioned characteristics. One the other hand, concerning the role played by the ERP applications, in the private sector, considered by us more performing, their isn’t a strong link between dimension and the role of the ERP applications, although the correlate coefficient is good. When using advanced methods, of BI type, and analyzing their effect on organizations management the situation is discouraging as there is no good connection even in the private sector, but on the other hand there is an strong link between dimension and the implementation of the ERP an BI mix in private organizations. [3] Also we have concluded that the increasing of average clear profit is equal to the type of property. Regarding the link between the degree of implementation of ERP applications on the functions of an organization, and the effect induced by the increase in profit in these organizations have noted that there is a good link.
Respondents Even data were collected only from 14 organizations, these are representative for the 2010 Romanian economy, because in

Database Systems Journal vol. III, no. 3/2012 19
this economical moment Romania has only 5,000 companies that need an ERP and a BI software instrument as a advanced management method. So we have only 2,000 big companies having more than 250 employees which can afford to implement a SAP, Oracle or SIVECO ERP software. But these 2,000 companies generate incomes two times higher than the other 10,000 SMB, and equal those of the 500,000 small Romanian companies, that have under 50 employees. From these 2,000 big organizations most of them are branches from trans-national companies, and have mostly implemented ERP existing in their main organization, usually SAP or Oracle. So, are likely to be investigated public organizations and private Romanian capital organizations. These two categories have a hundred percent Romanian management, and had to optimize it. [5] [7]
Results Research Hypothesis H01 The number of employees in an organization influences the role of the ERP applications within the respective organizations. The organization dimension is directly connected with the role of the ERP applications within the respective organization. H02 The implementation of the ERP applications in all the organizations departments leads to the transformation of IT into a strategic organization resource. Testing the Hypothesis For H01We used regression analysis, as a statistical method to evaluate the relation between one independent variable (personal - size of organization) and another continuous dependent variable (ERP_BI given to the ERP and BI level of implementation). With this analysis tool we have performed a linear regression analysis using the method of the least square in order to plot a line by a
set of observations. Thus we have perform the analysis of the dependence and we have appreciated the extent to which the independent variable influence the dependent. With linear regression we output the regression coefficients necessary to predict one variable ERP_BI from the other personal. The model has been confirmed to be valid because the F test value were 49,35, with significant sig. <0,05 (0,02). The regression coefficient R=0,980 shows a very strong link between the variable ERP_BI given to the ERP and BI level of implementation and the independent variable personal showing the size of the organization, for the private sector. The model explains 96,1% from the total variation of the variable personal (R2= 0,961). The rest of 3,9% is influenced by other residual factors not included in the model. In conclusion hypothesis H01 has been confirmed. But in BI methods we found a weak link (R=0,167) and also for the private sector we found R=0593<063. This regression coefficient R=0,593 shows an intermediate link in these case. [5] Table 5. Linear regression analysis between an independent variable called personal and a dependent variable called ERP_BI for private cases (proprietate=1)
Table 6. Linear regression analysis between an independent variable called personal and a dependent variable called BI for private cases (proprietate=1)
20 Management Information Systems. A Case Study over the last 8 Years in the Romanian Organizations
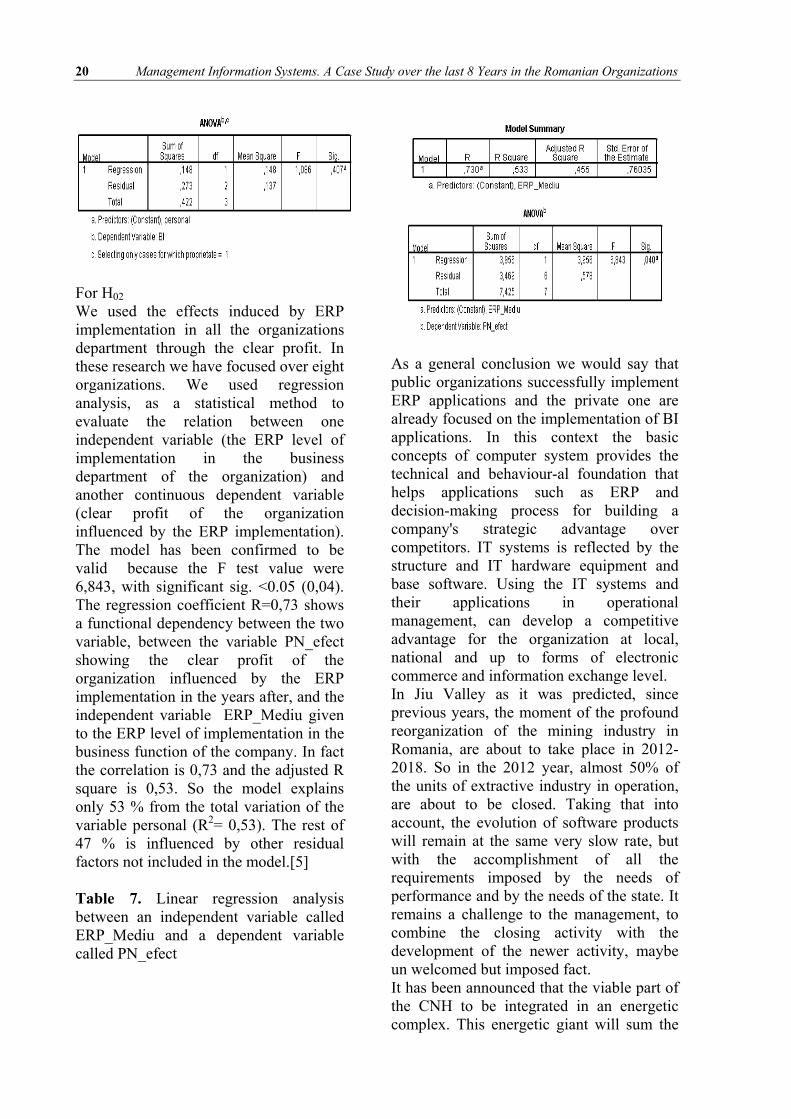
For H02 We used the effects induced by ERP implementation in all the organizations department through the clear profit. In these research we have focused over eight organizations. We used regression analysis, as a statistical method to evaluate the relation between one independent variable (the ERP level of implementation in the business department of the organization) and another continuous dependent variable (clear profit of the organization influenced by the ERP implementation). The model has been confirmed to be valid because the F test value were 6,843, with significant sig. <0.05 (0,04). The regression coefficient R=0,73 shows a functional dependency between the two variable, between the variable PN_efect showing the clear profit of the organization influenced by the ERP implementation in the years after, and the independent variable ERP_Mediu given to the ERP level of implementation in the business function of the company. In fact the correlation is 0,73 and the adjusted R square is 0,53. So the model explains only 53 % from the total variation of the variable personal (R2= 0,53). The rest of 47 % is influenced by other residual factors not included in the model.[5] Table 7. Linear regression analysis between an independent variable called ERP_Mediu and a dependent variable called PN_efect
As a general conclusion we would say that public organizations successfully implement ERP applications and the private one are already focused on the implementation of BI applications. In this context the basic concepts of computer system provides the technical and behaviour-al foundation that helps applications such as ERP and decision-making process for building a company's strategic advantage over competitors. IT systems is reflected by the structure and IT hardware equipment and base software. Using the IT systems and their applications in operational management, can develop a competitive advantage for the organization at local, national and up to forms of electronic commerce and information exchange level. In Jiu Valley as it was predicted, since previous years, the moment of the profound reorganization of the mining industry in Romania, are about to take place in 2012- 2018. So in the 2012 year, almost 50% of the units of extractive industry in operation, are about to be closed. Taking that into account, the evolution of software products will remain at the same very slow rate, but with the accomplishment of all the requirements imposed by the needs of performance and by the needs of the state. It remains a challenge to the management, to combine the closing activity with the development of the newer activity, maybe un welcomed but imposed fact. It has been announced that the viable part of the CNH to be integrated in an energetic complex. This energetic giant will sum the

Database Systems Journal vol. III, no. 3/2012 21
coal production capacity and two capacities of electric energy production. A heterogeneous system will result, a system that will have to function then to perform. Because the economic crisis that began in 2009 showed that on the market only those efficient, which keep their expenses under control can survive, it goes without saying that in our case, the future energetic complex, will be forced to do the same. The possibilities are limited or it seems to be that way for the moment. From the three entities, which will be part of the whole, one has a SIVECO ERP and the other two use more or less developed software products. Thus, or the experience of SIVECO will be extended, or another appropriate software product for the new created company will be implemented. We conclude that no matter which will be the choice of the top management of the energetic complex, that can only be only in the sense of the optimization and control. Conclusions We have chosen this research topic due to the fact that under the present social and economic circumstances the conceptualization and use of certain advanced management methods represent one of the main coordinates owing to which management asserts itself as a fundamental element of organizational culture. The period we face, places organizations in an unpredictable and instable environment; the solution of coping with such circumstances can only be provided by a performing management. Meanwhile, IT&C definitely influences the existing organizations, and management methods become decisive for the organization’s evolution. Consequently, we consider as necessary a radiography of Romanian society regarding the implementation of the advanced management methods based upon information technology capable of offering both an overall view of the
implementation level of these methods within Romanian organizations and a prefigure of what it is going to be done in Romanian society at the level of modernizing the organizations’ management. References [1] Drucker P.F., ”The practice of
Management”, Harper Paperbacks, New York, 1954.
[2]Edelhauser E., Ionică A., “Enterprise Resource Planning through Structural Founds in the Romanian Economy”, Proceedings of 6th International Conference Managment Technological Changes, 3-5 September 2009, Greece, pp. 485-488, IDS Number BMO93
[3]Edelhauser E., Ionica A., “A Business Intelligence Software Made in Romania, a Solution for Romanian Companies During the Economic Crisis”, Lectures on Modeling and Simulation 2010, Advances in Modelling and Analysis A Journal, 1258-5769, Publisher AMSE Press, Vol. 11, Issue 1, pp. 69-78
[4]Edelhauser E., Lupu-Dima L., “Enterprise Resource Planning used in Romanian Mining Companies”, Revista Minelor, No. 4, Infomin Publishing House Deva, 2010
[5]Edelhauser E., Ionică A., Lupu C., “Enterprise Resource Planning and Business Intelligence, Advanced Management Methods for Romanian Companies”, Proceedings of the 1st Management Conference: Twenty Years After, How Management Theory Works, 16-18 September 2010, Technical University of Cluj Napoca, Todesco Publishing House, pp. 63-72
[6]Emblemsvag J., Bras B., “Process Thinking - A New Paradigm for Science and Engineering”, Futures, Vol. 32, No. 7, 2000, pp. 635 – 654, 2000.
[7] Hurbean L., Danaiata D., Hurbean C., “Enterprise Applications Implementation in Romanian SME’s”, 2008.
[8] Sharma R.R.K., Sharma A., “ERP implementation in defenders and its

22 Management Information Systems. A Case Study over the last 8 Years in the Romanian Organizations
influence on manager's job: a case study.(Enterprise resource planning)”, International Journal of Business Research, March 1, 2007.
Eduard EDELHAUSER is the Head of the Management Department of the University of Petrosani. His areas of interest are management and engineering from an IT&C perspective. He has a Bachelor's degree in engineering from Transylvania University of Brasov (1991), in computer science from Technical University of Cluj Napoca (2002) and in economics from University of Petrosani (2009). He has a PhD in industrial engineering (2004) and a PhD in management from the University of Craiova (2011). He
is the author of 10 books, over 50 published scientific papers (over 40 articles are indexed in international databases, ISI proceedings, SCOPUS and 7 of them are ISI indexed), over 70 papers presented at national and international conferences, and has participated in over 30 projects of which seven were international grants. His work is centered in the ERP, eLearning and Project Management field.
Lucian LUPU DIMA is associate professor of the University of Petrosani, and the manager of the IT company Info 98 Computing Centre Company. His areas of interest are IT development, management and engineering from an IT&C perspective, data acquisition, GIS. He has a Bachelor's degree in engineering from University of Petrosani (1993). He has a PhD in electrical engineering from University of Petrosani (2004). He is the author of 2 books,
13 published scientific papers (8 articles are indexed in international databases, ISI proceedings, SCOPUS and 3 of them are ISI indexed), and has participated in over 19 projects of which seven were international grants. His work is centered in the ERP, eLearning and Project Management field.

Database Systems Journal vol. III, no. 3/2012 23
Pentaho Business Analytics: a Business Intelligence Open Source Alternative
Diana TÂRNĂVEANU
West University of Timisoara, Faculty of Economics and Business Administration, Timisoara, ROMANIA
Most organizations strive to obtain fast, interactive and insightful analytics in order to fundament the most effective and profitable decisions. They need to incorporate huge amounts of data in order to run analysis based on queries and reports with collaborative capabilities. The large variety of Business Intelligence solutions on the market makes it very difficult for organizations to select one and evaluate the impact of the selected solution to the organization. The need of a strategy to help organization chose the best solution for investment emerges. In the past, Business Intelligence (BI) market was dominated by closed source and commercial tools, but in the last years open source solutions developed everywhere. An Open Source Business Intelligence solution can be an option due to time-sensitive, sprawling requirements and tightening budgets. This paper presents a practical solution implemented in a suite of Open Source Business Intelligence products called Pentaho Business Analytics, which provides data integration, OLAP services, reporting, dashboarding, data mining and ETL capabilities. The study conducted in this paper suggests that the open source phenomenon could become a valid alternative to commercial platforms within the BI context. Keywords: business intelligence (BI), decision-making, data analysis, data warehouses
Introduction Roof
mania strives to meet the demands knowledge-based economy, such
as: flexibility, globalization, horizontal/ vertical integration, innovative enterprises, organizational learning and customer-led strategy [1]. Business Intelligence (BI) is a concept often used in Romania for the last 10 years [2]. It is not a new trend anymore, but it became a must during the last decade, being considered as a basic tool used by the modern management [3]. Having as a main goal productivity and profitability, BI systems track down trends, problems and factors as soon as they act, outlining the key performance indicators (KPI) [4]. KPIs assess or measure certain aspects of the business operations (at operational level) and business strategies (at strategic level) that may otherwise be difficult to assign a quantitative value to [5]. The four main
perspectives (Finance, Internal Business Processes, Education and Growth, Customers) provide relevant feedback for the managers’ initiatives [6]. Data analysis proved to be of a valuable importance in many sectors (such as banking, federal government, education performance management or executive scorecards for healthcare professionals); aggregating data across many dimensions being helpful for insight analysis [7], [8]. BI systems ensure obtaining of useful, correct and in-time information, usually taken from disparate data sources. They close the gap between the huge amount of data available to the decision factor, and the report analysis presented in a suggestive way that should support the decision making process [3]. BI offers sophisticate information analysis and information discovery technologies such as Data Warehouse, On-line Analytical Processing (OLAP), Data Mining, etc. BI
1
24 Pentaho Business Analytics: a Business Intelligence Open Source Alternative
solutions arrived to the third generation BI, providing access to information, advanced graphical and web-based OLAP, information mining tools and prepackaged applications that exploit the power of those tools [9]. A BI system has four major components: a data warehouse (with its data source), business analytics (a collection of tools for manipulating, mining and analyzing the data from the warehouse), business performance management (for monitoring and analyzing performance) and a user interface (connecting to the system via a browser) [10]. A data warehouse is the core component of a BI infrastructure. The dimensional model of a data warehouse consists in numeric measures, dimensions and fact tables. Related measures are collected into fact tables. The measures can be looked upon in different ways, those ways being called dimensions. A dimension is a particular area of interest such as time, geographic position, category and so on [9]. An OLAP instrument is a combination of analytical processing procedures and graphic presentations [10]. OLAP uses the word cube to describe what in the relational world would be the integration of the fact table with dimension tables [9]. It generally includes a calculation engine for adding complex analytical logic to the cube, and a query language. Because the standard relational query language (SQL) is not well suited to work with cubes, Multidimensional Expression (MDX), an OLAP-specific query language, has been developed. Data mining is a technology that uses complex algorithms for data analyzing and discovering valuable information for the decision maker [10]. The emphasis is on data’s quality to be valid, previously unknown, comprehensible and actionable. When designing the data scheme of the warehouse, the following types of schemes may be used: star, snowflake or
constellation [11]. Some of the most important factors that should be taken into account when successfully introducing a BI solution are: the BI solution should be business-oriented, rather than technology-oriented, act towards reaching the goals of the organization; a truthful partnership between management and informatics within the organization should be realized and the entire organization should be evaluated as a whole [12]. The need of a strategy for adopting a BI solution is a result of the following issues: high investment costs; the need of buying a BI solution suited for the needs of the organization; understanding the goal of implementation; the focus should be on incomes and results; it should monitor BI processes and provide feedback in order to refine and revise business strategy [12]. This paper presents a practical solution implemented in a suite of open source Business Intelligence products called Pentaho Business Analytics, providing data integration, OLAP services, reporting, dashboarding, data mining and ETL capabilities. 2 Pentaho BI – Analytics for everyone Analytics is all about gaining insights from the data for better decision making [13]. A competitor on the growing market of BI solutions, Pentaho BI is an ongoing effort by the Open Source (OS) community to provide organizations with best-in-class solutions for their enterprise BI needs. It encompasses the following major application areas: reporting, analysis, dashboards and data mining [2]. Pentaho Business Analytics (BA) enables business users to intuitively access, explore and analyze all data, enabling them to make information-driven decisions that positively impact the performance of their organizations. The collection of analysis components in Pentaho Business Analytics enables visualizations of data trends by creating static reports from an analysis data source, traversing an analysis cube, showing how

Database Systems Journal vol. III, no. 3/2012 25
data points compare by using charts, and monitoring the status of certain trends and thresholds with dashboards. The process starts by using any client tools, consolidating data from disparate sources into one canonical source and optimizing it for the metrics wanted to be analyzed; creating an analysis schema to
describe the data; iteratively improve that schema so that it meets the users' needs; and create aggregation tables for frequently computed views [14]. The architecture of an Open Source BI solution is depicted in Figure 1 [15].
Figure 1. Architecture for BI OS Platforms
Pentaho Analysis is built on the Mondrian relational online analytical processing (ROLAP) engine. Relational OLAP (ROLAP) supports relational database management systems (RDBMS) products through the use of metadata layer, avoiding the requirement to create a static multidimensional data structure [9]. ROLAP relies on a multidimensional data model that, when queried, returns a dataset that resembles a grid. The rows and columns that describe and bring meaning to the data in that grid are dimensions, and the hard numerical values in each cell are the measures or facts. In Pentaho Analyzer, dimensions are shown in yellow and measures are in blue [14]. ROLAP requires a properly prepared data source in the form of a star or snowflake schema that defines a logical multi-dimensional database and
maps it to a physical database model. Once the data structure is in place, a descriptive layer should be designed for it, in the form of a Mondrian schema, which consists of one or more cubes, hierarchies, and members. Mondrian schemas are XML models that have cube-like structures which use fact and dimension tables found in a relational database. A Mondrian schema is created using Schema Workbench or generated by the Data Source Wizard, (either through a manually-entered SQL query, an auto-query written against one fact table, multiple database tables joined to a fact table, or a CSV file). In this paper, BA Server Enterprise Edition (version 4.5) was used, in order to develop an analysis made for the main indicators in the Research-Development activity by sector of performance and type of ownership. BA Server Enterprise Edition

26 Pentaho Business Analytics: a Business Intelligence Open Source Alternative
includes two graphical user interfaces: User Console and Enterprise. The Pentaho User Console, includes:
1. Interactive Reporting for quick and easy data-driven reports;
2. Pentaho Analyzer for ROLAP-based reports and charts;
3. Pentaho Dashboard Designer for informative overviews of key performance indicators (KPI).
Pentaho Enterprise Console gives system administrators, IT managers, CIOs, and database administrators control over most aspects of BA Server configuration, management, and security [14]. 1. Pentaho Interactive Reporting provides a Web-based, drag-and-drop interface that allows adding elements to the report layout quickly and easily. Available features include: font selection, column resizing, column sorting, ability to rename column headers, copy and past functionality, unlimited undo and redo functionality, ability to output reports as HTML, PDF, CSV, or Excel files and ability to display reports in a dashboard. The data source for an Interactive Report is based on a metadata model. Queries are generated based on the metadata selection [14]. 2. Pentaho Analyzer is an interactive analysis tool that provides a rich Web-based, drag-and-drop user interface, which makes it easy to create reports based on exploration of the data. Pentaho Analyzer reports can be displayed in a dashboard. Pentaho Analyzer reports allow exploring data dynamically and drilling down into the data to discover previously hidden details. It presents data multi-dimensionally and allows selecting dimensions and measures. It is used to drill, slice, dice, pivot, filter, chart data and create calculated fields. 3. In order to create a dashboard in Dashboard Designer, a layout template, theme, and the content should be selected. In addition to displaying content generated from action sequences,
Interactive Reporting, and Analyzer, Dashboard Designer can also include: Charts: simple bar, line, area, pie, and dial charts created with Chart Designer; Data Tables: tabular data and URLs: Web sites. Dashboard Designer has dynamic filter controls, which enables end-users to change a dashboard's details by selecting different values from a drop-down list, and to control the content in one dashboard panel by changing the options in another (content linking). Using different combinations and controls, BI Dashboards provide a view of the features of the business monitoring environment [1]. 3 Developing an Open Source BI solution Today's BI architecture typically consists of a data warehouse (or one or more data marts), which consolidates data from several operational databases, and serves a variety of front-end querying, reporting, and analytic tools. 3.1 Establishing the future measures The indicators considered for the analysis were the ones provided by [16] – Research-Development activity by sectors of performance and type of ownership – Figure 2. In table presented below, related to the following fields: ownership type (state majority, private majority), years (2000-2009), gender (men, women), sector of performance (enterprises sector, government sector, tertiary education sector and private non-profit sector); the values for the following indicators are given: employees (number) end of year, employees number of persons in full-time equivalent, total expenditure, current expenditure and capital expenditure (investments) lei thou current prices. The analysis was made based on these measures: • M1 – employees number at the end of
the year and employees – number of persons in full time equivalent, with regards to the sector of performance and ownership type;
• M2 – employees number at the end of the year and employees – number of

Database Systems Journal vol. III, no. 3/2012 27
persons in full time equivalent, with regards to the sector of performance;
• M3 – employees number at the end of the year and employees – number of persons in full time equivalent, with regards to the ownership type, sectors of performance and gender;
• M4 – total expenditure, capital
expenditure (investments) and current expenditure (lei thou current prices) with regards to ownership type and sectors of performance;
• M5 – total expenditure (lei thou current prices) with regards to sectors of performance and years.
Figure 2. Main indicators for Research-Development Activity
3.2 Analyzing data sources The data base was created using
Microsoft Access 2007, proposing the following data scheme – Figure 3.
Figure 3. Research Development Database

28 Pentaho Business Analytics: a Business Intelligence Open Source Alternative
3.3 Implementation aspects With regards to the business requirements and as a result of a complex data analysis, the data model will ground the logical design of the data warehouse [2]. Facts and dimensions, building a multidimensional approach (Figure 4)
will be established. The constellation data schema was used. For each measure defined before, a fact table was created: M1 – EmployeeOPY, M2 – EmployeePY, M3 – Employee OPG, M4 – Expenditure OPY and M5 – Expenditure PY.
Figure 4. The data warehouse model
The data source was loaded into the BI system by importing it as a csv file.
Corrections had to be made to the default proposal, so the data source scheme suits the analysis needs – Figure 5.
Figure 5. The Data Source Model

Database Systems Journal vol. III, no. 3/2012 29
Using the Analysis functionality from the Pentaho User Console in order to display in a more intuitive way the first measure
(M1) established at the beginning, EmployeeOPY fact table was used – Figure 6.
Figure 6. Measure M1
Using the same Analysis functionality, a chart was created in order to display employee’s number at the end of the year and employees – number of persons in full time equivalent, with regards to the sector of performance and years – Figure 7. Facts table EmployeePY was used,
In the chart on the OX axis the aggregated values of employees at the end of the year and employees – nmber of persons in full time equivalent are displayed, and on OY axis, the years are displayed. The legend displays different colors for each combination column-measure.
Figure 7. Measure M2

30 Pentaho Business Analytics: a Business Intelligence Open Source Alternative
The Report functionality was used in order to create a report that displays employees number at the end of the year and employees – number of persons in full time equivalent, with regards to the ownership type, sectors of performance and gender – Figure 8. Facts table
EmployeeOPG was used, considering ownership type as a group, performance sectors and gender – as columns and employees at the end of the year and employees number of persons in full time equivalent as measure. A filter was applier, so that only year 2009 is displayed.
Figure 8. Measure M3
Dashboards increase the analytical power of the visualization by allowing multiple perspectives on the dataset in the same location. Several content types are available: Charts, Data Tables, URLs, and Files created before using the Analysis or Report features. A template with 4 visualizations was chosen. When creating a dashboard, the
Data Table content type allows a tabular representation of a database query in a dashboard. It also allows the manipulation of the data, directly from the dashboard. The first box, from up left corner, corresponds to the measure M4, ExpenditureOPY fact table being used. The result can be seen in Figure 9.

Database Systems Journal vol. III, no. 3/2012 31
Figure 9. The data table for M4 For the top right-hand side – a chart-type visualization was chosen, in order to display measure M5, using ExpenditurePY fact table. The Chart Designer allows creating bar, pie, line, dial, and area charts that can be added to a dashboard. When building a chart, a data source has to be selected, then a query built on that data source. The selected columns for the query were
performance sectors and years, and for the aggregation function, SUM, applied to the field total expenditure. Performance sectors dimension was chosen as a series column, years as a category columns and total expenditure dimension as values column. Total expenditure (lei thou current prices) is displayed, with regards to sectors of performance and years – Figure 10.
Figure 10. Measure M5

32 Pentaho Business Analytics: a Business Intelligence Open Source Alternative
The previous analysis (the chart) and report are displayed on the two remaining
boxes from the lower part of the dashboard – Figure 11.
Figure 11. Dashboard displaying M2, M3, M4 and M5 We obtain a complete analysis of the main indicators for Research-Development activity by sectors of performance and type of ownership, much more intuitive and insightful that the original data table – Figure 4. 4 Conclusions Because of the vast variety of BI solutions on the market, each organization must decide which solution contribute more effectively to achieving the goals of the organization, evaluating the costs/benefits [12]. It is estimated that today more than 60% of companies and governments worldwide use some form of open source software, either as a known resource or as a resource embedded in other applications, many of which are vendor supplied. Open source solutions are now becoming serious alternatives to proprietary software with ever increasing open source projects providing a wide variety
of tools for data warehousing and full BI suites. Pentaho Business Analytics allows IT to rapidly develop and deploy a secure, scalable, flexible and easy to manage business analytics platform [14]. Open Source BI Platforms provide a sufficient level of reliability even though they are not so sophisticated as commercial ones, especially in small and medium-size enterprises where the quantity of data and the workload are not critical points [15]. Because of the evolution of information and communication technology, organizations strive to operate as intelligent organizations. It is necessary to develop an agile Business Intelligence solution with the help of modern technologies such as Service Oriented Architecture, Business Process Management, Business Rules, Cloud Computing and Master Data Management [1].

Database Systems Journal vol. III, no. 3/2012 33
References [1] M. Mircea, B. Ghilic-Micu, M.
Stoica, ”An Agile Architecture Framework that Leverages the Strengths of Business Intelligence, Decision Management and Service Orientation”, Business Intelligence - Solution for Business Development, ISBN: 978-953-51-0019-5, InTech, Available from: http://www.intechopen.com/books/business-intelligence-solution-for-business-development/an-agile-architecture-framework-that-leverages-the-strengths-of-business-intelligence-decision-manag
[2] D. Târnăveanu, M. Muntean, ”Free Business Intelligence – An Easy and Reliable Alternative”, Mathematical Models & Methods in Applied Sciences, WSEAS Press, pp. 158-164, ISBN 978-1-61804-098-5, available at SSRN: http://ssrn.com/abstract=2143945
[3] A.R. Bologa, R. Bologa, ”Business Intelligence using Software Agents”, Database Systems Journal, vol.II, no.4/2011, available at http://dbjournal.ro/archive/6/4_Bologa.pdf
[4] M. Muntean, D. Târnăveanu, A. Paul, ”BI Approach for Business Performance”, Proceedings of the 5th WSEAS International Conference on Economy and Management Transformation (Volume II), Timişoara, 2010, pp. 792-797, available at http://papers.ssrn.com/sol3/papers.cfm?abstract_id=1732190
[5] M. Muntean, ”Business Intelligence Approaches”, Published in: Mathematical Models & Methods in Applied Sciences, Vol. I, WSEAS Press, (10. June 2012): pp. 192-196
[6] M. Muntean, L.G. Cabau, ”Business Intelligence Approach In A Business Performance Context”, Online at http://mpra.ub.uni-muenchen.de/29914/, MPRA Paper
No. 29914, posted 28. March 2011 / 19:42
[7] M.C. Voicu, ”Algorithms used to obtain aggregated value sets from relational databases”, 9th WSEAS Int. Conf. on MATHEMATICS & COMPUTERS IN BUSINESS AND ECONOMICS (MCBE '08), Bucharest, 2008, pp.209-221, available at http://www.wseas.us/e-library/conferences/2008/bucharest/mcbe/34mcbe.pdf
[8] M. Voicu, G. Mircea, ”Constructing and Exploiting Hypercubes in order to Obtain Aggregated Values”, WSEAS Transactions on Information Science and Applications, Issue 10, Volume 3, October 2006, pp. 2008-2015
[9] M. Muntean., C. Brândaş, ”Business Intelligence Support Systems and Infrastructures”, Economy Informatics, 2007, No. 7, pp. 100-104, 2007, available at SSRN: http://ssrn.com/abstract=1082465
[10] A. Butuza, I. Hauer, C. Muntean, A. Popa, ”Increasing the Business Performance using Business Intelligence”, Analele Universităţii “Eftimie Murgu” Reşiţa, anul XVIII, nr.3, 2011, pp. 67-72, available at http://anale-ing.uem.ro/2011/C9.pdf
[11] M. Mircea, A.I. Andreescu, ”Agile Development for Service Oriented Business Intelligence Solutions”, Database Systems Journal, vol.II, no.1/2011, available at http://dbjournal.ro/archive/3/5_Mircea_Andreescu.pdf
[12] B. Ghilic-Micu, M. Mircea, M. Stoica, ”The Audit of Business Intelligence Solutions”, Informatica Economică vol. 14, no. 1/2010, available at http://revistaie.ase.ro/content/53/07%20Ghilic,%20Mircea,%20Stoica.pdf
[13] G. Gligor, S. Teodoru, ”Oracle Exalytics for Speed-f-thought Analytics ”, Database Systems Journal, vol.II, no.4/2011, available at http://dbjournal.ro/archive/6/1_Gligor_Teodoru.pdf
[14] http://www.pentaho.com/

34 Pentaho Business Analytics: a Business Intelligence Open Source Alternative
[15] M. Golfarelli, ”Open Source BI Platforms: a Functional and Architectural Comparison”, Proceeding DaWaK '09 Proceedings of the 11th International Conference on Data Warehousing and Knowledge Discovery, pages 287 - 297, available at
http://bias.csr.unibo.it/golfarelli/papers/DAWAK09%20-%20Golfarelli.pdf [16]http://www.insse.ro/cms/files/Anuar%20statistic/13/13%20Stiinta,%20tehnologie%20si%20inovare_ro.pdf
Diana TÂRNĂVEANU has graduated the Faculty of Mathematics from the West University
of Timişoara in 1995. She holds a PhD diploma in Management from 2008. Currently she is lecturer of Economic Informatics within the Department of Business Information Systems at Faculty of Economics and Business Administration from the West University of Timişoara. She is teaching advances in database management systems, business intelligence and decision support systems. She is the author of more than 10 books and over 35 journal articles in the field of Knowledge Management, Decision Support Systems, Collaborative Systems and Business Intelligence.

Database Systems Journal vol. III, no. 3/2012 35
New e-learning method using databases
Andreea IONESCU Hyperion University from Bucharest
Academy of Economic Studies, Institute for Doctoral Studies [email protected]
The objective of this paper is to present a new e-learning method that use databases. The solution could pe implemented for any typeof e-learning system in any domain. The article will purpose a solution to improve the learning process for virtual classess. Keywords: virtual classes, AJAX, dynamic web language, databases, e-learning;
Introduction In
trying our days many companies are to create the project e-learning
system in order to offer the best training from distance. E-learning intersects numerous fields and practice anc cannot be trivialized into a sample formula for success. Therefore our paper will try to include the database system as a bridge between traditional learning and modern learning.When e-learning was first introduced, it was widely promoted as a means of electronic networks or CD-ROM’s. It fails learners as individuals and fails to take into account the social context in which e-learning occurs. Such as, approach relies in one way communication from teacher to learner attending individual and fails to take into account the social context in which e-learning occurs.
Figure 1. Classic e-learning Like any process, e-learning depends on effective communication between teacher and student, whether this occurs in a face-
to-face classroom or across the Internet. Our paper research is based on the fact that communication can be simulated by using a human knowledge database or using a real person that has the knowledge required.
Figure 2. The proposed solution for a new e-learning Let consider a prqactical lesson for a virtual classroom named identification of the best marketing strategy. None professor could use for simulating a real marketing campaign only text books, specialized programs but also show slides data sheets, pictures of real objects, or other media resources. Our research will try to identify how many students are working better and understand more when they are using an interactive program construct on databases. The interactive program will offer them the possibility to build step a marketing campaign using an interactive simulating model of a company in connection with a lot of marketing factors. First we gave to the learners in text books and pictures of real
1
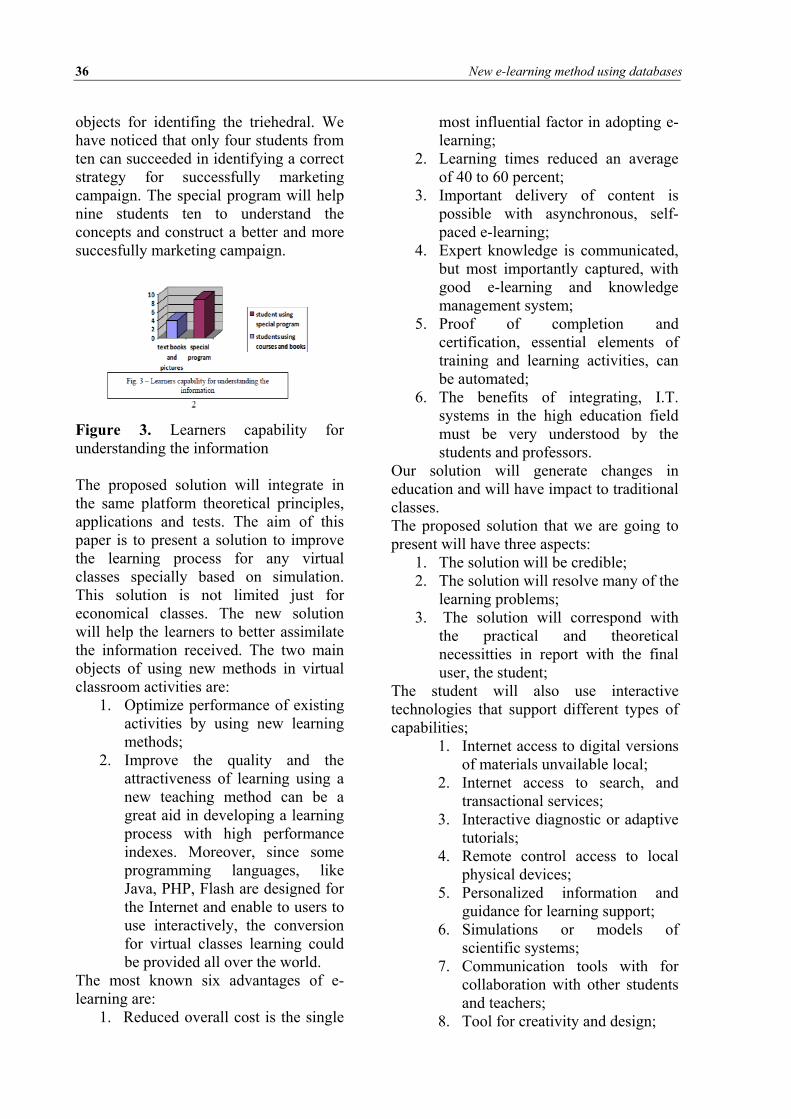
36 New e-learning method using databases
objects for identifing the triehedral. We have noticed that only four students from ten can succeeded in identifying a correct strategy for successfully marketing campaign. The special program will help nine students ten to understand the concepts and construct a better and more succesfully marketing campaign.
Figure 3. Learners capability for understanding the information The proposed solution will integrate in the same platform theoretical principles, applications and tests. The aim of this paper is to present a solution to improve the learning process for any virtual classes specially based on simulation. This solution is not limited just for economical classes. The new solution will help the learners to better assimilate the information received. The two main objects of using new methods in virtual classroom activities are:
1. Optimize performance of existing activities by using new learning methods;
2. Improve the quality and the attractiveness of learning using a new teaching method can be a great aid in developing a learning process with high performance indexes. Moreover, since some programming languages, like Java, PHP, Flash are designed for the Internet and enable to users to use interactively, the conversion for virtual classes learning could be provided all over the world.
The most known six advantages of e-learning are:
1. Reduced overall cost is the single
most influential factor in adopting e-learning;
2. Learning times reduced an average of 40 to 60 percent;
3. Important delivery of content is possible with asynchronous, self-paced e-learning;
4. Expert knowledge is communicated, but most importantly captured, with good e-learning and knowledge management system;
5. Proof of completion and certification, essential elements of training and learning activities, can be automated;
6. The benefits of integrating, I.T. systems in the high education field must be very understood by the students and professors.
Our solution will generate changes in education and will have impact to traditional classes. The proposed solution that we are going to present will have three aspects:
1. The solution will be credible; 2. The solution will resolve many of the
learning problems; 3. The solution will correspond with
the practical and theoretical necessitties in report with the final user, the student;
The student will also use interactive technologies that support different types of capabilities;
1. Internet access to digital versions of materials unvailable local;
2. Internet access to search, and transactional services;
3. Interactive diagnostic or adaptive tutorials;
4. Remote control access to local physical devices;
5. Personalized information and guidance for learning support;
6. Simulations or models of scientific systems;
7. Communication tools with for collaboration with other students and teachers;
8. Tool for creativity and design;
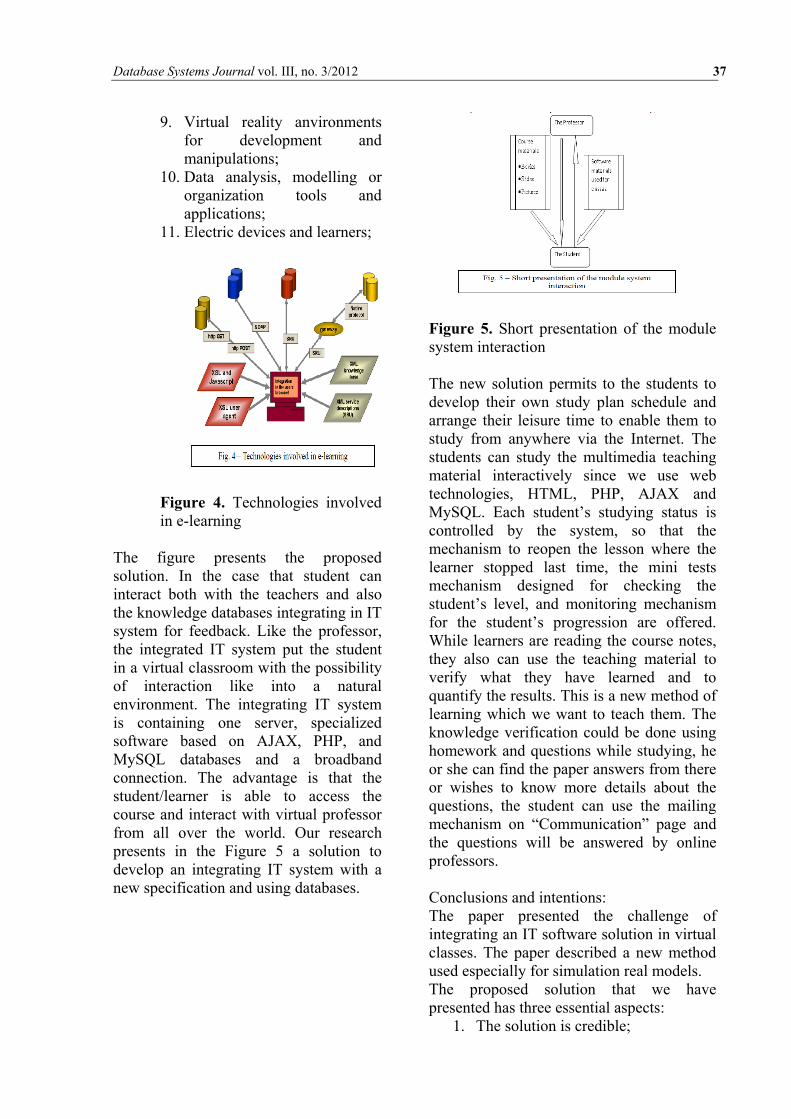
Database Systems Journal vol. III, no. 3/2012 37
9. Virtual reality anvironments for development and manipulations;
10. Data analysis, modelling or organization tools and applications;
11. Electric devices and learners;
Figure 4. Technologies involved in e-learning
The figure presents the proposed solution. In the case that student can interact both with the teachers and also the knowledge databases integrating in IT system for feedback. Like the professor, the integrated IT system put the student in a virtual classroom with the possibility of interaction like into a natural environment. The integrating IT system is containing one server, specialized software based on AJAX, PHP, and MySQL databases and a broadband connection. The advantage is that the student/learner is able to access the course and interact with virtual professor from all over the world. Our research presents in the Figure 5 a solution to develop an integrating IT system with a new specification and using databases.
Figure 5. Short presentation of the module system interaction The new solution permits to the students to develop their own study plan schedule and arrange their leisure time to enable them to study from anywhere via the Internet. The students can study the multimedia teaching material interactively since we use web technologies, HTML, PHP, AJAX and MySQL. Each student’s studying status is controlled by the system, so that the mechanism to reopen the lesson where the learner stopped last time, the mini tests mechanism designed for checking the student’s level, and monitoring mechanism for the student’s progression are offered. While learners are reading the course notes, they also can use the teaching material to verify what they have learned and to quantify the results. This is a new method of learning which we want to teach them. The knowledge verification could be done using homework and questions while studying, he or she can find the paper answers from there or wishes to know more details about the questions, the student can use the mailing mechanism on “Communication” page and the questions will be answered by online professors. Conclusions and intentions: The paper presented the challenge of integrating an IT software solution in virtual classes. The paper described a new method used especially for simulation real models. The proposed solution that we have presented has three essential aspects:
1. The solution is credible;
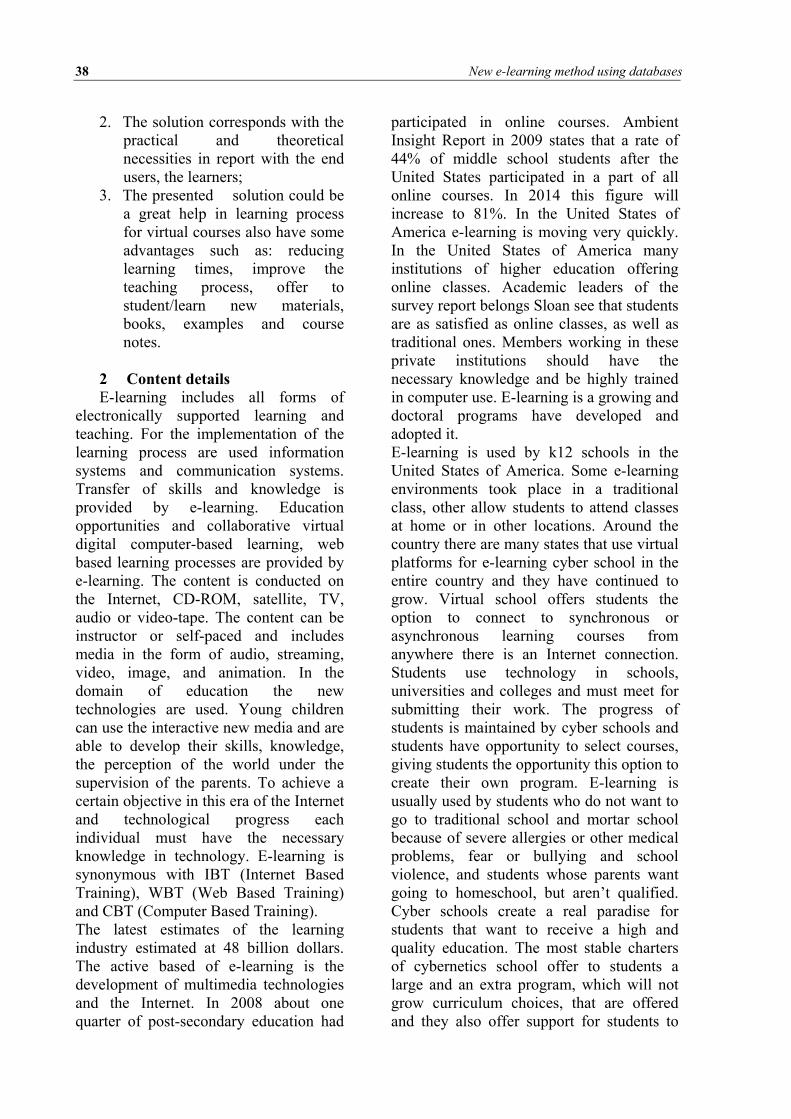
38 New e-learning method using databases
2. The solution corresponds with the practical and theoretical necessities in report with the end users, the learners;
3. The presented solution could be a great help in learning process for virtual courses also have some advantages such as: reducing learning times, improve the teaching process, offer to student/learn new materials, books, examples and course notes.
2 Content details E-learning includes all forms of
electronically supported learning and teaching. For the implementation of the learning process are used information systems and communication systems. Transfer of skills and knowledge is provided by e-learning. Education opportunities and collaborative virtual digital computer-based learning, web based learning processes are provided by e-learning. The content is conducted on the Internet, CD-ROM, satellite, TV, audio or video-tape. The content can be instructor or self-paced and includes media in the form of audio, streaming, video, image, and animation. In the domain of education the new technologies are used. Young children can use the interactive new media and are able to develop their skills, knowledge, the perception of the world under the supervision of the parents. To achieve a certain objective in this era of the Internet and technological progress each individual must have the necessary knowledge in technology. E-learning is synonymous with IBT (Internet Based Training), WBT (Web Based Training) and CBT (Computer Based Training). The latest estimates of the learning industry estimated at 48 billion dollars. The active based of e-learning is the development of multimedia technologies and the Internet. In 2008 about one quarter of post-secondary education had
participated in online courses. Ambient Insight Report in 2009 states that a rate of 44% of middle school students after the United States participated in a part of all online courses. In 2014 this figure will increase to 81%. In the United States of America e-learning is moving very quickly. In the United States of America many institutions of higher education offering online classes. Academic leaders of the survey report belongs Sloan see that students are as satisfied as online classes, as well as traditional ones. Members working in these private institutions should have the necessary knowledge and be highly trained in computer use. E-learning is a growing and doctoral programs have developed and adopted it. E-learning is used by k12 schools in the United States of America. Some e-learning environments took place in a traditional class, other allow students to attend classes at home or in other locations. Around the country there are many states that use virtual platforms for e-learning cyber school in the entire country and they have continued to grow. Virtual school offers students the option to connect to synchronous or asynchronous learning courses from anywhere there is an Internet connection. Students use technology in schools, universities and colleges and must meet for submitting their work. The progress of students is maintained by cyber schools and students have opportunity to select courses, giving students the opportunity this option to create their own program. E-learning is usually used by students who do not want to go to traditional school and mortar school because of severe allergies or other medical problems, fear or bullying and school violence, and students whose parents want going to homeschool, but aren’t qualified. Cyber schools create a real paradise for students that want to receive a high and quality education. The most stable charters of cybernetics school offer to students a large and an extra program, which will not grow curriculum choices, that are offered and they also offer support for students to

Database Systems Journal vol. III, no. 3/2012 39
have complete success. One of those programs includes: Assistance Student Program for students that want to fight with other domains as teachers. Open coordination for those students who need extra support, carrier orientation, a lecture title, Gifted Education Services, special educational services, trips to grow socialization in a cybernetic environment. Island of study helps the students to like mathematics. The supervisor monitors the progress of the students and offers communication to students for orientation and coordination in the carrier. The private schools are online available. These offer the benefits for e-learning for students in the states in which charter cybernetics school aren’t available. Corporate E-learning was adopted and utilized form different companies to inform and educate the engagers and the clients. The companies with channels of distribution have utilized channels to educate the personnel of sales about the evolution of the products, without the need of organization of physical courses. At the beginning of 1960’s the teachers of psychology from Stanford University Patrick Suppers and Richard C. Atkinson have experimented the use of computers for teaching mathematics and lecture for child in schools from East Paulo Alto, California. The Program Standford Education for Young Gifted has the beginnings in that early experiment. In 1963, Bernard Luskin had installed the first computer in a community college of industry and has worked to the development of instruction assisted on computers. Luskin have turned off the reference point of his dissertation at UCLA with Rand Corporation, in the analysis of obstacles at computers assisted. The first systems of e-learning, based on computers Computer Based Learning Training try to reproduce the criticize styles for teaching in which the role of the systems of e-learning was
assumed for the transfer of knowledge and the following systems next developed on computers –CSCL ( the collaborative learning) have encouraged the development in common of knowledge. In 1993 William D. Graziadei had described a course about online computers, tutorials and evaluation projects with electronic email. Until 1994 the first online school was elaborated. In 1997 Graziadei, W. D. had published an article entitled “The Construction of Learning Teaching Asynchronous and Synchronous Environment Exploration of a Course / The Solution of a class about Management System. They have described a process at University of State from New York ( Suny ) about the evaluation of products and the elaboration of a global strategy for the development of a course based on technology and management in the process of learning-teaching. The product must be easy for utilization and administered, portable, repeatable, scalable and easy accessible and must have a high probability of success for long term and with cost-efficiency. Today the technology can be multiple and are utilized in e-learning, from blogs for collaborative software, e-Portfolios and virtual classroom. The most situations of e-learning use combination of those techniques. E-learning 2.0 The term of E-learning 2.0 represents a neologism for CSCL systems that came in time of appearance of Web 2.0 about a conventional perspective of e-learning based on instruction patches, that were delivered to student to utilize missions. The tasks were evaluated by the teacher. The new places of e-learning have grown and were accented on social learning and use of social software, like, blogs, wiki, podcast and virtual world like Second Life. This phenomenon was mentioned like learning with long queue. E-learning 2.0 is not based on CSCL, that suppose the knowledge (to understand) is constructed social. The learning is placed with conversation on the content and interaction about problems and actions. It

40 New e-learning method using databases
must be remarked that a lot of online courses like those developed by Murray Turoff and Starr Hiletz Roxanne, in 1970 and 1980 at New Jersey Institute of Technology, courses at the University from Galph from Canada, British Open University and online at distance courses from the University of British Columbia have utilized always on-line discussion with students. The practitioners like Herasim based on using networks for learning and construction knowledge until the term e-learning 2.0. Exist a higher utilization of the virtual classes (on-line presentation, delivered directly) like an online learning platform and classroom for a diverse set of learning providers, like the state college from Minesota and universities from Sachem School District. In plus the social networks became an important part of e-learning 2.0. Social networks were used for promotion of on-line learning communities on subjects like preparation and testation of the education language. Mobile Assisted Language Learning (MALL) represents a term that describes the usage of portable computers or mobile phones for helping at the learning of stranger languages. Humans think that schools aren’t in tendencies with social networking. The educators of a few traditional schools have promoted the creation of social networks with exception of the case in which exists the communication with the colleagues. An approach of e-learning: E-learning has evolved from the computers that were used in the domain of education. Exists a tendency to move on services of blended learning, in the case of computer is based on activities that are integrated with practical situations or classes situations. Bates and Poole( 2003 ) and OCDE suggest that different types or e-learning forms can be considered like a continuum, from any e-
learning, like the utilization of computers and the Internet in teaching and learning, with help in the class, like the classroom to realize the lecture of the slides. Power Point is sliding at the disposition of the students intermediary of a course of website or a management system of learning, of the programs of laptops, in the case that students need the bringing of the laptops in the classroom and use them like a part of a face-to-face in the class, of the hybrid learning in the case that the time class is reduced, but aren’t eliminated, with a lot of time is reduced, but aren’t eliminated, with a lot of time on-line learning, that represents a form of learning at distance. This classification is more similar with that of Sloan Commission Reports reporting the e-learning statute, which refers at web consolidation, complete web and dependent of web to reflect the grow of intensity of using technology. It can observe that e-learning describe a large game of application and is usually supervised reciprocally by publications of research which realize from e-learning a course of discussion. Popular instruments of e-learning are: Blackboard Inc. and Moodle. Blackboard Inc. has much 20 millions of users day by day. Blackboard offers six different platforms like: Blackboard Learn, Blackboard Colaboram, Blackboard Mobile, Blackboard Connect, Transact Blackboard and Blackboard Analitycs, Blackboard instruments permits to educators to decide if their program will be mixed or completely online, asynchrony or synchrony. Blackboard can be utilized for K12 Education, Superior Learning, of Business and Collaboration of the Govern. Moodle represents an Open Source Course Management System. Is free to download and offer opportunities of blended learning and the platform for courses of learning at distance. Moodle website has a lot of tutorials for creating a program or to become a student Moodle. Computer Based Learning Computer Based Learning it refers at using
Database Systems Journal vol. III, no. 3/2012 41
computers like a key component of educational environment. In time that this thing it can be referred at utilization of computers in a classroom, on large term it refers at a structured environment, in which computers are utilized in didactic objectives. Cassandra B. White has researched the important role of computers that plays in the superior learning. This evolution, to include the computer had supported the collaborative learning, in plus data management was realized. The type of computers has changed in the last years from heavy dispositive, slows that had occupied a space in the class, at home, at the office and laptops and portable dispositive, that are much mobile, in the form and dimensions and that is minimalized about technological dispositive that will continue. Computer Based Training (CBT’s ) are auto-paced from accessible activities of learning from the intermediary of a computer or portable dispositive. Usually CBTs has the content in the presence in a linear way, also like reading an online book or to obtain knowledge and abilities through methods that are much favorable. From this point of view, they are usually utilized to teach the statistics processes, like the utilization of software or complete of the mathematical equations. The terms Computer Based Training is usually used alternatively like web based for formation (WBT), with the principal difference by the delivery method. In the case that Computer Based Training (CBT) is usually delivered by CD-ROM, Web Based Training is delivered using a web browser. The evaluation of learning in CBT (Computer Based Training) usually comes with questions with multiple variants, or other evaluations, that can be easily obtained by a computer, like drag and drop, radio button, the simulation of others interactive ways. The evaluations are easily marked and registered by online software, offering immediately to end-users the feedback
and the finalization state. The users have the possibility to imprime the registration of finalization by a certification form. CBT’s offers learning stimulus forward the methodology of traditional learning from manual, or class based on instruction. For example, CBT’s offers friendly user, solutions for the satisfaction of needs of continuum education. In replace of limitation of the students at courses participations and reading to print solutions, the students are capable to have knowledge and abilities by methods that are much favorable. For example Computer Based Training offers visual benefits of learning by animation or video, usually are not offered by other ways. Computer Based Training can be a good alternative at the learning materials edited from reach mass media, including video clips and or animations, can be easily incorporated to grow learning. Another advantage for CBT’s is that it can be easily distributed at a large public, at a low cost if the initial development is finished. With all this, CBT (Computer Based Training) have some problems of learning, also. Usually the creation of CBT (Computer Based Training) in course of development ( e.g. Adobe Flash or director ) is usually much complex that an expert in the subject or if the teacher is capable using it. In addition, the lack of human interaction can limited also the type of content that can be presented and the type of evaluation that can be effectuate. Much organizations of learning start to utilize CBT (Computer Based Training / Web Based Training) like a part of a program much complex of online learning, that can include online discussions or another interactive elements. Computer –Supported Collaborative Learning CSCL (The Supported Collaborative Learning) represents one of promises innovations for enriching the process of teaching and learning, with the help of modern learning of information and communication. Is unanimously accepted for distinguish the collaborative learning

42 New e-learning method using databases
from the traditional model of “direct transfer”, in which the instructor it supposed is distributor of knowledge and abilities, that is given in many ways by the neologism E-learning 1.0, even that this method of direct transfer is the most accurate it reflects Computer-Based Learning Systems (CBL). Blogs, wiki, Google Docs are used usually CBCL environment in the group of teaching community. Using the social Web 2.0 instruments in the classroom is permitted to students and teachers to work together, to discuss ideas and to promote information. According to Sendall (2008) blog’s, wiki, and abilities of social networks are investigated to be utile in the classroom. After initial were used instruments, the students have reported a growing of levels of knowledge and of comfort using Web 2.0 instruments. The collaboration instruments are preparing to students with the needed technology the force of work from today. In function of the activity of work Cassandra B. White consider that the continuum aspects of motivation and success regarding e-learning must be keeping in the context of the learning efforts. The enriched technology of learning (TEL) The enriched technology learning (TEL) has the objective to offer innovations, improvement of efficiency of costs) for practices of e-learning, about the physics persons and organizations, independently of time, place and pace. The technology problems With the conditions of learning the technology, the technology of instruction, the term of Educational Technology is used to refer the utility of technology in the process of learning in a much broad sense different from instruction on computer or assisted instruction on computer from 1980. At the same time, is much larger than the learning of online
terms, terms or online education that in general, it refers to the learning based on web. In the cases in which the mobile technologies are utilized, the term of m-learning had become more much frequently. With all this, e-learning have implications fare from the technology and it refers at the effectively learning, that has placed by using these systems. E-learning is naturally prepared for distance learning or flexible learning, but can be used in the conjunction with face-to-face teaching, in the case in which the term of combined learning is frequently used. The pioneer of e-learning Bernard Luskin sustained that “E” must be understood in large sense, in the case that the understanding of e-learning is efficiently. Luskin tells that “e” must be interpreted in the sense of interesting, energic, enthusiast, extended, emotional, educational, surplus of “electronic” that represents a national traditional interpretation. This large interpretation permits to applications of 21 century and bring the learning the psychology mass-media in equation. In the superior learning in special, the tendency of growing is to create a virtual environment (VLE) that is in some cases combined with a Management Information System (MIS) to create an environment of learning managed in which all aspects of the course are treated in a consistent standard interface of using the whole institution. In time which programs ask students to participate at ones campus classes or oriented, a lot are delivered online completely. In addition, a lot of universities offer online services for supporting students, like on-line counseling, the registry of e-counseling, the manual for online buying, the students governs and students newspapers. The recent tendency in the sector of e-learning is screencast. Exists a lot of instruments of screencast available , but the recent is the instrument based web screencast that permits to users to create direct screencast from their browser and to realize available online video, so that the viewers can transmit direct video.
Database Systems Journal vol. III, no. 3/2012 43
The advantage of these instruments is that offer to the presenter the possibility to demonstrate his ideas and the flux of thoughts. With an video and audio combination the expert can imitate one of the experiences from the classroom and can offer clear and complete instructions. From the point of view of the student, it offers the possibility to interrupt and give to the learner the advantage to pass from their proper rate that a classroom can’t always offer. Technologies of communication used in e-learning The technologies of communications are classified like asynchronous and synchronous. Asynchronous activities like blogs, wiki and forums of discussion. The idea is that here the participants can engage in interchange of ideas and information, without dependency of implications of another participants in the same time. The e-mail is asynchronous, in which the e-mail can be sent or received, without the implications of the participants in the same time. The asynchronous learning offers to students the possibility to work in their rate. This thing is very important and benefit for students that have problems of health. They have the possibility to finalize their works in a reduced environment of stress and in a flexible time interval. The synchronous activities imply the interchange of ideas and information with one or multiple parts in the same time. A face-to-face discussion represents an example of synchronous communication. Synchronous activities appear with all participants at accession of a date, like example an online chat session or a virtual classroom or a meeting. Classrooms and virtual meetings can use much times a combination of technologies of communications. The participants in a virtual classroom use icons and emoticons to communicate their feelings and answers at questions at questions or declarations. The students
are capable “to write on board” and to distribute their desktop, when are administered the rights of the teacher. Another technology available of communication in a virtual classroom includes text notes, rights of microphones and sessions of breakout. Session of breakout permit to participants to work in collaboration in a little workgroup to realize a task, also to permits to teachers to have private conversations with his students. The virtual classroom offers, also the possibility of for students to request direct instructions from a qualified teacher in an interactive environment. The students have direct access and instant at his instruction for the instant and direct feedback. Virtual classroom offers a structural program of classes that can be helpful for students that can find the liberty to learn asynchronous. The virtual classroom offers also, a learning social environment that produces closely traditional “mortar and stone” class. The most virtual class applications offer a characteristic of registration. Each class is registered and is stocked on a server, which permits instant play from any classroom during the scholar year. This thing can be extremely useful for students to reevaluate the materials and concepts for future exam. This offers also to students the possibility to visualize from any classroom that it lost so that cannot be return. It also offers to parents the possibility to monitor any classroom to assure that they are satisfied about the education of children. At online and asynchronous courses the students continue in their proper rate. By online courses the students can obtain the diploma fast and repeat lost courses. The students have access at an incredible reach of courses in the process of online learning and can participate at online courses at faculty, stages, sport or work and also graduated with their classes. In much models, the community and the channels of communication it refers at e-learning and m-learning. Both communities offer a general presentation of the models of learning of basis and of the necessary activities to

44 New e-learning method using databases
participants to work to sessions of learning in the virtual classroom or in standard classroom with technology. A management learning system (LMS) is the software used for delivery and management of education/formation. The LMSs gama of the systems of managed of formation/ registry of learning for software for distributing of courses on the Internet and offer function of online collaboration. A management system of content learning is software for the author content (courses, reusable objects of content). A LCMS can be dedicated to produce and publication of the content which is hosted on LMS or can host the content. A LMS permits teachers and administrators to watch the presence, the load time and the progress of students. The parents can connect to a LMS to present the topics and to access the program of the course and the lessons. The E-evaluation varying from automate test or tests grid to more sophisticated systems became frequently. With one systems, the feedback can be oriented to mistakes specifics of a student or computer and the student can navigate in a series of questions of adaptation of the student that can or can’t learn. The best examples are a structure of formative evaluation and are stocked on a XML file. A common format standard of e-learning is SCORM in time that other specifications allows the transport of “objects of learning” (school cadre) or metadata categorized (LOM). An excellent example of e-leaarning , that refers to the management of knowledge and reutilization is E-learning Marine that is available at active service, members of pensioners and a military dezactivation. This online instrument offers courses of certifications to enrich the user in different domains about military preparation and sets of competences civil. The system of e-learning doesn’t offer the objectives of learning but evaluates also the progress of students. This realization is an excellent example of knowledge and
the retention of cyclic process of transfer of knowledge and the utility of data and registrations. In the development countries e-learning is “a popular mode of delivering educational materials in higher education by universities throughout the world”.
Figure 6. Short presentation of the module system interaction The e-learning represents „a popular mode of delivering educational materials in higher education by universities throughout the world”[1]. According to this study it exists six dimensions and twenty critical factors of success for e-learning systems in developed countries. Using Delphy method and AHP(Analytic Hierarchy Process) the study colects seventy six of useful answers. According to this study factors of success are important in e-learning systems and in developed countries. For successful e-learning implementations in developing countries technology awareness, motivation and changing learners’ behavior are fundamentals. “This study found six dimensions for implementing e-learning systems in developing countries, including learners’ characteristics, instructors’ characteristics, institution and service quality, infrastructure and system quality, course and information quality, and extrinsic motivation”[1]. The study called “Online or face-to-face? Students’ experiences and preferences in e-

Database Systems Journal vol. III, no. 3/2012 45
learning” answers at two questions like “Which aspects of e-learning courses do students experience as being favorable for learning?” and “When do students prefer online or face-to-face learning components?”. At these questions responded 2196 students from 29 Austrian universities The 2196 students have completed the questionnaire that had like basis the experience and knowledge acquired in time of the e-learning courses and on their own preferences for online components or face-to-face of the learning. These students developing countries: A comparative analysis between ICT experts and faculty”. The students from twenty nine Austrian universities in the study research “Online or face to face? Students’ experiences and preferences in e-learning” completed a questionnaire on their experiences attending a course of e-learning. In the end of this study we conclude that students “appreciated online learning for its potential in providing a clear and coherent structure of the learning material, in supporting self-regulated learning and in distributing information. They preferred face-to-face learning for communication purposes in which a shared understanding has to be derived or in which interpersonal relations are to be established. An especially important result concerns students’ perceptions of their learning achievements: When conceptual knowledge in the subject matter or skills in the application of one’s knowledge are to be acquired, students prefer face to face learning. However, when skills in self-regulated learning are to be acquired, students advocate online learning” [2]. 3 Conclusions The proposed solution that we have presented has three essential aspects:
1. The solution is credible; 2. The solution corresponds with the
practical and theoretical
necessities in report with the end users, the learners;
3. The presented solution could be a great help in learning process for virtual courses also have some advantages such as: reducing learning times, improve the teaching process, offer to student /learn new materials, books, examples and course notes;
References [1] Wannasiri Bhuasiri, Oudone
Xaymoungkhoun, Hangjung Zo, Jae Jeung Rho, “Critical success factors for e-learning in developing countries: A comparative analysis between ICT experts and faculty”, Computers and Education, Elsevier, 2011;
[2] Manuela Paechter, Brigitte Maier, “Online or face-to-face? Students’ experiences and preferences in e-learning”, Internet and Higher Education, Elsevier, 2010;
[3] C. Mohora, O. A. Calin, D. Anania, “Improving high education process using knowledge management concepts”-Proceedings of the 6th International Conference of Management of technological Changes”, 3-5 september 2009, Alexandroupolis, Grecia, Volume 2, ISBN 978-960-89832-1, ISI WEB of Knowledge, ISI Proceedings Database;
[4] C. Mohora, O.A. Calin, L. Mohora, “New strategies to improve the engineering learning process”, The 4th International Conference of Manufacturing Science And Education MSE 2009, Review of Management and Economic Engineering, Indexed in Ulrich’s Periodicals Directory, EBSCO Business Source Complete Database, Volumul 8/no.1A(31), Todesco Publishing House, Cluj Napoca, ISSN 1583-624x, pag. 71-79;

46 New e-learning method using databases
Andreea IONESCU graduated from the Faculty of Cybernetics, Statistics and Economic Informatics of the Academy of Economic Studies in 2008 ( Bachelor’s degree) and Master of E-business in 2010. She is university assistant in computer science at The Faculty of Economic Sciences at Hyperion University of Bucharest. She is currently a PhD candidate at Institute of Doctoral Schools at Academy of Economic Studies from Bucharest, in Economic Informatics Field. Her
interests include: e-commerce, project management, literature, music, dance and fitness.

Database Systems Journal vol. III, no. 3/2012 47
Integrated Information System for Higher Education Qualifications
Catalin Ionut SILVESTRU1, Codrin-Florentin NISIOIU2, Bogdan GHILIC MICU3, Ramona Camelia BERE4, Adina-Maria DAN5, Robert MIHAILA6
1,2,3,4,6 The Bucharest University of Economic 5 Babes-Bolyai University
[email protected], [email protected], [email protected], [email protected], [email protected], [email protected]
In the present article we aim to study thoroughly and detail aspects related to architectures specific for e-learning and management of human resources training interconnected to management of qualifications. In addition, we take into consideration combining e-learning architectures with software in an e-learning system interconnected with the National Registry of Qualifications of Higher Education, in view of developing and information system that correlates educational supply from higher education from Romania with labor market demands through qualifications. The scientific endeavor consists of original architectural solutions to integrate data, systems, processes, services from various sources and to use them in the proposed system. The practical result of the scientific endeavor is represented by design of architectures required for developing an e-learning system interconnected with the National Registry of Qualifications from Romania, which involve in first stage the qualifications provided by higher education. The proposed innovative solution consists in the fact that the proposed information system combines the advantages of content management system (CMS) with learning content management system (LCMS) and with reusable learning objects (RLO). Thus, the architecture proposed in the research ensures the integration of a content management system with a portal for information, guidance and support in making a professional project. The integration enables correlation of competences with content areas and specific items from various teaching subjects, thus evaluating the usefulness for this registry from learning/educational perspective. Using the proposed information system in enables correlation among qualifications, content of educational program and continuous self-evaluation opportunities, which facilitate monitoring of progress and adjustment of learning content. Keywords: Qualifications Integrated Information System, Learning Content Management System, Reusable Learning Objects
Introduction In
know the framework of information and ledge society development, taking
into account the significant differences between the population aged 24-64 years that takes part in education and training at european level and in Romania, we consider of great interest to study aspects related to lifelong learning, as it involves investment in people and knowledge, and among the abilities to be gained are also the digital ones, moreover, the learning processes can be undertaken by using innovative, more flexible forms of learning. The interest in lifelong learning
is also justified by the labor market, given that training is one of the measures mostly used for reintegrating people on the labor market, both at European level and in Romania. The strategy for human resource development can be divided into two dimensions: the European one and national one. 2 The information system In 2000, in the European Union the Member States were launching the Lisbon strategy, with the explicit purpose to revive community policies. The main objective of
1

48 Integrated Information System for Higher Education Qualifications
the Lisbon strategy, that to transform the European Union in the most competitive and dynamic economy of the world by 2010, was reformulated in 2005, after the medium-term evaluation of the strategy. The objective of the revised Lisbon strategy aims to transform the European Union in a more attractive space for investments and labor, to promote knowledge and innovation and to create higher number of jobs and better ones. For the financial programming duration of 2007 – 2013, Member States had to allocate specific amounts from structural funds due to be received for funding projects related to fulfilling the Lisbon Strategy objectives. In order to implement the strategy objectives, Romania can count on financial resources of 3.47 billion euro from the European Social Fund, through the Sector Operational Program Human Resource Development 2007 – 2013. Another important document at national level is „The integrated strategy for human resource development from the perspective of lifelong learning” 2009-2020 (SIDRU). With regard to education and training, the programmatic document mentions that „in the Romanian society there is large recognition of the fact that education represents the strategic factor in the future development of the country due to its essential contribution to multidimensional and predictive modeling of human capital”. Promoting the principle of continuous education through lifelong learning represents for Romania a priority direction for action, given that it lags behind in participation to various forms of qualification, requalification or continuous improvements of competences. Monitoring the European process to reform the management of higher education institutions through initiatives and actions to comply with Bologna process emphasizes the fact that the issue of creating national frameworks of
qualifications in higher education can not be separated from increasing effectiveness in ensuring quality, measured among other things by the employability of graduates. Focusing the quality in higher education on the results of learning, respectively on the employability ensured by higher education qualifications obtained on completion of a graduate program deepens the internal quality assurance process in European universities. In the new culture of quality, the effort to gather the input factors required to conduct a study program (accreditation stage) is completed with the concern for quantitative and qualitative results of teaching-learning and with the performance of qualifications awarded upon completion of a study program. In the triennial report on progress achieved in ensuring quality in higher education, the European Commission highlights that in order to implement the Lisbon Strategy, universities were invited to modernize the curricula of study programs, to adjust them to labor market requirements, in the wider framework of a more dynamic university management.[2] In this document from September 2009, the European Commission claims that quality assurance standards should cover priorities of contemporary higher education, such as graduate employability, quality of services made available to students, in general, the quality of student and graduate advisors for career choice and / or jobs, in particular.1
The institutions involved in developing national frameworks in qualifications deal with two reference documents at European level – the European Qualifications Framework (EQF) and the European Qualifications Framework for Higher Education (EQFHE) – that, although have the same goal, they use different concepts 1 Ibidem, p. 10. International student mobility,
increasing institutional capacity in financial management and in implementing the European Charter of Scientific Research and the Code of Conduct for Researcher Recruitment are other priority objectives of European universities that should be properly expressed by reformulating / reviewing internal evaluation quality standards.
Database Systems Journal vol. III, no. 3/2012 49
and own terminology. Morever, although they were developed in parallel, documents do not clearly relate, they do no set the way to integrate the European Qualifications Framework for Higher Education within the European Qualifications Framework from the perspective of lifelong learning. This diversity approached at European level generated in most countries, legislative initiatives disjoint, often to two or more national authorities dealing in parallel with the issue of forming and managing transparent tools of the national qualifications system, yet without any effective dialogue to create a common language and a single methodological framework. From an analytical perspective, the concerns from national level have several common elements from the perspective of compatibility / convergence of measures, despite several elements and practices that rather reflect diversity / divergence. The compatibility / convergence can be observed by the following aspects from managing the requirements of the European Qualifications Framework at national level from the perspective of lifelong learning and the recommendations for implementing the European Qualifications Framework for Higher Education at national level:
• To strengthen social cohesion and social inclusion, by employability and active citizenship of people holding qualifications;
• To answer better to requests of knowledge society and the modern information framework, by promoting lifelong learning;
• To increase contacts and make more efficient the dialogue between supply and demand of qualifications at all levels and of all degrees.
Measures are necessary at European and
national level, which should: • Clarify the report between the
two dialogue tools between trainers and employers, starting with the eight levels of qualifications accepted by consensus at European level;
• Unify the language to describe the results of learning (descriptors of qualifications) for all levels of qualification.
The analysis of the contents of lifelong learning needs brings out a tendency of increasing inequalities among graduates and post-graduates. Those holding a better position on the labor market have the tendency to further develop their knowledge, abilities and competences and to diversify the opportunities to affirm in society. This tendency exists both as intent and as behavior towards lifelong learning. Employers have attitudes of encouragement towards lifelong learning activities. Most of them consider that graduates manifest predispositions to learning on the job. Companies are perceived by a quarter of the employers as holding a main role in training of graduates for on-the-job requirements; half of the employers organize different training forms for their employees. Yet, although there is a strong market for lifelong learning / training services universities are almost absent from this market as suppliers of lifelong learning. The target for training offers for lifelong learning could be initially for small companies, employers from the public sector and private companies with Romanian capital, as for these categories of enterprises, own training services are weaker represented than in the consultancy. The architecture needed to evaluate RNCIS proposed within this article consists in integrating RNCIS with a content management system and an information, orientation and support portal for undertaking a professional project. Integration enables correlation of competences with content areas and specific items for subjects, thus evaluating the

50 Integrated Information System for Higher Education Qualifications
usefulness of the registry from learning perspective.
RNCIS
Tools Classifications Qualifications management
Classifications of integration consist of: • Web services deposit • XML schemas deposit
Learning content management system Tools needed to correlate competences with content
areas: • Interface for web services for providing
qualifications • Competence registry
Information, counselling and support portal in conducting a professional project
Taking the qualification
via web service Working groups from economic
and academic environments
Figure 1. Proposed architecture The proposed architecture, shown in figure 1, emphasizes the need for classifications for integration that consist of web services and XML schemas required to correlate competences with learning objects from within the learning content management system. Each component of the learning content management system is considered as a relatively independent part that presents a strict definition of resources, results, relations and affiliations with main system modules. The system consists of several modules integrated at data and application levels. The principle of division of the system into modules comes from identifying basic activities of e-learning. This means especially creating content, allocating competences on content items, distributing them to students and course management, which include for example student, tutor, course management, testing, evaluating and other activities needed for undertaking e-learning courses. For these reasons, we consider that the following modules are absolutely necessary:
Authors module − part of the system that provides tools for content preparations and storage
in the system. Partial modules are: on-line editor, multimedia objects library and the submodule for defining relations among different fragments of courses. Distribution module – part of the system that distributes content of different courses tp authorized users with the assistance of different types of portals. The most important types of portal are the student portal and the tutor portal. Administration module – a collection of sub modules that ensure functions included usually in LMS. A very important module is that to manage users’ rights, which enables management of system users’ activities in an effective way. Many data included in this module are taken from the university management system and for this reason many usual management applications are not implemented. Communication and cooperation module − this group of applications create the virtual learning environment. This translates in asynchronous and synchronous communication tools, applications
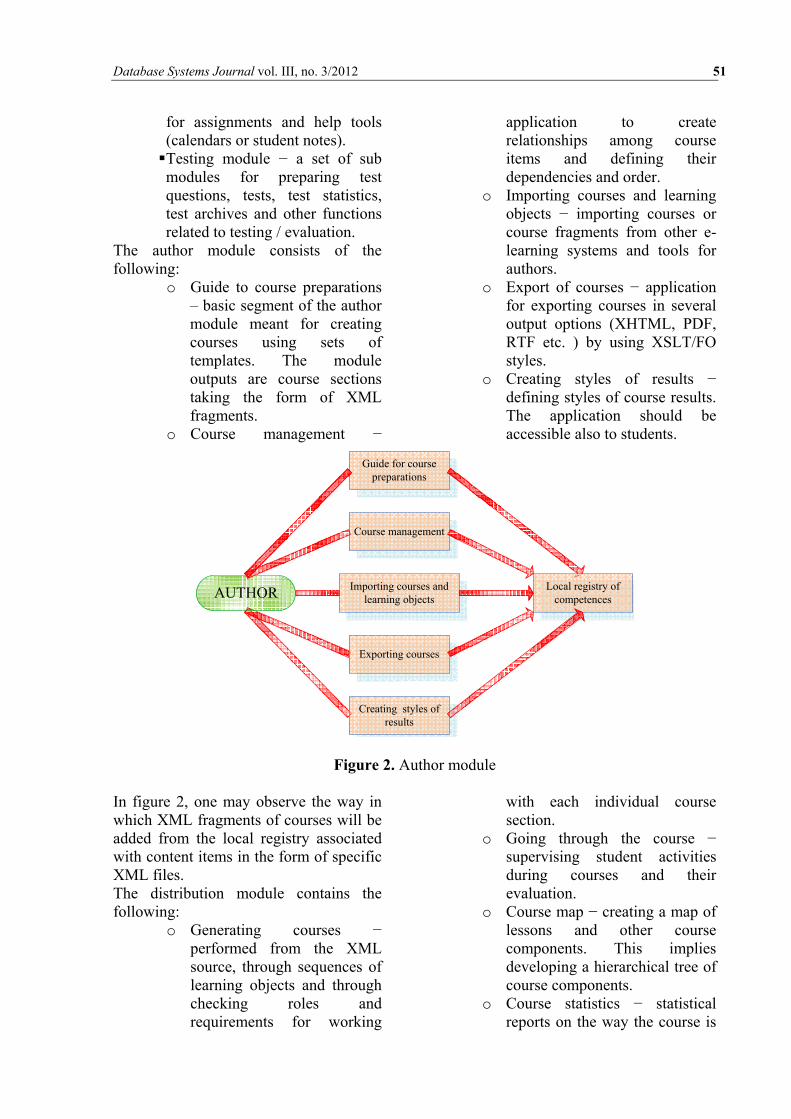
Database Systems Journal vol. III, no. 3/2012 51
for assignments and help tools (calendars or student notes). Testing module − a set of sub modules for preparing test questions, tests, test statistics, test archives and other functions related to testing / evaluation.
The author module consists of the following:
o Guide to course preparations – basic segment of the author module meant for creating courses using sets of templates. The module outputs are course sections taking the form of XML fragments.
o Course management −
application to create relationships among course items and defining their dependencies and order.
o Importing courses and learning objects − importing courses or course fragments from other e-learning systems and tools for authors.
o Export of courses − application for exporting courses in several output options (XHTML, PDF, RTF etc. ) by using XSLT/FO styles.
o Creating styles of results − defining styles of course results. The application should be accessible also to students.
Guide for course preparations
Course management
Importing courses and learning objects
Exporting courses
Local registry of competences
Creating styles of results
AUTHOR
Figure 2. Author module In figure 2, one may observe the way in which XML fragments of courses will be added from the local registry associated with content items in the form of specific XML files. The distribution module contains the following:
o Generating courses − performed from the XML source, through sequences of learning objects and through checking roles and requirements for working
with each individual course section.
o Going through the course − supervising student activities during courses and their evaluation.
o Course map − creating a map of lessons and other course components. This implies developing a hierarchical tree of course components.
o Course statistics − statistical reports on the way the course is

52 Integrated Information System for Higher Education Qualifications
used, the time spent for study, tool usage rate etc.
The communication and cooperation module contains:
o Assignments and tasks − managing tasks during courses.
o Student teams − creating student teams for solving tasks in teams.
o FAQ –frequently asked questions.
o Information sources − external sources of information needed to better understand the issues raised into discussion.
o Glossary, examples, notes, calendar, news − applications for supporting course study.
o E-mail, chat, group discussions, electronic blackboard − synchronous and asynchronous tools for communicating and exchanging information among students and tutors.
The module for testing and evaluation contains:
o Examination − preparations and management of self-testing and testing in view of course completion, with printing option.
o Managing test questions − preparing databases with test questions and their import into other systems.
o Random generation of tests − the tests and correction grids are generated automatically.
o Test archiving − libraries with test conducted and management of student access to various tests.
o Test analysis − tools for statistical evaluation of test results, measuring credibility of tests, correlating results, graphical presentation of the analysis.
During the research conducted, we considered necessary to develop this module to correlate competences with content areas. In this sense, one may observe in the architecture proposed and developed, that there is link between the local registry of competences and the process for preparing and conducting the evaluation process. Management module focuses on:
o Managing user roles − granting rights, granting the users with the possibility to manage activities.
o Library styles − archive of styles for determining the visual aspect of courses.
o Course evaluation − evaluation of course quality. The results are important for comparing and controlling teaching aspects of the course.
The system needs to be integrated at presentation level with the university information system already used by all the people from the university. Users are used to this and their use should not be problematic. Access to applications is done on the principle of sets of portals. All logical modules of the system contain a portal of their own, with links to inferior sides and create a hierarchical structure. (figure 3).

Database Systems Journal vol. III, no. 3/2012 53
Figure 3. Systems interface The module represents an interface to describe competences in the learning content management system and evaluation of student activities in relationship with associated competences. This module enables the following operations within the learning content management system:
• Data import in RNCIS, • Declaring activities related to
developing competences, • Proposing activities associated to
competence evaluation. The content management service issues a request for providing specific content from the deposit. The content sequentialisation service makes a selection based on competences desired to be acquired. The selection is based on the list of correlation among content items and competences provided by the specific services. The content management service issues a request to launch the provision service, which makes available the specific content of the system to the navigator. The student progress tracking service is provided with data from the navigator, the list of competences, the minimal standards and the level of achievements. The information gathered are made available to the service for providing student profile in order to provide a better
image both to the student and to the one wishing to develop the student’s necessary competences. In addition, this service provides information needed with regard to the way of choosing the testing of competences with taking into account the minimal standards that need to be met. Based on the service for providing the student profile, the individual receives access to different areas of content that define the qualification which are made available through the course management service. From the figure, one may notice that the service for providing competences and correlating content items play an essential role in the proposed solution. The competences, the list of correlations and the minimal standards represent the essential elements required for testing, choosing content and tracking progress achieved. Attention is focused on maintaining the modularity of the system. With this requirement fulfilled, the processes of innovation and further development of the system are much easier. All the modules are implemented in basic version with basic functionalities and are developed in time, based on user suggestions. This approach to problem-solving is rather difficult, given the need for flexible reactions from the development team, based on user suggestions and requests, yet caution is also

54 Integrated Information System for Higher Education Qualifications
necessary, in the framework of dynamic expansion of the entire system. The main features of development are as follows:
• Increasing expansion of system; • Repeated improvements in the
functional versions of the application;
• brainstorming analysis; • continuous communication
among developers and users; • small development team; • joint use of program coding; • the re-use; • taking information while running
the program. The learning content management system makes a request to RNCIS through a web service, receiving as reply an XML file that contains the description of the qualification. The need for two modules to be integrated in the learning content management system comes out – one for interface of web services and one for making a local registry of competences correlated with learning content items on the basis of the XML file provided by RNCIS and of internal correlations of the proposed module. References [1] European Commission - Key figures
on Europe – 2011 edition, Luxembourg: Publications Office of the European Union, 2011, ISBN 978-92-79-18441-3, ISSN 1830-7892, 173 pages, available at
http://epp.eurostat.ec.europa.eu/portal/page/portal/product_details/publication?p_product_code=KS-EI-11-001
[2] Report on Progress in Quality Assurance in Higher Education. Report form the Commision to the Council, the European Parliament, the European Economic and Social Committee and the Comittee of the Regions, Bruxelles, 21.09.2009
[3] National Institute of Statistics -
Recensământul populaţiei şi al locuinţelor 2002, available also on http://www.insse.ro/cms/files/rpl2002rezgen1/rg2002.htm
[4] Cătălin Ionu� Silvestru, Colibaba Dana Stefania, Silvestru Dragos Stefan, The development of the e-learning platforms in the new economy for a better training of the human resources, Revista: Journal Of Economic Computation And Economic Cybernetics Studies And Research, Secţiune: - ,Volum: 41, Nr: 1-2, Pg. 231-238, 2007, ISSN 0424-267X
[5] Cătălin Ionu� Silvestru, Dana Colibaba, Codrin Nisioiu, Dragoş Silvestru, Traditional Learning Models, E-Government and E-learning in the New Economy, Revista: Informatica Economica, Secţiune: - , Volum: - , Nr: 43, Pg. 115 - 117, 2007, ISSN 1453-1305
[6] Cătălin Ionu� Silvestru, Alexandru Robert Mihailă, The impact of modern information and communication technologies in business counseling and career guidance through lifelong learning, Conferinta: Business Transformation Through Innovation And Knowledge Management An Academic Perspective, Volum: Proceedings Of The 14th International Business Information Management Association Conference, ISBN 978-0-9821489-3-8

Database Systems Journal vol. III, no. 3/2012 55
Cătălin SILVESTRU is lecturer in Economic Informatics Department, Academy of Economic Studies of Bucharest. He published over 40 articles in journals and magazines in computer science, informatics, e-learning , project management and long life learning fields, over 20 papers presented at national and international
conferences, symposiums and work-shops and he was member over thirty-eight research projects. He is coauthor of three books. From November 2003 he is a PhD student in the field of Economic Informatics at the Academy of Economic Studies. He is a member of INFOREC professional association, Project Management Romania association, ACM, IEEE and others. He has one invention and one prototype approved. His work focuses on the programming, information system, e-learning, long life learning, project management and Human Resources Development.
Codrin NISIOIU graduated the University "Dunarea de Jos", Galati, Faculty of Electric Engineering and Computer Science, profile - Systems and Computers Science. He has a master degree in Economic Information Systems. He is a PhD student of the Doctoral School of Bucharest Academy of Economic Studies in the field of Economic
Informatics. He is lecturer in the Economic Informatics Department of the Bucharest Academy of Economic Studies and PhD candidate. He published 16 articles, 5 of them are included in international databases or in international catalogs. He is profesional member of ACM, IEEE Computer Society and Inforec. His interests include: e-government, e-services, e-learning, e-competences and business process management.
Bogdan GHILIC-MICU received his degree on Informatics in Economy from the Academy of Economic Studies Bucharest in 1984 and his doctoral degree in economics in 1996. Between 1984 and 1990 he worked in Computer Technology Institute from Bucharest as a researcher. Since 1990 he teaches in Academy of Economic Studies
from Bucharest, at Informatics in Economy Department. His research activity, started in 1984 includes many themes, like computers programming, software integration and hardware testing. The main domain of his last research activity is the new economy – digital economy in information and knowledge society. Since 1998 he managed over 25 research projects like System methodology of distance learning and permanent education, The change and modernize of the economy and society in Romania, E-Romania – an information society for

56 Integrated Information System for Higher Education Qualifications
all, Social and environmental impact of new forms of work and activities in information society.

Database Systems Journal vol. III, no. 3/2012 57
Cloud Computing and Smart Grids
Janina POPEANGĂ
Academy of Economic Studies, Bucharest, Romania, [email protected]
Increasing concern about energy consumption is leading to infrastructure that supports real-time, two-way communication between utilities and consumers, and allows software systems at both ends to control and manage power use. To manage communications to millions of endpoints in a secure, scalable and highly-available environment and to achieve these twin goals of ‘energy conservation’ and ‘demand response’, utilities must extend the same communication network management processes and tools used in the data center to the field. This paper proposes that cloud computing technology, because of its low cost, flexible and redundant architecture and fast response time, has the functionality needed to provide the security, interoperability and performance required for large-scale smart grid applications. Keywords: Energy Efficiency, Smart Grid, Cloud Computing
Introduction Ensh
ergy plays a fundamental role in aping the human condition [1]. The
main activities of social life are energy production and consumption. This is not surprising considering the fact that modern people's necessity for energy is important for existence. Also, it is said that the standard of living and quality of civilization are proportional to the quantity of energy a society uses [1]. The World Energy Council has presented several scenarios for meeting the future energy requirements with varying emphasis on economic growth, technological progress, environmental protection and international equity. During 1990-2050, the primary energy consumption is expected to increase by 50% according to the most environmentally conscious scenario and by 275% according to the highest growth rate scenario. [2] In 2007, The European Council adopted ambitious energy and climate change objectives for 2020 – to reduce greenhouse gas emissions by 20%, rising to 30% if the conditions are right, to increase the share of renewable energy to 20% and to make a 20% improvement in energy efficiency [3]. The European Parliament has continuously supported these goals. The European
Council has also given a long term commitment to the decarbonisation path with a target for the EU and other industrialised countries of 80 to 95% cuts in emissions by 2050 [3]. Energy efficiency is the most economical way to ensure safe, secure, sustainable and affordable energy for all, utilities and consumers, with greater environmental responsibility, by improving energy security and competitiveness, and reducing emissions. The research directions should be oriented on the whole energy chain, from energy production, thru transmission and distribution, to consumption. An electrical network architecture is purposed for generating, distributing and administering efficiently the power consumption to end-users, known as Smart Grid. 1.1. Defining Smart Grid The European Technology Platform Smart Grid (ETPSG) defines the smart grid as “an electricity network that can intelligently integrate the actions of all users connected to it – generators, consumers and those that do both – in order to efficiently deliver sustainable, economic and secure electricity supplies”. [4]
1

58 Cloud Computing and Smart Grids
According to the NIST [5], a Smart Grid is a complex infrastructure composed of seven main domains [6]:
Figure1. General view of a Smart Grid [6]
Bulk generation is the first process in the electricity supply to customers. The actors in this sub-domain are responsible for the bulk generation of electricity and the corresponding control, measurement, protection, and recording, procedures.
Markets. The information management part of this sub-domain provides information support for the analysis and optimization of the pricing, for the balance of supply and demand, and for the energy trading between bulk generators, utilities, transmission operators, and customers.
Service providers. The actors in this sub-domain typically perform a variety of functions that support the business processes of power system producers, distributors and customers [6]. The interfaces to the Operations domain are critical for controlling and warning the system but the interfaces to the Markets and Customer domains are influencing the economic advance through the improvement of the services.
Operations. The typical applications performed within the Operations domain may include: network operation, network operation monitoring, network
control, fault management, operation feedback analysis, operational statistics and reporting, real-time network calculation, dispatcher training [6].
Transmission is the bulk transport of electricity from sources to distribution through multiple stations. The actors use monitoring information to manage the operations in this system, like optimizing power flows and asset utilization or improving reliability.
Distribution. This domain is electrically linked with the transmission system and the customer sub-domain at the metering points for consumption. The actors in this sub-domain should manage in real-time a large amount of monitoring and control information.
Customers are allowed to manage their energy usage, generation and storage. There are three types of customers within the customer sub-domain: industrial, commercial/ building and home. The limits of these domains are typically set at less than 20kW of demand for Home,20-200kWfor Commercial/ Building, and over 200kW for Industrial [6].
These smart grid systems offer substantial benefits for society: increased efficiencies and information availability can enable cheaper and greener energy generation, less loss in energy storage and transmission, better fault isolation and recovery, and support for widespread consumer use of alternative energy sources [7]. 1.2. Defining cloud computing The National Institute of Standards and Technology (NIST), defines cloud computing as “a model for enabling convenient, on-demand network access to a shared pool of configurable computing resources (e.g., networks, servers, storage,

Database Systems Journal vol. III, no. 3/2012 59
applications, and services) that can be rapidly provisioned and released with minimal management effort or service provider interaction.” [8]
Figure 2. Cloud multi-access attribute [7]
Various definitions of cloud computing are circulating due to technology attributes and characteristics evolution but the common component of most definitions is that the cloud computing is an emerging computing model by which users can gain access to their applications anytime they want, from anywhere, through any connected device. Cloud computing have four techniques Virtualization technologies, Security Management, Programming model and Data Management [9].
2. The cloud hits the smart grid Even now the impact of the revolutionary cloud technology over smart grid is studied almost at theoretical level and also the advantages of this transformation of the power industry are not so well defined. However this is starting to change since both the administration and the industry realize the interaction between these two models and the increasing interest for exploring and understanding of how the cloud hits the smart grid to the next frontier of heights. The exponential development of the power industry requires progressively enormous and real-time computing and storage capacity. In smart grid concepts, the amount of these resources will grow in all levels of the grid in a uniform distributed
manner. Here, the cloud model comes into the scene and becomes very significant. Cloud computing is probably the simplest and best fitted way for these kind of application (smart grids) due to its scalable and flexible characteristics, and its capability to manage large amounts of data. The construction of a smart grid necessitates large-scale real-time computing capabilities in order to handle the communication, the transport and the storage of big transferable data. But once the distributed entities are in place, cloud computing will unload the smart grid by offering automatic updates, remote data storage, reduced maintenance of IT systems – saving money, manpower and energy. In recent times, researchers have studied how to use cloud computing to manage the smart grid.
• Yogesh Simmhan et al. [10] analyzed opportunities and challenges of using cloud platform for demand response optimization in the smart grid.
• Hongseok Kim et al. [11] proposed a cloud-based demand response architecture for fast reply time in large scale deployments, in contrast to master/slave based demand reply where the customers directly interact with the utility using host address- centric communication.
• Mohsenian-Rad et. al. [12] formulated the service request routing problem in cloud computing together with the power flow analysis in the smart grid and explained how this can lead to grid-aware cloud computing routing algorithms.
• Cristina Alcaraz et. al. [5] described some security mechanisms that will help in a better integration of smart grid and clouds.
• Sadia Fayyaz et. al. [9] focuses on security issues for smart grid

60 Cloud Computing and Smart Grids
applications using cloud computing framework.
• S. Rusitschka et al. [13] presented a model for the smart grid data management based on specific characteristics of cloud computing, such as distributed data management for real-time data gathering, parallel processing for real-time information retrieval, and ubiquitous access.
• Nikolopoulos et al. [14] proposed a decision-support system and a cloud computing software methodology that bring together energy consultants, consumers, energy service procedures and modern web interoperable technologies.
• Xi Fang et. al. [15] analyzed the benefits and opportunities of using cloud computing to help information management in the smart grid.
Although smart grids seem fit for using in cloud computing, there are some views against. For example, Cornell University Computer Science Department identified breaches in the cloud computing technology, properties that power control and similar smart grid functionality will need [16]. These include security, consistency, fault tolerant services, real-time assurances and ways to protect the privacy of sensitive data. Their conclusion is that the cloud is not ready at this time to run the smart grid, but could be in the future if sufficient research is done.
3. Interactions between cloud
computing and smart grids Data centers, with massive computation and storage capacities, are key elements of the cloud computing. K. Nagothu et al. [17] proposed to use cloud computing data centers as the central communication and optimization
infrastructure, supporting a cognitive radio network of smart meters.
Cloud Computing
Data Centers
Smart Grid
Figure 3 . The interactions between cloud computing systems, data centers and smart
grid [12] Data centers have a major impact on the electric grid by increasing the load at their locations. In order to reduce their high energy consumption and with the cooling problems that datacenters have, cloud providers decided to use some innovative methods of housing their centers operations. For example,
- Sun Microsystems has a data center located in an abandoned coal mine in Japan. Because of the constant, cool 59oF temperatures, no air conditioning is needed, so energy costs is cut down.
- In 2007, Google filed a patent for a first-of-its-kind “water-based data center”. The patent calls for electricity from tides and cooling from sea water. Building data centers offshore would allow Google to place its jurisdiction outside of the U.S. and in the same time by avoiding U.S. taxes.
- The latest idea about where to build and deploy data centers is “data centers in space”, powered by solar cells, propelled and steered by light pressure, networked and located by microwaves, and cooled by radiation into deep space [18].
Other weird data centre locations are: missile bunkers (Washington), old shopping malls (Eastgate Consumer Mall

Database Systems Journal vol. III, no. 3/2012 61
in Indianapolis), the 19th century chapel in Barcelona (The Barcelona Supercomputing Center), Siberia with its rough winters and the average temperature below 0o C
(Microsoft), servers in oil baths and fish tanks.
4. The twin goals of energy conservation and demand response
The critical service of an electric power grid is to balance the supply and demand of electricity at any occurrence of the situations: demand exceeding supply, or the supply exceeding demand. Both these situations threat the stability of the grid, and consequently power generation must track the load. These states are based on the time of the day and weather conditions. The grid is designed to reduce demand during peak periods by making use of the metering technologies and communication protocols. Smart meters, parts of the smart grid, provide an economical way of measuring “when” and “where” of energy consumption, allowing energy suppliers to introduce differential pricing based on the time of day and the season.
Figure 4. Smart Meters at consumers
interacting with demand-response applications in the Cloud [10] The utility agency and customers interact through the cloud, and the functions, to realize demand response. These requests are performed in a cloud rather than in the utility’s energy management system. 5. Smart grid application in the cloud The smart grid has a lot of applications but this paper focus on electricity management in smart homes.
Figure 5. Our vision in the cloud
Figure 6. Electricity management system – main interface

62 Cloud Computing and Smart Grids
The application brings a number of benefits to the electricity company, consumers and the environment, in terms of its functionality:
• Customers evidence (households, associations, buildings) ( Fig.7)
• Follow electricity consumption indicators and temperature in real-time
• Reading at fixed intervals electricity consumption indicators
• Customer recommendations on the best tariff plans according to each user profile
Figure 7. Customers evidence - interface
• Presentation of electricity consumption (through dynamic analysis, graphs and reports)
Figure 8. Monthly electricity consumption - interface
• Outbreak alerts based on
measurable factors and notifying approved persons by desktop alerts and emails

Database Systems Journal vol. III, no. 3/2012 63
• Calculation and application of penalties
• Automatically issue invoices each month
• Disconnecting bad-payers and notifying them by email
• Presentation of financial statements (issuing and paying invoices, billing, debt)
Figure 9. List of invoices - interface
• Identifying abnormal power consumption caused, for example, by the malfunctioning equipment and sensors distribution map with markers specific to each state.
Figure 10. Sensors - interface

64 Cloud Computing and Smart Grids
Figure 11. Sensors distribution map
Information on real-time energy usage and power pricing will need to be shared with consumers. The web presence of cloud platforms again is well suited for this.
Figure 12. Optimal tariff plan
Knowing in real-time their energy consumption, homeowners can organize their energy consumption and reduce their
utility bills. Also this application recommends optimal tariff plan according to customer profile.
6. Conclusions Industry and economy depend on safe, sustainable and inexpensive energy. Lots of homes and businesses have been connected to regional and national networks that enable real time reporting and control of energy use. Bringing cloud to smart grid will add optimal influence and substantial improvements in the performance of the whole grid for the current existing computing and storage capabilities.
The next steps in our research activities will transfer some of the
decisional algorithms into the cloud for covering a larger area of inputs much easier. Also the cloud technology will help adopting a feasible solution for multi-sensorial consumer specific operations. References [1] Williams J.C., The History of Energy,
The Franklin Institute’s Resources for Science Learning Scientists of Energy,2006, http://www.fi.edu/learn/case-files/energy.html

Database Systems Journal vol. III, no. 3/2012 65
[2] Fridleifsson, I.B., 2010: Capacity building in Renewable Energy Technologies in Developing Countries. Submitted to the World Energy Congress, Montreal, Canada, September 12-16, 2010.
[3] European Commission, Energy 2020 – A strategy for competitive, sustainable and secure energy, Brussels, 10.11.2010
[4] Global Smart Grid Federation, http://www.globalsmartgridfederation.org/smartgriddef.html, September 2012.
[5] Alcaraz C., Managing Incidents in Smart Grids a la Cloud, http://www.nics.uma.es/sites/default/files/CLOUDCOM.pdf, September 2012.
[6] Office of the National Coordinator for Smart Grid Interoperability, NIST Framework and Roadmap for Smart Grid Interoperability Standards, Release 1.0, NIST, 2009
[7] Stephen McLaughlin et. al. Embedded Firmware Diversity for Smart Electric Meters. 5th USENIX Workshop on Hot Topics in Security (HotSec 2010), Washington, DC. August, 2010
[8] Aamir Lakhani, The definition of Cloud Computing.
http://www.cloudcentrics.com, February 2, 2011
[9] Sadia Fayyaz, Handling Security Issues for Smart Grid Applications using Cloud Computing Framework, Journal of Emerging Trends in Computing and Information Sciences VOL. 3, NO. 2, February 2012
[10] Yogesh Simmhan et al., On Using Cloud Platforms in a Software Architecture for Smart Energy Grids, IEEE International Conference on Cloud Computing (CloudCom), 2010.
[11] Hongseok Kim et al., Cloud-based Demand Response for Smart Grid: Architecture and Distributed Algorithms, Smart Grid Communications (SmartGridComm),
2011 IEEE International Conference, 17-20 Oct. 2011.
[12] Mohsenian-Rad et. al., Coordination of Cloud Computing and Smart Power Grids, Smart Grid Communications (SmartGridComm), 2010 First IEEE International Conference, 4-6 Oct. 2010.
[13] S. Rusitschka et al., Smart grid data cloud: A model for utilizing cloud computing in the smart grid domain. IEEE SmartGridComm’10, 2010.
[14] Nikolopoulos et al., Web-based decision-support system methodology for smart provision of adaptive digital energy services over cloud technologies. IET Software, 2011.
[15] Xi Fang et. al., Managing Smart Grid Information in the Cloud: Opportunities, Model, and Applications, Network, IEEE, Volume 26 , Issue 4, July-August 2012.
[16] Kenneth P. Birman et. al., Running Smart Grid Control Software on Cloud Computing Architectures, Workshop on Computational Needs for the Next Generation Electric Grid, Cornell University, April 19-20, 2011. Ithaca, NY.
[17] K. Nagothu et al., Persistent Net-AMI for microgrid infrastructure using cognitive radio on cloud data centers. IEEE System Journal, Volume 6 , Issue 1, March 2012.
[18] Keith Lofstrom, Server Sky - internet and computation in orbit, http://server-sky.com/ , 07.09.2012.

66 Cloud Computing and Smart Grids
Janina POPEANGĂ graduated in 2010 from the Faculty of Cybernetics, Statistics and Economic Informatics, Economic Informatics specialization, within Academy of Economic Studies of Bucharest. The title of her Bachelor’s thesis is "Distributed databases". In 2012, she graduated the Databases for Business Support master program with a thesis entitled "Monitoring and management of electric power consumption using sensorial data". Janina’s interests are broadly in the
fields of databases and distributed systems. She is now planning to begin her PhD, advised by Professor Ion LUNGU. Her research focuses on real-time database systems, business intelligence analytics, sensor data management, smart grid and renewable energy.
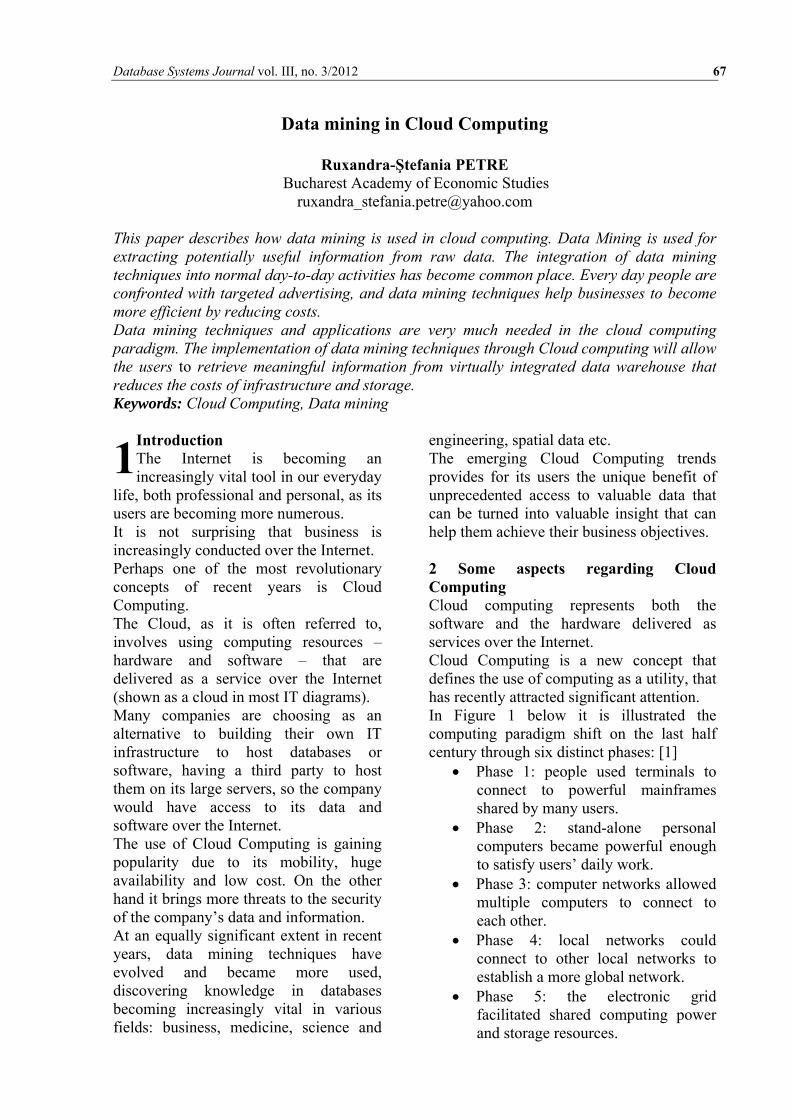
Database Systems Journal vol. III, no. 3/2012 67
Data mining in Cloud Computing
Ruxandra-Ştefania PETRE
Bucharest Academy of Economic Studies [email protected]
This paper describes how data mining is used in cloud computing. Data Mining is used for extracting potentially useful information from raw data. The integration of data mining techniques into normal day-to-day activities has become common place. Every day people are confronted with targeted advertising, and data mining techniques help businesses to become more efficient by reducing costs. Data mining techniques and applications are very much needed in the cloud computing paradigm. The implementation of data mining techniques through Cloud computing will allow the users to retrieve meaningful information from virtually integrated data warehouse that reduces the costs of infrastructure and storage. Keywords: Cloud Computing, Data mining
Introduction Thin
e Internet is becoming an creasingly vital tool in our everyday
life, both professional and personal, as its users are becoming more numerous. It is not surprising that business is increasingly conducted over the Internet. Perhaps one of the most revolutionary concepts of recent years is Cloud Computing. The Cloud, as it is often referred to, involves using computing resources – hardware and software – that are delivered as a service over the Internet (shown as a cloud in most IT diagrams). Many companies are choosing as an alternative to building their own IT infrastructure to host databases or software, having a third party to host them on its large servers, so the company would have access to its data and software over the Internet. The use of Cloud Computing is gaining popularity due to its mobility, huge availability and low cost. On the other hand it brings more threats to the security of the company’s data and information. At an equally significant extent in recent years, data mining techniques have evolved and became more used, discovering knowledge in databases becoming increasingly vital in various fields: business, medicine, science and
engineering, spatial data etc. The emerging Cloud Computing trends provides for its users the unique benefit of unprecedented access to valuable data that can be turned into valuable insight that can help them achieve their business objectives. 2 Some aspects regarding Cloud Computing Cloud computing represents both the software and the hardware delivered as services over the Internet. Cloud Computing is a new concept that defines the use of computing as a utility, that has recently attracted significant attention. In Figure 1 below it is illustrated the computing paradigm shift on the last half century through six distinct phases: [1]
• Phase 1: people used terminals to connect to powerful mainframes shared by many users.
• Phase 2: stand-alone personal computers became powerful enough to satisfy users’ daily work.
• Phase 3: computer networks allowed multiple computers to connect to each other.
• Phase 4: local networks could connect to other local networks to establish a more global network.
• Phase 5: the electronic grid facilitated shared computing power and storage resources.
1
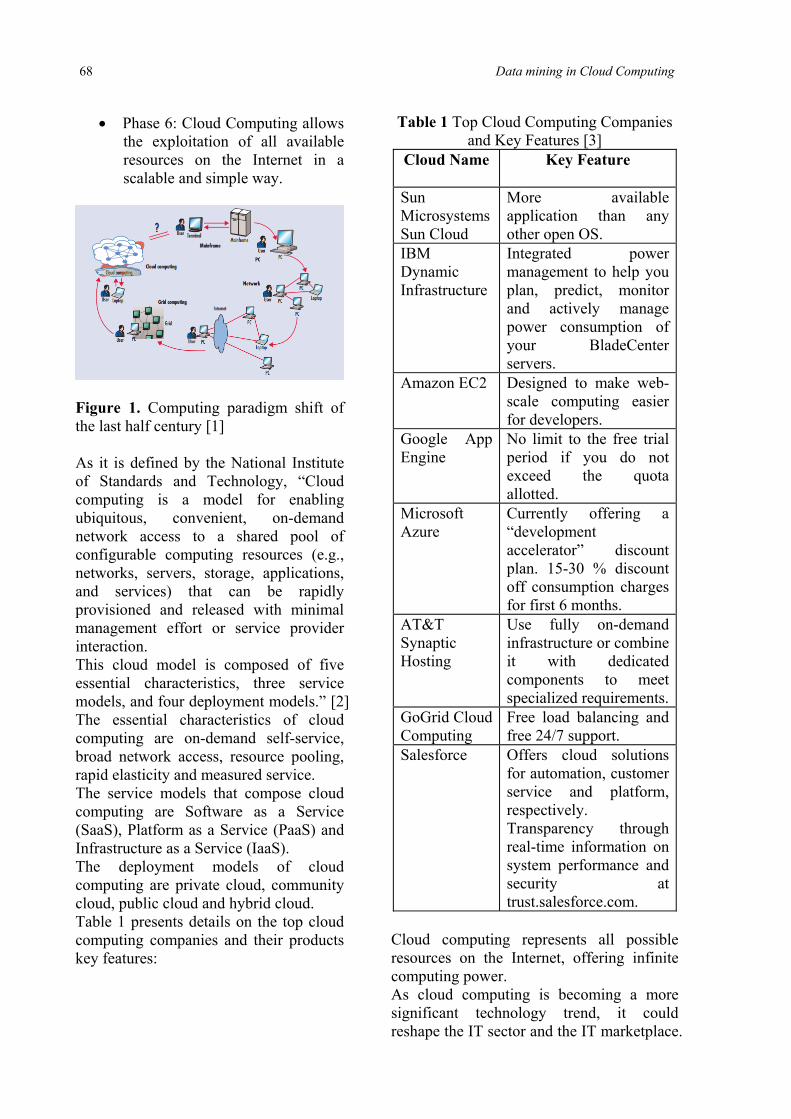
68 Data mining in Cloud Computing
• Phase 6: Cloud Computing allows the exploitation of all available resources on the Internet in a scalable and simple way.
Figure 1. Computing paradigm shift of the last half century [1]
As it is defined by the National Institute of Standards and Technology, “Cloud computing is a model for enabling ubiquitous, convenient, on-demand network access to a shared pool of configurable computing resources (e.g., networks, servers, storage, applications, and services) that can be rapidly provisioned and released with minimal management effort or service provider interaction. This cloud model is composed of five essential characteristics, three service models, and four deployment models.” [2] The essential characteristics of cloud computing are on-demand self-service, broad network access, resource pooling, rapid elasticity and measured service. The service models that compose cloud computing are Software as a Service (SaaS), Platform as a Service (PaaS) and Infrastructure as a Service (IaaS). The deployment models of cloud computing are private cloud, community cloud, public cloud and hybrid cloud. Table 1 presents details on the top cloud computing companies and their products key features:
Table 1 Top Cloud Computing Companies and Key Features [3]
Cloud Name
Key Feature
Sun Microsystems Sun Cloud
More available application than any other open OS.
IBM Dynamic Infrastructure
Integrated power management to help you plan, predict, monitor and actively manage power consumption of your BladeCenter servers.
Amazon EC2 Designed to make web-scale computing easier for developers.
Google App Engine
No limit to the free trial period if you do not exceed the quota allotted.
Microsoft Azure
Currently offering a “development accelerator” discount plan. 15-30 % discount off consumption charges for first 6 months.
AT&T Synaptic Hosting
Use fully on-demand infrastructure or combine it with dedicated components to meet specialized requirements.
GoGrid Cloud Computing
Free load balancing and free 24/7 support.
Salesforce Offers cloud solutions for automation, customer service and platform, respectively. Transparency through real-time information on system performance and security at trust.salesforce.com.
Cloud computing represents all possible resources on the Internet, offering infinite computing power. As cloud computing is becoming a more significant technology trend, it could reshape the IT sector and the IT marketplace.

Database Systems Journal vol. III, no. 3/2012 69
3 Some aspects regarding Data mining Data mining represents finding useful patterns or trends through large amounts of data. Data mining is defined as a “type of database analysis that attempts to discover useful patterns or relationships in a group of data. The analysis uses advanced statistical methods, such as cluster analysis, and sometimes employs artificial intelligence or neural network techniques. A major goal of data mining is to discover previously unknown relationships among the data, especially when the data come from different databases.” [4] The most important data mining techniques and their description are presented in table 2 below:
Table 2 Data mining techniques [5] Cloud Name
Key Feature
Clustering Useful for exploring data
and finding natural groupings. Members of a cluster are more like each other than they are like members of a different cluster. Common examples include finding new customer segments and life sciences discovery.
Classification Most commonly used technique for predicting a specific outcome such as response / no-response, high / medium / low value customer, likely to buy / not buy.
Association Find rules associated with frequently co-occurring items, used for market basket analysis, cross-sell, root cause analysis. Useful for product bundling, in-store placement, and defect analysis.
Regression Technique for predicting a continuous numerical outcome such a customer lifetime value, house value, process yield rates.
Attribute Importance
Ranks attributes according to strength of relationship with target attribute. Use cases include finding factors most associated with customers who respond to an offer, factors most associated with healthy patients.
Anomaly Detection
Identifies unusual or suspicious cases based on deviation from the norm. Common examples include health care fraud, expense report fraud, and tax compliance.
Feature Extraction
Produces new attributes as linear combination of existing attributes. Applicable for text data, latent semantic analysis, data compression, data decomposition and projection, and pattern recognition.
Considering the varied data mining techniques and the great need for discovering patterns and trends in data that would lead to knowledge that could not be obtained otherwise, it’s no wonder that data mining is used in the most varies field of activity. “Data mining, the extraction of hidden predictive information from large databases, is a powerful new technology with great potential to help companies focus on the most important information in their data warehouses. Data mining tools predict future trends and behaviors, allowing businesses to make proactive, knowledge-driven decisions.
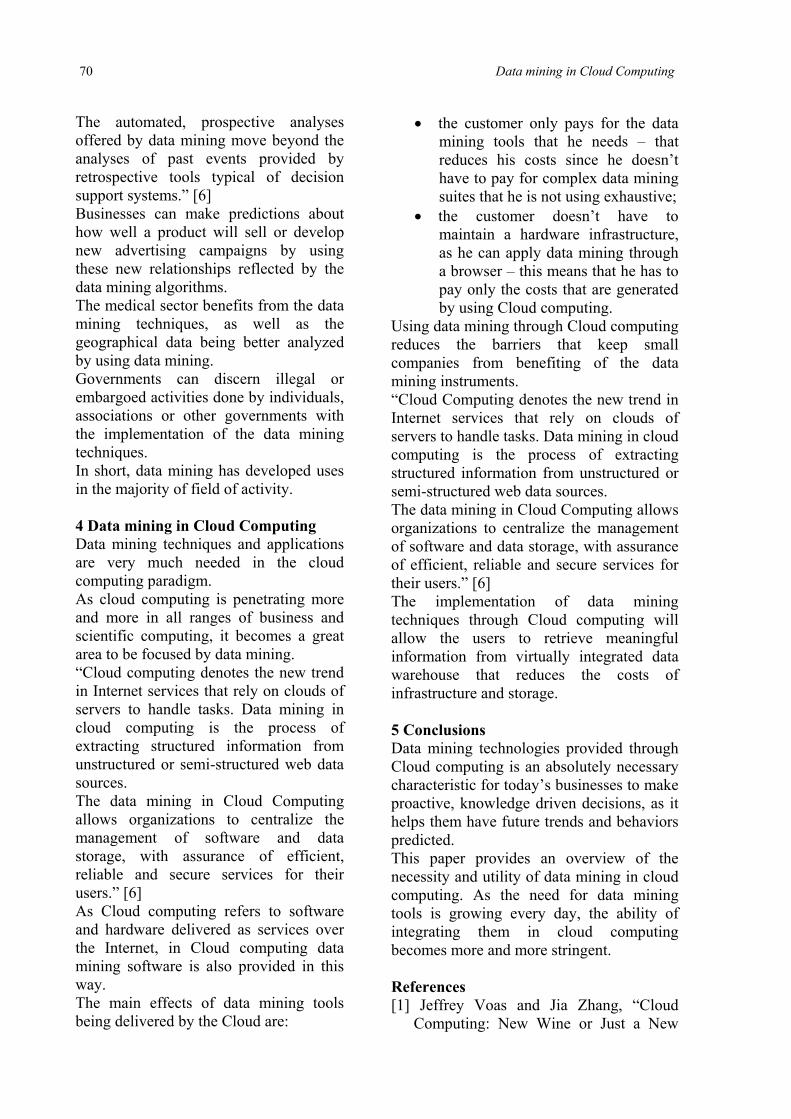
70 Data mining in Cloud Computing
The automated, prospective analyses offered by data mining move beyond the analyses of past events provided by retrospective tools typical of decision support systems.” [6] Businesses can make predictions about how well a product will sell or develop new advertising campaigns by using these new relationships reflected by the data mining algorithms. The medical sector benefits from the data mining techniques, as well as the geographical data being better analyzed by using data mining. Governments can discern illegal or embargoed activities done by individuals, associations or other governments with the implementation of the data mining techniques. In short, data mining has developed uses in the majority of field of activity. 4 Data mining in Cloud Computing Data mining techniques and applications are very much needed in the cloud computing paradigm. As cloud computing is penetrating more and more in all ranges of business and scientific computing, it becomes a great area to be focused by data mining. “Cloud computing denotes the new trend in Internet services that rely on clouds of servers to handle tasks. Data mining in cloud computing is the process of extracting structured information from unstructured or semi-structured web data sources. The data mining in Cloud Computing allows organizations to centralize the management of software and data storage, with assurance of efficient, reliable and secure services for their users.” [6] As Cloud computing refers to software and hardware delivered as services over the Internet, in Cloud computing data mining software is also provided in this way. The main effects of data mining tools being delivered by the Cloud are:
• the customer only pays for the data mining tools that he needs – that reduces his costs since he doesn’t have to pay for complex data mining suites that he is not using exhaustive;
• the customer doesn’t have to maintain a hardware infrastructure, as he can apply data mining through a browser – this means that he has to pay only the costs that are generated by using Cloud computing.
Using data mining through Cloud computing reduces the barriers that keep small companies from benefiting of the data mining instruments. “Cloud Computing denotes the new trend in Internet services that rely on clouds of servers to handle tasks. Data mining in cloud computing is the process of extracting structured information from unstructured or semi-structured web data sources. The data mining in Cloud Computing allows organizations to centralize the management of software and data storage, with assurance of efficient, reliable and secure services for their users.” [6] The implementation of data mining techniques through Cloud computing will allow the users to retrieve meaningful information from virtually integrated data warehouse that reduces the costs of infrastructure and storage. 5 Conclusions Data mining technologies provided through Cloud computing is an absolutely necessary characteristic for today’s businesses to make proactive, knowledge driven decisions, as it helps them have future trends and behaviors predicted. This paper provides an overview of the necessity and utility of data mining in cloud computing. As the need for data mining tools is growing every day, the ability of integrating them in cloud computing becomes more and more stringent. References [1] Jeffrey Voas and Jia Zhang, “Cloud
Computing: New Wine or Just a New
Database Systems Journal vol. III, no. 3/2012 71
Bottle?”, IEEE Internet Computing Magazine, 2009, Link: http://www.cmlab.csie.ntu.edu.tw/~jimmychad/CN2011/Readings/CloudComputingNewWine.pdf.
[2] Peter Mell, and Timothy Grance, “The NIST Definition of Cloud Computing”, The National Institute of Standards and Technology, USA, 2011, Link: http://csrc.nist.gov/publications/nistpubs/800-145/SP800-145.pdf.
[3] IT Strategists, “Top Cloud Computing Companies and Key Features”, Link: http://www.itstrategists.com/Top-Cloud-Computing-Companies.aspx.
[4] Merriam-Webster Dictionary, “Definition of data mining”, Link: http://www.merriam-webster.com/dictionary/data%20mining.
[5] ORACLE, “Oracle Data Mining Mining Techniques and Algorithms”, Link: http://www.oracle.com/technetwork/database/options/advanced-analytics/odm/odm-techniques-algorithms-097163.html.
[6] Bhagyashree Ambulkar and Vaishali Borkar, “Data Mining in Cloud Computing”, MPGI National Multi Conference 2012 (MPGINMC-2012), 7-8 April 2012, Link: http://research.ijcaonline.org/ncrtc/number6/mpginmc1047.pdf.
Ruxandra-Ştefania PETRE graduated from the Faculty of Cybernetics, Statistics and Economic Informatics of the Academy of Economic Studies in 2010. She graduated from the Business Support Databases Master of the Academy of Economic Studies in 2012. At present she is a Junior System Architect at LOXON Solutions since November 2011. She is developing and implementing Business Intelligence and Data Warehousing solutions for the banking system.