datakind sg sharing of our first datadive
TRANSCRIPT

DataKind Singapore
DataLearn: Post-DataDive Sharing23 July 2015
Thanks to our host!
Share photos & tweets
#DataLearn
#data4good
@DataKindSG

Agenda
1. DataKind Singapore updates2. DataDive Overview3. DataDive Sharing: Earth Hour4. DataDive Sharing: HOME5. Small group discussions on data
handling best practices (if time allows)

Agenda
1. DataKind Singapore updates2. DataDive Overview3. DataDive Sharing: Earth Hour4. DataDive Sharing: HOME5. Data handling best practices

DataKind™ harnesses the power of data
science in the service of humanity.

Updates
Project Accelerator coming up on 5 Sept!
- Please help spread the word to any social change organizations you know
who do good work.
- Sign up form here: http://goo.gl/forms/0TbDySVFi7
- Sign up by Friday, Aug 14.

Other data4good stuff
http://unitedwehack.com/
- August 15-16, 24 hour hackathon organized with UN Women- “A Hackathon to Promote Financial Literacy and Economic Empowerment for
Women Around the Globe.”- Access to partner APIs
http://blog.datalook.io/openimpact/
- Until August 31- “DataLook is a directory of reusable data-driven projects for social good. Join
our replication marathon and bring a project to your city.”

Agenda
1. DataKind Singapore updates2. DataDive Overview3. DataDive Sharing: Earth Hour4. DataDive Sharing: HOME5. Data handling best practices

What is a DataDive?

Get to know the participating
organizations
Select and learn about a problem
and the data
Determine a specific task or team that you can work on
Data Dive in!
Repeat!
Coordinate with the team’s Data Ambassadors & Project Managers !→ code
→ final presentation→ analysis
Contribute Results

DataDive Retrospective
- Took place over weekend of 23 - 25 Apr- More than 70 participants- 2 non-profit organizations
- Earth Hour- HOME
- Intro to the orgs on Friday and socialize, working through Saturday, final presentations on Sunday at 1pm.

DataDive Key Learnings
- Full involvement from partner orgs is important, and we need to emphasize this from the very beginning
- Trello will be mandatory to avoid duplication of effort- Grant access to data on Friday night and help participants to
start setting up data and tools, so that they can start right away on Saturday morning
- Remind people that final presentations will be from Google Presentation and set a hard deadline for getting content in, so that there is time to vet

Agenda
1. DataKind Singapore updates2. DataDive Overview3. DataDive Sharing: Earth Hour4. DataDive Sharing: HOME5. Data handling best practices

Tweet Data Analysis - EARTH HOUR
Main Objectives- Identify influencers on twitter
- Sentiment Analysis
- Word Cloud Analysis

Tweets Analysis Prep - EARTH HOUR
1. Understanding the dataanon_id
created_at
Text No Comma coordinates
lang RT_count
fav_count
reply_to_user_id place
83937561
27/03/2015
RT @JimHarris: SHAME: Canada Ranks LAST Among OECD Countries for #ClimateChange Performance #cdnpoli #climate #gls15 http://t.co/0DD7S6oy7h
en 152 0
84233936
28/03/2015
RT @earthhour: It's not about which country you're from; it's about what planet we're from. Join us for #EarthHour! 28th March; 8.30pm.
en 360 493 84233936
80696055
27/03/2015
@nenshi will you be joining the #earthhour party? Plz retweet to encourage lights out? #earthhourcalgary #yourpower http://t.co/68TblYiW2Y
-114.0664914;....
en 9 4 [-114.059111818;....

Tweet Data Analysis Prep - EARTH HOUR
2. Identify preliminary tasks to support other analysis- Identify which tweets are retweets
- Identify which tweets contain which EH hashtags
- For retweets, identify which user is being retweeted
Tweets Analysis Prep - EARTH HOUR
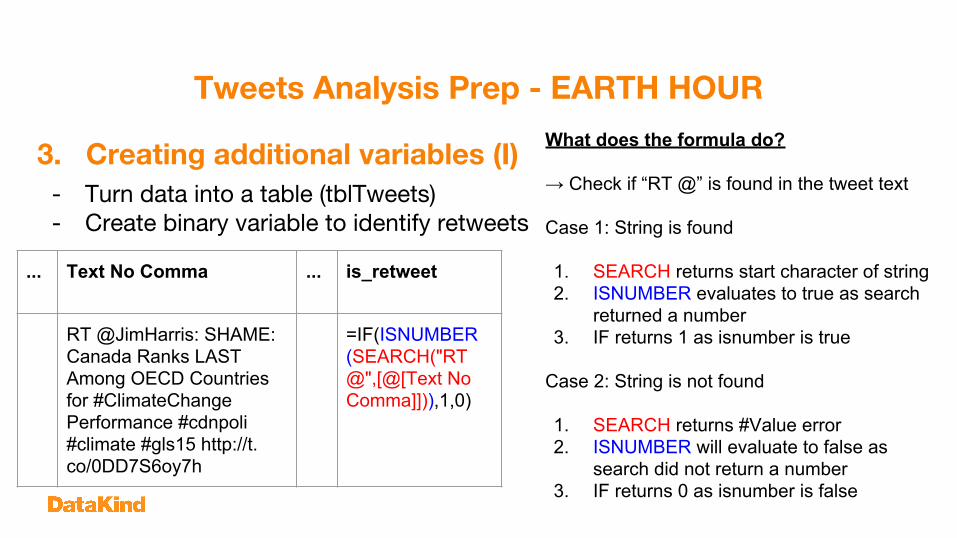
3. Creating additional variables (I)- Turn data into a table (tblTweets)- Create binary variable to identify retweets
... Text No Comma ... is_retweet
RT @JimHarris: SHAME: Canada Ranks LAST Among OECD Countries for #ClimateChange Performance #cdnpoli #climate #gls15 http://t.co/0DD7S6oy7h
=IF(ISNUMBER(SEARCH("RT @",[@[Text No Comma]])),1,0)
What does the formula do?
→ Check if “RT @” is found in the tweet text
Case 1: String is found
1. SEARCH returns start character of string2. ISNUMBER evaluates to true as search
returned a number3. IF returns 1 as isnumber is true
Case 2: String is not found
1. SEARCH returns #Value error2. ISNUMBER will evaluate to false as
search did not return a number3. IF returns 0 as isnumber is false
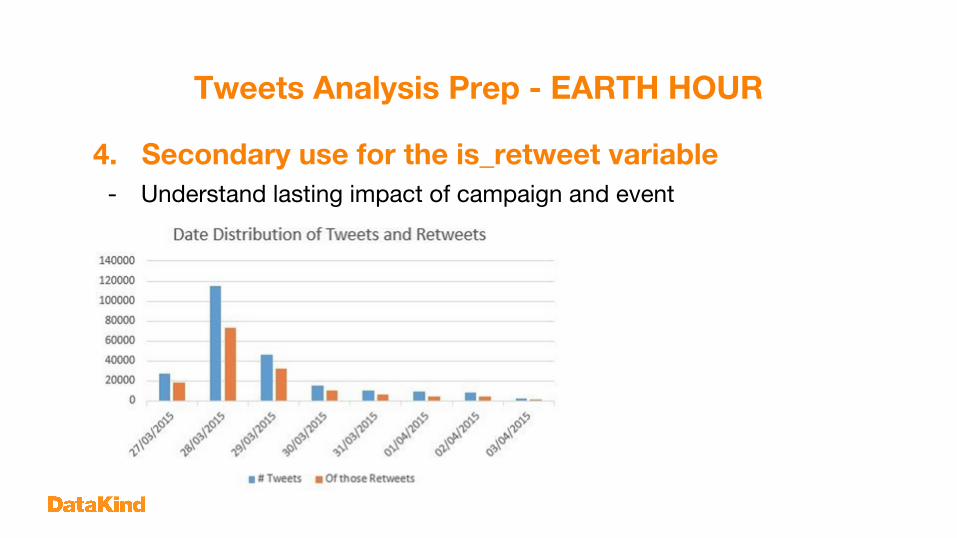
Tweets Analysis Prep - EARTH HOUR
4. Secondary use for the is_retweet variable- Understand lasting impact of campaign and event

Tweets Analysis Prep - EARTH HOUR
5. Creating additional variables (II)- The motto of EH was “use your power to change climate change”- EH # crawled: #EarthHour, #climatechange, #yourpower, #useyourpower- Create binary variables for each hashtag
... Text No Comma ... EarthHour ...
RT @JimHarris: SHAME: Canada Ranks LAST Among OECD Countries for #ClimateChange Performance #cdnpoli #climate #gls15 http://t.co/0DD7S6oy7h
=IF(ISNUMBER(SEARCH("#"&tblTweets[[#Headers],[EarthHour]],[@[Text No Comma]])),1,0)
...
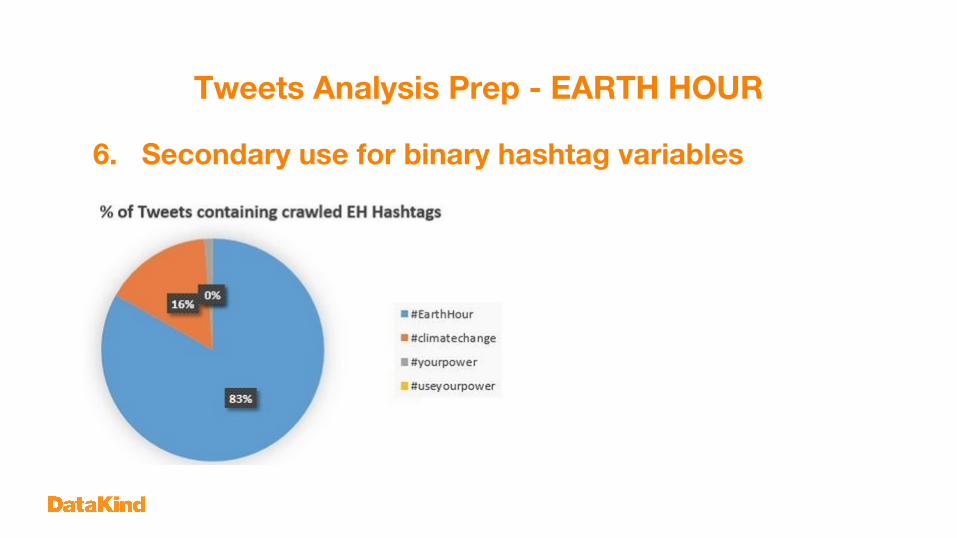
Tweets Analysis Prep - EARTH HOUR
6. Secondary use for binary hashtag variables
Tweets Analysis Prep - EARTH HOUR
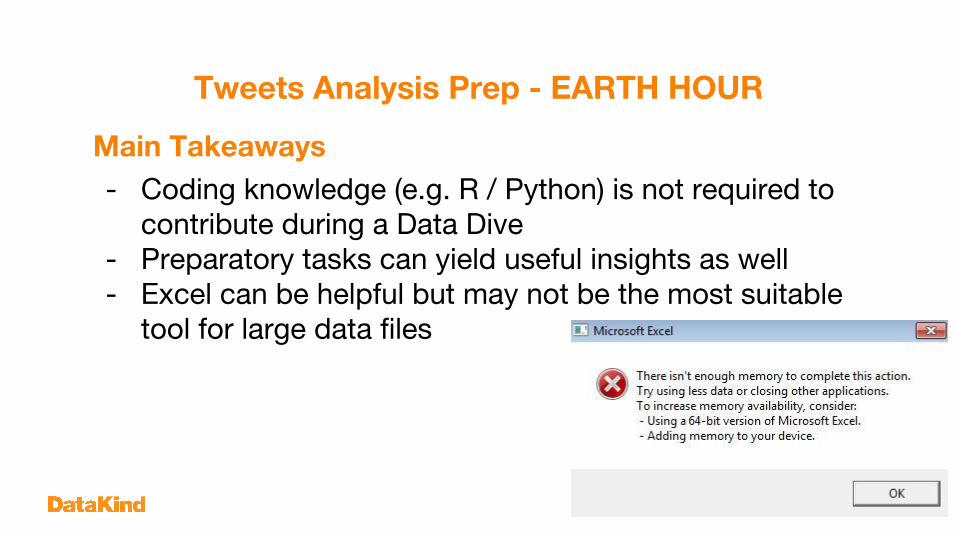
Main Takeaways- Coding knowledge (e.g. R / Python) is not required to
contribute during a Data Dive- Preparatory tasks can yield useful insights as well- Excel can be helpful but may not be the most suitable
tool for large data files
Identify Influencers - EARTH HOUR
ProblemIdentify influencers
SolutionAnalyse tweet data to identify most retweeted users

Identify influencers - EARTH HOUR
1. Creating additional variables- extract which user is being retweeted
... Text No Comma ... is_retweet
original_tweeter
RT @earthhour: It's not about which country you're from; it's about what planet we're from. Join us for #EarthHour! 28th March; 8.30pm.
1 =IF([@[is_retweet]]=0,"original",RIGHT(LEFT([@[Text No Comma]],FIND(":",[@[Text No Comma]]&":")-1),LEN(LEFT([@[Text No Comma]],FIND(":",[@[Text No Comma]]&":")-1))-3))
→ @earthhour
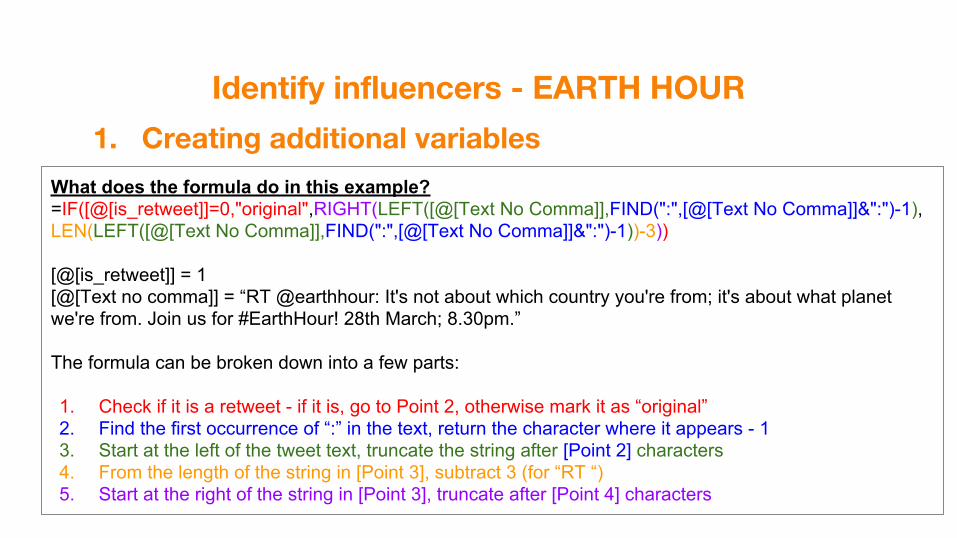
Identify influencers - EARTH HOUR
1. Creating additional variables
What does the formula do in this example?=IF([@[is_retweet]]=0,"original",RIGHT(LEFT([@[Text No Comma]],FIND(":",[@[Text No Comma]]&":")-1),LEN(LEFT([@[Text No Comma]],FIND(":",[@[Text No Comma]]&":")-1))-3))
[@[is_retweet]] = 1[@[Text no comma]] = “RT @earthhour: It's not about which country you're from; it's about what planet we're from. Join us for #EarthHour! 28th March; 8.30pm.”
The formula can be broken down into a few parts:
1. Check if it is a retweet - if it is, go to Point 2, otherwise mark it as “original”2. Find the first occurrence of “:” in the text, return the character where it appears - 13. Start at the left of the tweet text, truncate the string after [Point 2] characters4. From the length of the string in [Point 3], subtract 3 (for “RT “)5. Start at the right of the string in [Point 3], truncate after [Point 4] characters

Identify influencers - EARTH HOUR
1. Create additional variables
2. Select all tweets in dataset with retweets >=500
3. Check for extraction errors (if re-tweets > followers, manual investigation)
4. Check for parsing errors (if length of text >= 180 char, marked as error)
5. From remaining set: For users who were retweeted, assess profile information, number of followers, country where available

Identify influencers - EARTH HOUR
6. Outcome: Users who were most retweeted
User who is retweeted
Nr. RT >=500
Total RT Count
User info Nr. Of Followers
Country / Region
@earthhour 5 46,947 EarthHour 143,000 Global
@LeoDiCaprio 5 7,627 Leonardo di Caprio - Actor, WWF Ambassador
12,800,000 US
@AstroSamantha 2 2,750 Sam Cristoforetti - Italian Astronaut on ISS
510,000 Italy

Sentiment Analysis - TweetsWHAT IS SENTIMENT ANALYSIS● Sentiment analysis aims to determine the attitude of a speaker or a writer
with respect to some topic or the overall contextual polarity of a document.
WHAT WE USED FOR SENTIMENT ANALYSIS● We used the Python package VADER, a lexicon and rule-based sentiment
analysis tool that is specifically attuned to sentiments expressed in social media, and works well on texts from other domains.
● More information on VADER can be found in○ http://comp.social.gatech.edu/papers/icwsm14.vader.hutto.pdfhttp:
//comp.social.gatech.edu/papers/icwsm14.vader.hutto.pdf○ https://github.com/cjhutto/vaderSentiment
● Installed VADER thru PIP

Sentiment Analysis - TweetsHOW TO USE VADER IN YOUR CODE from vaderSentiment import sentiment as vaderSentiment sentences = [ "VADER is smart, handsome, and funny.", # positive sentence example "VADER is smart, handsome, and funny!", # punctuation emphasis handled correctly (sentiment intensity adjusted) ]. for sentence in sentences: print sentence, vs = vaderSentiment(sentence) print "\n\t" + str(vs)

Sentiment Analysis - Tweets
HOW VADER ANALYZES SOME OF THE INPUTSVADER is smart, handsome, and funny. {'neg': 0.0, 'neu': 0.254, 'pos': 0.746, 'compound': 0.8316}VADER is smart, handsome, and funny! {'neg': 0.0, 'neu': 0.248, 'pos': 0.752, 'compound': 0.8439}VADER is VERY SMART, really handsome, and INCREDIBLY FUNNY!!! {'neg': 0.0, 'neu': 0.294, 'pos': 0.706, 'compound': 0.9469}A really bad, horrible book. {'neg': 0.791, 'neu': 0.209, 'pos': 0.0, 'compound': -0.8211}
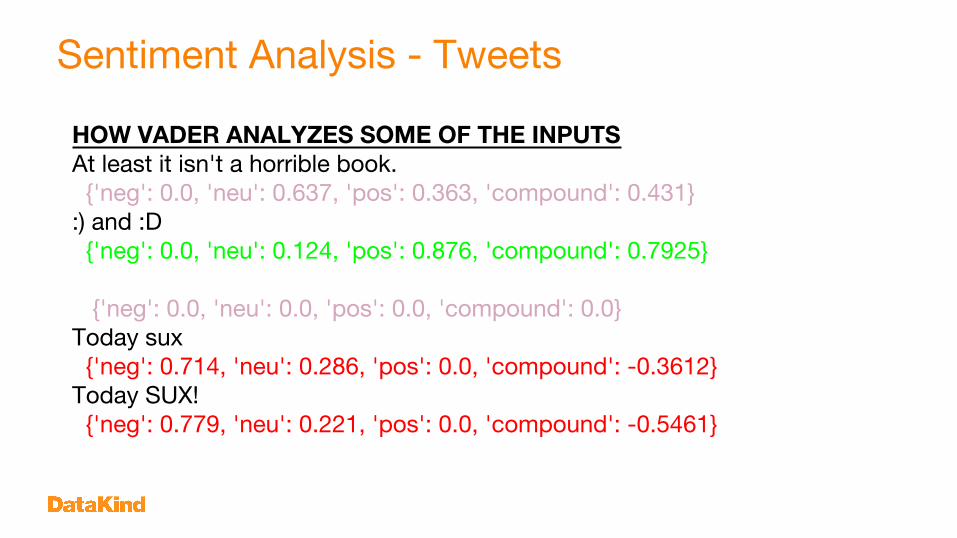
Sentiment Analysis - Tweets
HOW VADER ANALYZES SOME OF THE INPUTSAt least it isn't a horrible book. {'neg': 0.0, 'neu': 0.637, 'pos': 0.363, 'compound': 0.431}:) and :D {'neg': 0.0, 'neu': 0.124, 'pos': 0.876, 'compound': 0.7925}
{'neg': 0.0, 'neu': 0.0, 'pos': 0.0, 'compound': 0.0}Today sux {'neg': 0.714, 'neu': 0.286, 'pos': 0.0, 'compound': -0.3612}Today SUX! {'neg': 0.779, 'neu': 0.221, 'pos': 0.0, 'compound': -0.5461}
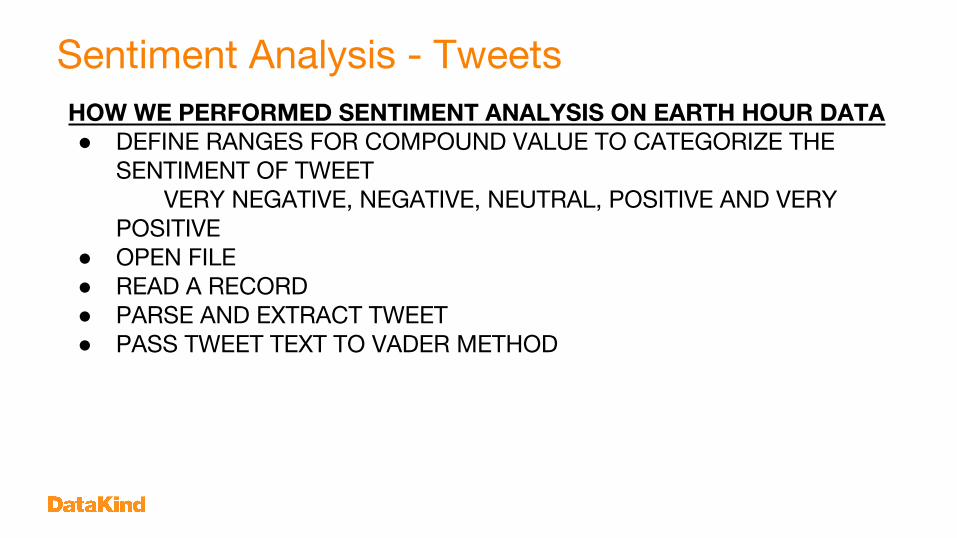
Sentiment Analysis - TweetsHOW WE PERFORMED SENTIMENT ANALYSIS ON EARTH HOUR DATA● DEFINE RANGES FOR COMPOUND VALUE TO CATEGORIZE THE
SENTIMENT OF TWEETVERY NEGATIVE, NEGATIVE, NEUTRAL, POSITIVE AND VERY
POSITIVE● OPEN FILE● READ A RECORD● PARSE AND EXTRACT TWEET● PASS TWEET TEXT TO VADER METHOD

Sentiment Analysis - Tweets
HOW WE PERFORMED SENTIMENT ANALYSIS ON EARTH HOUR DATA● PARSE OUTPUT TO EXTRACT COMPOUND● BASED ON COMPOUND VALUE , DETERMINE SENTIMENT OF THE TWEET● STORE THE CATEGORICAL VALUE OF SENTIMENT IN A VARIABLE● ADD A DUMMY VARIABLE WITH VALUE OF 1● GO TO STEP 3 TILL EOF● WRITE THE OUTPUT TO A FILE
Sentiment Analysis - Tweets
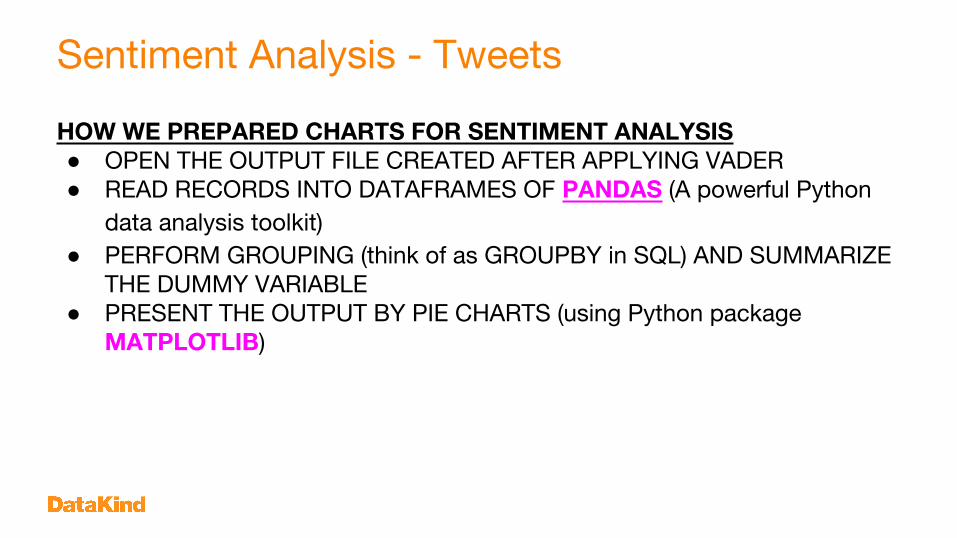
HOW WE PREPARED CHARTS FOR SENTIMENT ANALYSIS● OPEN THE OUTPUT FILE CREATED AFTER APPLYING VADER● READ RECORDS INTO DATAFRAMES OF PANDAS (A powerful Python
data analysis toolkit)● PERFORM GROUPING (think of as GROUPBY in SQL) AND SUMMARIZE
THE DUMMY VARIABLE● PRESENT THE OUTPUT BY PIE CHARTS (using Python package
MATPLOTLIB)

Sentiment Analysis - Tweets
1) Using all valid records- Apply Python package:
-vaderSentiment- Categorize sentiment scores:
-Very positive: >0.55-Positive: >=0.10 to <=.54-Neutral: >= (-0.10) to <=0.09-Negative: >=-0.55 to <=-0.11 -Very negative: <=-0.56
Input: Cleaned Hashtag Tweets
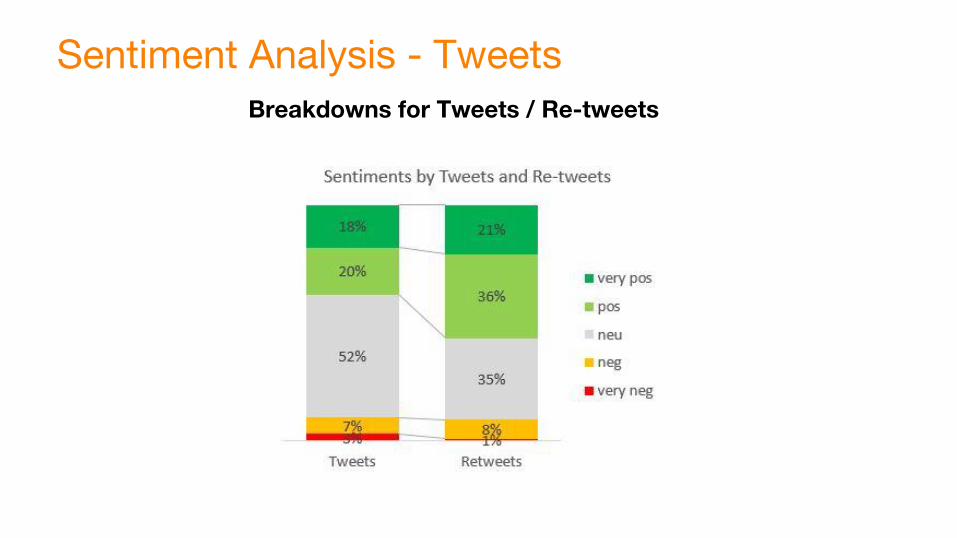
Sentiment Analysis - TweetsBreakdowns for Tweets / Re-tweets
Questions?
1. Which keywords are most retweeted?
2. Is there a relation among the topics containing each of the four keywords of Earth Hour?
3. Which words represent different sentiments?

Data Cleaning
Looking at English tweets.
Tweeted messages includes non meaningful characters.
# remove retweet entities RT/via some_txt = gsub("(RT|via)((?:\\b\\W*@\\w+)+)", "", some_txt) # remove <br> some_txt = gsub("<br>", "", some_txt) # remove @people some_txt = gsub("@\\w+", "", some_txt) # remove html links some_txt = gsub("http(s?)(://)(.*)[.|/|_](.*)+", "", some_txt) some_txt = gsub("htt(.*)", "", some_txt) # replace smiley some_txt = gsub(": ", " ", some_txt)
Create WordCloud
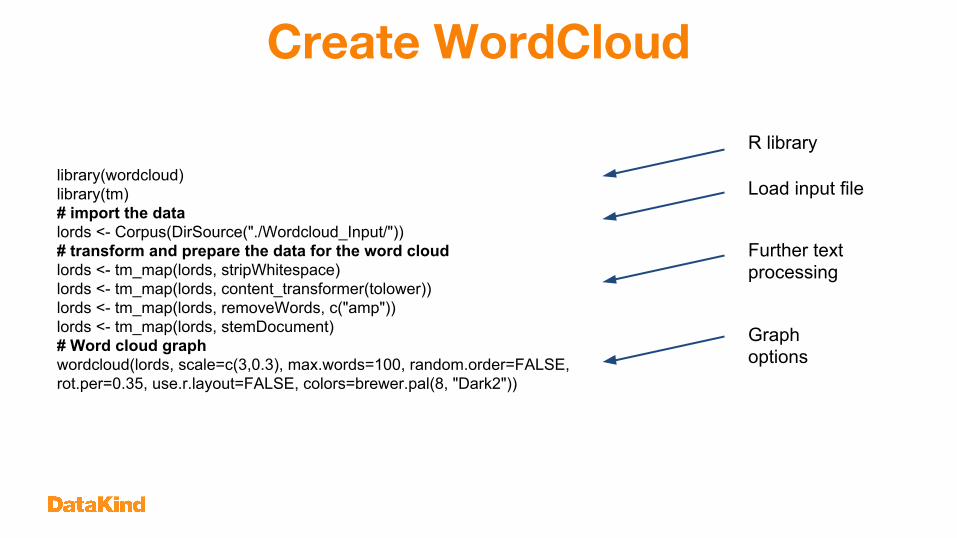
library(wordcloud)library(tm)# import the datalords <- Corpus(DirSource("./Wordcloud_Input/"))# transform and prepare the data for the word cloudlords <- tm_map(lords, stripWhitespace)lords <- tm_map(lords, content_transformer(tolower))lords <- tm_map(lords, removeWords, c("amp"))lords <- tm_map(lords, stemDocument)# Word cloud graphwordcloud(lords, scale=c(3,0.3), max.words=100, random.order=FALSE, rot.per=0.35, use.r.layout=FALSE, colors=brewer.pal(8, "Dark2"))
R library
Load input file
Further text processing
Graph options
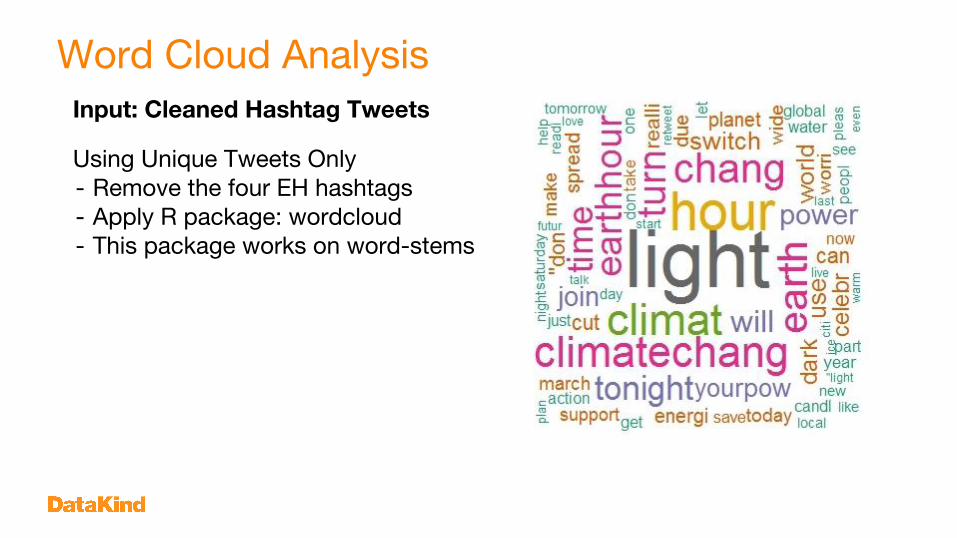
Word Cloud Analysis
Using Unique Tweets Only- Remove the four EH hashtags- Apply R package: wordcloud- This package works on word-stems
Input: Cleaned Hashtag Tweets

Word Cloud AnalysisComparison (Unique Tweets only):
#earthhour #climatechange

Putting in Sentiment Analysis
Word Cloud (only unique tweets)

Country assignment to subscribers - EARTH HOUR
ProblemFind out country of ActiveCampaign subscribers
SolutionMerge information from different columns, such as city, country, lat-long

Parallelized human cleaning process (PHCP)
"id","email","sdate","cdate","city","state_province","zip","country1","country2","country3","location","language","address","age","discover"
"100011","[email protected]","2014-01-26 15:35:28","2014-01-26 02:35:28","","","","Netherlands","","","","","","",""
"100012","[email protected]","2012-11-29 02:01:46","2012-11-28 13:01:46","","","","China","","","","","","",""
"100013","[email protected]","2015-03-21 20:32:55","2015-03-21 07:32:55","ho chi minh","","","Viet Nam","","","","","","",""
"100014","[email protected]","2014-03-14 14:59:15","2014-03-14 01:59:15","Coimbatore","","","","","","","","","",""
"100015","[email protected]","2013-09-27 10:25:29","2013-09-26 21:25:29","","","","China, Guangdong Province, Foshan City","","","","","","",""
"100016","[email protected]","2012-11-29 02:41:50","2012-11-28 13:41:50","","","","Taipei","","","","","","",""
"100017","[email protected]","2013-03-12 11:36:39","2013-03-11 22:36:39","","","","12`3123","","","","","","",""
ActiveCampaign crawler and conversion from JSON
Result# of subscribers: 321,704
# of subs. with country: 188,462 → 58.6%

Campaign response rate comparison of users - EARTH HOUR
ProblemRank users based on historical campaign response data
SolutionUse expected open rates to compare users with different number of campaigns received

Raw data
JSON with user-level campaign response from ActiveCampaign API
"344": {"subscriberid": "451267", "orgname": "", "times": "0", "phone": "", "tstamp": "2014-03-28 00:51:14", "email": "[email protected]"}, "0": {"subscriberid": "439666", "orgname": "", "times": "0", "phone": "", "tstamp": "2014-03-28 00:51:14", "email": "[email protected]"}, "346": {"subscriberid": "451324", "orgname": "", "times": "0", "phone": "", "tstamp": "2014-03-28 00:51:14", "email": "[email protected]"}, "347": {"subscriberid": "451330", "orgname": "", "times": "0", "phone": "", "tstamp": "2014-03-28 00:51:14", "email": "[email protected]"}
{"open_list": [], "campaign_id": "90"}{"open_list": [{"times": "304", "tstamp": "2014-03-07 13:49:26", "subscriberid": "395746", "email": "[email protected]"}], "campaign_id": "89"}{"open_list": [], "campaign_id": "20"}{"open_list": [{"times": "2", "tstamp": "2013-01-22 15:00:20", "subscriberid": "14604", "email": "[email protected]"}], "campaign_id": "8"}
{"0": {"info": [{"subscriberid": "5", "orgname": "", "times": "1", "phone": "", "tstamp": "2015-03-29 22:58:27", "email": "[email protected]"}, {"subscriberid": "8", "orgname": "", "times": "1", "phone": "", "tstamp": "2015-03-29 23:03:03", "email": "[email protected]"}], "a_unique": "2", "tracked": "1", "link": "https://github.com/DataKind-SG", "a_total": "2", "id": "26", "name": ""}, "result_output": "json", "result_message": "Success: Something is returned", "result_code": 1}}
Open list Unopen list Link list

Open rates
Why raw open rate is a bad estimate?
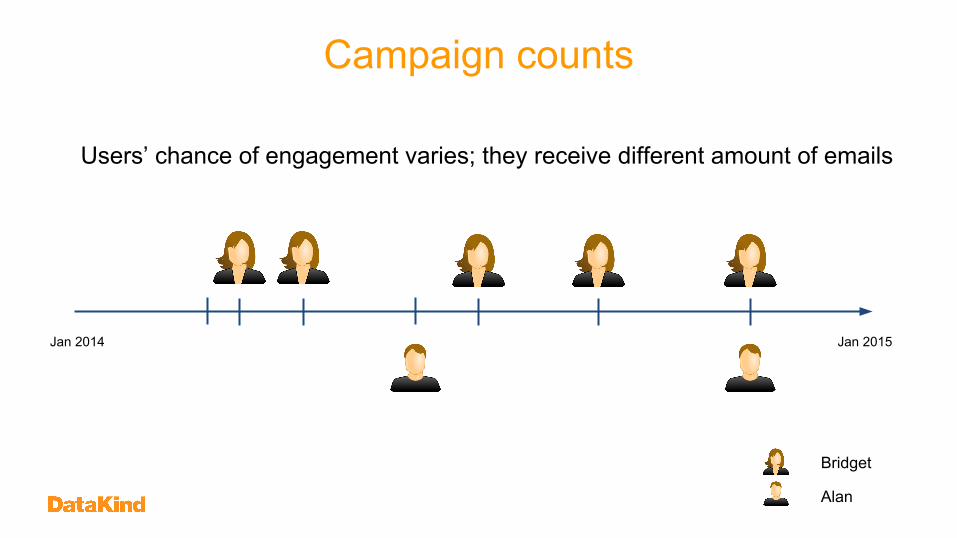
Campaign counts
Users’ chance of engagement varies; they receive different amount of emails
Jan 2014 Jan 2015
Bridget
Alan
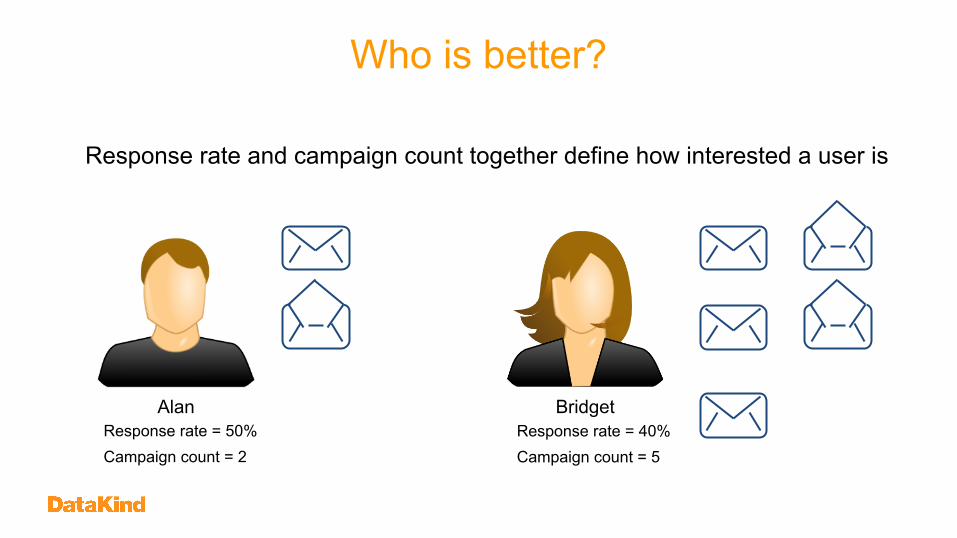
Who is better?
Response rate and campaign count together define how interested a user is
Alan BridgetResponse rate = 50%Campaign count = 2
Response rate = 40%Campaign count = 5
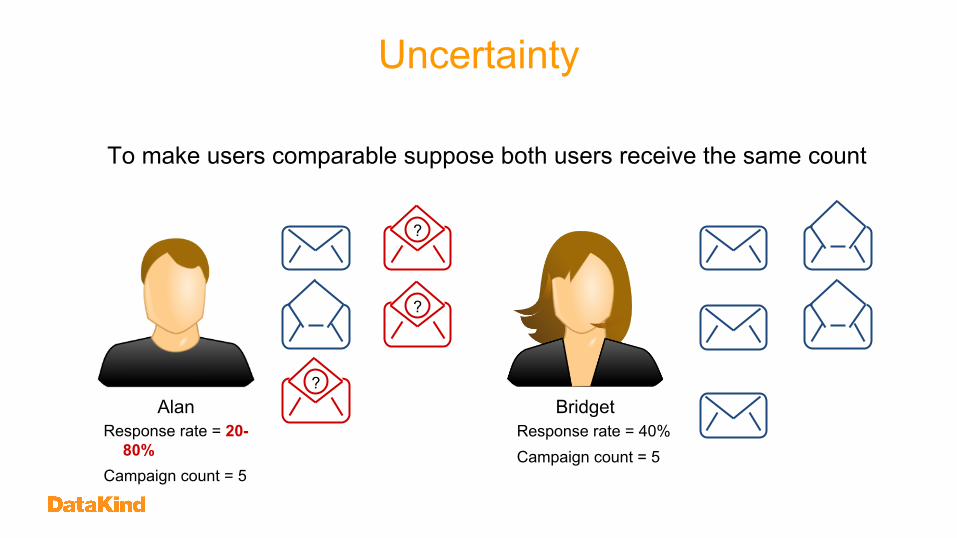
Uncertainty
To make users comparable suppose both users receive the same count
Alan BridgetResponse rate = 20-
80%Campaign count = 5
Response rate = 40%Campaign count = 5
?
?
?

Expected open rate
Calculate expected open rate based on distribution of open rate

Using evidence of open count
We already know Alan opened one e-mail and did not open another
• OpenCount >= 1• UnopenCount >= 1 → UnopenCount = CampaignCount - OpenCount

Generalize to N campaigns
Expected open rate is weighted average of the conditional expected values
• M maximum campaign count any user received in the dataset• j number of campaigns that Alan received

Score component examples

Final scoring
0.75 * Click-through score + 0.25 * Open score
Best userDistribution of score

Globe Visualisation - EARTH HOUR
ProblemMake a sexy visualisation for eye candy
SolutionPre-canned javascript package!

Globe Visualisation
http://datakind-sg.github.io/
- Height of each bar is related to number of Twitter followers of Earth Hour, and color is related to temperature change from 1970’s to 1990’s
- WebGL Globe is used: https://www.chromeexperiments.com/globe
- Essentially, you just need to pass in a JSON formatted array with the following form:
[lat1, long1, height1, colour1, lat2, long2, height2, colour2, …]
- You can use the code as a template: https://github.com/DataKind-SG/datakind-sg.github.io

Globe Visualisation - Colour
- The temperature data is available from the IPCC: http://www.ipcc-data.org/cgi-bin/ddc_nav/
- This is a (bad) proxy for degree of climate change at each lat/long, and Earth Hour suggested a broader measure.
- The temp difference between the 1970’s and 1990’s was scaled to be between 0 and 3 so that blue corresponds to the biggest decrease in temp during that period, and red corresponds to the biggest increase in temp.
- As homework for you… change the color map so that there isn’t green in the middle.
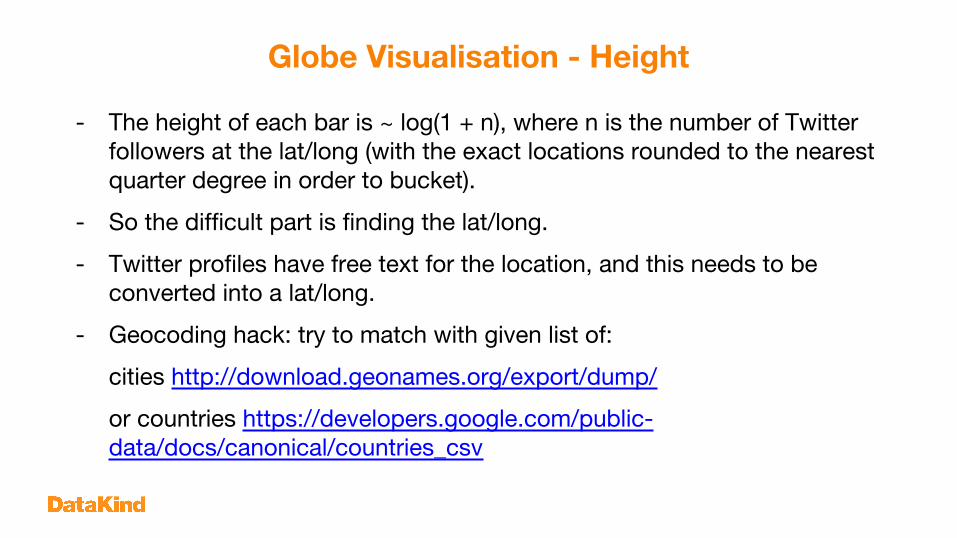
Globe Visualisation - Height
- The height of each bar is ~ log(1 + n), where n is the number of Twitter followers at the lat/long (with the exact locations rounded to the nearest quarter degree in order to bucket).
- So the difficult part is finding the lat/long.
- Twitter profiles have free text for the location, and this needs to be converted into a lat/long.
- Geocoding hack: try to match with given list of:
cities http://download.geonames.org/export/dump/
or countries https://developers.google.com/public-data/docs/canonical/countries_csv

Geocoding hack
- Code is here https://github.com/oliverxchen/geovis, quasi-pseudo code below.- We’ll look at what happens to a few examples of inputs:
- "Üt: 10.253083,-67.585859"- "01.350750086, 103.951196586"- "Bristol, UK"- "between sky and earth"- "CALAMBA, laguna, philippines"- “Singapore”- "Xalapa, Veracruz, Mexico"

Geocoding hack
The program is basically just a big loop through all of the free text locations and applying the following in sequence.
A) standardize the string (change to lower case, replace multiple spaces with single spaces)
- "Üt: 10.253083,-67.585859"- "01.350750086, 103.951196586"- "between sky and earth"- "bristol, uk"- "calamba, laguna, philippines"- "singapura"- "xalapa, veracruz, mexico"

Geocoding hack B) if the string starts with "Üt:", usually followed by an actual lat/long which can be directly used
In the example strings,
"Üt: 10.253083,-67.585859" is mapped to [10.253083,-67.585859]
C) split remaining strings by commas
- ["01.350750086", "103.951196586"]- ["between sky and earth"]- ["bristol", "uk"]- ["calamba", "laguna", "philippines"]- ["singapura"]- ["xalapa", "veracruz", "mexico"]

Geocoding hack
D) if single string after split and there’s no match yet, try to match with country list
- ["singapura"] is matched to "singapore" - ["between sky and earth"] is not mapped
E) if two strings after split and there’s no match yet, try to parse to a lat/long:
- ["01.350750086", "103.951196586"] is mapped to [1.350750086, 103.951196586]- ["bristol", "uk"]: float parse fails

Geocoding hack (cont.) F) if there isn’t a match yet
try to match zeroth string to list of cities
- ["bristol", "uk"] is mapped to "bristol, united states" (Whoops!)- ["between sky and earth"] is not mapped- ["calamba", "laguna", "philippines"] is mapped to "calamba, philippines"- ["xalapa", "veracruz", "mexico"] is not mapped

Geocoding hack (cont.) G) if there still isn’t a match yet
try to match the last string to list of countries
- ["between sky and earth"] is not mapped- ["xalapa", "veracruz", "mexico"] is mapped to "mexico"
H) if still no match, you’re out of luck
- ["between sky and earth"]

Geocoding hack (cont.)- To deal with typos and ‘interesting’ spellings, match to cities and countries is done
using a Jaro-Winkler measure (similar to Levenshtein edit distance, but higher weight on letters early in the word).
- Largest Jaro-Winkler value is used and needs to be above a threshold to be considered a match.
- Python package is python-levenshtein- Other logic to use previous results if standardized strings match- Many improvements are possible! Eg:
- non-uniqueness of city names is not handled- splitting on not just commas- etc.

Agenda
1. DataKind Singapore updates2. DataDive Overview3. DataDive Sharing: Earth Hour4. DataDive Sharing: HOME5. Data handling best practices

How many cases does HOME receive each year, segmented by domestic and non-domestic workers?
- Problems faced- Dates had to be
reformatted while reading into R
- Some outlier cases had to be removed (e.g., year > 2016)
- Demo on how plot was created

Across nationalities, what’s the proportion of workers placed by each agency?
- Problems faced- Some country
data was in free text and had to be integrated
- Demo on how plot was created

HOME: Worker Salary Data
What’s the salary range for each nationality?● Overall● Domestic Workers● Non-domestic Workers

HOME: Worker Salary DataKey Challenges:● Missing salary● Inconsistent units (per hour/day/week/month) or missing units● Different currencies (SGD, USD, MYR)● Ranges given (eg 6-8)● Converting hours/days/weeks to months
How it was handled:● Using Excel, divide into two columns: values and units● Standardize to monthly salary in third column● Discovered on the second day that a filter hadn’t been applied
correctly, so the columns became misaligned… quick fix was applied, but this should be checked.

HOME: Worker Salary Data
How did we create this?

HOME: Worker Salary Data
Key Lessons
One graph may not be sufficient to convey the intended information.
Be careful of unknowingly comparing apples to oranges.
Postal Code Problem - HOME
- Problem- Postal Codes were not present in every record.
- Solution- Use Google maps API, OneMap API, OpenStreetMap API
to map address to Postal Code

Postal Code Problem - HOME
- Method- Retrieve Postal code using 3 APIs.- Each API returned more than 1 Postal Code for one
address, as each address could map to different Postal codes.- Eg {"postalcode": ["089057", "088542", "079716", "088541",
"079911", "079120"], "address": "fuji xerox"}{"postalcode": ["039801", "039594", "039797", "039596", "039799"], "address": "raffles"}{"postalcode": ["310031", "310035"], "address": "toa payoh"}

Postal Code Problem - HOME

Postal Code Problem - HOME

Postal Code Problem - HOME

Postal Code Problem - HOME
- Problem- All 3 API may or may not returned same set of Postal
codes.
- Solution- Use polling method to decide which Postal code to pick.

Polling/Voting Algorithm
1. Collect all zips across all data source.2. Weigh each zip by the number of times it appears in a data source.3. Select the highest weighted zip.4. Random select if there multiple highest weighted zips.5. Sensor integration.

Polling/Voting Algorithm (Precisely)
1. Let A := ⋃i Ai be the set of all unique zips where Ai is the set of zips from data source i.
2. For each a ∊ A, compute the weight wa = ∑i Ai(a).3. Select the zip a* where ∀a : wa* � wa.
1. A1:= (44, 34, 26, 17), A2:= (34, 45, 17), A3:= (17)2. A = (44, 34, 26, 17, 45)3. w44= 1, w34= 2, w45= 1, w17= 34. a*= 17

Issues
1. Due to privacy concerns, we never saw the full address.2. This means that we have no feel for the data.3. Potential for errors.

Postal Code Problem - HOME
- Map based visualization - Problem : Couldn’t find a geo data to highlight districts in
Singapore.
- Solution : Find the Center Lat Long of each district and show the results with a marker.
- Tools : Used leaflet.js for map visualization. - Geo data for the map was used from openstreet
maps.

Postal Code Problem - HOME
source - https://www.ura.gov.sg/realEstateIIWeb/resources/misc/list_of_postal_districts.htm
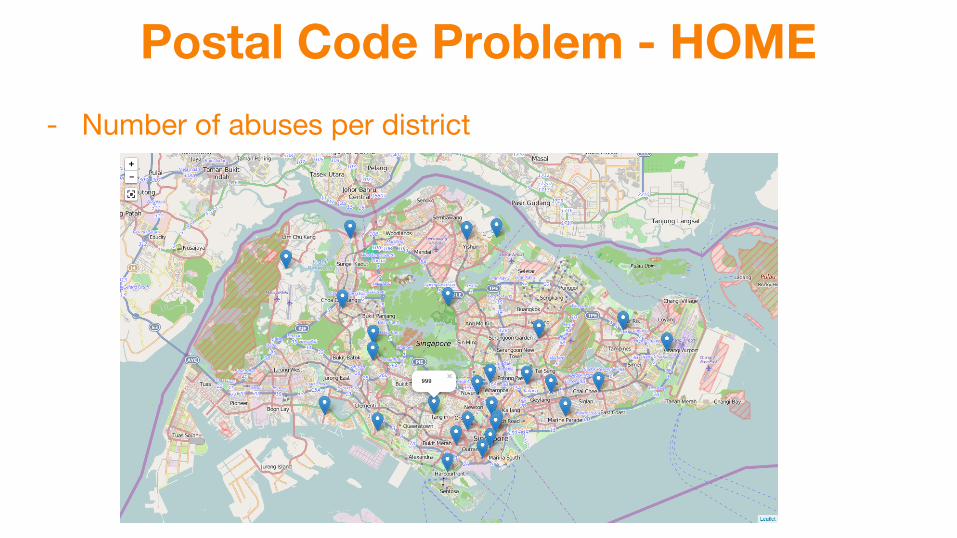
Postal Code Problem - HOME
- Number of abuses per district

Example DC.js plot.
Interactive Data Visualization
Problem:• HOME may need to do analysis in
future to see if the situation has improved/changed
Solution:• Build an interactive data
visualization tool to support self-serviced investigations
Tools:• Used DC.js for data visualization

Interactive Data Visualization5 easy steps to use DC.js
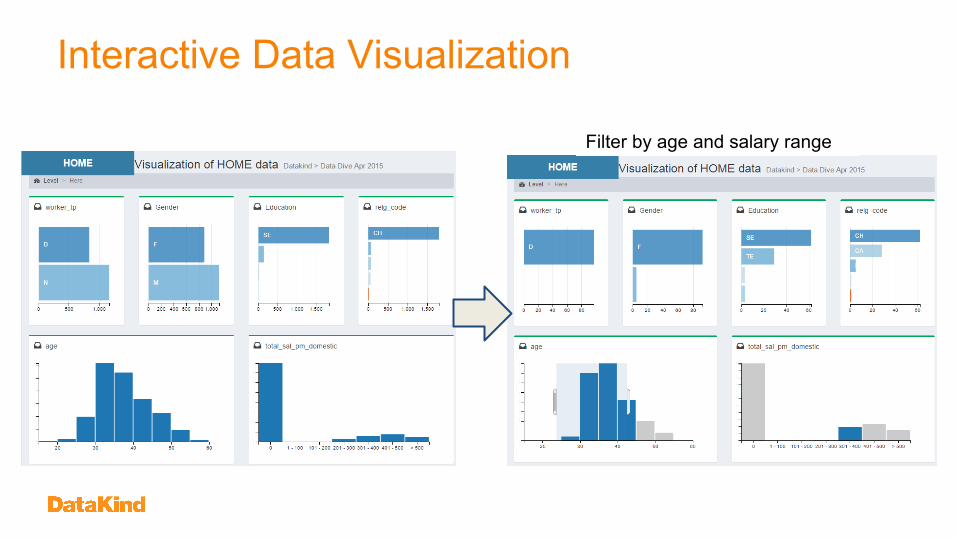
Interactive Data Visualization
Filter by age and salary range

Data anonymization
Problems:• lot of sensitive data:
• first order: name, home address, passport number, birthday, contact number, FIN
• second order: current/previous employer nfo, case created by, agency contact nfo
• HOME data had a lot of free text fields that had various level of private information:
• “Do you want me to treat you like <NAME>?!”• “On <exact date>...”• “His friend, <NAME>, application….”
Data anonymization
• real anonymization:• un-anonymized data should not leave its usual working environment• un-anonymized data should be only handled by authorized users
• this requires a highly portable & easy to use utility:• python - what about Windows?• R - don’t get me started…• compiled CLI utility: so many things can go wrong (apart from which
OS, arch)browsers are pretty bloated SW products; you can do video editing with it.https://github.com/DataKind-SG/HOME

Thanks to our supporters!

Agenda
1. DataKind Singapore updates2. DataDive Overview3. DataDive Sharing: Earth Hour4. DataDive Sharing: HOME5. Data handling best practices

Data handling best practices
• Break up into small groups for discussions on below topics, and appoint a spokesperson to tell the larger group your thoughts• Excel is a versatile tool that many people can use, but it has its
drawbacks. Should future DataLearns cover coding to replace Excel? Should we discourage using Excel or would that discourage some people from participating?
• In the heat of the DataDive, it’s easy to forget to document the steps that were taken in data cleaning and transformations. Any ideas on the fastest, most painless way to document?
• Open for any suggestions!