date: februa ry 8, 2013€¦ · 5th percentile tile rainfall v 24-hour rainf alue was cal all depth...
TRANSCRIPT

Date:
Recipient Project:
Subject:
Tetra Tecdata publiSummaryand from the SOD gfifteen-miregion.
The NCDalone coucoverage,but also fometeoroloknowledginversionsthe PRISMbetter reprprecipitatidownloadwith the p
Using bottotals) andCentral Cassigned tscaling farequested the 85th anwas compdisaggreg85th and 9
1. A0E
Februa
: Tamar
Prepar
Task 2
Rainfa
h previously ished by the N
y of Day (SODprevious expgages provideinute interval
DC data are could not capture there was a nor orographicogical data setge of complexs). These dataM approach taresent orograpion totals are
ded and proceperiod of reco
th of these datd the spatial roast regional to the nearest
actors to spatiathat the meth
nd 95th percenprised of 1,85gated down fro95th percentile
All days with m.1 inches wer
EPA’s EISA T
ary 8, 2013
ra Presser, Ce
ration of 85th
2 – Memo to E
all Depths
developed a sNational ClimD) gages wereerience procee more reliabls. These data
ollected at spee the full varineed to interpc influences. Tt that incorpo
x climatic extra cover the enakes into accophic influenccoarsely predssed for the p
ord for which
ta products toresolution (gristudy area. FNCDC gage.
ally adjust thehodology outlntile rainfall d3 PRISM gridom monthly t
e 24-hour rain
measurable rare eliminated Technical Gui
Te
entral Coast R
and 95th Perc
Explain Proce
set of quality matic Data Cene compiled anessing these dle daily rainfawere used as
ecific locationability of rain
polate rainfall The PRISM Corates observeremes (includntire contiguoount elevationces in areas wdicted in termperiod betweethe NCDC da
ogether providid-based PRIS
For this analys. The monthlye associated Nlined in EPA’depths, the resds (each coveto a daily timenfall depths fo
ainfall were qfrom the dataidance Manua
9l 858.268.5746
Regional Wate
entile Precipi
ess for Develo
controlled honter (NCDC) nd processed. data for modelall totals than s the basis for
ns across the Cnfall in the regtotals across
Climate Grouped point data, ding rain shadus United Stan in the spatiaithout gages.
ms of monthly en October 19ata had been p
ded both the tSM coveragesis, every PRIy time series oNCDC time s’s EISA Techsulting rainfaering a 4×4 kme step. Belowor each of the
queried and soaset to be consal.
9444 Balboa AveFax 858.268.5
er Quality Co
itation Maps
oping 85th an
ourly rainfall for the CentrFrom past co
ling purposes the gages tha
r rainfall temp
Central Coastgion. Becausethe region no
p at Oregon Sa digital elev
dows, coastal ates at a 4×4 kal interpolatioThe only lim
y volumes. Th948 and Septeprocessed pre
temporal resoe) required to ISM grid in thof PRISM daeries data. Be
hnical Guidanall dataset for m square) of t
w is a list of st1,853 4×4 km
orted. Days wsistent with th
enue, Suite 215,5809
ontrol Board
nd 95th Percen
time series usral Coast regiorrespondencs, it had been at collect dataporal distribut
t region; theree of gaps in thot only to accState Universivation map, aneffects, and tkm spatial reson process, th
mitation of thishe PRISM datember 2010 toeviously.
olution (daily derive isohyehe Central Co
ata were then ecause the pro
nce Manual begenerating ththe Central Cteps used for dm grid cells in
with rainfall tohe methodolo
Tetra Tech, San Diego, CA
www.tetratec
ntile 24-hour
sing all availaion. Data frome with NCDCdetermined th
a at hourly or tions across th
efore, that dathe spatial
count for distaity maintains nd expert temperature solution. Beca
he dataset is abs dataset is thta were o be consisten
NCDC rainfaetal maps for oast region wessentially usoject specificae used to calche isohyetal mCoast region, developing thn the region.
otals of less thogy outlined b
h, Inc.
92123ch.com
able m 44 C staff hat
he
taset
ance, a
ause ble to
hat
nt
all the
was sed as ally ulate
maps
he
han by

2. T
Figure 1. 8
The 85th percen
85th percentile
ntile rainfall v
e 24-hour rainf
value was cal
all depth map
lculated for ea
(without smoo
ach 4×4 km g
othing).
grid (Figure 1).
2

3. Aca
4. Tusyi
.
Figure 2. C
5. TStre
6. TatseAlalo
These six depths forthe smoot
A 0.1 inch inteategory conta
The results frosed in the invielded smooth
Conceptual dia
The color conttreet base maeference purp
The final map t a 4-ft wide belect GIS laye
Adobe Reader ayers within thongitude) of th
steps were rer the 4×4 km thed map with
erval legend saining depths
om the 24 nearverse distanceher spatial var
agram showing
tours were renap available froses, such as
was exportedby 5-ft high spers and georefcan be used t
he PDF map he cursor pos
epeated to cregrids withouth contour line
scale was applless than 0.4
rest input sam weighted (IDriation and m
g the spatial av
ndered as semrom ESRI thrroads and riv
d as interactivpatial extent.ferencing infoto interact wiitself. It also
sition on the d
eate the 95th pt smoothing. Fes.
lied to all of tinches.
mple points (aDW) method t
map contours,
veraging doma
mi-transparentough ArcGIS
vers.
ve portable do Using this sp
ormation withth the map. Itallows user to
document.
percentile 24-hFigure 6 show
the map for ra
as conceptuallto create the cas seen in Fig
ain for each gr
t (50 percent)S 10, which in
ocument formpecial featurehin PDF file ft allows the uo see the spat
hour storm dews the map af
ainfall depth,
ly illustrated contour lines gure 3 and Fi
rid cell n.
) and overlaidncludes planim
mat (PDF), dese, the exportedformat. The fr
user to turn ontial coordinate
epth maps. Fifter smoothin
with the low
in Figure 2) wfor the map.gure 4.
d on the Worldmetric feature
signed for prid map preserv
free version ofn or off indivies (latitude an
igure 5 plots sg. Figure 7 sh
3
west
were This
d es for
nting ved f idual nd
storm hows
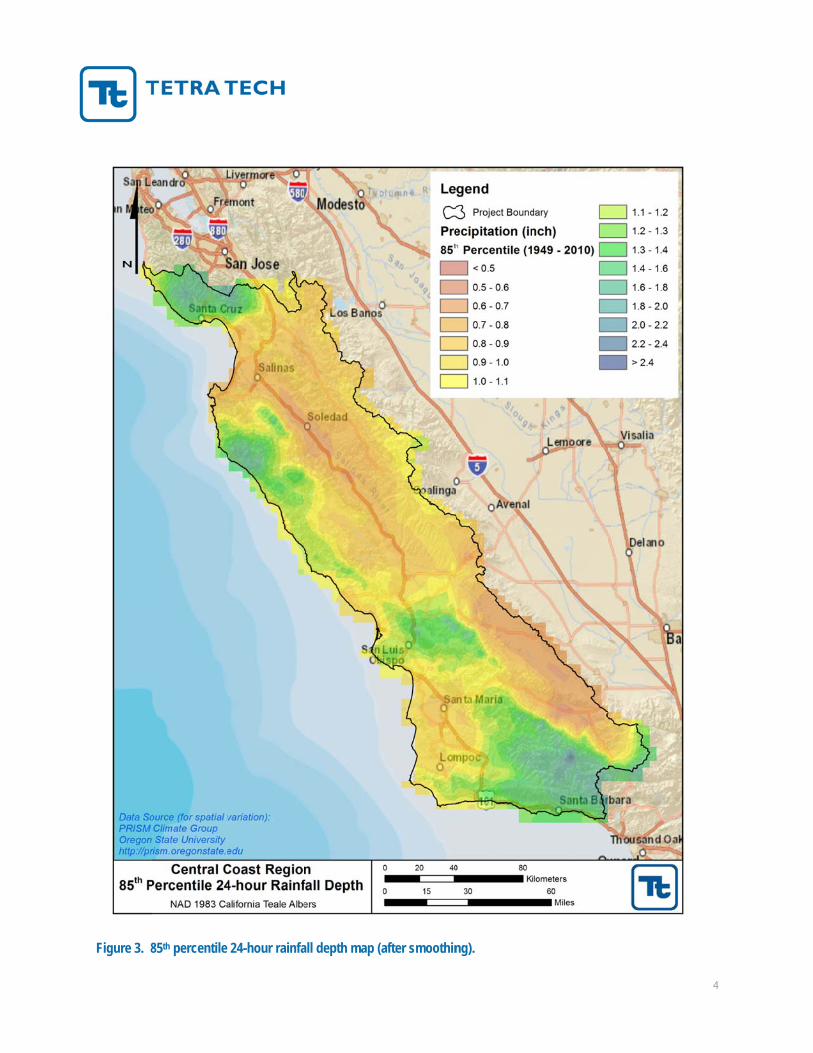
Figure 3. 885th percentile
24-hour rainfaall depth map (
(after smoothinng).
4

Figure 4. 8
85th percentile
24-hour rainfaall depth map (
(after smoothinng and with coontours).
5

Figure 5. 9
95th percentile
e 24-hour rainfall depth map
(without smooothing).
6

Figure 6. 995th percentile
24-hour rainfaall depth map (
(after smoothinng).
7

Figure 7. 9
95th percentile
24-hour rainfaall depth map (
(after smoothinng and with coontours).
8

The Inter
Because odramaticaitself. It idesign depidentify thfollowing
ractive PDF
of the region’ally from one is therefore impth for indivihe exact locat
g pages includ
Precipitation
s diverse climmunicipality
mportant to pridual locationtion of a propde a brief step
n Tool
mates, precipitto the next, a
rovide interesns. This tool posed project a-by-step guid
tation depths and in some csted parties wiprovides easyand determine
de for using th
for the 85th acases within thith a reliable
y access to thee the approprhe interactive
and 95th percehe boundariestool to estima
e data and alloriate design de PDF poster f
ntile storms rs of a municipate the appropows the user tepth. The files.
9
range pality priate to

User Inst
1. O
2. Cdo
Figure 8. A
Figure 9. T
tructions for
Open the PDF
Click the “Layocument (sho
Access the lay
Turn on or off
the Interacti
file in Adobe
yers” toolbar iown in Figure
yers within the
individual laye
ive PDF Prec
e Reader (ver
icon on the lee 8 and Figure
PDF map by c
ers by clicking
cipitation To
sion 9 or later
eft panel to ope 9 below) to v
clicking the “La
the icon besid
ool
r).
pen the list of view and sho
ayers” toolbar
de the layer na
f layers availaow/hide indivi
r icon.
ame.
able within theidual layers.
10
e

3. TlinleFisdeputh
Figure 10.
4. TfeAinli
The document nes and rain g
eft panel to opigure 10. Not
sohyetal contoetermine the curposes. Alsohe individual
Use the “Mod
To enable the seatures, select
Another way ton the “Model st will also di
has been set gauge stationpen the list ofte that when zours may not contour line vo note that thelines or rain g
del Tree” to acc
special cursert the “Object o view rain gTree” windowisplay the full
up to allow us. To view at
f layers withinzooming into be visible so
value. Rain ge mouse maygauge stations
cess layer attr
r for viewing Data Tool” uage attribute w. Just as clicl attributes da
users to view attribute informn the PDF filespecific areasit is importan
gauge attributey need to be cls.
ibute informat
attribute infounder the Editinformation i
cking on the iata in the wind
attribute infomation, click e that have atts on the map,nt that the usee data is provlicked several
ion.
ormation by ct Analysisis to directly cicon does, clicdow below, a
rmation for isthe “Model Ttribute inform, the individuaer use this attrvided for inforl times to suc
licking directmenu, as shoclick on namecking the gagas shown in F
sohyetal contTree” icon on mation, as shoal labels for ribute featurermational
ccessfully sele
tly on map own in Figuree of the rain gge name in theigure 12.
11
our the
own in
to
ect
11. gage e top
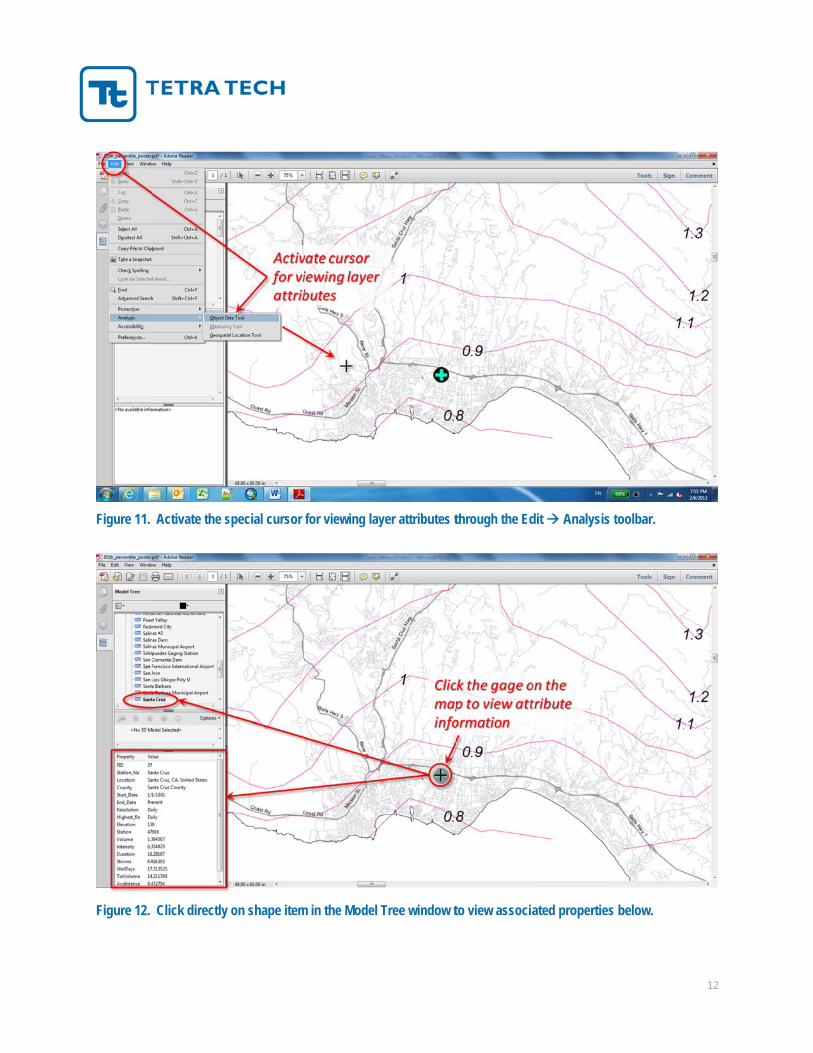
Figure 11.
Figure 12.
Activate the s
Click directly
special cursor
on shape item
for viewing lay
m in the Model
yer attributes t
Tree window t
through the Ed
to view associa
dit Analysis
ated properties
s toolbar.
s below.
12

5. Tselain
Figure 13.
To view the geelect the “Geoatitude and lonnformation wi
Use the “Geo
eoreference inospatial Locatngitude of a pill be displaye
ospatial Locatio
nformation (i.tion Tool” alspoint on the med at the botto
on Tool” to vie
e. latitude anso found unde
map, simply mom right corn
ew the latitude
nd longitude) oer the Edit
move the cursner of the map
and longitude
of any locatio Analysis mesor to the desip, as shown in
e of any point o
on on the mapenu. To view ired location. n Figure 13.
on the map.
13
p the The