date: lesson 8.1. i can graph exponential growth functions; graph exponential decay functions....
TRANSCRIPT
Date:Lesson 8.1


I can graph exponential growth functions; graph exponential decay functions.
Common Core: CC.9-12.F.IF.7e CRS: FUN 501.

Topic: Exponential Growth.
CC.9-12.F.IF.7e Graph exponential and logarithmic functions, showing intercepts and end behavior, and trigonometric functions, showing period, midline, and amplitude.*
CRS FUN 501. Evaluate polynomial functions, expressed in function notation, at integer values

Bell Ringer

Warm-Up ExercisesWarm-Up Exercises
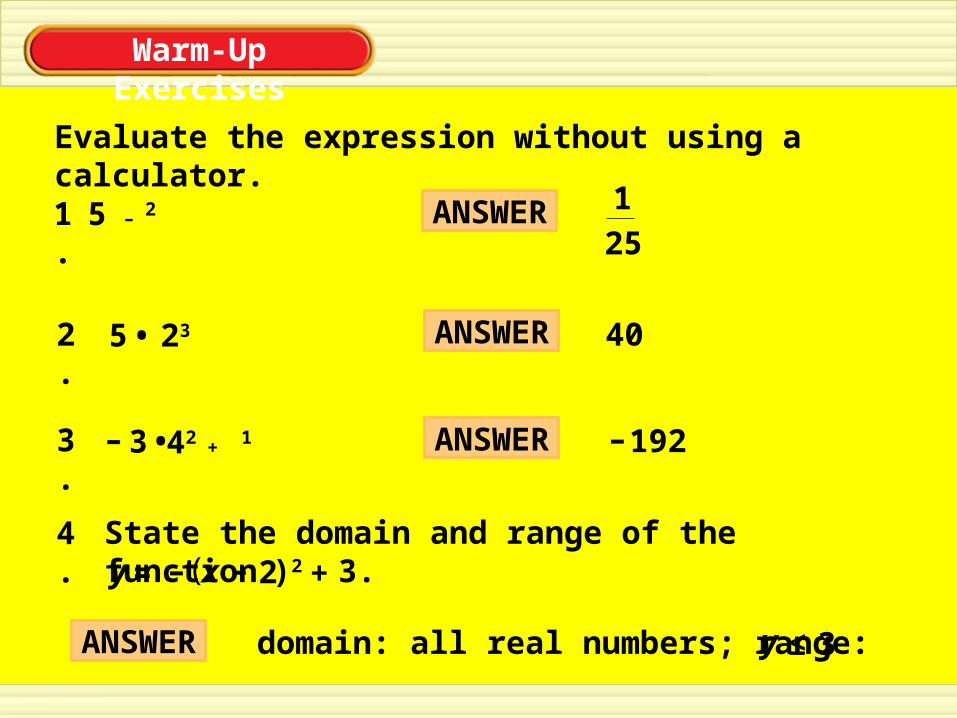
Evaluate the expression without using a calculator.
5 23•2.
State the domain and range of the function –y = ( 2x – )2 3.+
4.
1. 5 2 –
3. •– 3 42 1+
Warm-Up ExercisesWarm-Up Exercises
Evaluate the expression without using a calculator.
ANSWER 1
25
ANSWER 40 5 23•2.
ANSWER – 192
State the domain and range of the function –y = ( 2x – )2 3.+
4.
ANSWER domain: all real numbers; range: y 3≤
1. 5 2 –
3. •– 3 42 1+


Example 1 Graph when and
Graph the function
ab xy = 1a = 1b >
2x.y =
Make a table of values for the function.
SOLUTION
y
1 2 3x 2– 1– 0

Example 1 Graph when and
Graph the function
ab xy = 1a = 1b >
2x.y =
Make a table of values for the function.
SOLUTION
y
1
2
2
4
3
8
x 2– 1–
41
21
1
0

Example 1 Graph when and
Graph the function
ab xy = 1a = 1b >
2x.y =
Make a table of values for the function.
SOLUTION
y
1
2
2
4
3
8
x 2– 1–
41
21
1
0
Plot the points from the table.

Example 1 Graph when and
Graph the function
ab xy = 1a = 1b >
2x.y =
Make a table of values for the function.
SOLUTION
y
1
2
2
4
3
8
x 2– 1–
41
21
1
0
Plot the points from the table.
Draw a curve that passes through the plotted points, as shown.

Example 1 Graph when and
Graph the function
ab xy = 1a = 1b >
2x.y =
Make a table of values for the function.
SOLUTION
y
1
2
2
4
3
8
x 2– 1–
41
21
1
0
Plot the points from the table.
Draw a curve that passes through the plotted points, as shown.
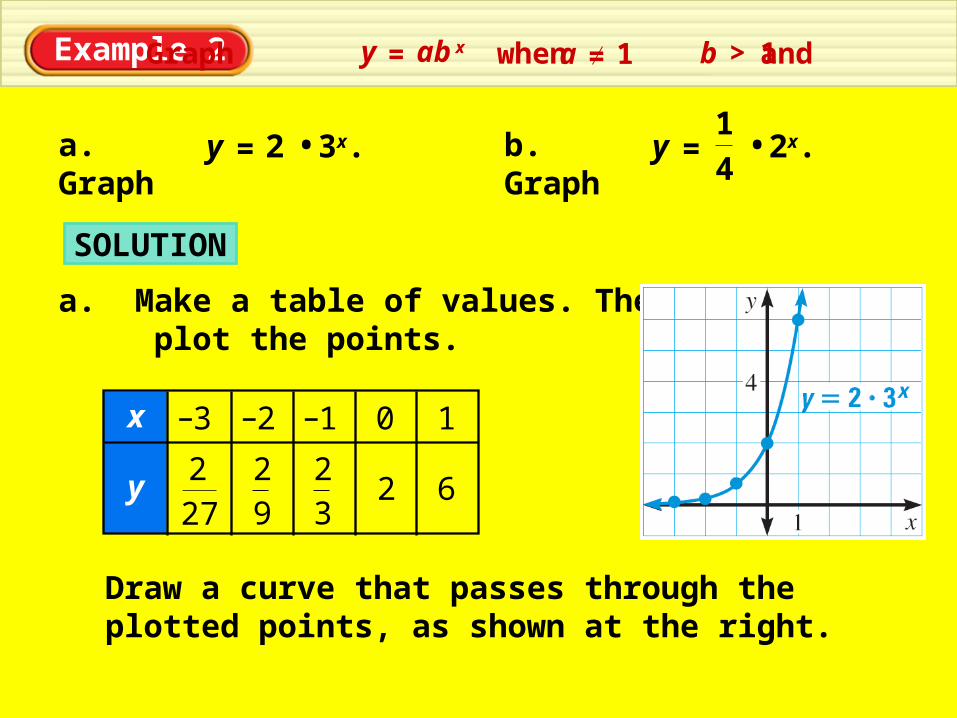
Example 2 Graph when and
a. Graph
ab xy = 1a 1b >=
3x.y = 2 • b. Graph 2x.y = •4
1
Draw a curve that passes through the plotted points, as shown at the right.
SOLUTION
a. Make a table of values. Then plot the points.
y
0
2
1
6
x 3– 2–
92
1–
27
2
32

Example 2
b. Make a table of values. Then plot the points.
y
2
1
3
2
x 1–
41
21
10
81
Graph when andab xy = 1a 1b >
Draw a curve that passes through the plotted points, as shown at the right.
=

Checkpoint
1.
Graph the exponential function.
Graph whenab xy = 1b >
4xy =
2. 5xy =
ANSWER
ANSWER
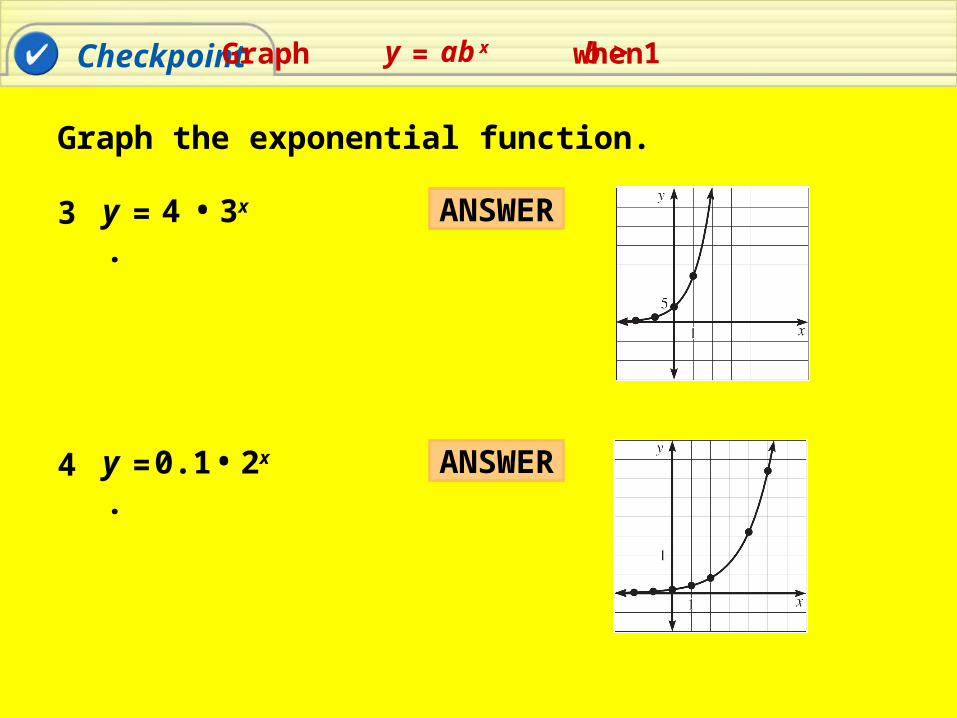
Checkpoint
3.
Graph the exponential function.
Graph whenab xy = 1b >
3xy = 4 •
4. 2xy = 0.1 •
ANSWER
ANSWER


EXIT SLIP
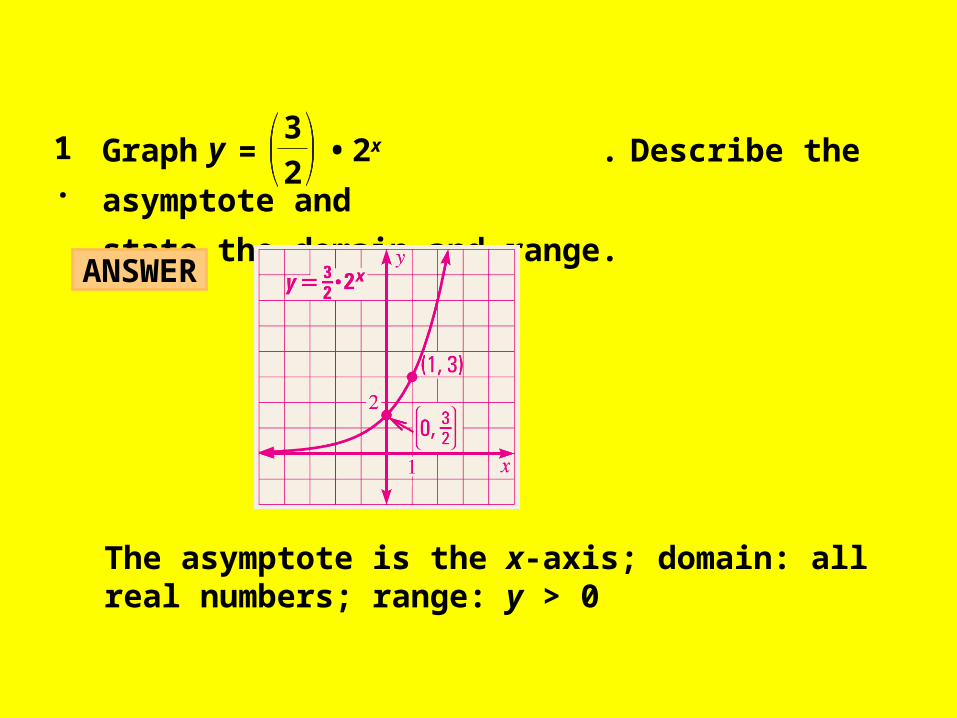
Graph . Describe the asymptote and
state the domain and range.
1. 2
3• 2xy =
The asymptote is the x-axis; domain: all real numbers; range: y > 0
ANSWER
ANSWER
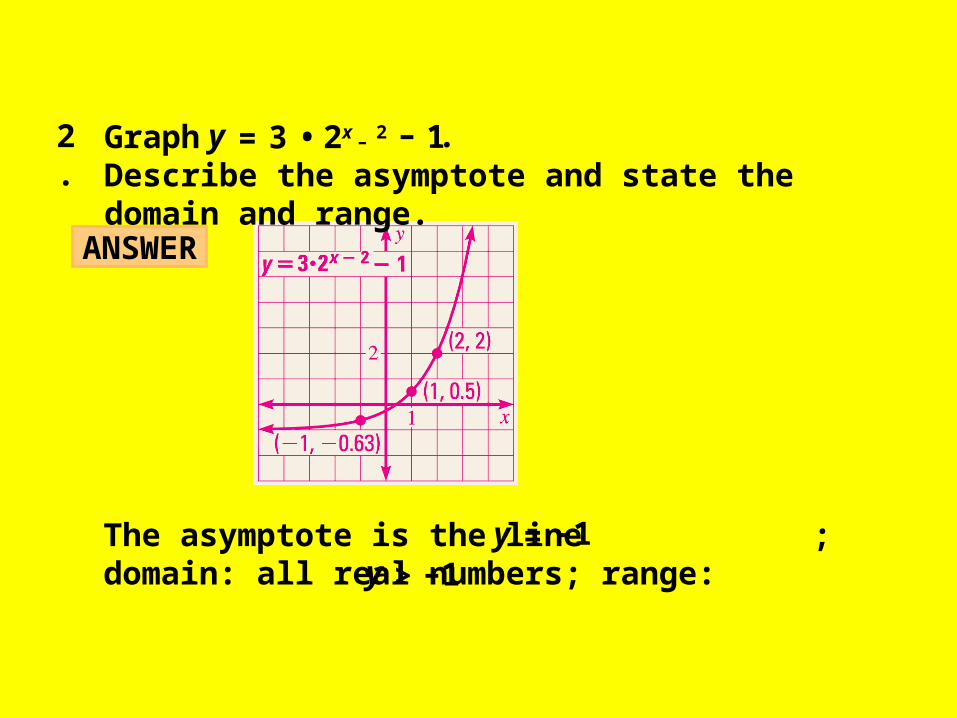
y = 1–>y 1–
The asymptote is the line ; domain: all real numbers; range:
2. Graph Describe the asymptote and state the domain and range.
y = 3 • 12x 2– – .

ANSWER 266.68
3. Evaluate the model whenM = 42.5( )x1.3 =x 7.
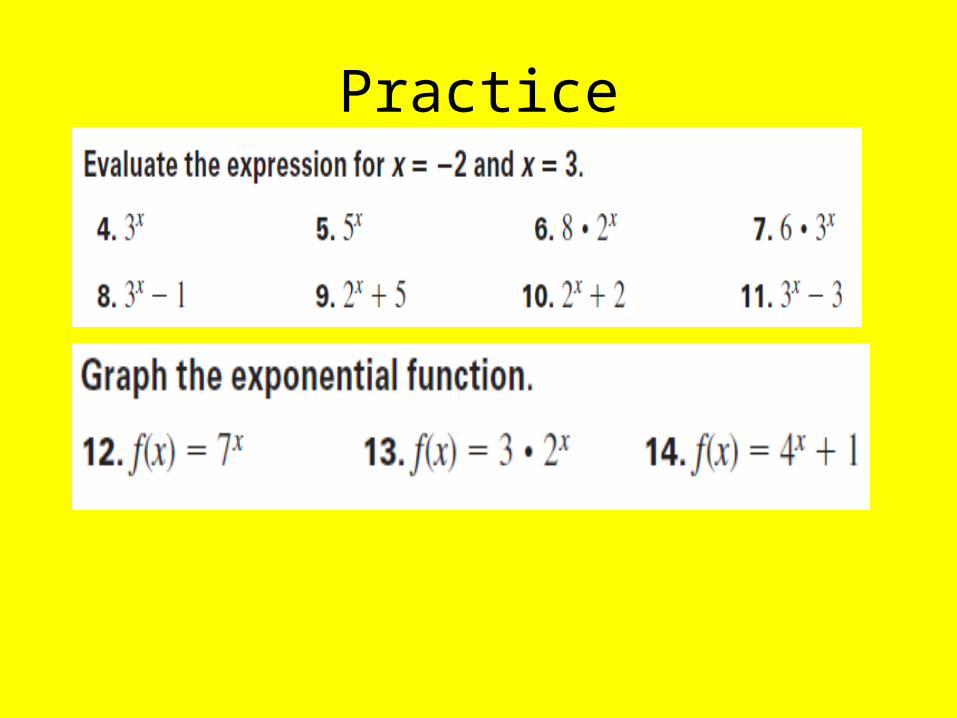
Practice

Math is Fun.
