date: may 5, 2017 hyster-yale materials...
TRANSCRIPT

UNITED STATESSECURITIES AND EXCHANGE COMMISSION
WASHINGTON, DC 20549
FORM 8-K
CURRENT REPORTPursuant to Section 13 OR 15(d)
of The Securities Exchange Act of 1934
Date of Report (Date of earliest event reported): May 5, 2017
HYSTER-YALE MATERIALS HANDLING, INC.(Exact name of registrant as specified in its charter)
DELAWARE 000-54799 31-1637659
(State or other jurisdictionof incorporation)
(CommissionFile Number)
(IRS EmployerIdentification No.)
5875 LANDERBROOK DRIVE, SUITE 300, CLEVELAND, OHIO 44124-4069(Address of principal executive offices) (Zip code)
(440) 449-9600(Registrant’s telephone number, including area code)
N/A(Former name or former address, if changed since last report)
Check the appropriate box below if the Form 8-K filing is intended to simultaneously satisfy the filing obligation of the registrant under any of the following provisions:
☐ Written communications pursuant to Rule 425 under the Securities Act (17 CFR 230.425)
☐ Soliciting material pursuant to Rule 14a-12 under the Exchange Act (17 CFR 240.14a-12)
☐ Pre-commencement communications pursuant to Rule 14d-2(b) under the Exchange Act (17 CFR 240.14d-2(b))
☐ Pre-commencement communications pursuant to Rule 13e-4(c) under the Exchange Act (17 CFR 240.13e-4(c))
Indicate by check mark whether the registrant is an emerging growth company as defined in Rule 405 of the Securities Act of 1933 (§230.405 of this chapter) or Rule 12b-2 of the Securities Exchange Act of1934 (§240.12b-2 of this chapter).
Emerging growth company ☐
If an emerging growth company, indicate by check mark if the registrant has elected not to use the extended transition period for complying with any new or revised financial accounting standards providedpursuant to Section 13(a) of the Exchange Act. ☐

Item 2.02 Results of Operations and Financial Condition.
On May 5, 2017, Hyster-Yale Materials Handling, Inc. (the “Company”) posted on its website, www.hyster-yale.com, an updated investor presentation. A copy is attached as Exhibit 99 hereto.
Item 7.01 Regulation FD Disclosure.
The information disclosed above under Item 2.02 with respect to the investor presentation is incorporated herein by reference.
The information contained in this Current Report on Form 8-K, including Exhibit 99, is furnished pursuant to Item 2.02 and Item 7.01 of Form 8-K and shall not be deemed to be “filed” for purposesof Section 18 of the Securities Exchange Act of 1934, as amended, or otherwise subject to the liability of that section, nor shall it be deemed incorporated by reference in any filing under the Securities Act of1933, as amended, except as shall be expressly stated by specific reference in such filing.
Item 9.01 Financial Statements and Exhibits.
(d) Exhibits. ExhibitNumber Description
99 Hyster-Yale Materials Handling, Inc. Investor Presentation, dated May 5, 2017

SIGNATURES
Pursuant to the requirements of the Securities Exchange Act of 1934, the registrant has duly caused this report to be signed on its behalf by the undersigned hereunto duly authorized. Date: May 5, 2017 HYSTER-YALE MATERIALS HANDLING, INC.
By: /s/ Kenneth C. Schilling Name: Kenneth C. Schilling Title: Senior Vice President and Chief Financial Officer

EXHIBIT INDEX ExhibitNumber Description
99 Hyster-Yale Materials Handling, Inc. Investor Presentation, dated May 5, 2017

Solutions that DRIVE Productivity
Investor PresentationMay 5, 2017
Exhibit 99

2Solutions that DRIVE Productivity
Safe Harbor Statement & DisclosureThis presentation includes forward-looking comments subject to important risksand uncertainties. It may also contain financial measures that are not inconformance with accounting principles generally accepted in the United Statesof America (GAAP).
Refer to Hyster-Yale’s reports filed on Forms 8-K (current), 10-Q (quarterly), and10-K (annual) for information on factors that could cause actual results to differmaterially from information in this presentation and for information reconcilingfinancial measures to GAAP. Past performance may not be representative offuture results.
Guidance noted in the following slides was effective as of the company’s mostrecent earnings release and conference call (May 2, 2017). Nothing in thispresentation should be construed as reaffirming or disaffirming such guidance.
This presentation is not an offer to sell or a solicitation of offers to buy any of Hyster-Yale’s securities.

Solutions that DRIVE Productivity 3
Hyster-Yale at a GlanceHyster-Yale Materials Handling, Inc. (NYSE:HY) is a leading globally integrated, full-line lift truck manufactureroffering a broad array of solutions aimed at meeting the specific materials handling needs of its customers.
_____________________(1) Bolzoni’sfinancial results include pre-tax charges of $2.7 million of one-time purchase accounting adjustments and $6.4 million of depreciation and amortization on acquired assets.(2) EBITDA and ROTCE are non-GAAP measures and should not be considered in isolation or as a substitute for GAAP measures. See non-GAAP explanations and the related reconciliations to GAAP measures in the Appendix starting on page 32.
Key MetricsIn millions (except employee data)
LTM3/31/17
Lift Truck Nuvera Bolzoni
Revenue $2,519.9 $4.8 $157.2
Net Income (loss) $75.5 $(25.8) $1.2(1)
EBITDA(2) $128.5 $(41.4) $14.8
ROTCE (2) (Net debt basis) 18.6% n/m n/m (1)
Net Debt at end of period $48.0 n/m $30.2
Approximate # of Employees (globally) 5,500 200 800
Q1 2017 Sales by Segment
LTM 3/31/17 Sales by Segment
Separate lift truck, attachment and hydrogen power segments
Americas65.0%
EMEA22.7%
JAPIC6.1%
Bolzoni5.8%
Nuvera0.4%
Americas64.1%
EMEA23.4%
JAPIC6.5%
Bolzoni5.9%
Nuvera0.1%

Solutions that DRIVE Productivity 4
Hyster-Yale is a Full-Line Lift Truck Supplier…
ElectricCounterbalanced
Rider TrucksElectric Narrow
Aisle TrucksElectric Hand
TrucksInternal
Combustion Engine(cushion tire)
InternalCombustion Engine
(pneumatic tire)
ElectricCB
3 wheel Electric
4 wheel ElectricPallet Trucks Stackers
Very NarrowAisle Trucks
Order PickersReach Trucks
InternalCombustion
Engine
ICE CB
Laden ContainerHandlers
Big Trucks
Empty ContainerHandlers
Forklifts
Reach Stackers
CLASS 1 CLASS 2 CLASS 3 CLASS 4 CLASS 5
1.0T to 5.5T 1.5T to 6.0T 1.5T to 8.0T 1.0T to 7.0T 1.0T to 52.0T
Warehouse Equipment
Over 260 different truck models available

Solutions that DRIVE Productivity 5
…with a Broad Range of Power Options, Attachments and Solutions
Electric CounterbalancedRider Trucks
Electric Narrow Aisle Trucks
Electric Hand Trucks
Internal Combustion Engine (cushion tire)Internal Combustion Engine (pneumatic tire)
CLASS 1, 2 & 3
Lead-AcidBattery Fuel-Cell
EngineLPG &Bi-fuel
Diesel Tier 3 /Stage IIILPG & CNG
Diesel Tier 4 /Stage IV
Lithium-ionBattery
CLASS 4 & 5Power Options
Technology Architecture
Solutions
AttachmentsClamps
Multipallets
Rotators
SideshiftersFork
Positioners
Push Pulls
Lifting Tables
Forks
55,000+ assetsunder management

Solutions that DRIVE Productivity 6
Five Key Perspectives to Emphasize
Global market unit levels expected to be relatively strong at a high level for next few years
Recovery underway in key markets and segments that have been depressed
7% operating margin at properly balanced HY factory-produced 115,000 units in this cycle remains Lift Truckbusiness target
Programs neededto achieve Lift Truck business target in place; timing of results cannot be forecast with specificity
Recent acquisitions reinforce position in Lift Truck business and speed achievement to targeted 115,000 units
Solutions that DRIVE Productivity 7
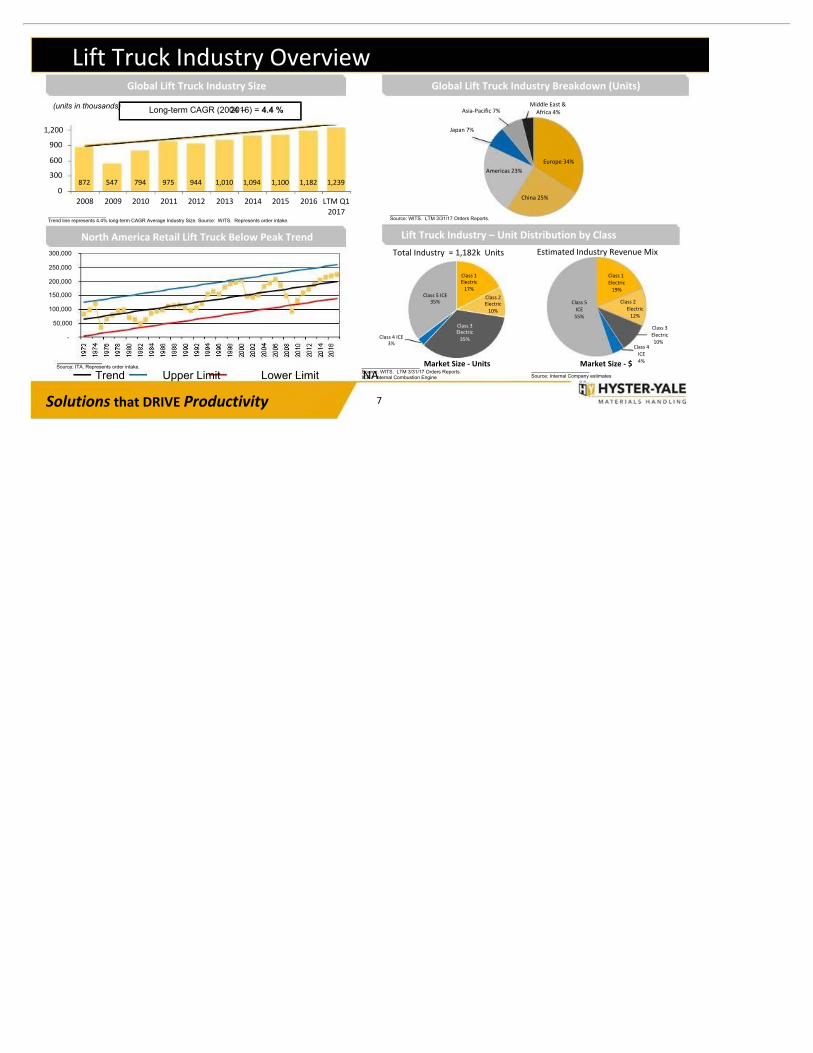
Lift Truck Industry Overview
(units in thousands)
Global Lift Truck Industry Size
_____________________Trend line represents 4.4% long-term CAGR Average Industry Size. Source: WITS. Represents order intake.
North America Retail Lift Truck Below Peak Trend
Long-term CAGR (2004 –2016) = 4.4 %
Lift Truck Industry – Unit Distribution by Class
_____________________Source: WITS. LTM 3/31/17 Orders Reports.ICE = Internal Combustion Engine
Total Industry = 1,182k Units
Class 4ICE4%Market Size - $
_____________________Source: Internal Company estimates
Market Size - Units
Class 5ICE
55%
Class 1Electric
19%
Class 2Electric
12%
Class 3Electric10%
Estimated Industry Revenue Mix
_____________________Source: WITS. LTM 3/31/17 Orders Reports.
Global Lift Truck Industry Breakdown (Units)
Trend Upper Limit Lower Limit NA
-
50,000
100,000
150,000
200,000
250,000
300,000
:
872 547 794 975 944 1,010 1,094 1,100 1,182 1,2390
300
600
900
1,200
2008 2009 2010 2011 2012 2013 2014 2015 2016 LTM Q12017
Europe 34%
China 25%
Americas 23%
Japan 7%
Asia-Pacific 7%Middle East &
Africa 4%
Class 1Electric
17%Class 2Electric
10%
Class 3Electric
35%Class 4 ICE3%
Class 5 ICE35%
Source: ITA. Represents order intake.
Solutions that DRIVE Productivity 8
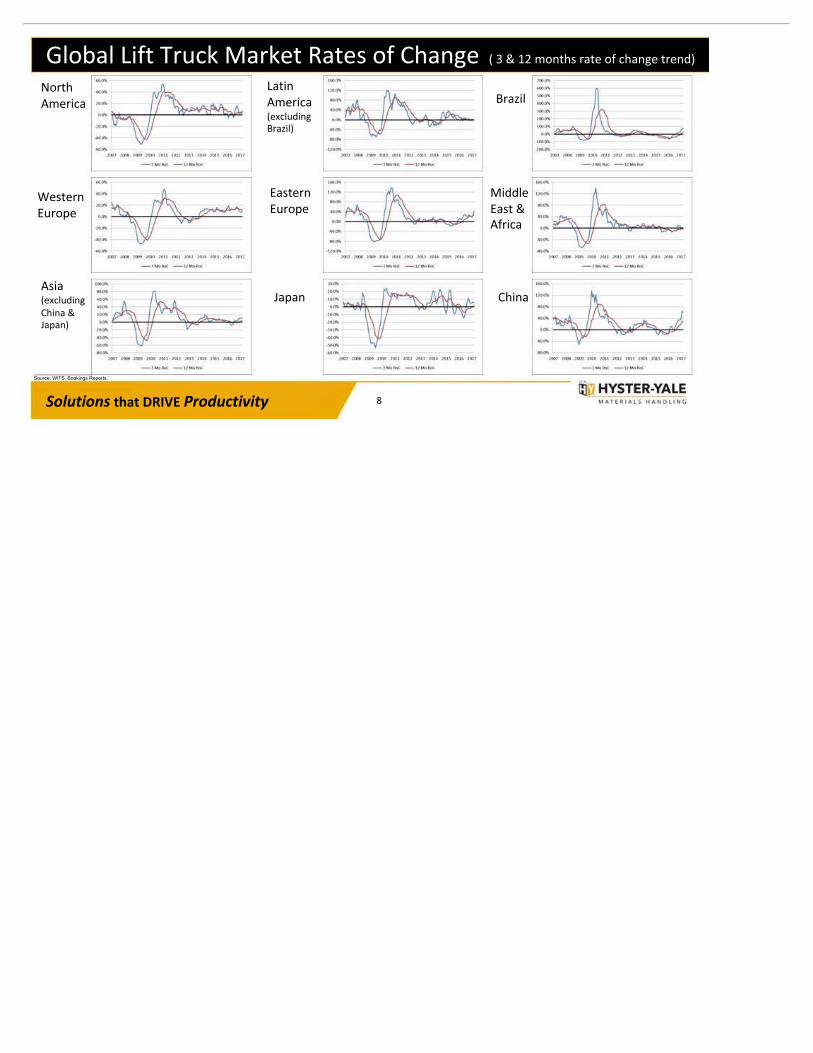
Japan
WesternEurope
EasternEurope
BrazilNorthAmerica
MiddleEast &Africa
LatinAmerica(excludingBrazil)
Asia(excludingChina &Japan)
China
( 3 & 12 months rate of change trend)Global Lift Truck Market Rates of Change
_____________________Source: WITS. Bookings Reports.
Solutions that DRIVE Productivity 9
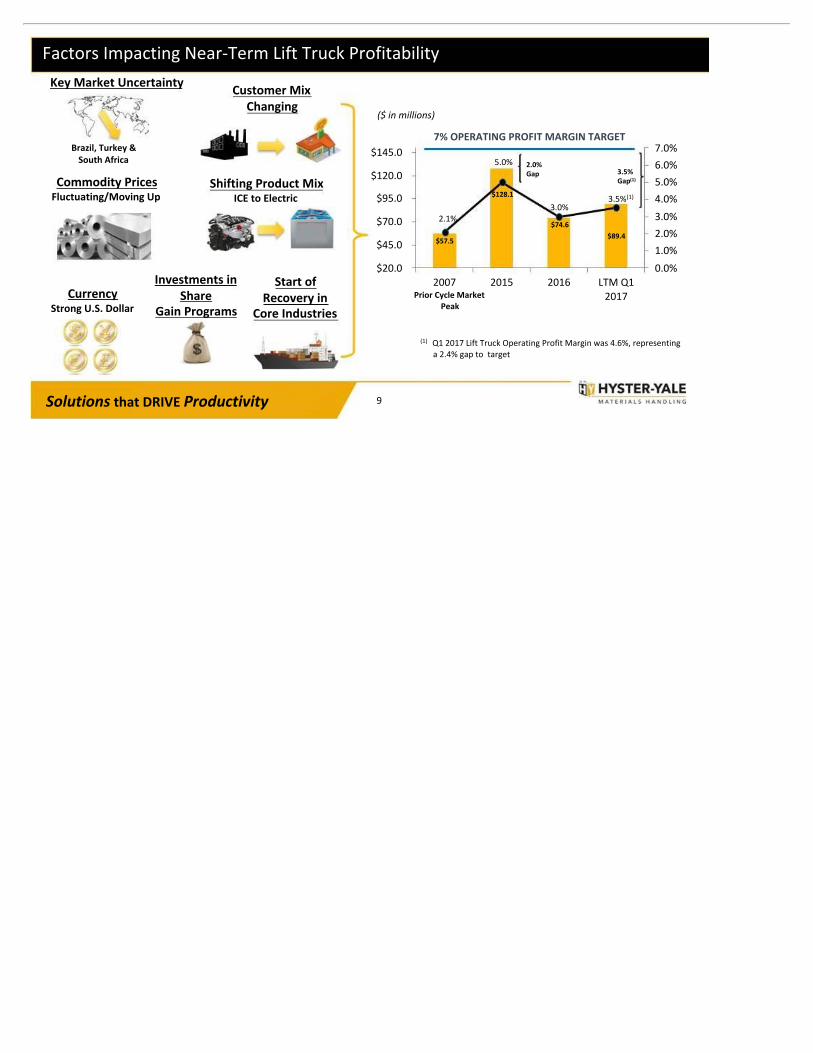
Factors Impacting Near-Term Lift Truck ProfitabilityKey Market Uncertainty
Brazil, Turkey &South Africa
CurrencyStrong U.S. Dollar
Commodity PricesFluctuating/Moving Up
Shifting Product MixICE to Electric
Customer MixChanging
Investments inShare
Gain Programs
($ in millions)
7% OPERATING PROFIT MARGIN TARGET
2.0%Gap 3.5%
Gap(1)
Prior Cycle MarketPeak
Start ofRecovery in
Core Industries
(1) Q1 2017 Lift Truck Operating Profit Margin was 4.6%, representinga 2.4% gap to target
$57.5
$128.1
$74.6$89.4
2.1%
5.0%
3.0%3.5%(1)
0.0%1.0%2.0%3.0%4.0%5.0%6.0%7.0%
$20.0
$45.0
$70.0
$95.0
$120.0
$145.0
2007 2015 2016 LTM Q12017

10Solutions that DRIVE Productivity
Volume of 115,000 Units from HY Factories Required to Achieve 7% Target
7,900Class 1 and 2
trucks
500Big Trucks
Additional units to fill each assembly line
32,900additional units needed to achieve target
Note: 115,000 units does not include volume fromnon-HY manufacturing plants
Increasing unit product profitDecreasing manufacturingvariancesLeveraging relatively stable SG&A
…should increase operatingprofits to target levels by:
12,500Class 3trucks
12,000Class 4 and 5 trucks
Developing relationships with new customers takes timeNew customers often test and phase in productsNew dealers and dealer improvement programs take timeNew products take time to reach full acceptanceAll projects tracked – at different stages of maturity
Our objective is to sell 115,000 HY-produced units in 2018, but a more realistic timeframe may be 2019 - 2020

Solutions that DRIVE Productivity 11
Share Gain Drives Our Economic Engine
Basic Business Areas
Ourstrategiesaredesignedtodriveincreasedshare,whichinturnincreasesthelifttruckpopulation,which
drivespartsandservicevolumes.
Geographicand Product
Balance
WorldwideDistribution
Strength to DriveMarketShare
PartsandServiceVolume
Large Lift TruckPopulation in Service
VolumeEconomiesofScale
Design
Component Commonality
Supply Chain
Manufacturing
Quality
Marketing
Parts
Infrastructure
Capital Requirements
ImproveWarehouse
Position
EnhanceIndependentDistribution
Succeed inAsia
Enhance BigTruck Market
PositionStrengthen the Sales andMarketing Organization
Low Cost ofOwnership
UnderstandCustomer
Needs
Hyster-Yale’s economic engine is driven by increasing unit volume and economies of scale. Core strategic initiatives weredesigned to drive the economic engine by increasing share...
Leverage Solutionsand Technology
Drivers
AlargelifttruckpopulationbasedrivespartsandservicevolumeresultinginenhancedprofitabilityforHyster-Yaleanddealers

Solutions that DRIVE Productivity 12
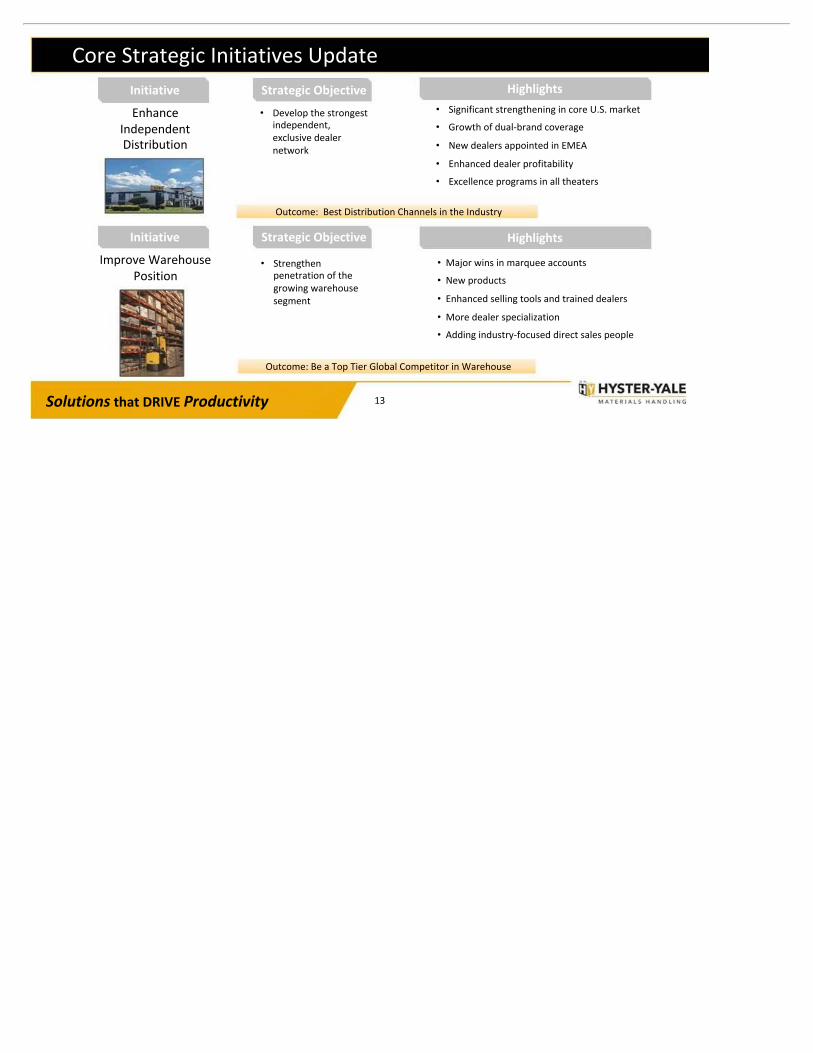
Core Strategic Initiatives UpdateHighlightsInitiative
Highlights
Strategic Objective• Provide the right product
and solution to meet thespecific needs of differentcustomers across multipleindustries
• Product fit for application• Premium, Standard and Utility products• Unique innovations• Automation & Telemetry• Leverage Bolzoni relationship• Market leadership in U.S., such as heavy
duty industries, e.g. Paper• Growing success in trucking industry
UnderstandCustomer Needs
Strategic Objective
• Deliver lowest cost ofownership for allcustomers based ontheir specificapplication
Initiative
Low Cost ofOwnership
• Improved fuel / energy consumption• Engine to electric conversion• Expanding data services on growing number
of telemetry systems (30K+)• Supplier quality, all-time high• Fleet management
Outcome: Win in Targeted Major Accounts and Applications
Outcome: Competitive Advantage across Product Segments
Solutions that DRIVE Productivity 13
Core Strategic Initiatives UpdateInitiative
Initiative
Strategic Objective Highlights
• Develop the strongestindependent,exclusive dealernetwork
EnhanceIndependentDistribution
Strategic Objective Highlights
• Strengthenpenetration of thegrowing warehousesegment
Improve WarehousePosition
• Significant strengthening in core U.S. market
• Growth of dual-brand coverage
• New dealers appointed in EMEA
• Enhanced dealer profitability
• Excellence programs in all theaters
Outcome: Best Distribution Channels in the Industry
Outcome: Be a Top Tier Global Competitor in Warehouse
• Major wins in marquee accounts
• New products
• Enhanced selling tools and trained dealers
• More dealer specialization
• Adding industry-focused direct sales people

Solutions that DRIVE Productivity 14
Core Strategic Initiatives UpdateStrategic Objective HighlightsInitiative
Succeed in Asia
Strategic Objective HighlightsInitiative
Enhance Big TruckMarket Position
• Expand marketpenetration throughoutAsia
• Increase leading marketposition and becomesupplier of choice in BigTruck segment
Outcome: Increase Share and Strengthen Distribution at Accelerated Pace
Outcome: Enhance leading market position in Big Trucks
• Leveraging Euro cost position in U.S.dollar markets
• Focus on industry and solutions• Increased success with large port
operators• Successful new product launches• Heart-of-market products under
development
• Enhancement of dealer network anddirect-selling capabilities
• Development of long-term strategicpartnerships
• Development of right local products• Establishment of support
infrastructure• Leveraging Big Truck success

Solutions that DRIVE Productivity 15
Core Strategic Initiatives UpdateStrategic Objective HighlightsInitiative
Strengthen Salesand MarketingOrganization
• Strengthen and alignsales and marketingorganization in allgeographic regions
Outcome: Gain momentum leading to higher unit volumes and enhanced market share
• Smaller sales management areas• Implementing new sales approach to enhance
solutions selling skills• Major focus on account identification and coverage• Expanded direct-selling teams in all regions• Solutions organization links Engineering with Sales• Increased global account focus
Leverage Solutions &Technology Drivers
• Acquisition of Bolzoni• Acquisition of Speedshield distribution (telematics),
strengthening HY’s telematics offering • Development of Nuvera fuel-cell engines and hydrogen
generation units• Leverage expertise of HY and dealer channel• Partnership with BALYO (automation)• Relationship with Electrovaya (Lithium-ion battery)
• Become a one-stopmaterials handlingsolutions provider
Outcome: Increase business from existing customers and new customers attracted to HY’s integrated solutions
Strategic ObjectiveInitiative Highlights
Solutions that DRIVE Productivity 16
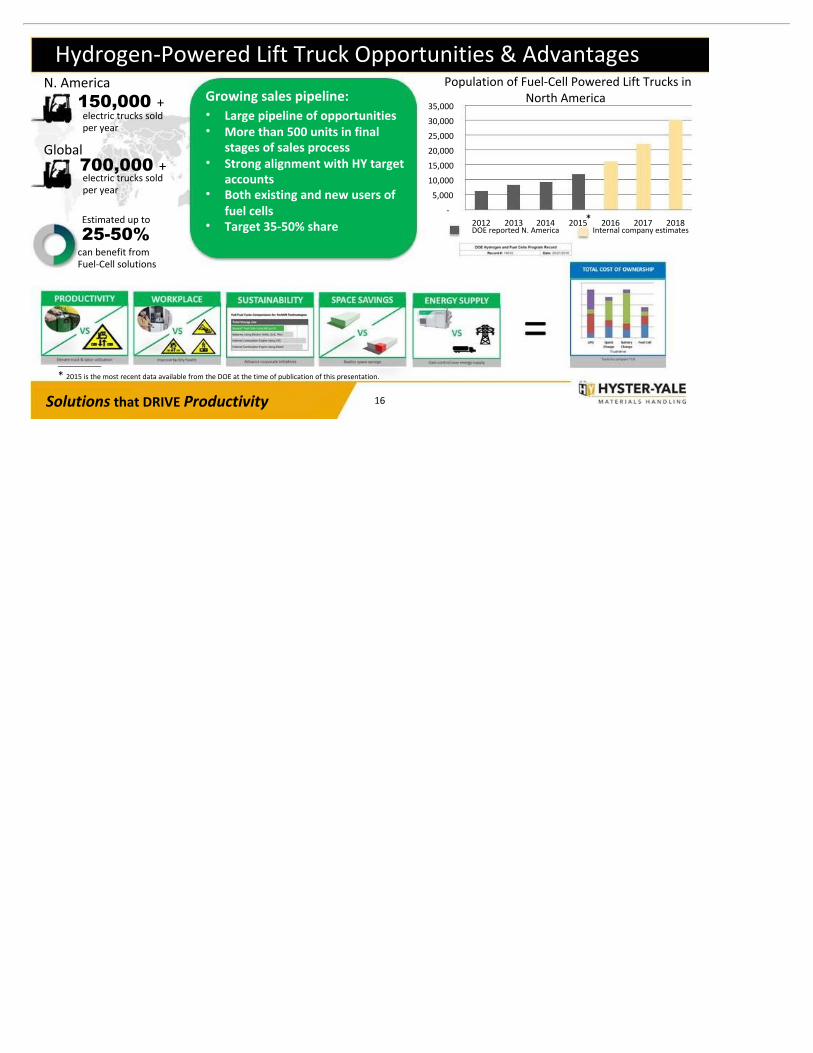
Hydrogen-Powered Lift Truck Opportunities & AdvantagesN. America
electric trucks soldper year
150,000+
25-50%Estimated up to
can benefit fromFuel-Cell solutions
Global700,000+electric trucks soldper year
Growing sales pipeline:• Large pipeline of opportunities• More than 500 units in final
stages of sales process• Strong alignment with HY target
accounts• Both existing and new users of
fuel cells• Target 35-50% share
Population of Fuel-Cell Powered Lift Trucks inNorth America
*
__________
* 2015 is the most recent data available from the DOE at the time of publication of this presentation.
-
5,000
10,000
15,000
20,000
25,000
30,000
35,000
2012 2013 2014 2015 2016 2017 2018Internal company estimatesDOE reported N. America

Solutions that DRIVE Productivity 17
Growth Strategy – Where Will Fuel Cells Be Used• Convert existing fuel cell users
- Promote the Nuvera benefits vs competition
• Increase market penetration inexisting lead-acid battery users- Promote the performance and convenience
of Nuvera
• Build new markets with existingICE truck users- High productivity in a clean energy solution- Address increasing emission regulations in
certain applications and jurisdictions
Gen1
Drop-InBBR /
IntegratedSolution
Gen2
Fuel Cell HybridTruck Engine /
IntegratedSolution
Approximate Engine Power Requirement [kW]1-3 3-10 20-30 30-50 50-15010-20
Solutions that DRIVE Productivity 18
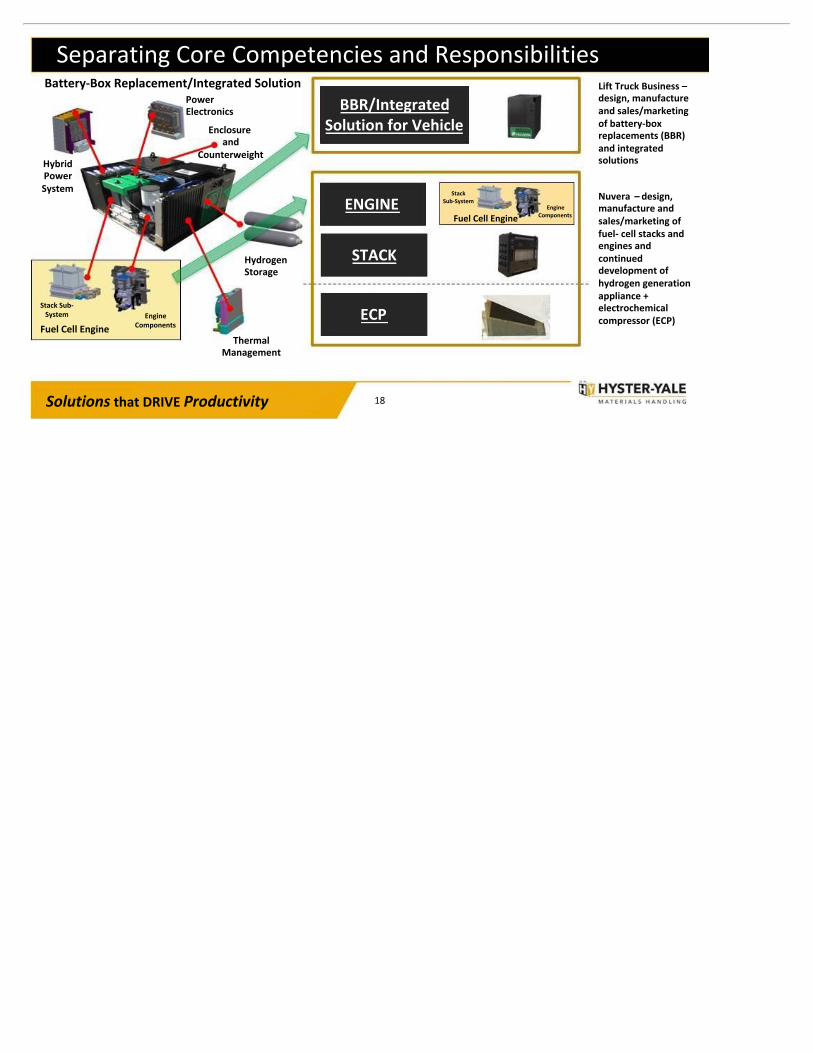
Separating Core Competencies and Responsibilities
ECP
STACK
ENGINE
BBR/IntegratedSolution for Vehicle
EngineComponentsFuel Cell Engine
Lift Truck Business –design, manufactureand sales/marketingof battery-boxreplacements (BBR)and integratedsolutions
Nuvera – design, manufacture andsales/marketing offuel- cell stacks andengines andcontinueddevelopment ofhydrogen generationappliance +electrochemicalcompressor (ECP)
PowerElectronics
HybridPowerSystem
Stack Sub-System Engine
Components
HydrogenStorage
ThermalManagement
Fuel Cell Engine
Enclosureand
Counterweight
Battery-Box Replacement/Integrated Solution
StackSub-System

Solutions that DRIVE Productivity 19
Nuvera / Hyster-Yale Competitive Advantages
INDUSTRIALIZATION
Demand Flow / Lean ManufacturingSupply Chain expertise & Quality Management systemsValidation and reliability growth testing
TECHNOLOGYPatented fuel-cell stack design – performance & costTechnology roadmap – leverage development and volumeAdvanced compression and generation technology
COMMERCIALIZATION
Financially strong OEM ownership with long-term perspectiveShift of BBR/Integrated Solutions production to Lift Truck businessLeverage expertise of HY & dealer sales and service organizationsSimplified transaction – single supplier, with financing options
ALL-IN FUEL CELLSOLUTION
Orion® Fuel-Cell StackNuvera® Fuel-Cell System (BBR/Integrated Solution)Nuvera® Hydrogen GeneratorHydrogen Refueling

Solutions that DRIVE Productivity 20
The Nuvera Plan
• Successfully shipped product to launch customer
• Current generation BBR production at Nuvera®
• Focus on reducing cost of product to target cost
• Design, manufacturing and aftermarketresponsibility for next generation BBR andintegrated solutions transferred to Lift Truckbusiness
• Nuvera® focus on development of ECP, fuel-cellstack and engine
• Nuvera® continued development of Nuvera®Hydrogen Generator and Hercules ECP
• Leadership team enhanced and activities increased
• Discussions underway with various partnersinterested in Nuvera® technology
• Launch of Orion® 2 with increased power density andgreater fuel efficiency
• Rapid ramp up in production of BBR and integratedsolutions at Greenville, NC plant to meet anticipatedexpanding demand
• Continued focus on reducing cost of product to targetcosts and achieving targeted fuel-cell engine volumes
• Expansion into EMEA and JAPIC markets• Execute partner opportunities• Achieve break-even per quarter at target margins
sometime in 2018• Profitability at /above HY target economics over longer
term• Launch of hydrogen compressor technology beyond
2020
Current Phase2017
Current Phase2017
Next Phase2018+
TM
Solutions that DRIVE Productivity 21
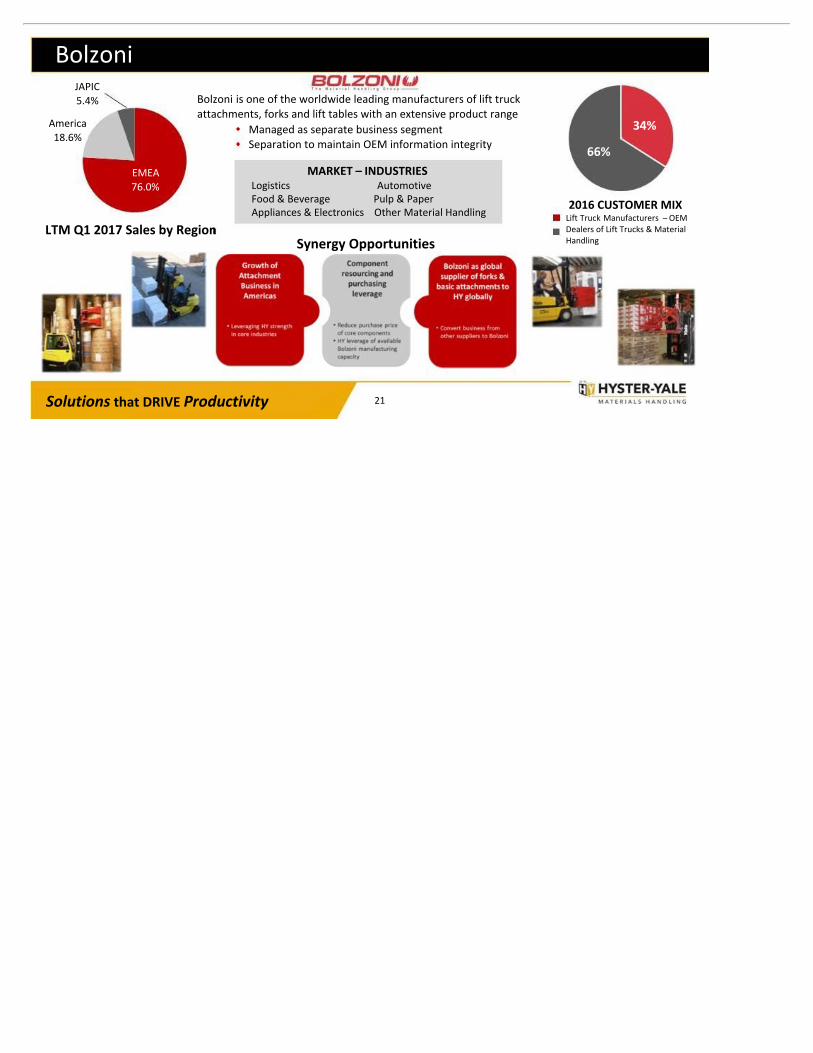
BolzoniBolzoni is one of the worldwide leading manufacturers of lift truckattachments, forks and lift tables with an extensive product range
LTM Q1 2017 Sales by Region
• Managed as separate business segment• Separation to maintain OEM information integrity
34%
66%
2016 CUSTOMER MIXLift Truck Manufacturers – OEMDealers of Lift Trucks & MaterialHandling
MARKET – INDUSTRIESLogistics AutomotiveFood & Beverage Pulp & PaperAppliances & Electronics Other Material Handling
Synergy Opportunities
EMEA76.0%
America18.6%
JAPIC5.4%

Solutions that DRIVE Productivity 22
HY Path for Future Growth Includes Other Important Elements…
Through Core Lift TruckBusiness Share Gain
ThroughAcquisition
ThroughPartnership
Through Investmentin New Technologies

Solutions that DRIVE Productivity 23
Strategy Roadmap for Share Gain Through New Account Acquisition
Facilitating Structures• Account Identification teams
in each region
• New CRM/CPQ global tool
• Application Centers
• Industry Strategies /Application Guides
• New STE (Special TruckEngineering) for rapidproduct customization
Industry / Customer Focus• Industry cluster identification• Customers by cluster identification (80/20 rule)• Targeted messaging• Disciplined contact management• Established base position and grow penetration over time
Products &Solutions
Focus
IndustryFocus
IndustryFocus
Geographic
Focus
One-by-One
CustomerFocus
Share Gain Drivers

Solutions that DRIVE Productivity 24
HY Volume Leverage & Target Economics
Incremental Units Produced +5,000 Trucks
Sales $162m
Gross Profit $35m
Operating Expenses $11m
Operating Profit $24m
Incremental Operating Profit % 15.0%As we make progress toward the 115,000 unit productionlevels, HY Lift Truck will generate significant incrementaloperating profit contribution…
Importance of volume growth to reaching target
Target is to move from significant loss to breakeven in a 2018 quarter then to significant
profitability in the long term
NuveraExpect to exceed 7% operating profit target as
programs mature
Bolzoni
Lift TruckLift Trucks Sold 124,000Lift Trucks Produced in HY plants 115,000
Revenues $3,590
Gross Profit $640
Operating Expenses $390
Operating Profit $250
Operating Margin 7.0%

Solutions that DRIVE Productivity 25
2017 First Quarter Highlights
LIFT TRUCK• Revenues up mainly from increased shipments in Americas,
EMEA and JAPIC• Bookings and backlog up modestly compared with Q1 2016• Operating profit increased substantially over Q1 2016 primarily
as a result of improved gross profit, primarily in the Americas,resulting from increased unit and parts volumes, productionefficiencies and improved pricing, net of material cost increases
2017 First Quarter Highlights
2017 First Quarter LTM 3/31/17Consolidated Revenue $713.1 100.0% $2,678.6 100.0%Consolidated Operating Profit $23.4 3.3% $48.6 1.8%Consolidated Net Income $18.1 2.5% $50.9 1.9%EBITDA $36.3 5.1% $101.9 3.8%Lift Truck Operating Profit $30.6 4.6% (1) $89.4 3.5%Bolzoni Operating Profit $2.3 5.5% (1) $2.2 1.4% (1)
Nuvera Operating Loss $(9.5) n/m(1) $(43.0) n/m(1)
($ in millions)
BOLZONI• Incremental revenues of $41.6 million• Q1 operating profit includes $1.4m of amortization on acquired assets.
(LTM operating profit includes $2.7m of one - time purchase accountingadjustments and $6.4m of amortization on acquired assets.)
NUVERA• Revenue of $2.6m• Increased losses due to ramp up of inventory for increased production, an
additional $1.7 million in development and production start-up expenses,including unfavorable inventory adjustments to reflect selling prices, andhigher marketing and employee-related costs.
_____________________(1) Operating Profit (Loss) Margin % is calculated based on the respective business segment’s revenues for the respective period.
(1)

Solutions that DRIVE Productivity 26
2017 Earnings PerspectiveLIFT TRUCK• Global lift truck market expected to grow modestly compared with 2016• Sales volumes and unit and parts revenues expected to increase during remainder of 2017, full year increase anticipated to be more than anticipated
market growth due to anticipated share gains from new products and continued implementation of other share gain initiatives• Due to strong Q1 2017 revenue growth, Q2 2017 growth expected to be more modest, with expected growth increase again in H2 2017• Operating profit expected to increase over 2016 due to enhanced margins through pricing, net of material cost increases, while maintaining headcount
near current levels; but more modest improvement anticipated in H2 of 2017 due to substantial increase in Q1 2017 and expected soft Q3.• Full-year net income expected to increase moderately due to increase in operating profit, partially offset by higher income tax rate in 2017 and absence of
tax benefits recognized in 2016
NUVERA• Integration of Nuvera and Lift Truck business currently being implemented. Nuvera to focus on core competencies of fuel-cell stack and engine
manufacturing and development and commercialization of hydrogen-generation appliance and ECP. Next generation of battery-box replacements andintegration of fuel-cell engines now the responsibility of Lift Truck business.
• Focused on lowering costs of manufacturing, with lo sses expected to progressively decrease over 2017 and 2018, with objective of reaching break-eveningduring 2018 by achieving target costs and target fuel-cell engine volumes.
• Until target cost structure for fuel-cell engines is in place, inventory costs expected to result in continued inventory adjustments to reflect current sellingprices, but at a decreasing rate.
• The net impact of added operational expenses on the Lift Truck business is expected to be modest as existing resources are re-deployed to focus on thesale, development and manufacture of battery box replacements and integrated solutions.
BOLZONI• Revenues expected to increase modestly over LTM 3/31/17 revenues due to anticipated growth in EMEA market, recent major customer commitments and
sales enhancement programs• Implementation of key strategic programs expected to generate substantial growth in operating profit and net income compared with LTM 3/31/17

Solutions that DRIVE Productivity 27
Hyster-Yale Use of Cash Priorities
Return Cash to Stockholders
Investments in Adjacent or ComplementaryBusinesses
Investments in Hydrogen Power Business
Investments in Share Gain Programs
Investments in Core Lift Truck BusinessStrategic initiatives to accelerate growth orenhance margins
Acquisitions of technologies and otherforklift-related businesses, including Bolzoni
Investments to commercialize Nuvera’stechnology
2015 2016 YTD 2017
Annual Dividends (1) $18.4m$1.14/share
$19.2m$1.18/share
$4.9m$1.21/share
2012 to 2014
Share Buyback $49.8m / 694,653 shares of Class A common stock
(1) Dollars represent total dividends paid during calendar year, while dividend per share represents the annualized dividend rate after each May increase in 2015, 2016 and 2017
Solutions that DRIVE Productivity 28
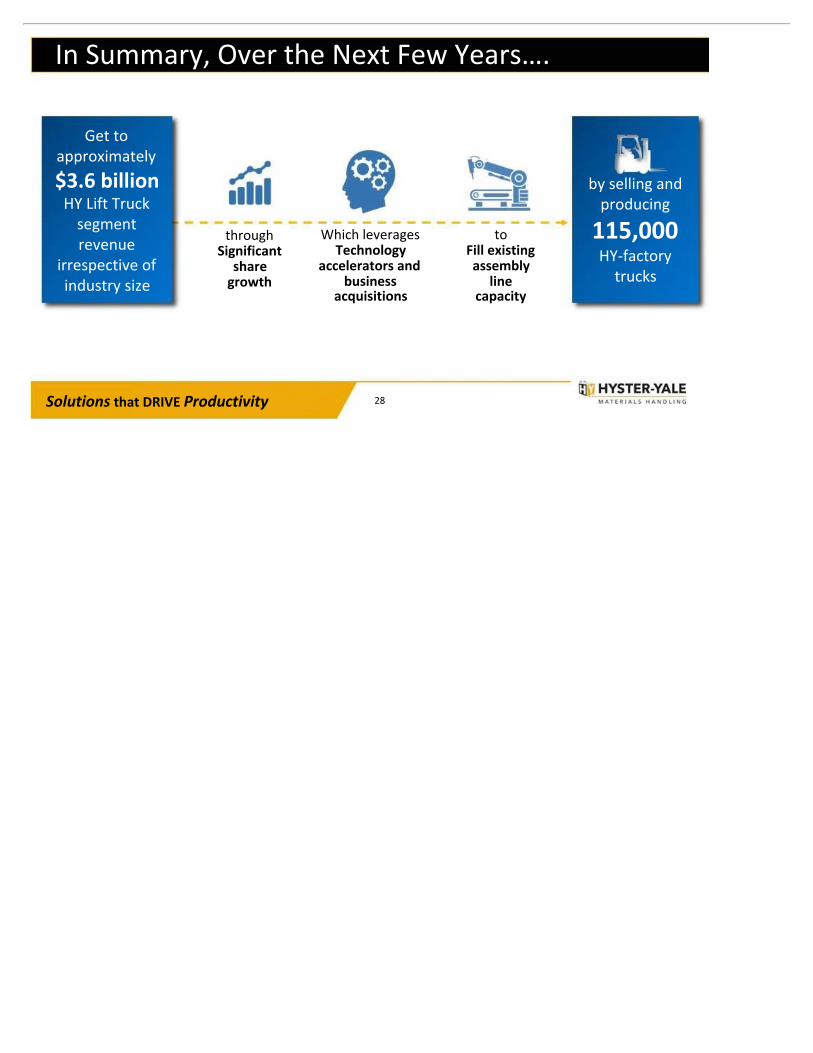
by selling andproducing
115,000HY-factory
trucks
In Summary, Over the Next Few Years….
toFill existingassembly
linecapacity
throughSignificant
sharegrowth
Which leveragesTechnology
accelerators andbusiness
acquisitions
Get toapproximately$3.6 billion
HY Lift Trucksegmentrevenue
irrespective ofindustry size

Solutions that DRIVE Productivity 29
Valuation Approach Needs to Vary By Business
29
Lift Truck and Attachment BusinessesLift Truck and Attachment Businesses Hydrogen Power BusinessHydrogen Power Business
• Board Oversight as Separate Businesses• Incentives Tied to Individual Businesses
Strong Operating Cash Generation
Market Leading Products and Position
Mature Cyclical Industry
Value using Traditional Valuation Model ofEBITDA Multiple on a Net Debt Basis
Multiple should reflect ROIC levels andgrowth prospects
Developing / Technology Industry
Distinct Technology / Patents in Fuel Celland Hydrogen Generation
Operating Cash Invested in New ProductCommercialization / Ramp Up
Value as Venture Business with DevelopedTechnology
Solutions that DRIVE Productivity 30
A Solid Investment Option
30
HYSTER-YALEHYSTER-YALE
Strong BalanceSheet
Cash Generation &Commitment to
Shareholder Return
Investment & Growth inGame ChangingTechnologies
Leading Products &Market Position
Strategies to Gain Sharein all Segments &Markets
Customer Focused &Solutions Oriented
Strong Returnon Capital
Appendix

Solutions that DRIVE Productivity
Appendix
Solutions that DRIVE Productivity 32
Non-GAAP Disclosure
Adjusted Lift Truck Business Operating Profit, EBITDA and return on total capital employed arenot measurements under U.S. GAAP, should not be considered in isolation or as a substitutefor GAAP measures, and are not necessarily comparable with similarly titled measures of othercompanies. Hyster-Yale defines each as the following:
Adjusted Lift Truck Business Operating Profit is defined as Lift Truck Operating Profit,as reported, adjusted for the pre-tax effect of the $17.7 million gain on sale from theBrazil land and facility in 2014;
EBITDA is defined as income (loss) before income taxes and noncontrolling interestincome (loss) plus net interest expense and depreciation and amortization expense;
Return on total capital employed (“ROTCE”) is defined as net income (loss) beforeinterest expense, after tax, divided by average capital employed. Average capitalemployed is defined as average stockholders’ equity plus average debt less averagecash.
For reconciliations from GAAP measurements to non-GAAP measurements, see the followingpages.

Solutions that DRIVE Productivity 33
Non-GAAP Reconciliation
_____________________
($ in millions) Year Ended December 31 Qtr.Trailing 12Months
Consolidated 2013 2014 2015 2016 3/31/17 3/31/17Reconciliation of EBITDANet income attributable to stockholders $ 110.0 $ 109.8 $ 74.7 $ 42.8 $ 18.1 $ 50.9Noncontrollinginterest income (loss) 0.2 0.4 0.4 (0.5) - (0.4)Income tax provision (benefit) 17.2 39.9 29.4 (4.0) 6.2 3.2Interest expense 9.0 3.9 4.7 6.7 1.8 7.4Interest income (1.8) (1.1) (1.5) (2.0) (0.3) (1.9)Depreciation and amortization expense 30.2 29.7 28.9 39.1 10.5 42.7EBITDA $ 164.8 $ 182.6 $ 136.6 $ 82.1 $ 36.3 $ 101.9
($ in millions) Year Ended December 31 Qtr.Trailing 12Months
LiftTruck 2013 2014 2015 2016 3/31/17 3/31/17Reconciliation of EBITDANet income attributable to stockholders $ 110.0 $ 111.2 $ 89.3 $ 66.9 $ 22.3 $ 75.5Noncontrollinginterest income (loss) 0.2 0.4 0.4 (0.5) (0.1) (0.5)Income tax provision (benefit) 17.2 40.7 39.4 12.2 9.4 20.2Interest expense 9.0 3.9 4.7 6.9 1.6 7.4Interest income (1.8) (1.1) (1.5) (3.0) (0.3) (2.9)Depreciation and amortization expense 30.2 29.6 27.3 28.1 7.2 28.8EBITDA $ 164.8 $ 184.7 $ 159.6 $ 110.6 $ 40.1 $ 128.5
Note: EBITDA in this investor presentation is provided solely as a supplemental disclosure with respect to operating results. EBITDA does not represent net income (loss), as defined by U.S. GAAP and should not be considered as a substitute for net income or net loss, or as an indicator of operating performance. The Companydefines EBITDA as income (loss) before income taxes and noncontrolling interest income (loss) plus net interest expense and depreciation and amortization expense. EBITDA is not a measurement under U.S. GAAP and is not necessarily comparable with similarly titled measures of other companies.

Solutions that DRIVE Productivity 34
Non-GAAP Reconciliation (continued)
_____________________
($ in millions)Year Ended December 31 Qtr.
Trailing 12Months
Nuvera 2014 2015 2016 3/31/17 3/31/17Reconciliation of EBITDANet loss attributable to stockholders $ (1.4) $ (14.6) $ (23.8) $ (5.7) $ (25.8)Noncontrollinginterest income - - - - -Income tax benefit (0.8) (10.0) (15.8) (3.8) (17.2)Interest expense - - - - -Interest income - - - - -Depreciation and amortization expense 0.1 1.6 1.5 0.5 1.6EBITDA $ (2.1) $ (23.0) $ (38.1) $ (9.0) $ (41.4)
Qtr.Trailing 12Months
Bolzoni 3/31/17 3/31/17Reconciliation of EBITDANet income attributable to stockholders $ 1.5 $ 1.2Noncontrolling interest income 0.1 0.1Income tax provision 0.6 0.2Interest expense 0.2 1.0Interest income - -Depreciation and amortization expense 2.8 12.3EBITDA $ 5.2 $ 14.8
Note: EBITDA in this investor presentation is provided solely as a supplemental disclosure with respect to operating results. EBITDA does not represent net income (loss), as defined by U.S. GAAP and should not be considered as a substitute for net income or net loss, or as an indicator of operating performance. The Companydefines EBITDA as income (loss) before income taxes and noncontrolling interest income (loss) plus net interest expense and depreciation and amortization expense. EBITDA is not a measurement under U.S. GAAP and is not necessarily comparable with similarly titled measures of other companies.

Solutions that DRIVE Productivity 35
Non-GAAP Reconciliation (continued)
_____________________Note: Return on capital employed is provided solely as a supplemental disclosure with respect to income generation because management believes it provides useful information with respect to earnings in a form that is comparable to
the Company’s cost of capital employed, which includes both equity and debt securities, net of cash.
Reconciliation of Return on Total Capital Employed (ROTCE)
Consolidated Lift Truck(1) Nuvera BolzoniLTM
3/31/17LTM
3/31/17LTM
3/31/17LTM
3/31/17AverageStockholders'Equity(3/31/17,12/31/16,9/30/16,6/30/16and3/31/16) $489.6 $525.0 $12.9 $101.3
Average Debt (3/31/17, 12/31/16, 9/30/16, 6/30/16and 3/31/16) 144.1 111.5 2.4 57.1Average Cash (3/31/17, 12/31/16, 9/30/16, 6/30/16and 3/31/16) (76.7) (216.4) - (8.8)Average capital employed $557.1 $420.2 $15.3 $149.7
Net income (loss) $50.9 $75.5 $(25.8) $1.2Plus: Interest expense, net 5.5 4.5 - 1.0Less: Income taxes on interest expense, net at 38% (2.1) (1.7) - (0.4)Actual return on capital employed = actual net income (loss) before interest expense, net, after tax$54.3 $78.3 $(25.8) $1.8Actual return on capital employed percentage 9.7% 18.6% n/m n/m
($ in millions)
(1) Lift Truck Return on capital employed excludes the average initial investment of $99.3 million for the acquisition of Bolzoni and continuing average investments of $47.4 million in Nuvera. Investment numbers are based on a 5-pointaverage.

Solutions that DRIVE Productivity 36
Cash Flow before Financing Calculation
.
Consolidated
($ in millions) Year Ended December 31Qtr.
Trailing 12Months
2012 2013 2014 2015 2016 3/31/17 3/31/17
Reconciliation of Cash Flow before Financing
Netcashprovidedby(usedfor)operatingactivities $128.7 $152.9 $100.0 $89.4 $(48.9) $102.0 $71.4
Net cash used for investing activities (19.5) (26.1) (44.4) (31.3) (145.1) (7.1) (154.0)
Cash Flow before Financing $109.2 $126.8 $55.6 $58.1 $(194.0) $94.9 $(82.6)
Appendix
Solutions that DRIVE Productivity
Supplemental Information

Solutions that DRIVE Productivity 38
Hyster founded inPortland Oregonas the WillametteErsted Company
1929 1944 1959
Company nameofficially changed
to HysterCompany
First Hystercontainerhandling
trucks
1875 1920Yale Lock
Mfg. broadensits scope into
materialshandling
Yale and Townelaunched a newbattery poweredlow-lift platform
truck
1963Yale forklift truckbusiness mergeswith Eaton Mfg.Industrial Truck
Division
1950Yale added gas,
LP gas anddiesel-poweredfork lift trucks to
its range
1964
Hyster introducesthe famousMonotrol®
pedal
1971Yale forges apartnership
withSumitomo Ltd
20112011
NMHGintroduces theUTILEV ® lifttruck for the
utility segmentof the market
201620161985Yale acquired
by NACCOIndustries
1989
Hyster acquiredby NACCOIndustries
NMHG renamedHyster-Yale Group
HY completesacquisition of 100%
of Bolzoni S.p.A.
The History of Hyster-Yale and its brands
19891989 20122012Hyster-Yaleformed as
independentpublic companyfollowing spin-off by NACCO
20142014
NMHG, HY’soperatingcompany,
acquires Nuverato enter the fast-
growing hydrogenfuel cell market
Hyster and Yalemerge to form
NACCOMaterials
Handling Group(NMHG)

Solutions that DRIVE Productivity 39
Hyster-Yale’s Global Footprint
Ramos Arizpé, MexicoFabrication Manufacture
Sulligent, AlabamaComponent Manufacture
Berea, KentuckyLift Truck Manufacture
Greenville, North CarolinaDivision Headquarters; Lift Truck Manufacture;Warehouse Development Center
Cleveland, OhioCorporateHeadquarters
Danville, IllinoisParts Distribution Center
Charlotte, North CarolinaExperience Center
Barueri, BrazilBrazil Marketing andAdministration Center
Itu, BrazilLift Truck Manufacture;Parts Distribution Center
Craigavon, N. IrelandLift Truck Manufacture
Nijmegen, NetherlandsLift Truck Manufacture; Big Truck DevelopmentCenter; Parts Distribution Center
Masate, ItalyLift Truck Manufacture
Shanghai, China (JV)Lift Truck Manufacture;Parts Distribution; ChinaMarketing andAdministration Center
Obu, Japan (JV)Lift Truck Manufacture;Parts Distribution
Cavite, Philippines (JV)Fabrication Manufacture
Irvine, ScotlandEuropean Administration Center
Hanoi, Vietnam (JV)Component Manufacture
Sydney, AustraliaDivision Headquarters;Parts Distribution
Pune, IndiaEngineering, Supply Chainand Marketing Center
Frimley, UKDivision Headquarters;Engineering Concept Center
Kuala Lumpur, MalaysiaAsia Support Office
Hefei, ChinaSupply ChainCenter
Fairview, OregonCounterbalancedDevelopment Center;Administration Center
San Donato, ItalyEuropean Offices; Research &Development; Testing Facilities
Billerica, MassachusettsHydrogen PowerBusiness Headquarters;Research andDevelopment;Manufacturing and Sales
Homewood, IllinoisAttachment Manufacture
Piacenza, ItalyBolzoni Headquarters; Attachment,Lift Table and Fork Manufacture
Järvenpää, FinlandAttachmentManufacture
Salzgitter, GermanyAttachment Manufacture
Wuxi, ChinaAttachment Manufacture
Hebei, ChinaFork Manufacture
Pointe-Claire,CanadaCommercialSubsidiary
Prestons, AustraliaCommercial Subsidiary
Warrington, UKCommercial Subsidiary
Montcarda/Reixac, SpainCommercial Subsidiary
Forbach, FranceCommercial Subsidiary
Prato, ItalyCommercial Subsidiary
Lublin, PolandCommercial Subsidiary
Moscow, RussiaCommercialSubsidiary
Korschenbroich,GermanyCommercial Subsidiary
Gävle, SwedenCommercialSubsidiary
Helmond, NetherlandsCommercial Subsidiary
Lift Truck Business locationsHydrogen Power Business (Nuvera) locationsAttachment Business (Bolzoni) locationsGlobal Headquarters
LEGEND:
Tyler, TexasHY Telematics
Chessy, FranceCommercial Offices
Neu-Isenburg, GermanyCommercial Offices

Solutions that DRIVE Productivity 40
Historical Consolidated Revenue
$2,057
$2,400 $2,489$2,720 $2,824
$1,475
$1,802
$2,541 $2,469$2,666 $2,767
$2,578 $2,570$2,679
$0
$1,000
$2,000
$3,000
2004 2005 2006 2007 2008 2009 2010 2011 2012 2013 2014 2015 2016 LTM Q12017
($ in millions)
41Solutions that DRIVE Productivity
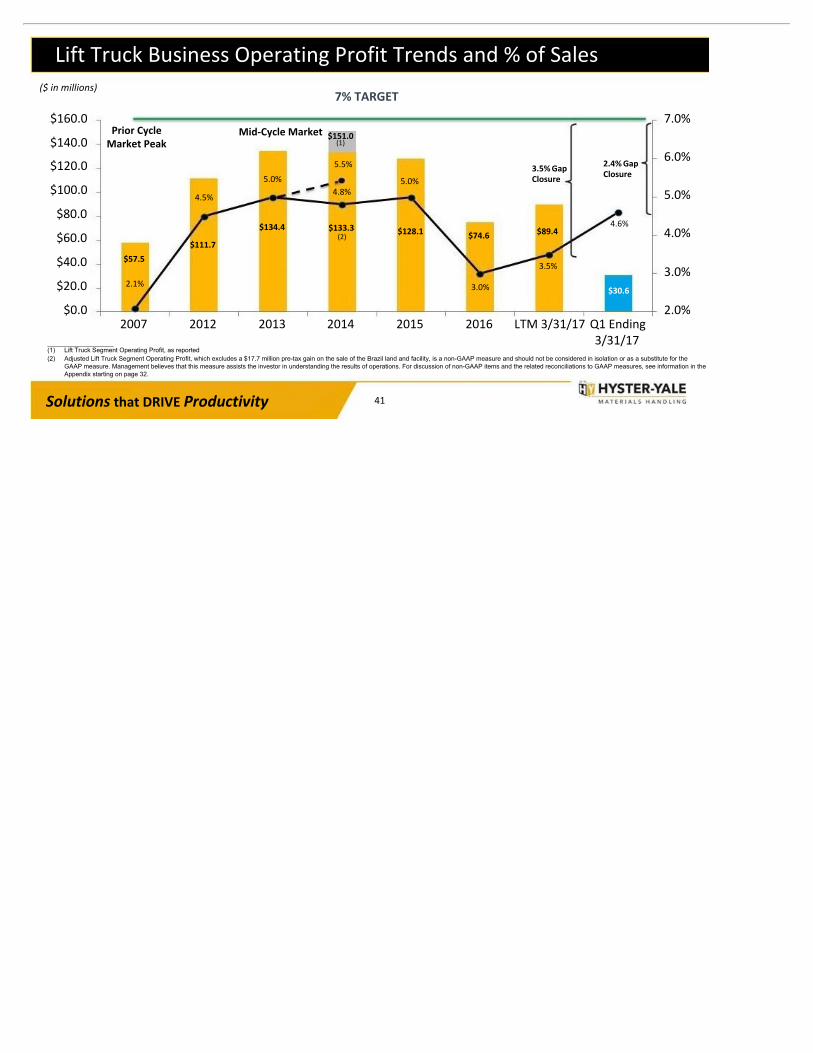
_____________________(1) Lift Truck Segment Operating Profit, as reported(2) Adjusted Lift Truck Segment Operating Profit, which excludes a $17.7 million pre-tax gain on the sale of the Brazil land and facility, is a non-GAAP measure and should not be considered in isolation or as a substitute for the
GAAP measure. Management believes that this measure assists the investor in understanding the results of operations. For discussion of non-GAAP items and the related reconciliations to GAAP measures, see information in theAppendix starting on page 32.
($ in millions)
2.4% GapClosure
Prior CycleMarket Peak
Mid-Cycle Market
Lift Truck Business Operating Profit Trends and % of Sales
7% TARGET
3.5% GapClosure
$57.5$111.7
$134.4 $133.3 $128.1 $74.6 $89.4
$30.62.1%
4.5%
5.0%4.8%
5.0%
3.0%
3.5%
4.6%
2.0%
3.0%
4.0%
5.0%
6.0%
7.0%
$0.0
$20.0
$40.0
$60.0
$80.0
$100.0
$120.0
$140.0
$160.0
2007 2012 2013 2014 2015 2016 LTM 3/31/17 Q1 Ending3/31/17
$151.0(1)
(2)
5.5%

Solutions that DRIVE Productivity 42
Lift Truck Business Target Economics Goal and Gap to Target
Achieve 7%operating profitmargin target at
mid-cycle
TargetEconomics gapclosure can beachieved withunit volume…
Stronger Industry+ Share Growth
= Volume Leverage
LTM 3/31/17 Gap to Target Economics
Actual Lift Truck Operating Profit Margin % 3.5%
Margin Variances 0.7%
Unit margin 1.0%
Parts/other (0.3%)
Volume Variances 2.8%
Manufacturing variances/other 0.9%
Operating Expenses 1.9%
Lift Truck Operating Profit Margin % Gap 3.5%
Lift Truck Operating Profit Margin % Target 7.0%

Solutions that DRIVE Productivity 43
Lift Truck Overview and Sources of Revenue
2016 Worldwide Sales by Product
_____________________(1) Represents Hyster-Yale North American Lift Truck unit shipments by industry.(2) Includes Big Truck sales that represent 10.9% of total sales.(3) Bolzoni revenues of $115.6 million included in parts.(4) 2016 data was not finalized as of the publication date of this presentation.
A leading global lift truck manufacturer in terms of units sold
2016 Retail Shipments by End Market (1)
#3Globally in 2015(4)
Large installed basethat drives parts sales
Over 827,000 units worldwide at12/31/16
HY sales of 87,600 unitsin LTM 3/31/17
82,100 u nitssold - produced in HYplants
5,500 u nits sold – produced by JV orother third parties
Additional >6,300 unitssold in Japan in 2016
Direct sales by JV partner
(2)ICE Units50%
Electric Units27%
Parts17%
Other6%
(3)Manufacturing
21%
WholesaleDistribution
18%
Food & Beverage12%
Rental10%
Home Centers/Retail14%
Freight & Logistics13%
Paper3%
Other9%
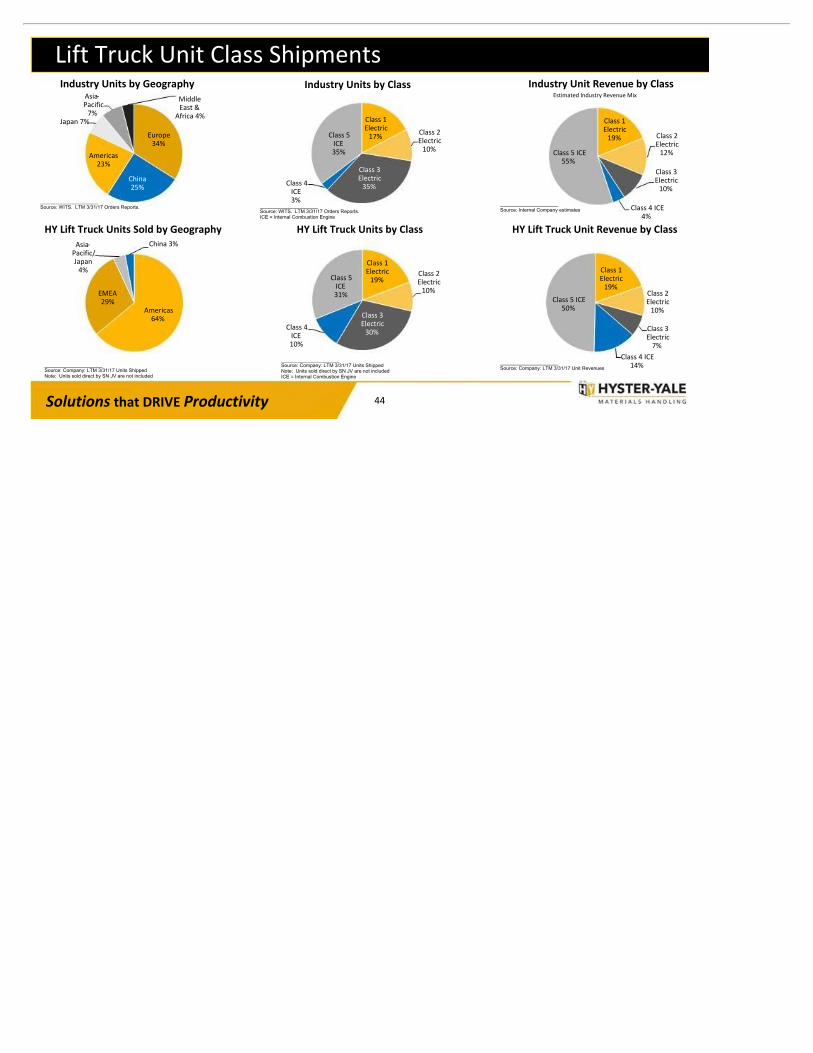
Solutions that DRIVE Productivity 44
Industry Units by Geography
Lift Truck Unit Class Shipments
_____________________Source: Company: LTM 3/31/17 Units ShippedNote: Units sold direct by SN JV are not included
HY Lift Truck Units Sold by Geography
_____________________Source: WITS. LTM 3/31/17 Orders Reports. _____________________
Source: WITS. LTM 3/31/17 Orders Reports.ICE = Internal Combustion Engine
_____________________Source: Company: LTM 3/31/17 Units ShippedNote: Units sold direct by SN JV are not includedICE = Internal Combustion Engine
Industry Units by Class
HY Lift Truck Units by Class
_____________________Source: Internal Company estimates
Estimated Industry Revenue MixIndustry Unit Revenue by Class
HY Lift Truck Unit Revenue by Class
_____________________Source: Company: LTM 3/31/17 Unit Revenues
Americas64%
EMEA29%
Asia-Pacific/Japan
4%
China 3%
Class 1Electric
19%Class 2Electric
10%
Class 3Electric
30%Class 4
ICE10%
Class 5ICE31%
Class 1Electric
19%Class 2Electric
10%
Class 3Electric
7%Class 4 ICE
14%
Class 5 ICE50%
Class 1Electric
19% Class 2Electric
12%
Class 3Electric
10%
Class 4 ICE4%
Class 5 ICE55%
Class 1Electric
17% Class 2Electric
10%
Class 3Electric
35%Class 4ICE3%
Class 5ICE35%
Europe34%
China25%
Americas23%
Japan 7%
Asia-Pacific
7%
MiddleEast &
Africa 4%

Solutions that DRIVE Productivity 45
Shift in Market Balance from ICE to ElectricToday2017
_____________________Source: WITS. Orders Reports.ICE = Internal Combustion Engine
DRIVERS:• Customer shift • Growth of warehousing and logistics• Environmental, health and safety• Evolving technologies
Previous Peak2007
Class 1Electric
18%
Class 2Electric
10%
Class 3Electric
27%
Class 4 ICE3%
Class 5 ICE42%
Class 1Electric
17%
Class 2Electric
10%
Class 3Electric
35%
Class 4 ICE3%
Class 5 ICE35%

Solutions that DRIVE Productivity 46
Lift Truck Market Size DataLift Truck Market Size DataWITS Orders Basis (1) 2002 2003 2004 2005 2006 2007 2008 2009 2010 2011Europe 265,896 278,024 312,455 327,173 380,557 445,583 411,107 222,883 299,387 368,286North America 147,322 155,191 186,192 198,058 212,953 191,384 159,279 98,338 136,050 169,589Total Americas 158,388 168,471 206,225 221,155 242,186 234,353 200,178 118,835 180,903 224,501A/P, China and Japan (1a) 138,452 155,094 185,530 201,062 232,438 271,018 260,246 205,114 314,162 381,795
Global Market 562,736 601,589 704,210 749,390 855,181 950,954 871,531 546,832 794,452 974,582
2012 2013 2014 2015 2016 2017EEurope 351,441 357,452 387,905 412,642 457,333 465,000North America 181,191 200,939 219,444 235,128 240,836 210,600Total Americas 229,565 252,930 267,546 277,315 280,827 251,600A/P, China and Japan (1a) 363,399 399,395 438,510 409,923 443,938 444,338
Global Market 944,405 1,009,777 1,093,961 1,099,880 1,182,098 1,160,938
(1) In 2009, Hyster-Yale switched to tracking Industry data on a World Industrial Truck Statistics ("WITS") Orders Basis. WITS statistics began in 2002. (1a) Beginning in 2014 includes India local production
1992 1993 1994 1995 1996 1997 1998 1999 2000 2001Europe (FEM/JIVA) (3) 150,250 121,922 135,318 152,667 174,953 176,294 187,902 219,615 227,697 274,681North America (2) (3) 106,590 120,679 154,167 162,725 152,763 178,456 192,192 197,436 205,033 145,967Total Americas (2) (3) 114,411 127,308 162,261 171,682 168,170 193,413 207,018 209,843 223,499 161,316A/P, China and Japan (3) 134,635 123,913 119,733 135,050 148,135 148,441 111,848 104,781 122,354 123,780
2002 2003 2004 2005 2006 2007 2008 2009Europe (FEM/JIVA) (3) 256,717 263,972 286,546 302,158 337,326 382,047 376,945 201,352North America (2) (3) 144,529 151,911 182,450 194,475 207,919 185,726 149,863 95,562Total Americas (2) (3) 156,702 166,328 203,552 218,908 238,141 229,509 192,134 115,752A/P, China and Japan (3) 129,333 146,334 171,000 195,386 222,074 250,684 257,604 199,159
Non-WITS Prior Year Information:
Materials Handling ("FEM"), World Industrial Truck Association(2) Total Americas numbers for 1992-2008 include North America Commercial, Government and Latin America. Prior years are
North America Commercial only.(3) Industry information is based upon the reporting basis of each individual region, which varies according to the industry trade
groups in that region:
Europe & Japan - Factory shipmentsA/P & China - Factory bookings
Industry forecast (light blue columns) – source: Derived from DRI-WEFA and Oxford Economic Forecasts
Lift truck market size history – source: Industrial Truck Association, Japan Industrials Vehicle Association ("JIVA"), European Federation of
Americas - North America & Government - Retail bookingsAmericas - Latin America - Factory bookings

Solutions that DRIVE Productivity 47
Distribution Channel Strength and Diverse Customer BaseBlue Chip Customer Base
Approximately1,100
global dealerlocations
More than2,800
applicationconsultants
Approximately10,700service
technicians
National Accounts Profile
Independent Dealer Network
• Focused on strategic customers with centralizedpurchasing and geographically dispersedoperations across dealer territories
• Fleet Management Program provides customerswith value-added services that include service,aftermarket parts and comprehensivemanagement of materials handling needs
• Two brand network strategy optimizes localpresence and customer reach
• Key differentiating factors:• Long-term relationships with dealers• Territorial exclusivity encourages strong,
long-term relationships with customers• Brand exclusivity ensures dealers’ selling
efforts focused on Hyster-Yale products
NationalAccounts
17%
IndependentDealers
83%
2016 Distribution Mix

Solutions that DRIVE Productivity 48
Our Long-Term Philosophy
Long-termgrowth
Long-termshareholders
Shareholderprotection
Seniormanagement
incentivized aslong-term
shareholders
Increaseshareholder value
Return on CapitalEmployed and MarketShare Increase focus

Solutions that DRIVE Productivity 49
Product Philosophy
• Full product line
• Segmented solutions
• Scalable modular platforms
• Leverage core assets
• Technology partners
• Fit for market and application
• Reliability and durability
• Energy efficiency
• Operator productivity
• Support growthinitiatives
• Fill the factories
• Differentiation
• Innovation
Guiding ProductPhilosophy
Guiding ProductPhilosophy Key Product AttributesKey Product AttributesProduct Portfolio FocusProduct Portfolio Focus

Solutions that DRIVE Productivity 50
Our Investment in R&D
Full Product Line*Lift Truck R&D Investment
HY COMPETITORS
FULL
MIN
* Full Product Line – Class 1 through Class 5, including Big Truck
$68
$69
$71
$69
$71
2012 2013 2014 2015 2016
2.8% 2.6% 2.6% 2.7% 2.9%
% of Revenue
$ in millions
Solutions that DRIVE Productivity 51
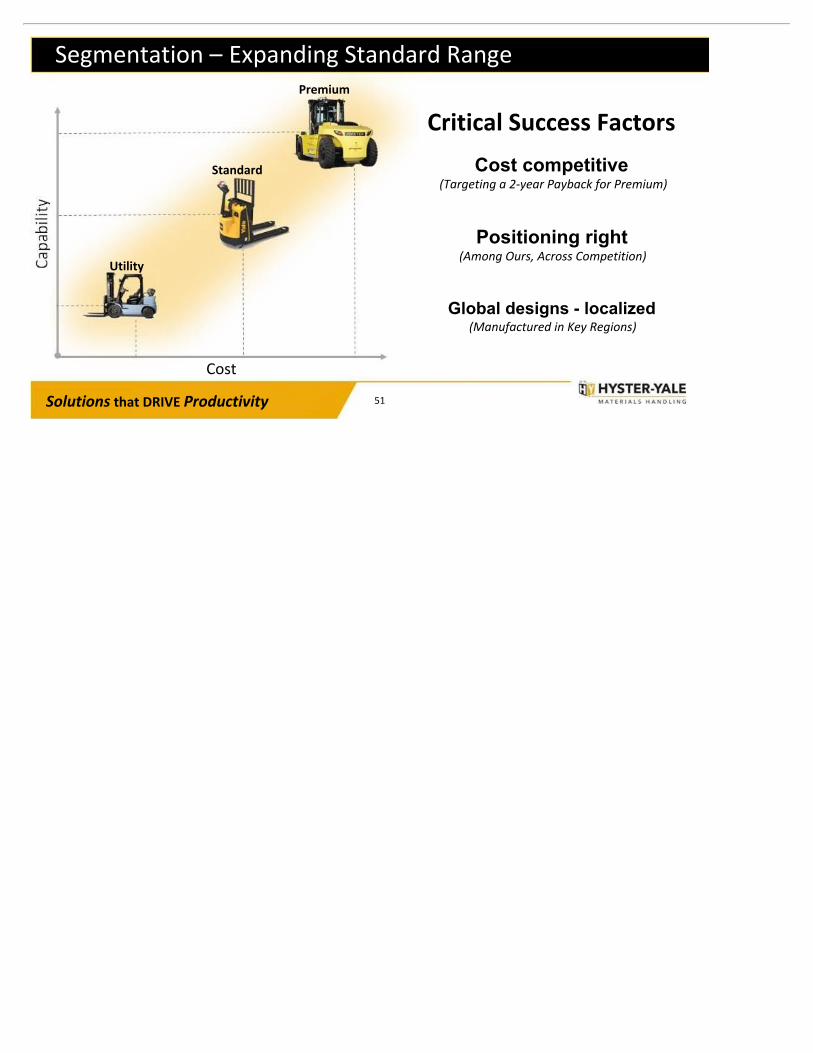
Segmentation – Expanding Standard Range
Cost
Cost competitive(Targeting a 2-year Payback for Premium)
Positioning right(Among Ours, Across Competition)
Global designs - localized(Manufactured in Key Regions)
Critical Success Factors
Utility
Standard
Premium

Solutions that DRIVE Productivity 52
Cost of Operation / HourFactors Impacting Low Cost of OwnershipFactors Impacting Low Cost of Ownership
*Typical truck cost/hour for 5,000lb North American applications
Operator69%
Fuel11%
Service&Repair
11%
Lease9%
LeaseService & Fuel Operator
Fleetoptimization
Pricemanagement
Cost control
Residuals
Cost/hour
FleetManagement
Extended Warranty
Telematics
Energy usage
Alternativepowertrains
ICE to ER
Mode control
Productivity
Ergonomics/fatigue
Auto functions
Automated trucks
Typical Truck Cost/Hour
Repair
*

Solutions that DRIVE Productivity 53
Areas of FocusTelematics
• Internet of things• Asset management• Fleet and truck data• Use of telematics
• Partnered approachBalyo, Seegrid
• Camera and laser-based systems
• Focus on integrationand value proposition
Automation
Alternative Power
Lead acid
Lithium ion
Fuel cell
Diesel
LPG
Lithium ion
Fuel cell
Battery BoxSolutions
Integratedsolutions

Solutions that DRIVE Productivity 54
Capturing More Lifecycle Value
TruckHyster-Yale
MaintHY/Dealer
EnergyUtility Company Fuel(Nuvera®Hydrogen
Generator)
Energy Utility Company
Nuvera/Dealer
Nuvera® FuelCell System Nuvera
Maint HY/Dealer
Truck Hyster-Yale
Lead-Acid Battery* Nuvera® Fuel-Cell System Solution*
*Representative Total Cost of Operation based on NREL 2013 report
Batteries &Charger
Battery Supplier
Batteries$18-20k lifetimespend ( $12k for3 batteries / $6-8k for 1 charger)

Solutions that DRIVE Productivity 55
Developing Our Product Range
Approximate Engine Power Requirement [kW]
24V
36V
48V
1-3 3-10 10-20
Product available in all electric truck classes
Minor modifications toaddress >70% of market
Solutions that DRIVE Productivity 56
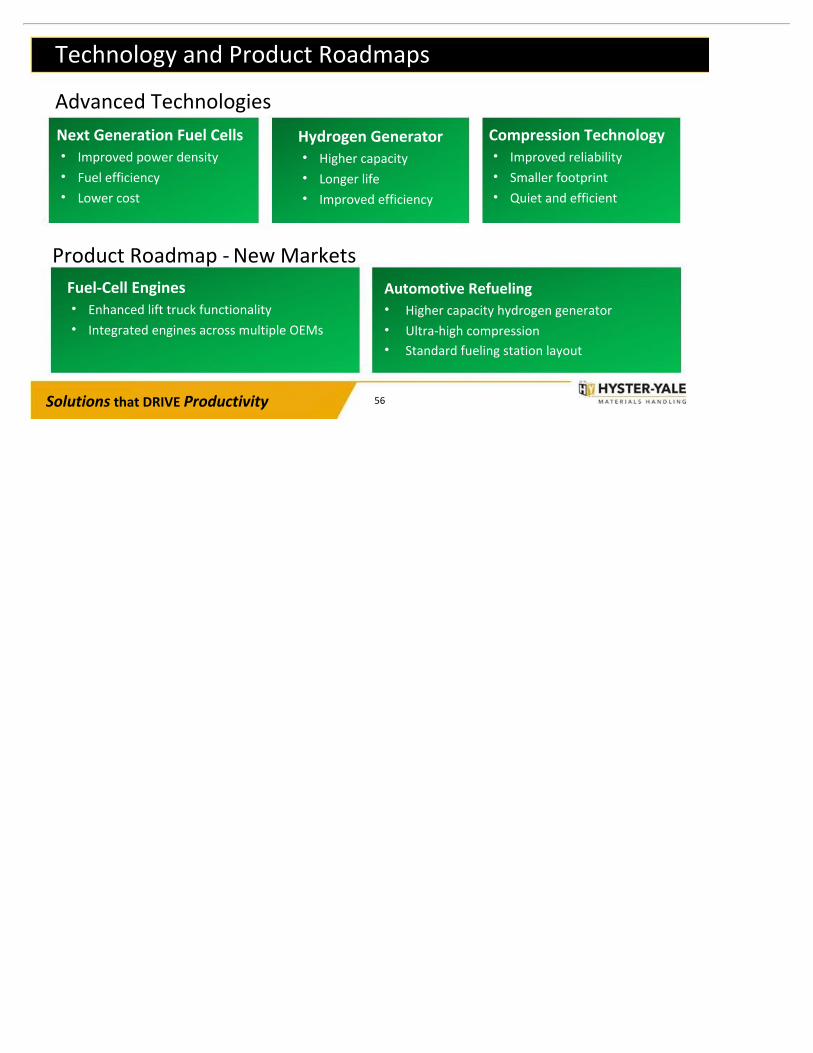
Advanced Technologies
Fuel-Cell Engines• Enhanced lift truck functionality• Integrated engines across multiple OEMs
Product Roadmap - New Markets
Next Generation Fuel Cells• Improved power density• Fuel efficiency• Lower cost
Hydrogen Generator• Higher capacity• Longer life• Improved efficiency
Automotive Refueling• Higher capacity hydrogen generator• Ultra-high compression• Standard fueling station layout
Compression Technology• Improved reliability• Smaller footprint• Quiet and efficient
Technology and Product Roadmaps

Solutions that DRIVE Productivity 57
Bolzoni’s BrandsBOLZONIFounded in Italy in 1945, focus on lift truck attachments, forks and lift tables . A leadingmarket position through the development of a worldwide network of subsidiaries anddealers, as well as strategic acquisitions.
AURAMOFounded in Finland in 1947, focus on paper roll clamps, bale clamps and otherspecialized handling attachments . The worldwide recognized paper handling specialist.AURAMO was acquired by BOLZONI Group in 2001.
MEYERFounded in Germany in 1953, focus on a wide range of lift truck attachment industry .The worldwide recognized multiple pallet handler inventor.MEYER was acquired by BOLZONI Group in 2006.
Solutions that DRIVE Productivity 58
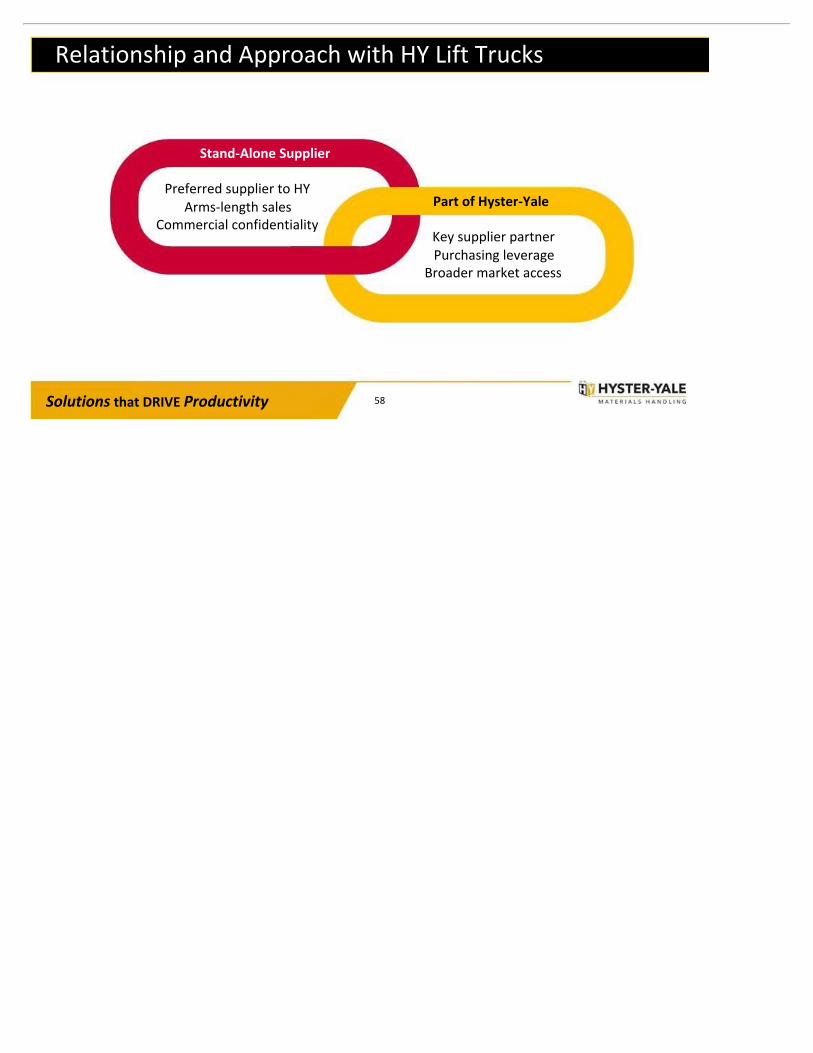
Relationship and Approach with HY Lift Trucks
Stand-Alone Supplier
Preferred supplier to HYArms-length sales
Commercial confidentialityKey supplier partnerPurchasing leverage
Broader market access
Part of Hyster-Yale

Solutions that DRIVE Productivity 59
LTM Q1 2017 Bolzoni Revenue by Product Line
€ 143,1 M
Other Revenues*€ 5,5 M
4%Forks
€ 15,9 M11%
Lift Table€ 8,9 M
6%
Attachments€ 112,8 M
79%
___________* Other Revenes–Rental business and Customer care.Note – Revenue by product line and percentages presented represent LTM Q1 2017 revenues in euros.

Solutions that DRIVE Productivity 60
• Able to meet customers needs globally• Global economies of scale
• Young/ fresh product line• Broad array of power options,
including hydrogen• Broad range of attachments
• Source of aftermarket profitability• Barrier to entry
Global
Full Product Line
Field Population
Dealer Relationships• Independent distribution model• Exclusive distribution• Combine OEM excellence with entrepreneurial
distribution focused on customer
• Long-term relationships• Able to meet most needs• National Account programs
Customer Relationships
• High performance metrics• Large fleet program
Aftermarket SupportEmployee Relationships• Engaged workforce• Experienced leadership• Equal treatment
Our Competitive Advantages