date release: september 27, 2012 special release
TRANSCRIPT

SPECIAL RELEASE
2010 Census of Population and Housing – Final Results
Population of Caloocan City stands at 1.49 million
Population of Caloocan City increases by 2.37 percent annually
Caloocan City recorded a total population of 1,489,040 as of May 1, 2010, an increase of 311,436 persons over the May 2000 population. The increase in the population translates to an average annual population growth rate (PGR) of 2.37 percent, lower than the PGR of 3.39 percent for the period 1990 to 2000. This city contributed 12.61 percent to the total population of the National Capital Region in 2010.
Table 1. Total Population and Average Annual Growth Rate, Philippines,
NCR and Caloocan City: 2010, 2000 and 1990 .
Total Population Average Annual Growth Rate
May 1, 2010 May 1, 2000 May 1, 1990 (2000 – 2010) (1990-2000)
Philippines 92,337,852 76,506,928 60,703,206 1.90 2.12
NCR 11,855,975 9,932,560 7,948,392 1.78 2.02
Caloocan City 1,489,040 1,174,673 763,415 2.37 3.39
Source: 1990, 2000 & 2010 Census of Population and Housing, NSO
Refer to Table 6 for details.
Population density increases by 26.45 percent With a land area of 55.8 square kilometers, population density of Caloocan City registered 26,685 persons per square kilometer in 2010. This showed an increase of 5,581 persons (26.45%) from 21,104 persons in 2000.
Number: 2012- 01 Date Release: September 27, 2012
Republic of the Philippines NATIONAL STATISTICS OFFICE National Capital Region NCR4 - CAMANAVA
2
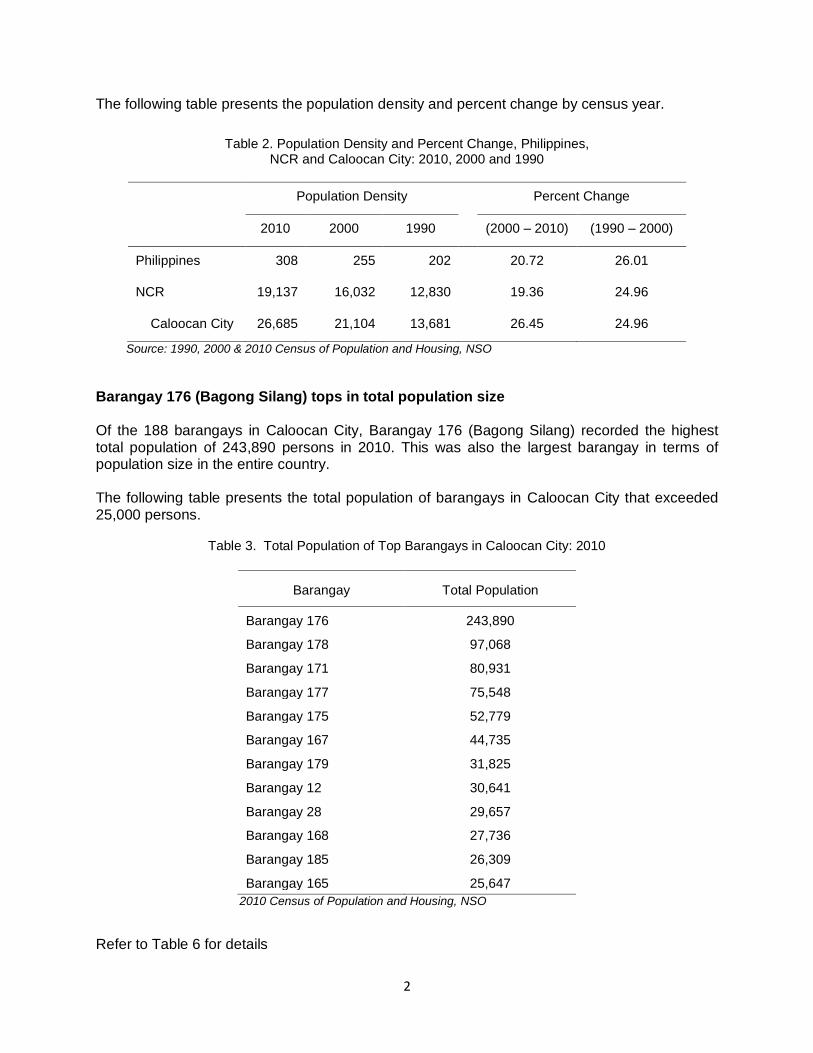
The following table presents the population density and percent change by census year.
Table 2. Population Density and Percent Change, Philippines,
NCR and Caloocan City: 2010, 2000 and 1990
Population Density Percent Change
2010 2000 1990 (2000 – 2010) (1990 – 2000)
Philippines 308 255 202 20.72 26.01
NCR 19,137 16,032 12,830 19.36 24.96
Caloocan City 26,685 21,104 13,681 26.45 24.96
Source: 1990, 2000 & 2010 Census of Population and Housing, NSO
Barangay 176 (Bagong Silang) tops in total population size Of the 188 barangays in Caloocan City, Barangay 176 (Bagong Silang) recorded the highest total population of 243,890 persons in 2010. This was also the largest barangay in terms of population size in the entire country. The following table presents the total population of barangays in Caloocan City that exceeded 25,000 persons.
Table 3. Total Population of Top Barangays in Caloocan City: 2010
Barangay Total Population
Barangay 176 243,890
Barangay 178 97,068
Barangay 171 80,931
Barangay 177 75,548
Barangay 175 52,779
Barangay 167 44,735
Barangay 179 31,825
Barangay 12 30,641
Barangay 28 29,657
Barangay 168 27,736
Barangay 185 26,309
Barangay 165 25,647
2010 Census of Population and Housing, NSO
Refer to Table 6 for details

3
Household population increases by 26.61 percent
Total household population of Caloocan City reached 1,487,245 in 2010, posting an increase of 26.61 percent compared to 1,174,673 in 2000. Household population accounted for 99.88 percent of the city total population.
Table 4. Total Household Population and Percent Change, Philippines,
NCR and Caloocan City: 2010, 2000 and 1990
Total Household Population Percent Change
2010 2000 1990 (2000 – 2010) (1990-2010)
Philippines 92,097,978 76,332,470 60,559,116 20.38 26.05
NCR 11,796,873 9,880,102 7,907,386 19.40 24.95
Caloocan City 1,487,245 1,174,673 761,824 26.61 54.19
Source: 1990, 2000 & 2010 Census of Population and Housing, NSO
Number of households and household size
In 2010, there were 345,444 households recorded in the city. This showed an increase of 38.42 percent from 249,567 households in 2000. The average household size in 2010 was 4.3 persons, lower than the average household size in 2000.
Table 5. Total Number of Households and Average Household Size, Philippines, NCR and Caloocan City: 2010, 2000 and 1990
Number of Households
Average household Size
2010 345,444 4.3
2000 249,567 4.7
1990 151,132 5.0
Source: 1990, 2000 and 2010 Census of Population and Housing, NSO
4
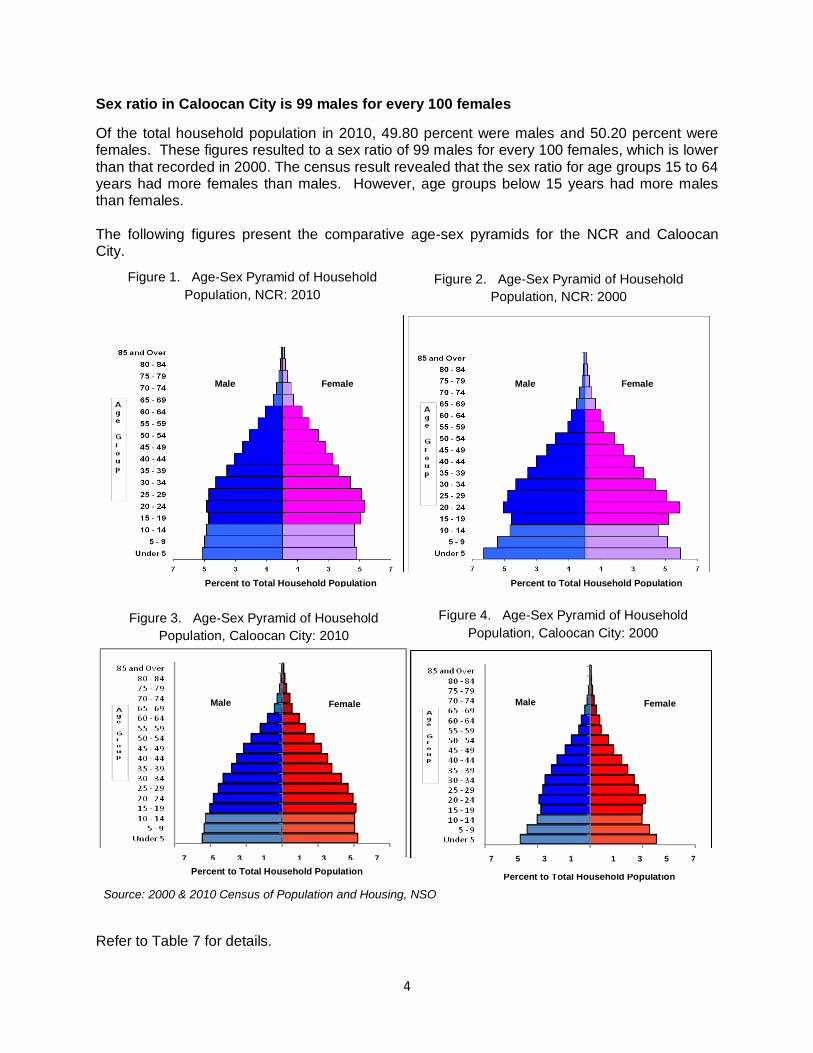
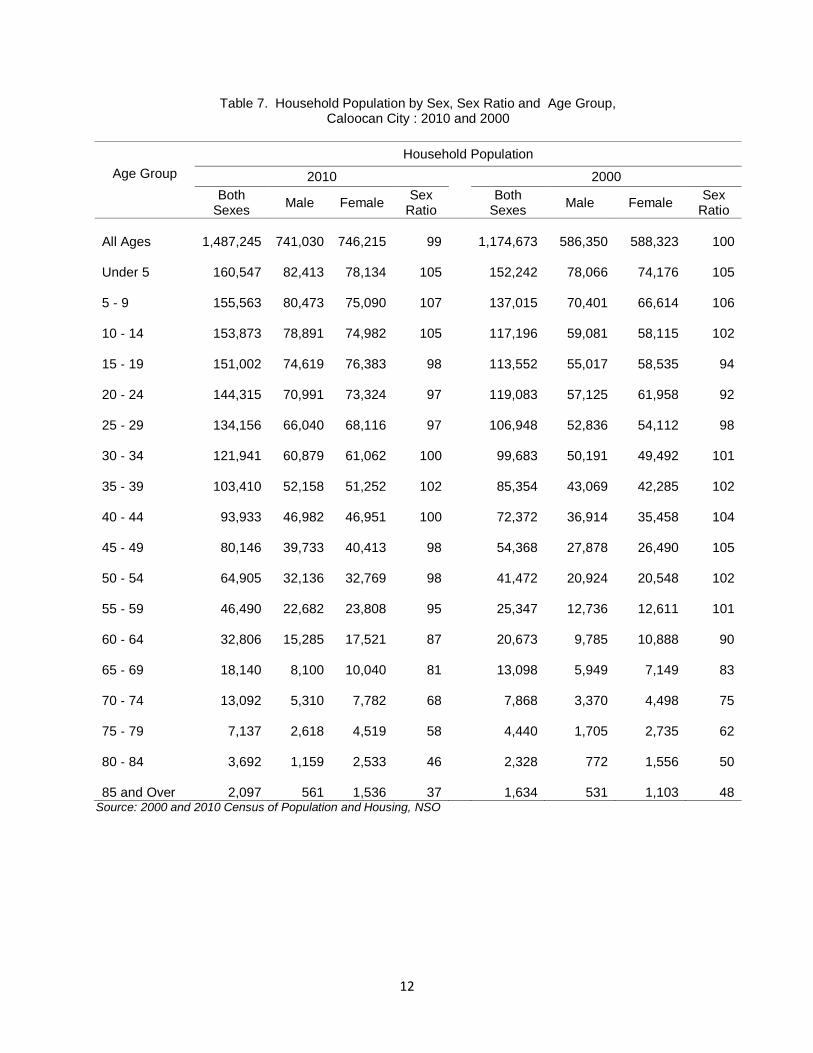
Sex ratio in Caloocan City is 99 males for every 100 females
Of the total household population in 2010, 49.80 percent were males and 50.20 percent were females. These figures resulted to a sex ratio of 99 males for every 100 females, which is lower than that recorded in 2000. The census result revealed that the sex ratio for age groups 15 to 64 years had more females than males. However, age groups below 15 years had more males than females. The following figures present the comparative age-sex pyramids for the NCR and Caloocan City.
Refer to Table 7 for details.
Male Male Male Male
Percent to Total Household Population
Figure 1. Age-Sex Pyramid of Household
Population, NCR: 2010
Male Female
Figure 2. Age-Sex Pyramid of Household
Population, NCR: 2000
Percent to Total Household Population
Male Female
Figure 3. Age-Sex Pyramid of Household
Population, Caloocan City: 2010
Male Female
7 5 3 1 1 3 5 7
Percent to Total Household Population
Male Female
Figure 4. Age-Sex Pyramid of Household
Population, Caloocan City: 2000
Percent to Total Household Population
7 5 3 1 1 3 5 7
Source: 2000 & 2010 Census of Population and Housing, NSO

5
Overall dependency ratio is 53 in 2010 The 2010 household population comprised of 48.30 percent young dependents (age group 0 to 14), 4.54 percent old dependents (age group 65 and over), and 65.43 percent working-age population (age group 15 to 64). These reflected a dependency ratio of 53 dependents (five old dependents and 48 young dependents) for every 100 persons in the working population. In 2000, the overall dependency ratio was 60 with only three old dependents and 57 young dependents for every 100 persons in the working age group. Refer to Table 7 for details. Senior citizens constitute 5.17 percent of the household population in 2010 Senior citizens, comprising those aged 60 years old and over, numbered 76,964 in Caloocan City. Males accounted for 42.92 percent and the rest were females. Senior citizens represent 5.17 percent of the total household population. Refer to Table 7 for details. About two in five of the household population are of school age
In 2010, the school-age population (5 to 24 years old) represents 40.66 percent of the total household population. This is slightly lower than the proportion of school-age population (41.45%) in 2000. Of the 604,753 school age population, males made up 50.43 percent, while females registered 49.57 percent. Refer to Table 7 for details.

6
Table 6. Total Population by Barangay, Caloocan City: 2010 and 2000
Total Population
May 1, 2010 May 1, 2000
Philippines 92,337,852a/
76,506,928
b/
National Capital Region 11,855,975 9,932,560
Caloocan City 1,489,040 1,177,604
Barangay 1 2,462 2,719
Barangay 2 5,149 5,071
Barangay 3 2,777 2,385
Barangay 4 2,858 2,313
Barangay 5 3,022 3,050
Barangay 6 1,267 1,236
Barangay 7 2,577 2,584
Barangay 8 23,731 19,679
Barangay 9 2,018 2,042
Barangay 10 1,425 1,066
Barangay 11 2,474 1,669
Barangay 12 30,641 27,841
Barangay 13 1,120 1,354
Barangay 14 19,934 20,706
Barangay 15 1,397 1,663
Barangay 16 3,597 3,112
Barangay 17 3,241 4,040
Barangay 18 10,137 10,442
Barangay 19 3,493 3,555
Barangay 20 9,023 7,326
Barangay 21 3,014 3,485
Barangay 22 7,353 7,168
Barangay 23 2,618 2,430
Barangay 24 2,852 2,602
Barangay 25 1,720 1,642
Barangay 26 3,849 3,473
Barangay 27 5,015 3,665
Barangay 28 29,657 27,448
Barangay 29 1,815 1,808
Barangay 30 3,417 3,355
Barangay 31 5,169 4,435

7
Table 6. Total Population by Barangay, Caloocan City: 2010 and 2000- Continued
Total Population
May 1, 2010 May 1, 2000
Barangay 32 2,766 2,895
Barangay 33 5,403 5,732
Barangay 34 6,372 5,660
Barangay 35 19,971 18,132
Barangay 36 5,077 5,885
Barangay 37 3,233 4,162
Barangay 38 4,352 4,195
Barangay 39 831 1,735
Barangay 40 1,534 1,493
Barangay 41 899 1,212
Barangay 42 801 615
Barangay 43 4,121 4,287
Barangay 44 740 685
Barangay 45 1,457 691
Barangay 46 1,553 1,957
Barangay 47 424 571
Barangay 48 677 549
Barangay 49 5,576 5,175
Barangay 50 1,440 1,570
Barangay 51 1,519 1,405
Barangay 52 2,772 2,878
Barangay 53 1,346 1,275
Barangay 54 1,557 1,250
Barangay 55 1,570 1,403
Barangay 56 3,547 3,824
Barangay 57 852 1,096
Barangay 58 702 852
Barangay 59 4,567 4,599
Barangay 60 1,949 1,913
Barangay 61 1,351 1,709
Barangay 62 493 528
Barangay 63 3,144 3,804
Barangay 64 1,711 1,856
Barangay 65 1,368 1,170
Barangay 66 1,900 1,970
Barangay 67 2,738 2,767
Barangay 68 1,198 1,892
Barangay 69 3,305 3,059

8
Table 6. Total Population by Barangay, Caloocan City: 2010 and 2000- Continued
Total Population
May 1, 2010 May 1, 2000
Barangay 70 4,053 4,197
Barangay 71 1,137 941
Barangay 72 184 214
Barangay 73 16,849 15,204
Barangay 74 3,698 3,265
Barangay 75 3,191 2,781
Barangay 76 19 106
Barangay 77 1,030 877
Barangay 78 1,526 1,478
Barangay 79 542 621
Barangay 80 1,711 2,986
Barangay 81 2,324 2,490
Barangay 82 2,329 2,308
Barangay 83 1,748 1,540
Barangay 84 1,961 2,164
Barangay 85 1,428 1,173
Barangay 86 3,147 2,491
Barangay 87 1,492 751
Barangay 88 2,176 2,569
Barangay 89 1,590 1,564
Barangay 90 1,682 2,241
Barangay 91 904 1,117
Barangay 92 658 732
Barangay 93 3,721 4,073
Barangay 94 776 879
Barangay 95 2,648 2,950
Barangay 96 1,330 1,536
Barangay 97 2,071 2,150
Barangay 98 2,146 2,461
Barangay 99 735 758
Barangay 100 1,031 1,549
Barangay 101 2,166 2,326
Barangay 102 1,520 2,366
Barangay 103 743 870
Barangay 104 859 974
Barangay 105 1,942 2,443
9
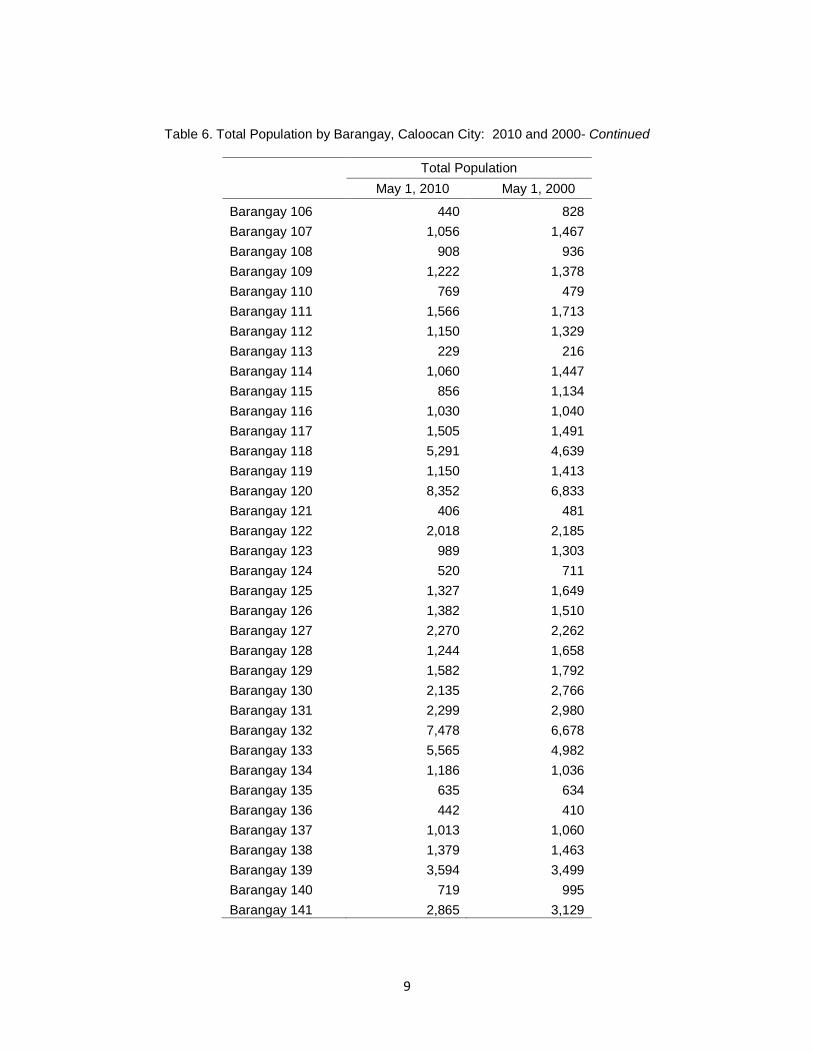
Table 6. Total Population by Barangay, Caloocan City: 2010 and 2000- Continued
Total Population
May 1, 2010 May 1, 2000
Barangay 106 440 828
Barangay 107 1,056 1,467
Barangay 108 908 936
Barangay 109 1,222 1,378
Barangay 110 769 479
Barangay 111 1,566 1,713
Barangay 112 1,150 1,329
Barangay 113 229 216
Barangay 114 1,060 1,447
Barangay 115 856 1,134
Barangay 116 1,030 1,040
Barangay 117 1,505 1,491
Barangay 118 5,291 4,639
Barangay 119 1,150 1,413
Barangay 120 8,352 6,833
Barangay 121 406 481
Barangay 122 2,018 2,185
Barangay 123 989 1,303
Barangay 124 520 711
Barangay 125 1,327 1,649
Barangay 126 1,382 1,510
Barangay 127 2,270 2,262
Barangay 128 1,244 1,658
Barangay 129 1,582 1,792
Barangay 130 2,135 2,766
Barangay 131 2,299 2,980
Barangay 132 7,478 6,678
Barangay 133 5,565 4,982
Barangay 134 1,186 1,036
Barangay 135 635 634
Barangay 136 442 410
Barangay 137 1,013 1,060
Barangay 138 1,379 1,463
Barangay 139 3,594 3,499
Barangay 140 719 995
Barangay 141 2,865 3,129

10
Table 6. Total Population by Barangay, Caloocan City: 2010 and 2000- Continued
Total Population
May 1, 2010 May 1, 2000
Barangay 142 4,122 4,205
Barangay 143 3,458 3,588
Barangay 144 4,038 4,239
Barangay 145 4,685 5,266
Barangay 146 2,817 3,039
Barangay 147 3,677 3,555
Barangay 148 4,029 3,914
Barangay 149 4,547 4,819
Barangay 150 4,377 4,685
Barangay 151 4,486 4,644
Barangay 152 3,964 4,277
Barangay 153 3,430 4,038
Barangay 154 3,654 3,670
Barangay 155 3,258 3,476
Barangay 156 5,397 5,934
Barangay 157 2,834 3,069
Barangay 158 2,364 2,045
Barangay 159 4,291 4,098
Barangay 160 15,019 14,061
Barangay 161 7,411 7,900
Barangay 162 15,199 12,481
Barangay 163 11,101 8,303
Barangay 164 14,151 12,000
Barangay 165 25,647 20,358
Barangay 166 16,797 13,365
Barangay 167 44,735 19,142
Barangay 168 27,736 19,675
Barangay 169 4,086 3,961
Barangay 170 9,593 8,696
Barangay 171 80,931 33,152
Barangay 172 20,509 15,965
Barangay 173 15,024 9,715
Barangay 174 19,052 14,778
Barangay 175 52,779 34,813
Barangay 176 243,890 188,419
Barangay 177 75,548 50,938
Barangay 178 97,068 64,148
Barangay 179 31,825 18,645
11
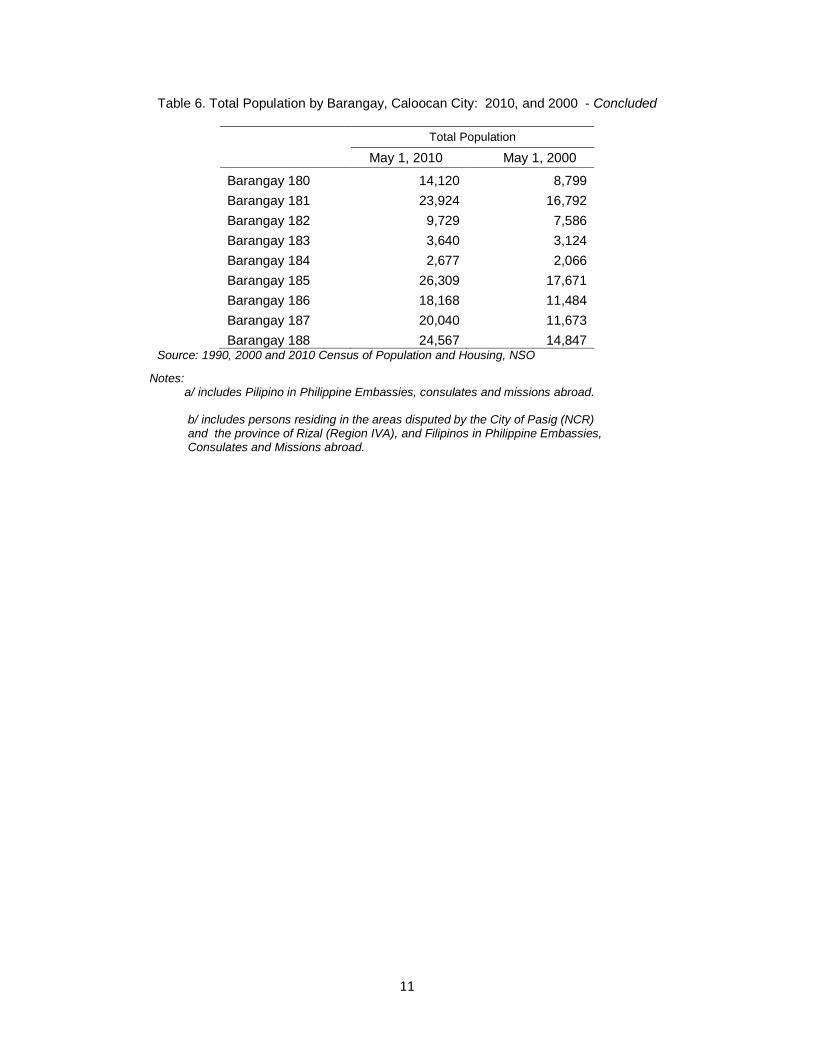
Table 6. Total Population by Barangay, Caloocan City: 2010, and 2000 - Concluded
Total Population
May 1, 2010 May 1, 2000
Barangay 180 14,120 8,799
Barangay 181 23,924 16,792
Barangay 182 9,729 7,586
Barangay 183 3,640 3,124
Barangay 184 2,677 2,066
Barangay 185 26,309 17,671
Barangay 186 18,168 11,484
Barangay 187 20,040 11,673
Barangay 188 24,567 14,847 Source: 1990, 2000 and 2010 Census of Population and Housing, NSO
Notes: a/ includes Pilipino in Philippine Embassies, consulates and missions abroad.
b/ includes persons residing in the areas disputed by the City of Pasig (NCR) and the province of Rizal (Region IVA), and Filipinos in Philippine Embassies, Consulates and Missions abroad.
12
Table 7. Household Population by Sex, Sex Ratio and Age Group, Caloocan City : 2010 and 2000
Age Group
Household Population
2010 2000
Both Sexes
Male Female Sex
Ratio
Both Sexes
Male Female Sex
Ratio
All Ages 1,487,245 741,030 746,215 99
1,174,673
586,350
588,323 100
Under 5 160,547 82,413 78,134 105
152,242
78,066
74,176 105
5 ‐ 9 155,563 80,473 75,090 107
137,015
70,401
66,614 106
10 ‐ 14 153,873 78,891 74,982 105
117,196
59,081
58,115 102
15 ‐ 19 151,002 74,619 76,383 98
113,552
55,017
58,535 94
20 ‐ 24 144,315 70,991 73,324 97
119,083
57,125
61,958 92
25 ‐ 29 134,156 66,040 68,116 97
106,948
52,836
54,112 98
30 ‐ 34 121,941 60,879 61,062 100
99,683
50,191
49,492 101
35 ‐ 39 103,410 52,158 51,252 102
85,354
43,069
42,285 102
40 ‐ 44 93,933 46,982 46,951 100
72,372
36,914
35,458 104
45 ‐ 49 80,146 39,733 40,413 98
54,368
27,878
26,490 105
50 ‐ 54 64,905 32,136 32,769 98
41,472
20,924
20,548 102
55 ‐ 59 46,490 22,682 23,808 95
25,347
12,736
12,611 101
60 ‐ 64 32,806 15,285 17,521 87
20,673
9,785
10,888 90
65 ‐ 69 18,140 8,100 10,040 81
13,098
5,949
7,149 83
70 ‐ 74 13,092 5,310 7,782 68
7,868
3,370
4,498 75
75 ‐ 79 7,137 2,618 4,519 58
4,440
1,705
2,735 62
80 ‐ 84 3,692 1,159 2,533 46
2,328
772
1,556 50
85 and Over 2,097 561 1,536 37
1,634
531
1,103 48 Source: 2000 and 2010 Census of Population and Housing, NSO
13
TECHNICAL NOTES
The National Statistics Office conducted the 2010 Census of Population and Housing (CPH) in May to June 2010 pursuant to Batas Pambansa Blg. 72 and Commonwealth Act 591. The 2010 CPH is the 13th census of population and 6th census of housing undertaken since the first census in 1903. The 2010 CPH was designed to take an inventory of the total population and housing units and to collect information about their characteristics. The census of population is the source of information on the size and distribution of the population as well as information about the demographic, social, economic and cultural characteristics. The census of housing, on the other hand, provides information on the supply of housing units, their structural characteristics and facilities which have bearing on the maintenance of privacy, health and the development of normal family living conditions. These information are vital for making rational plans and programs for national and local development, basis for the apportionment of the Internal Revenue Allotment to local government and for the creation of legislative areas such as regions, provinces, municipalities and barangays, or the conversion of a municipality into a city. Specifically, the census aimed to obtain comprehensive data on the size, composition and distribution of the population in the Philippines; to gather migration and fertility data, to classify the population according to ethnic origin and religious affiliations and determine their geographic distribution; to gather data on usual occupation and industry; and to take stock of existing housing units in the country and to gather information about their geographic location, structural characteristics and available facilities. Census day for the 2010 CPH was May 1, 2010 as of 12:01 a.m. The Philippine Standard Geographic Codes (PSGC) as of March 31, 2010 was used for the disaggregation of geographic levels for the 2010 CPH. Proclamation No. 362, signed by President Benigno Simeon C. Aquino III on 30 March 2012 made official the census counts for all purposes. Population counts also include homeless population and Filipinos in Philippines Embassies, Consulates and Missions abroad. The counts were based on census accomplished questionnaires all over the country. These questionnaires were processed at the different Regional Census Processing Centers using the Optical Mark Recognition (OMR) technology along with the Census Integrated Processing System developed by NSO for this purpose. The successful completion of census-taking was made possible with the support of the local and national officials, government agencies, local government units, media, private agencies, and non-government organizations. Data on land area (in hectares) was provided by the Land Management Bureau, and converted to square kilometers by dividing the land area by 1000. The land area was based on the 2010 Master List Land Area of the Philippines.

14
Concepts and Definitions Household is a social unit consisting of a person living alone or a group of persons who sleep
in the same housing unit and have a common arrangement in the preparation and consumption of food. Household population refers to all persons who are members of the household. Average household size is the average number of persons who live in the household, computed as the household population in a given area divided by the corresponding total number of households in the area Growth rate is the rate which the population is increasing (or decreasing) in a given period due to natural increase and net migration, expressed as a percentage of the base population. Land area refers to the geographical size of a political entity measured in square kilometers. Population density refers to the average number of persons per square kilometre of land, which is computed by dividing the total population by the land area (in square kilometers) of a given political entity. Barangay is the smallest political unit in the country. Median age is the age that divides the population into two numerically equal groups, that is, half of the population are younger than the median age and the other half are older. Sex ratio is the number of males per one hundred females in a given population.
Overall dependency ratio is the sum of the number of persons under 15 years old (young dependents) and persons aged 65 and over (old dependents) divided by the number of persons 15 to 64 years old (working-age group) and multiplied by 100. This ratio is expressed as the number of total dependents to 100 persons in the working-age group.