dating fluvial terraces with be and al profiles: application to the
TRANSCRIPT

Ž .Geomorphology 27 1999 41–60
Dating fluvial terraces with 10Be and 26Al profiles: application tothe Wind River, Wyoming
Gregory S. Hancock a,), Robert S. Anderson a, Oliver A. Chadwick b,Robert C. Finkel c
a Department of Earth Sciences and Institute of Tectonics, UniÕersity of California, Santa Cruz, CA 95064, USAb Department of Geography, UniÕersity of California, Santa Barbara, CA 93106, USA
c Center for Accelerator Mass Spectrometry, Lawrence LiÕermore National Laboratory, LiÕermore, CA 94550, USA
Received 11 July 1997; revised 13 February 1998; accepted 11 May 1998
Abstract
Fluvial strath terraces provide a record of river incision and the timing of climatic perturbations to the fluvial system.Dating depositional surfaces like terraces that are older than the range of 14C, however, is difficult. We employ a
Ž .cosmogenic radionuclide CRN profile technique that addresses a major problem of CRN dating on such surfaces: nuclideinheritance. By measuring 10Be and 26Al profiles, we constrain the exposure age and the mean CRN inheritance for thedeposit. The CRN profile also yields a self-check on the assumptions underlying the method. We report our attempts to dateterraces along the Wind River, WY. Like many sequences of western North American fluvial terraces, these are inferred toreflect oscillation between glacial and interglacial conditions in the headwaters. Previous dating of some of these terracesand the associated terraces and glacial deposits makes this a unique location to compare dating methods. Dates from five
Ž .sites along the Bull Lake-glacial correlative terrace WR-3 are ;118–125 ka, which agrees with dates on Bull Lake-agemoraines and independent age estimates on the terrace, and is consistent with the model of terrace–glacial relationship. CRNinheritance is significant and highly variable, requiring it be considered despite the additional sampling complexity.Assuming all inheritance in WR-3 deposits arises during exhumation in the headwaters, we obtain minimum mean rates ofexhumation of ;13–130 mrMy for the source rocks. Alternatively, assuming the CRNs are inherited during clast transport,the time of fluvial transport from source to terrace is );10 ka; it increases downstream and is lower for sand than cobbles.
Ž .The CRN ages for older terraces WR-7s;300 ka and WR-15s;510 ka are lower by ;50% than previous estimatesbased on tephrochronology; the most plausible explanation is eolian deflation of a once thicker loess cover on the terracesurfaces. Mean thicknesses of loess of ;0.5–1.5 m are required to reconcile these concentrations of CRN with the previousestimates of age. Difficulty in dating the older terraces emphasizes that geologic caution, independent estimates of age, andmultiple sample sites should still be part of dating depositional surfaces with CRNs, even when employing the inheritance-correction technique. q 1999 Elsevier Science B.V. All rights reserved.
Keywords: fluvial terraces; inheritance-correction technique; cosmogenic radionuclide
) Corresponding author. Present address: Department of Geology, College of William and Mary, Williamsburg, VA 23187, USA. E-mail:[email protected]
0169-555Xr99r$ - see front matter q 1999 Elsevier Science B.V. All rights reserved.Ž .PII: S0169-555X 98 00089-0
( )G.S. Hancock et al.rGeomorphology 27 1999 41–6042
1. Introduction
Fluvial strath terraces mark the position of adowncutting river through time, and provide a recordof river incision and the timing of perturbations tothe fluvial system. Strath terraces are abandonedriver channels and floodplains above the active chan-nel, formed as a river migrates laterally during peri-ods of relatively constant river elevation. This migra-tion widens the valley floor, and bevels a bedrockplatform that is covered by thin alluvium. This plat-form becomes a terrace upon abandonment whenclimatic andror tectonic changes lead to river inci-sion.
Many river systems in the Rocky Mountain andColorado Plateau region of western North Americaretain a fluvial strath terrace record of discontinuousdowncutting into bedrock throughout the late Quater-nary. Absolute and relative ages have been obtainedon many of these terraces by tephrochronology,stratigraphic correlation, and radiometric dating.Many terrace sequences appear to record the fluvialresponse to local oscillations between glacial andinterglacial conditions, with formation of the strathsand deposition of the capping alluvium occurringduring periods of maximum headwater glaciationŽe.g., Ritter, 1967; Howard, 1970; Sinnock, 1981;
.Reheis et al., 1991 . Strath formation may reflect atransition to braided stream conditions initiated byincreased sediment supply and hydrologic changesassociated with glacial periods. Incision may occurduring interglacials, or periods of transition from
Ž .interglacial to glacial conditions Sinnock, 1981 . Ifindeed these terraces are linked to glacial episodes,they may provide a record of glacial conditions thatis better preserved and more complete in time thanthe moraine records in the headwaters. In addition,acceleration of the rates of incision of rivers duringthe Quaternary has been noted in many locationsŽe.g., Patton et al., 1991; Reheis et al., 1991; Repka
.et al., 1997; Chadwick et al., 1997 suggesting aresponse of the rates of incision of rivers to someregional forcing.
In this paper we present our work on dating asequence of fluvial terraces along the Wind River,WY. Because depositional features like fluvial ter-races are difficult to date numerically, we havedeveloped a dating technique, modified from Ander-
Ž .son et al. 1996 , that employs cosmogenic radionu-Ž .clide CRN profiles. We first discuss the Wind
River basin field area and the preserved terracesequence, and review the existing glacial chronologyestablished for this region. We then present thedetails of our CRN profile technique; our techniqueand the concerns leading to its development arerelevant for dating depositional features of any type.We then present the results, and conclude with a
Ž .discussion addressing the following questions: 1 isthe CRN profile strategy that we outline for dating
Ž .these features worth the effort?; 2 how do ourterrace ages compare with previous estimates, and
Ž .what do they imply about terrace formation?; 3what is the incision history of the Wind River sug-
Ž .gested by our ages?, and 4 what is the magnitudeof CRN ‘inheritance’ in this system, and what does itimply about sediment exhumation and transport his-tories?
2. The Wind River basin
2.1. Geology and climate
The Wind River basin, located in northwesternWyoming, is delineated by the Wind River Range,Owl Creek Mountains, and Granite Mountains to thesouthwest, north, and southeast, respectively, and the
Ž .volcanic Absaroka Range to the northwest Fig. 1 .The Wind River rises along the continental divide inthe northern Wind and southern Absaroka ranges,and flows southeastward along the front of the Wind
Ž .River Range front for ;200 km Fig. 1 . At River-ton, the Wind River turns north and cuts the WindRiver Canyon through the Owl Creek Mountains,where the river gradient steepens in response toencountering resistant Precambrian and Paleozoic
Ž .rocks Fig. 2 . Once through the Wind River Canyon,it becomes the Bighorn River. The bedrock underly-ing the river in the Wind River Basin is mainlysiltstones and mudstones of basin-filling EoceneWind River Formation; some short reaches crossnortheast-dipping and more resistant Mesozoic rocksŽ .Fig. 2 . Along most of its course above the WindRiver Canyon, the Wind River flows on alluvial fill,not directly on bedrock. The basins in this regionŽ .e.g., Wind, Bighorn, Green were primarily deposi-
( )G.S. Hancock et al.rGeomorphology 27 1999 41–60 43
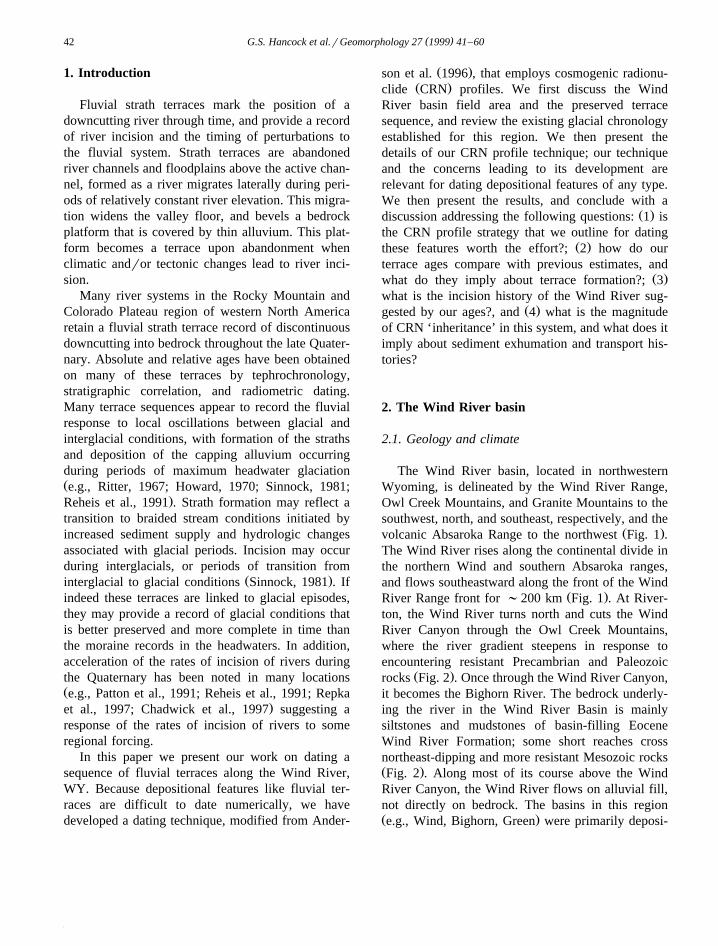
Fig. 1. Map of sample site locations in the Wind River region and river kilometers.
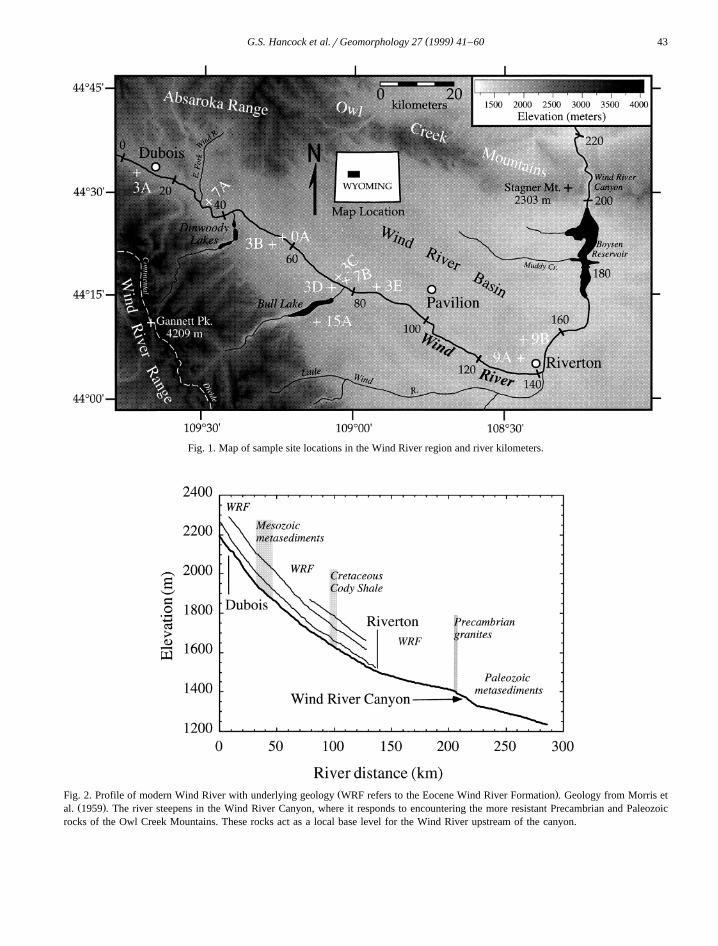
Ž .Fig. 2. Profile of modern Wind River with underlying geology WRF refers to the Eocene Wind River Formation . Geology from Morris etŽ .al. 1959 . The river steepens in the Wind River Canyon, where it responds to encountering the more resistant Precambrian and Paleozoic
rocks of the Owl Creek Mountains. These rocks act as a local base level for the Wind River upstream of the canyon.
( )G.S. Hancock et al.rGeomorphology 27 1999 41–6044
tional through the early Tertiary; regional uplift be-ginning in the Pliocene has led to extraction of much
Ž .of the basin fill sediments Love, 1979 .Climate in this region is frigid and arid to semi-
Žarid. Mean annual precipitation period of record:.1951–1980 is 21.8 cm at Dubois, 19.8 cm at Pavil-
Žion, and 20.6 cm at Riverton see Fig. 1 for loca-.tions ; at higher elevations in the Wind River Range,
total precipitation reaches many times that inthe basin. Mean annual temperature at Riverton is;6.08C. Peak discharges in the annual Wind Riverhydrograph are typically associated with spring snowmelt, occurring in late May through late June.Recorded annual peak discharges range from 16–55
3 Ž . 3m rs at Dubois 1946–1992 and 51–377 m rs atŽ .Riverton 1906–1994 . Drainage area along the study
reach is ;1260 km2 at Dubois, ;5980 km2 atRiverton, and ;19,940 km2 at the Wind RiverCanyon.
2.2. Glacial chronology of the Wind RiÕer region
A well-established glacial chronology exists forthe last several 100 thousand years before presentŽ . Ž .ka for the Wind River region. Blackwelder 1915first proposed the Pinedale, Bull Lake, and Buffaloglaciations in the Wind River Range, and correlated
them with the late and early Wisconsin and Illinoianglaciations, respectively, of mid-continental NorthAmerica. The Pinedale and Bull Lake deposits havesince become the type locales for correlative glacialdeposits in the Rocky Mountain region. On the basis
Ž .of obsidian hydration ages, Pierce et al. 1976 as-signed ages of 25–35 ka for the Pinedale and 130–155 ka for the Bull Lake glacial deposits in Yellow-stone. Cosmogenic radionuclide dating techniqueshave provided a second set of numeric age estimatesfor moraines in drainages within the Wind River
Ž .Range. Gosse et al. 1995 suggest the Pinedaleglacial maximum was reached by ;22 ka at Fre-mont Lake near Pinedale; similarly, at Bull Lake, the
Ž36 10 .CRN dating Cl and Be of the Pinedale-agemoraine complex yields ages from 16 to 23 kaŽPhillips et al., 1997; note that ages given here are inCRN years, which equal calendar years only if ratesof production are correct, which is a matter of ongo-ing debate; see Clark et al., 1995; Nishiizumi et al.,
.1996 . Dates on four Bull Lake-age moraine com-Ž . Ž36plexes at Bull Lake Fig. 1 , yield CRN Cl and
10 .Be ages of )130 ka, 120 to 128 ka, 121 to 105Ž .ka, and 100 to 110 ka Phillips et al., 1997 . Whereas
evidence exists for glacial conditions during isotopeŽstage 4 elsewhere in western North America e.g.,
Richmond and Fullerton, 1986; Phillips et al., 1990;
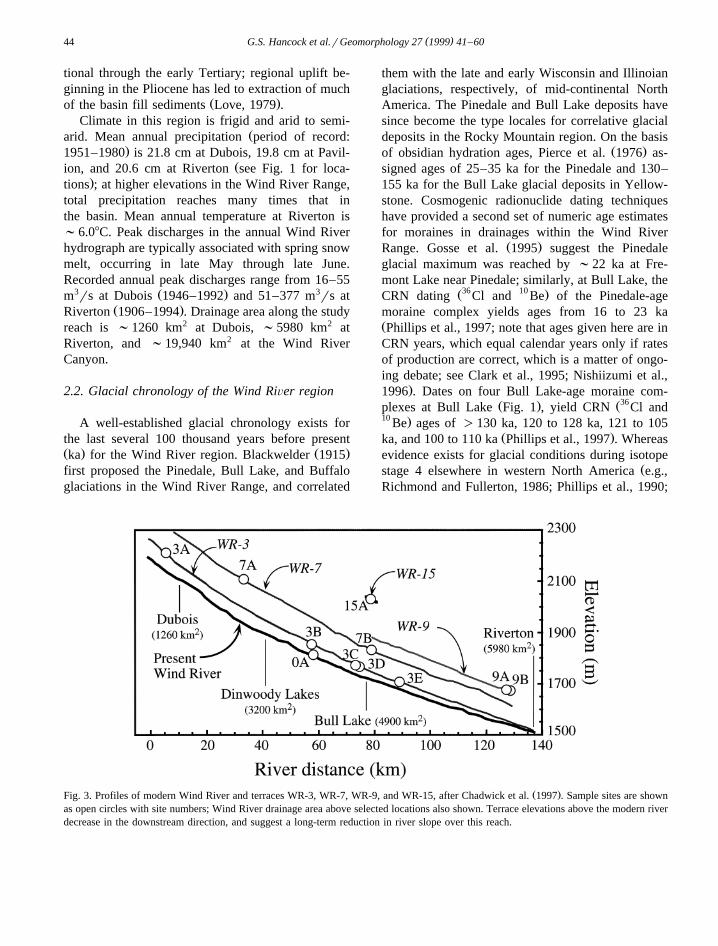
Ž .Fig. 3. Profiles of modern Wind River and terraces WR-3, WR-7, WR-9, and WR-15, after Chadwick et al. 1997 . Sample sites are shownas open circles with site numbers; Wind River drainage area above selected locations also shown. Terrace elevations above the modern riverdecrease in the downstream direction, and suggest a long-term reduction in river slope over this reach.

( )G.S. Hancock et al.rGeomorphology 27 1999 41–60 45
.Forman et al., 1993; Repka et al., 1997 , little con-clusive evidence exists for a glaciation during this
Žtime in the Wind River Range Hall and Shroba,.1993; Hall and Shroba, 1995 .
Whereas moraines of at least one older glacialadvance, named the Sacagawea Ridge, are mapped
Žin the Wind River Basin Blackwelder, 1915; Rich-.mond and Murphy, 1965 , numeric ages are not well
ŽFig. 4. View of modern Wind River and several terraces, looking upstream and south from terrace WR-7 ;170 m above river level,.sample site 7A . Fluvial gravels are exposed on the surface of the terrace. Terrace WR-3 is above the road on right, ;55 m above river
level. Road is constructed on terrace WR-1.

( )G.S. Hancock et al.rGeomorphology 27 1999 41–6046
constrained for this advance. Sacagawea Ridgemoraines at Dinwoody Lakes yield limiting 36Cl and
10 Ž .Be model ages of )232 ka Phillips et al., 1997 ,Žand )125–297 ka Evenson et al., 1994; J. Gosse,
ŽFig. 5. View of terrace subsurface at sample site 9B showing the imbricated fluvial gravels, thin sand lenses near middle and bottom of. Ž . Ždeposit , and capping silt layer upper ;45 cm that are typical of the deposits of the Wind River terraces. Numerous quartzite clasts or
.quartz sands are collected at several depths in such exposures; equal masses of quartzite are extracted from each clast and combined intoone sample. We analyzed samples from several depths to obtain the mean CRN profile in a deposit, which allow an estimation of depositage and mean inheritance.

( )G.S. Hancock et al.rGeomorphology 27 1999 41–60 47
.pers. comm. . A fluvial terrace along the Wind RiverŽ .WR-7 that may be correlative with the SacagaweaRidge outwash has been dated at ;660 ka, becauseit contains a deposit of volcanic ash identified as the
ŽLava Creek B Jaworowski, 1992; Chadwick et al.,.1997 .
2.3. The Wind RiÕer terraces
ŽFifteen separate strath terrace levels numbered.WR-1 to WR-15 from youngest to oldest have been
Žmapped along the Wind River above Riverton Fig..2, Chadwick et al., 1997; Figs. 3 and 4 . Initial work
Ž .by Blackwelder 1915 identified three terraces inthe Wind River basin, calling them the Black RockŽ . Ž .WR-15 , Circle Bull Lake-age WR-3 and LenoreŽ . Ž .Pinedale-age WR-1 terraces. Morris et al. 1959identified 13 chronologically distinct terraces, includ-
Žing terraces preserved along tributaries e.g., Muddy.Creek draining the unglaciated Owl Creek Moun-Ž . Ž .tains Fig. 1 . Morris et al. 1959 suggested uplift or
tilting of the basin, enlargement of the drainage areathrough capture, climatic change, or base levelchange as possible mechanisms to drive the develop-ment of terraces. They inferred that streams formingthe straths had higher discharges than the modern
Ž .counterparts. Chadwick et al. 1997 and Phillips etŽ .al. 1997 have more recently mapped and identified
15 terrace levels, and have dated several with in situ36 10 ŽCl and Be WR-1;16 to 23 ka and WR-3;100
. Žto 125 ka and tephrochronology WR-7s;660.ka . The ages on these terraces were used to calcu-
late rates of incision, which were then extrapolatedto estimate ages for the remaining terrace levels.This pre-existing chronology provides a rare oppor-tunity to compare numeric ages obtained by severalmethods to the estimates of CRN age we present inthis paper.
The Wind River terraces are straths thinly man-Ž .tled by primarily braided stream deposits Fig. 5 .
Ž .On the most extensive terrace WR-3 , total thick-ness of alluvial deposits varies from ;25 m at
ŽDubois to a few meters near Riverton Chadwick et.al., 1997 . The terrace gravels are predominantly
Absaroka Range volcanics, Wind River Range gran-ites and Mesozoic sedimentary rocks, and quartzitecobbles. These quartzite cobbles are likely extractedfrom conglomerates within the Middle Eocene Ay-
cross Formation, and possibly the Paleocene PinyonConglomerate. The Aycross outcrops along the baseof the Absaroka Range to the north of the WindRiver, and could provide quartzite cobbles to the
Ž .river downstream of the Dubois area Fig. 1 . Mappedoutcrops of the Pinyon lie just across the dividebetween the Wind River and Snake River basinsnorth of the Wind River Range, but is not identifiedin locations which could be contributing to the river
Ž .between Dubois and Riverton Fig. 1 . The terracedeposits are typically clast supported, with either anopenwork or sand matrix, and are composed of50–75% gravel-sized material. Grain sizes range
Ž .from fine sands to boulders -50 cm . Discretelayers of up to ;1 m separated by unconformitiesare seen in several exposures. Gravels are imbri-cated, confirming that they remain in the original
Ž .depositional position. Thin -20 cm , cross-beddedsand lenses occur locally, but no significant silt orclay lenses were observed within the gravel deposits.An eolianrfluvial silt layer with thicknesses of a fewtens of cm to ;2 m usually overlies the fluvial
Ž .cobbles and sands on all terraces example in Fig. 5 .Ž .Fluvial cobbles -10 cm are scattered on the sur-
face of the eolianrfluvial silt layer; some similarly-sized floating clasts are occur within the silt layer.These clasts have likely been upfrozen from thefluvial deposits below the silt layer.
3. Cosmogenic radionuclide profile dating
3.1. Theory and dating technique
10 Ž .We utilize the CRNs Be t s1.50 My and1r226 Ž .Al t s0.705 My . CRNs are produced in situ in1r2
material at the surface primarily by bombardment ofŽtarget nuclei by secondary cosmic ray particles Bi-
.erman, 1994; Cerling and Craig, 1994 . The produc-tion rate, P, of CRNs in solid material decreaseswith depth, z:
P z sP PeyŽ z r z ) . 1Ž . Ž .0
where P is the rate of production at the surface and0
the decay length scale is z ) sLrr, where r is thedensity of the overlying material, and L is theabsorption mean free path. The values for L used
2 Ž .here are ;150 grcm Brown et al., 1992 .

( )G.S. Hancock et al.rGeomorphology 27 1999 41–6048
In depositional settings like fluvial terraces, thetotal concentration of a CRN in a sample from the
Ž . Ž .deposit e.g., a cobble has two components: 1ŽCRNs accumulated prior to deposition the ‘inheri-
. Ž .tance’, N , and 2 CRNs accumulated followinginŽ .deposition, N Anderson et al., 1996 . Combiningdep
these, the concentration, N, of a CRN in a sample isa function of the deposit age, t, and depth, z:
P zŽ .yl t yl tN z ,t s P 1ye qN Pe 2Ž . Ž . Ž .in
l
Ž . Ž Ž ..where P z is the rate of production Eq. 1 , and l
Ž .is the decay constant ln 2rt . The first term in1r2Ž .Eq. 2 represents the expected growth of an expo-
nential CRN profile following deposition, whereasthe second term represents the decay of the inherited
Ž .component Fig. 6 . This formulation assumes nosurface erosion or burial and no correction formuon-produced isotopes. If the age of the surfacebeing dated is much shorter than the half-life of theisotopes, then we can simplify this equation to:
N z ,t sN t eyz r z )
qN 3Ž . Ž . Ž .surf in
where N sP t, the CRN concentration at thesurf 0
surface of the deposit.The inheritance, N , includes CRNs acquired dur-in
Ž .ing exhumation from the source N and duringexhŽ .transport from the source to the deposit N . Intrans
this setting, CRNs accumulated in a clast before itwas incorporated into the source are negligible, be-cause the youngest source conglomerates were de-posited in the Eocene, );15 10 Be half-lives ago.
Ž .Deposit materials e.g., cobbles are likely to haveexperienced a wide variety of transport and exhuma-tion histories, giving N a stochastic nature andin
making depositional surfaces potentially difficult toŽ .date with CRNs Fig. 6; Anderson et al., 1996 . This
variability in N primarily arises from differences inin
grain size, source area, lithology, and transport dis-tance of materials from the source. Because of theunknown contribution of N to the total CRN con-in
centration, CRN exposure ages obtained from anysingle clast in a deposit must be considered, at best,a maximum.
We correct for inheritance by using a clast amal-gamation and multiple sample depth technique im-
Ž .proved from that described in Anderson et al. 1996because we use CRN profiles rather than sample
Fig. 6. Schematic of two mean CRN profiles in a deposit—oneŽ .upon abandonment dashed line , one at some time, t, later whenŽ .deposit is sampled solid curve . Our dating technique assumes
that, whereas inheritance is likely highly variable among individ-Žual clasts illustrated by the gray speckled region around the
.curves , the mean inheritance, N , is equal throughout the de-in
posit. If this is the case, then the mean CRN profile at depositionshould be equal throughout the deposit, as shown. The CRNprofile grows exponentially with time, t, again with some varia-tion around the mean resulting from the variable inheritance. Bydetermining the mean concentration of CRN at several depths
Ž .with amalgamated samples open circles , we can estimate theŽ .mean CRN profile solid line for the deposit. We then use linearŽ . Ž Ž . .regression of Eq. 2 Eq. 3 if decay is not important to
determine the age and mean inheritance for the deposit.
pairs. At a discrete depth in a deposit, we collectnumerous quartzite clasts or quartz sand grains. Wecollect and isolate quartz for our CRN analysis be-
Ž .cause 1 it provides appropriate and abundant target10 Ž . 26 Ž . Ž .nuclei for Be oxygen and Al silicon ; 2 it is
resistant to chemical weathering and is resistant toŽ .contamination by meteoric CRNs; 3 it is abundant
Ž .in the terrace deposits; and 4 rates of production

( )G.S. Hancock et al.rGeomorphology 27 1999 41–60 49
Žfor these CRN in quartz have been calibrated e.g.,.Nishiizumi et al., 1996 . Equal masses of quartz are
taken from each clast and are combined into onesample. The CRN downconcentration measured in
Ž .this amalgamated sample includes: 1 the meaninheritance, N , for the clasts going into the amalga-in
Ž .mated sample; and 2 N , which should be equaldep
for all clasts because they are collected from a fixedŽ Ž . .depth i.e., nearly equal P z for each . Assuming
we have amalgamated enough clasts to obtain Nin
for the sampling depth, this concentration is themean CRN concentration at that sampling depth,
( )N z,t .By repeating this process at several depths, we
obtain points on the mean CRN profile in a depositŽ . Ž .Fig. 6 . Assuming that 1 the mean inheritance,
Ž .N , is not a function of depth within the deposit; 2in
the material has not been significantly displacedŽ . Ž .post-depositionally e.g., by frost heave ; and 3
deposition was rapid relative to the age of the de-posit, then the CRN concentrations should fall on an
Ž . Ž Ž .exponential profile defined by Eq. 2 or Eq. 3 if.decay is not significant . We use simple linear re-
gression to obtain the age and the inheritance fromthe measured CRN profiles. This method is an ad-vance over the two-sample method outlined in An-
Ž .derson et al. 1996 , because the full CRN profile
provides a more robust test of the assumptions above;if significantly violated, an exponentially-decayingCRN profile would not be obtained. The age ob-tained with this method corresponds to the time sincedeposition of the terrace, assuming that the rate ofproduction of CRNs in the terrace deposits has notbeen significantly altered by factors such as signifi-cant erosion of andror deposition on the surface,burial by snow cover, or growth of significant vege-tation on the terrace surface. In the Wind Riversystem, the later two are not likely to be significant,given the arid, frigid, and windy climate found in theWind River basin. The possibility for loess cover isdiscussed below as a possibility on several terracesurfaces.
3.2. Sample collection and analysis
Samples were collected from one site on theŽ .modern floodplain WR-0 , and from 10 sites on four
Žterrace levels 5 WR-3, 2 WR-7, 2 WR-9, and 1.WR-15 along the Wind River between Dubois and
ŽRiverton, WY ;125 river km, Figs. 1 and 3; Table.1 . These are the most spatially extensive terracesŽ .WR-3, WR-7, and WR-9 and the oldest terraceŽ .WR-15 along the study reach. We collected mod-
Ž .ern river gravels to determine 1 if inheritance is
Table 1Sites of Wind River terrace samples
a Ž .Terrace Assigned age ka Site River Height above Latitude Site Production Silt coverŽ Ž .Chadwick et al., number km WR at Bull Lake degrees N Selevation correction thickness
b. Ž . Ž . Ž .in press m m factor cm
Modern 0 0A 57 0 43.4 1801 4.21 NAcWR-3 103–126 3A 5 65 43.5 2194 5.56 30
3B 57 50 43.3 1847 4.35 353C 73 40 43.3 1775 4.13 403D 75 40 43.3 1768 4.10 303E 89 20 43.2 1707 3.92 30
dWR-7 ;660 7A 33 135 43.5 2121 5.29 NA7B 79 120 43.3 1829 4.29 NA
eWR-9 950 9A 127 115 43.0 1640 3.72 609B 129 115 43.1 1640 3.73 46
eWR-15 1740 15A 79 290 43.1 1999 4.82 43
a Ž .Terrace numbers follow nomenclature of Chadwick et al. 1994 .b Ž .Calculated as in Lal 1991 .c Ž36 .CRN Cl age.d Ž .Tephrachronology age Lava Creek B ash .eExtrapolation of WR-7 incision rate.

( )G.S. Hancock et al.rGeomorphology 27 1999 41–6050
Ž .significant and 2 how many clasts would be neededto constrain the mean inheritance. Whereas condi-tions in the modern river may not reflect conditionsduring terrace deposition, these samples should stillprovide at least an indication of the magnitude andvariability of inheritance. We collected sampleswhere subsurface access was available, and wherethe terrace surfaces were not obviously degraded byanthropogenic andror geomorphic processes. We es-timated the elevation and latitude of the site from
Ž1:24,000 USGS topographic quadrangle maps Table.1 . Correction factors for horizontal shielding, calcu-
Ž .lated following Nishiizumi et al. 1993 , were verynear 1.0 at all sites, which indicates that the topo-graphic shielding effect on rates of production isnegligible.
We estimated the density of terrace materials to) Žobtain values for the decay length scale, z Eq.
Ž ..1 . Samples from the silt layer collected at threelocations yielded a mean bulk density of 1.5"0.1grcm3. To constrain the density of gravel deposits,
Ž .we took photographs e.g., Fig. 5 of cross-sectionscut through the deposits, from which we estimatethat the deposits are composed of 50–75% clastslarger than coarse sand by volume. Assuming a clastdensity of 2.7 grcm3, and a 30% porosity and graindensity of 2.7 grcm3 for the interstitial sand, thedeposits have a density of roughly 2.5 grcm3, withan assumed error of "0.1 grcm3. This value iscomparable to field measurements on alluvial gravels
Ž .elsewhere Vincent and Chadwick, 1994 . With thesedensities, values for z ) range from 58"4 to 96"6cm in the Wind River terrace deposits, depending onthe thickness of the silt layer and depth of thesample.
To obtain the rates of surface production at eachsampling location, we use the calibrated sea-level,high latitude value of 5.80 atoms 10 Berg quartz-yearŽ .Nishiizumi et al., 1996 , corrected for latitude, alti-tude, and topographic shielding. The correction fac-tors are given in Table 1, and we assume an error of"10% in the rates of production provided by Nishi-
Ž .izumi et al. 1996 . The debate regarding CRN themagnitude and error of the rates of production con-
Ž .tinues e.g., Clark et al., 1995 , and, therefore, ourestimates of terrace ages will likely be subject torevision as these are refined. The rate of productionof 26Al is taken to be 6.04 times the 10 Be production
Ž .rate Nishiizumi et al., 1989 . We assume that thegeomagnetic latitude over the exposure lifetime ofthe terraces averages out to the current geographiclatitude; this likely introduces negligible error given
Ž .the ages G100 ka of the dated terraces. We do notattempt to correct the rate of CRN production forvariations in the intensity of the magnetic field. Allof our dates are given in CRN years and allowstraightforward correction for future refinements inthe histories of rates of production.
At each site, we typically selected several depths,including the terrace surface, from which to collectnumerous quartzite clasts with long dimensions of;5–20 cm. At sites 3B and 9B, we also tookquartz-rich sand from several depths. The physicalprocessing of quartz-rich sand is simpler than cob-bles. The large number of individual grains in asample provide a better estimate of the mean concen-tration of CRN. Material was collected over a narrow
Ž . Ždepth interval "5 cm and horizontal extent -2.m . Collection over a restricted depth range is re-
quired because the rate of CRN production is aŽ Ž ..function of depth Eq. 1 . For a depth range of "5
) Ž .cm and typical values for z , the range of P z is;"5%. Each cobble in a suite is crushed, and anequal mass of quartz is taken from each and com-bined into one sample, which is then pulverized andsieved. Quartz sands are sieved only. The 2.5 f to
Ž .1.0 f 0.177 to 0.50 mm fraction is retained aftersieving. If a significant non-quartz fraction remains,the material is passed through a magnetic separator,density separation, and a 50% o-phosphoric acid
Žleach to dissolve non-quartz silicates Talvitie, 1951;.D. Grainger, pers. comm., 1996 .
The amalgamated quartz samples are then purifiedfor analysis using the method of Kohl and Nishi-
Ž . 9izumi 1992 . We add ;1 g of stable 1000 ppm Beand 27Al carrier solution to the samples. Stable 9Beand 27Al concentrations are determined by induc-
Ž .tively coupled plasma mass spectrometry ICP-MSat UCSC, and the 10 Ber9Be and 26Alr27Al ratios inthe samples are determined by accelerator mass spec-
Žtroscopy AMS; Elmore and Phillips, 1987; Finkel.and Suter, 1993 at the Lawrence Livermore Na-
Ž .tional Laboratories LLNL Center for AcceleratorMass Spectrometry. Ratios are normalized to LLNLstandards for 10 Be and 26Al. The ratios, measured inprocess blanks prepared in parallel with the field
( )G.S. Hancock et al.rGeomorphology 27 1999 41–60 51
samples, are subtracted from the results; typical cor-rections are F1%.
4. Analytical results and interpretation
4.1. Analytical results and errors
The analytical results are presented in Table 2.The calculated errors in the concentration of CRNinclude propagation of uncertainties in the AMS
Ž .analyses ;"5% , stable isotope carrier concentra-Ž . Ž .tion ;"2% , and ICP-MS analyses ;"2% .
Age errors include uncertainties in sea level, highŽ .latitude rate of production "10% ; deposit density
Ž . Ž .;"5% ; latitude and altitude corrections "10% ;Ž .and absorption mean free path ;"5% , except
where noted. We neglect errors in the rate of produc-tion introduced by changes in the intensity of themagnetic field because of current uncertainty in thecalibrations of the rate of production; however, if thecorrection for the intensity of the magnetic fieldwere applied to the WR-3 sample sites, it wouldresult in a reduction of estimated ages by ;10%Ž .Clark et al., 1995 . To allow direct comparisonbetween sites, all concentrations of CRN used in thefigures and discussion are normalized by dividing
Ž .the actual abundance Table 2 by the correctionŽ .factor for latitude and altitude Table 1 .
( )4.2. Inheritance in modern Wind RiÕer WR-0samples
We analyzed five quartz samples composed ofnine clasts each collected from the modern Wind
Ž .River Site 0A, Fig. 1 . The five samples yieldedconcentrations ranging over three orders of magni-
Ž .tude Table 2 . Interpreted as model ages for CRN,the 10 Be and 26Al concentrations yield ranges of-3.6 ka to 202"42 ka CRN years and 0.655"0.21ka to 122"19 ka CRN years, respectively. Thesesamples suggest that inheritance is a substantial CRNcontributor in terraces younger than several 100 ka,and is highly variable. If single clasts were collectedfrom the surfaces of the terraces, it is likely that ageswould vary even more widely.
We would like to estimate the number of clastsrequired to constrain the mean inheritance, within a
specified standard deviation. To do so, we use amaximum likelihood, least squares method whichassumes a Gaussian distribution of the inheritance in
Žthe clast population J. Revenaugh, pers. comm.,.1997 . By assuming that the variance of clast con-
centration of CRN within each amalgamated sampleis equal to the variance of all the samples, s 2, and˜given m is the number of amalgamated clasts in each
Ž .sample 9 in this case , we can estimate the varianceof the entire population of clasts as s 2 sms 2. The˜ ˜p
number of clasts, c, required to obtain a specifiedstandard deviation, s , around the mean inheritance˜in
2 2 Žis css rs . Ignoring samples 082295-2B ana-˜ ˜p in10 .lytical results for Be below detection and 082295-
Ž .2D apparent outlier , the measured value for N atin
site 0A is 0.091 atoms 10 Bermg quartz and 0.47atoms 26Alrmg quartz, and the standard deviation ofthe clast population, is 0.12 atoms 10 Bermg quartz
26 Ž .and 0.59 atoms Alrmg quartz Table 3 . The corre-sponds to mean inherited ages of ;16 ka for 10 Beand ;14 ka for 26Al. The variance implies that;31 clasts must be amalgamated in a sample toobtain an estimate of N with a s s"20%.˜in in
4.3. FluÕial strath terrace CRN profiles and ages
4.3.1. Terrace WR-3The measured CRN profiles for WR-3 terrace
sites 3A, 3C, and 3E are shown in Fig. 7. Theprofiles display an exponential decay with depthŽ Ž . Ž ..Eqs. 1 and 2 , ignoring the surface samples fromsites 3C and 3E. The surface clasts at sites 3C and3E have likely been exposed since deposition tomean rates of production of CRN below that of thesurface rate, P . Because of this possibility, we do0
not use the surface clasts in the profiles from 3C and3E to estimate ages. Estimated 10 Be model agesobtained from the profiles range from 102"10 ka to137"22 ka, and 26Al ages range from 108"11 to
Ž .174"69 ka excluding 3D , with a mean CRN ageof 118"33 ka and 125"37 ka for 10 Be and 26Al,
Ž .respectively Table 3 . The corresponding values ofŽ10 .for each site, shown as dashed Be and solid
Ž26 .Al lines in Fig. 7, are also given in Table 3;inheritance is 7–20% of the predicted post-deposi-tional concentration of CRN at the surface, N .surf
10 Ž .The mean WR-3 Be age ;118 ka is consis-tent with terrace genesis during deposition of the two

( )G.S. Hancock et al.rGeomorphology 27 1999 41–6052
Table 2Analytical results of Wind River terrace samples
) 27 10Sample site Sample z a Quartz Al in Concentration Ber Uncorrected26Ž . Ž . Ž .and sample depth cm clasts extracted quartz atomsrmg quartz Al ratio model ages ka
10 26 10 26Ž . Ž . Ž .number m g ppm Be Al Be Al
Site 0A082295-2A 0.00"0.00 NA 9 19.9885 197 0.614" .033 3.37"0.19 5.49"0.42 25.3"5.1 23.1"3.5082295-2B 0.00"0.00 NA 9 19.9610 153 -0.0879 0.0975"0.027 NA -3.61 0.661"0.21082295-2C 0.00"0.00 NA 9 19.9900 128 0.104"0.020 0.528"0.054 5.06"1.11 4.28"1.3 3.59"0.63082295-2D 0.00"0.00 NA 9 20.3283 185 4.71"0.15 17.1"0.71 3.64"0.19 202"42 123"19082295-2E 0.00"0.00 NA 9 20.1307 169 0.437"0.029 2.10"0.16 4.79"0.48 18.0"3.7 14.3"2.3
Site 3A082095-4 0.00"0.00 NA 30 19.9974 173 3.49"0.12 23.3"1.0 6.68"0.38 111"22 127"20082095-3 0.45"0.05 83 23 5.6793 96 2.12"0.083 13.3"0.73 6.28"0.42 116"23 120"19082095-2 1.10"0.10 71 19 9.1130 115 0.933"0.048 5.78"0.26 6.19"0.43 141"29 134"19
Site 3B060295-8 1.26"0.01 71 27 19.9922 522 1.00"0.047 5.51"0.27 5.50"0.37 246"53 207"31
a060295-6 1.93"0.05 69 NA 30.0860 77 0.266"0.020 1.52"0.064 5.69"0.49 182"41 145"19a060295-5 2.25"0.08 68 NA 30.1093 70 0.202"0.016 0.846"0.045 4.18"0.40 232"53 128"17
060295-7 2.30"0.15 68 21 8.3972 108 0.544"0.033 3.17"0.30 5.82"0.65 752"200 657"130
Site 3C060295-12 0.00"0.00 NA 30 20.0078 236 2.30"0.11 13.4"0.57 5.83"0.36 98.4"20 97.5"15060295-13 0.49"0.08 89 26 13.0406 191 1.90"0.064 10.5"0.56 5.54"0.35 141"29 129"20060295-15 1.02"0.11 74 18 19.9958 417 0.600"0.10 5.57"0.26 9.28"1.67 101"29 147"22060295-10 1.75"0.25 70 19 19.9995 239 0.603"0.10 3.14"0.14 5.20"0.93 327"10 248"35
Site 3D092894-3 0.00"0.00 NA 29 20.0074 215 2.12"0.056 13.2"0.49 6.21"0.29 90.9"18 96.0"15092894-1,2 1.50"0.10 69 28 20.0213 211 0.798"0.038 3.83"0.17 4.80"0.32 316"69 224"32
Site 3E082395-1 0.00"0.00 NA 30 7.2467 166 1.94"0.075 11.0"0.48 5.66"0.33 87.0"17 83.2"13082295-3 0.55"0.05 79 30 10.3378 116 1.97"0.071 10.3"0.44 5.24"0.29 181"37 155"24082295-4 0.95"0.05 72 30 19.9838 341 1.63"0.064 8.50"0.43 5.22"0.33 286"61 237"37082295-5 1.30"0.10 70 25 6.2034 95 0.950"0.062 4.78"0.29 5.04"0.45 286"65 218"33
Site 7A082295-1A 0.00"0.00 NA 10 15.2196 184 9.00"0.28 48.0"2.2 5.34"0.30 315"68 300"52082295-1B 0.00"0.00 NA 10 15.0923 194 8.10"0.25 NA NA 282"60 NA
Site 7B082295-3A 0.00"0.00 NA 20 15.0238 210 3.63"0.18 19.6"0.75 5.40"0.34 151"31 140"22082295-3B 0.00"0.00 NA 20 14.9951 242 4.53"0.13 25.2"1.0 5.56"0.27 190"39 183"29
Site 9A082395-3A 1.75"0.05 73 21 20.2321 152 5.18"0.16 18.7"0.51 3.60"0.15 NA NA082395-3B 1.75"0.05 73 21 20.0733 169 4.65"0.13 23.6"0.73 5.07"0.22 NA NA082395-4A 2.35"0.05 70 21 20.0627 201 2.78"0.088 13.5"0.52 4.85"0.24 NA NA082395-4B 2.35"0.05 70 21 19.3740 212 2.39"0.092 12.6"0.42 5.28"0.27 NA NA
Site 9B060395-1 0.00"0.01 NA 30 20.0221 796 4.73"0.16 22.5"0.90 4.75"0.25 232"48 190"30
a060395-5 1.16"0.00 74 NA 20.4238 111 0.716"0.036 3.85"0.17 5.37"0.36 164"34 135"19aBR-1 1.13"0.05 74 NA 20.1370 96 0.671"0.043 3.90"0.24 5.81"0.51 146"31 130"19

( )G.S. Hancock et al.rGeomorphology 27 1999 41–60 53
Ž .Table 2 continued) 27 10Sample site Sample z a Quartz Al in Concentration Ber Uncorrected
26Ž . Ž . Ž .and sample depth cm clasts extracted quartz atomsrmg quartz Al ratio model ages ka10 26 10 26Ž . Ž . Ž .number m g ppm Be Al Be Al
Site 9B060395-4B 1.23"0.00 74 20 18.2525 145 1.05"0.046 5.14"0.21 4.90"0.29 273"59 204"30
aBR-2 1.62"0.05 71 NA 20.1500 90 0.503"0.030 2.36"0.13 4.70"0.39 240"53 163"23aBR-3 1.99"0.04 70 NA 20.8600 96 0.370"0.023 1.50"0.10 4.06"0.38 319"73 178"26
a060395-3 2.00"0.10 70 NA 15.5281 91 0.446"0.045 1.88"0.12 4.22"0.50 396"100 232"34060395-2 2.11"0.00 69 25 20.0128 372 0.932"0.038 3.68"0.15 3.95"0.23 1150"350 636"110
Site 15A082895-4AB 0.00"0.00 NA 20 11.1183 207 14.8"0.57 68.1"2.5 4.61"0.24 604"146 514"97082895-4CD 0.00"0.00 NA 20 13.2058 138 12.5"0.49 63.3"2.7 5.07"0.29 500"120 468"87082895-3A 1.16"0.06 73 8 16.3345 129 3.50"0.14 17.4"0.62 4.98"0.27 709"180 589"100082895-3B 1.16"0.06 73 8 13.7538 121 3.68"0.15 23.1"1.9 6.28"0.57 753"190 890"210082895-2A 1.60"0.10 71 8 14.7648 258 2.14"0.092 9.89"0.42 4.62"0.28 894"240 647"120082895-2B 1.60"0.10 71 8 12.6222 180 2.17"0.096 11.5"0.97 5.30"0.51 907"250 805"180
aSample amalgamated from quartz sand.
youngest Bull Lake-age glacial advances dated byŽ .Phillips et al. 1997 . This is consistent with a model
of terrace formation during periods of maximumglacial extent in the adjacent mountain ranges. The
age places WR-3 formation in late isotope stage 6 orŽ .early stage 5 Fig. 8; Imbrie et al., 1984 , but the
errors associated with the technique do not allow any10 Žfurther discrimination than this. Our Be dates 102
Table 3Estimated CRN surface concentration and CRN inheritance and terrace ages corrected for inheritance
Terrace Site Normalized N Normalized N Inheritance-correctedsurf inanumber Ž . Ž . Ž .armg quartz armg quartz model age ka
10 26 10 26 10 26Be Al Be Al Be Al
0A 0"0 0"0 0.091 0.47 0"0 0"0bWR-3 3A 0.58"0.003 4.0"0.17 0.043"0.002 0.15"0.12 102"10 121"13
Ž .3B c 0.77"0.077 4.5"0.45 0.099"0.026 0.40"0.28 137"22 108"44Ž .3B s 0.62"0.062 3.6"0.362 0.024"0.009 0.08"0.23 109"39 174"69
3C 0.67"0.24 3.6"0.07 0.045"0.091 0.45"0.03 119"45 108"113D )0.36"0.036 )2.2"0.216 -0.153"0.057 -1.05"0.34 )64"8.7 )78"133E 0.70"0.28 3.8"1.5 0.170"0.096 0.84"0.53 124"53 115"46WR-3 Mean 0.67"0.13 3.90"0.51 118"33 125"37
dWR-7 7A 1.62"0.05 9.1"0.142 NA NA 298"34 300"527B 0.77"0.036 5.2"0.205 NA NA 137"16 161"17
cWR-9 9A 11.5"1.145 35.2"3.52 0.288"0.163 1.91"0.38 5200"4600 NAŽ .9B c 1.13"0.113 5.45"0.545 0.150"0.08 0.65"0.30 204"24 169"13Ž .9B s 0.48"0.048 3.65"0.365 0.086"0.01 0.27"0.04 85"12 110"9.0
WR-15c 15A 2.64"0.264 12.29"1.229 0.230"0.13 1.90"0.57 511"37 431"29
c,s denote cobble or sand sample, respectively.a Inheritance concentration errors do not take into account the number of clasts amalgamated, and, therefore, errors are likely larger thanreported.b Ž .N and N determined by linear regression of Eq. 3 .surf inc Ž .Age and N determined by linear regression of Eq. 2 ; age errors do not include rate of production and analytical errors.indAges are not corrected for inheritance.

( )G.S. Hancock et al.rGeomorphology 27 1999 41–6054
Ž10 26 .Fig. 7. Normalized CRN sample concentrations vs. normalized depth in the terrace Be shown with boxes, Al with squares and bestfitting CRN profiles determined by linear regression for sites 3A, 3C, 3E, 9B, and 15A. Error bars are plotted for the concentration of CRN,
Ž .and the depth range over which each sample is collected. Concentrations of CRN x-axis are normalized to sea-level, high latitude.Ž . )Normalized depth y-axis is obtained by dividing the depth of the sample by the production length scale, z . The gray boxes show the
Ž10 26 .thickness of the silt layer, below which lie intact gravels. Exposure ages and mean inheritance Be dashed line, Al solid calculated fromŽ .profile fits are shown. We use Nishiizumi et al. 1996 rates of CRN production to determine ages. The concentrations of CRN in surface
clasts for sites 3C and 3E are lower than predicted by extrapolating the exponential profile to the surface; these surface samples are not usedin the profile fits. The anomalous concentrations may reflect exposure to a mean rate of CRN production less than the current surface rate,perhaps because of turbation or deflation of the silt layer.
( )G.S. Hancock et al.rGeomorphology 27 1999 41–60 55
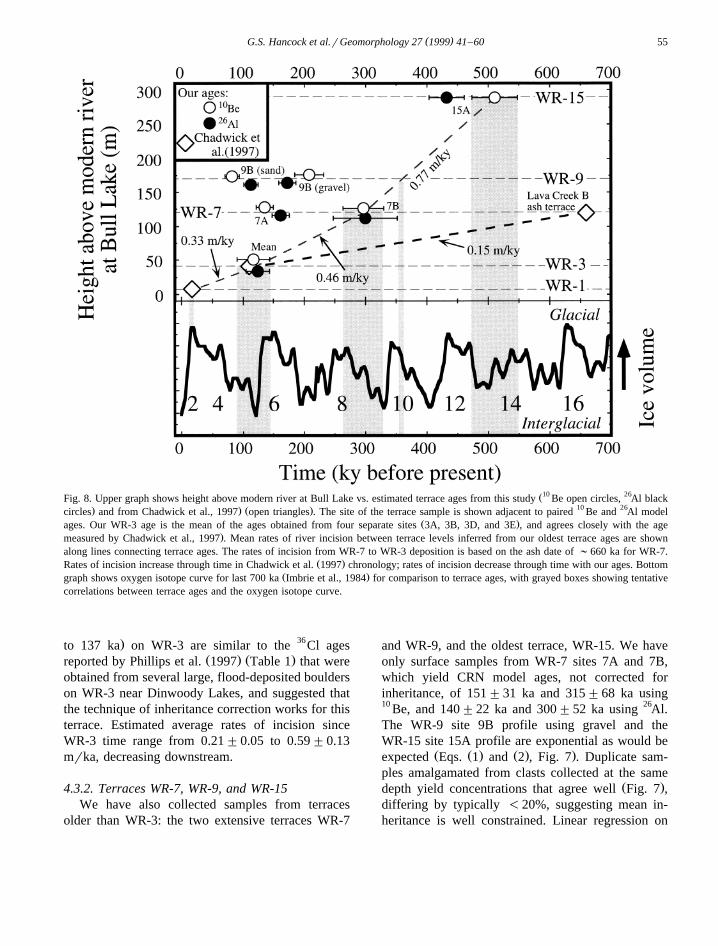
Ž10 26Fig. 8. Upper graph shows height above modern river at Bull Lake vs. estimated terrace ages from this study Be open circles, Al black. . Ž . 10 26circles and from Chadwick et al., 1997 open triangles . The site of the terrace sample is shown adjacent to paired Be and Al model
Ž .ages. Our WR-3 age is the mean of the ages obtained from four separate sites 3A, 3B, 3D, and 3E , and agrees closely with the age.measured by Chadwick et al., 1997 . Mean rates of river incision between terrace levels inferred from our oldest terrace ages are shown
along lines connecting terrace ages. The rates of incision from WR-7 to WR-3 deposition is based on the ash date of ;660 ka for WR-7.Ž .Rates of incision increase through time in Chadwick et al. 1997 chronology; rates of incision decrease through time with our ages. Bottom
Ž .graph shows oxygen isotope curve for last 700 ka Imbrie et al., 1984 for comparison to terrace ages, with grayed boxes showing tentativecorrelations between terrace ages and the oxygen isotope curve.
. 36to 137 ka on WR-3 are similar to the Cl agesŽ . Ž .reported by Phillips et al. 1997 Table 1 that were
obtained from several large, flood-deposited boulderson WR-3 near Dinwoody Lakes, and suggested thatthe technique of inheritance correction works for thisterrace. Estimated average rates of incision sinceWR-3 time range from 0.21"0.05 to 0.59"0.13mrka, decreasing downstream.
4.3.2. Terraces WR-7, WR-9, and WR-15We have also collected samples from terraces
older than WR-3: the two extensive terraces WR-7
and WR-9, and the oldest terrace, WR-15. We haveonly surface samples from WR-7 sites 7A and 7B,which yield CRN model ages, not corrected forinheritance, of 151"31 ka and 315"68 ka using10 Be, and 140"22 ka and 300"52 ka using 26Al.The WR-9 site 9B profile using gravel and theWR-15 site 15A profile are exponential as would be
Ž Ž . Ž . .expected Eqs. 1 and 2 , Fig. 7 . Duplicate sam-ples amalgamated from clasts collected at the same
Ž .depth yield concentrations that agree well Fig. 7 ,differing by typically -20%, suggesting mean in-heritance is well constrained. Linear regression on

( )G.S. Hancock et al.rGeomorphology 27 1999 41–6056
profiles from WR-9 site 9B cobbles yields modelages of 204"24 ka using 10 Be and 170"13 kausing 26Al, WR-9 site 9B sands 84"12 ka using10 Be and 112"9.0 ka using 26Al, and from WR-15site 15A 509"37 ka using 10 Be and 431"29 ka
26 Ž .using Al Table 3; Fig. 8 . WR-9 site 9A givesCRN ages that are quite old but with large errorsŽ .Table 3 ; we do not yet have a reasonable explana-tion for this, and we, therefore, neglect discussion ofthis anomaly. The errors on these ages are regressionerrors, and do not include rate of production oranalytical errors. Except for the 9A site, all of theseCRN model ages underpredict the previous age esti-
Žmates for these terraces by G;50% Table 1;.Chadwick et al., 1997 . Several possible reasons for
Ž .this include: 1 the terrace surfaces have in the pastŽ .been mantled by material e.g., loess that has since
Ž .been stripped off, the most likely scenario; and 2the new CRN ages are correct, and require revisionof the old chronology.
We first consider the possibility that the terraceshave been mantled, on average, by more loess sincedeposition than is currently present. If this is thecase, the mean rates of production that the sampleshave experienced are lower than we would estimateon the basis of the current depth and lead to the lowage estimates. The likelihood of eolian deflation anderosion of depositional surfaces through time in theWind River basin is well-supported by studies on
Ž .soil profiles Chadwick et al., 1994; Dahms, 1994 ,although the history or magnitude of the erosion ofthe surface is not easily constrained. Assuming that
Ž .the terrace ages of Chadwick et al. 1997 are correctbased upon the dating of ash, we can quantitativelyestimate the mean thickness of loess cover sinceterrace deposition needed to make the concentrationsof CRN match those ages. Assuming the terracedeposits were covered by a silt with a z ) of ;100cm, the mean thicknesses of silt required are ;0.6–0.8 m for site 7A and ;1.1–1.4 m for site 7B toproduce an age of ;660 ka, ;1.3 m for site 9B tomatch an age of ;940 ka, and ;0.72–0.99 m forsite 15A to match an age of ;1740 ka. Given thepresent thicknesses of silt of ;30–40 cm on theterraces, terrace deflation is a reasonable explanationfor the discrepancies between our ages and those of
Ž .Chadwick et al. 1997 . The CRN profiles provide ameans of estimating the magnitude of past silt cover,
which would be difficult to constrain in any otherway. As a cautionary note, an exponential CRNprofile will be produced regardless of the history ofthe terrace surface above the samples; therefore, anexponential CRN profile cannot be used as evidencefor a lack of surface change. Only the independentage control for the Wind River terraces, based pri-marily on the ;660 ka ash date for WR-7, lead tothe consideration of surface deflation as a possiblecomplexity. The reliability of this ash date for WR-7indicates terrace deflation may be the best interpreta-tion for the wide discrepancy between our CRN agesand the existing chronology.
Another possible interpretation, although lessplausible, is that our oldest CRN ages for WR-7 andWR-15 are correct, and previous age estimates needrevision. Our WR-9 age is stratigraphically impossi-ble given the ages for the other terraces; we, there-fore, ignore it here. Several pieces of evidence maysupport revision, although none are conclusive. The
Ž .existing terrace chronology of Chadwick et al. 1997for terraces older than WR-3 relies entirely on two
Ž . Ž .dates: 1 the CRN date for WR-3, and 2 the ashdate for WR-7. These two ages imply an increase inthe mean rates of incision in the Wind River from0.15 mrka between WR-7 and WR-3 to 0.40 mrkafrom WR-3 to the present river. This accelerationwould have to occur despite a ;20–25% decrease
Žin the mean slope of the river during that time Fig.. 103 . If instead we use the Be ages for sites 7A and
15A, the mean rate of incision at Bull Lake de-creases from 0.77 mrka between WR-15 and WR-7,to 0.46 mrka between WR-7 and WR-3, to 0.33mrka WR-3 to WR-1, indicating a monotonic de-crease in the rate of incision through time.
We also consider our ages relative to the glacialchronology. The model age of site 7A of ;300 kais consistent with CRN model ages of )236 kaŽ . ŽEvenson et al., 1994 and )232 ka Phillips et al.,
.1997 obtained on moraines that appear to be strati-graphically correlated with the WR-7 terrace. If weassume that the terraces form during local glacialmaxima coincident with periods of maximum vol-ume of global ice, our terrace ages for site 7A and15A can be roughly associated with global ice max-ima in isotope stages 8 and 12 or 14, respectivelyŽ .Fig. 8 ; assuming a constant rate of river incisionbetween these two terraces, WR-9 may be associated
( )G.S. Hancock et al.rGeomorphology 27 1999 41–60 57
with isotope stage 10. This contrasts with the correla-tion of isotope stage where WR-7 is taken to be;660 ka, which requires that the poorly preserved
Ž .terraces WR-4 through WR-6 Chadwick et al., 1997record the fluvial response to glaciation between;200 ka to ;600 ka. These correlations must beconsidered tenuous, because the uncertainties in theseages are large.
To accept this revision, we must reject thetephrochronology age for WR-7, and the other re-gional observations of rates of river incision acceler-
Ž .ating toward the present e.g., Reheis et al., 1991 .Whereas the tephra has been well-dated, it may havebeen reworked from older terraces or deposits andincorporated into WR-7, making the tephra age amaximum for the terrace. The evidence for increas-ing rates of incision is harder to reconcile with ourchronology, because even the Bighorn River, intowhich the Wind River flows, apparently follows this
Ž .pattern Palmquist, 1983 . We, therefore, considerour ages for terraces WR-7 through WR-15 to beminima, given the likelihood of eolian erosion of thesurfaces, the tephrochronology age, and the regionalrate of incision increases through time. Our WR-3ages appear reasonable, however, because they agreewith independent dating efforts and are consistent forthe four sample localities. Our work on the olderterraces illustrates the continuing difficulty of pre-cisely dating depositional surfaces older than a few100 ka with CRN, because of the uncertainties in thegeologic history of the surfaces and the large errorsarising from calibrations of the rate of production,which are inherent in dating surfaces with CRNs.Although apparently reasonable ages may be ob-
tained from CRN profiles or surface samples, datingby other, independent methods and collection ofCRN profiles from many sites on a surface areneeded to check the validity of these ages.
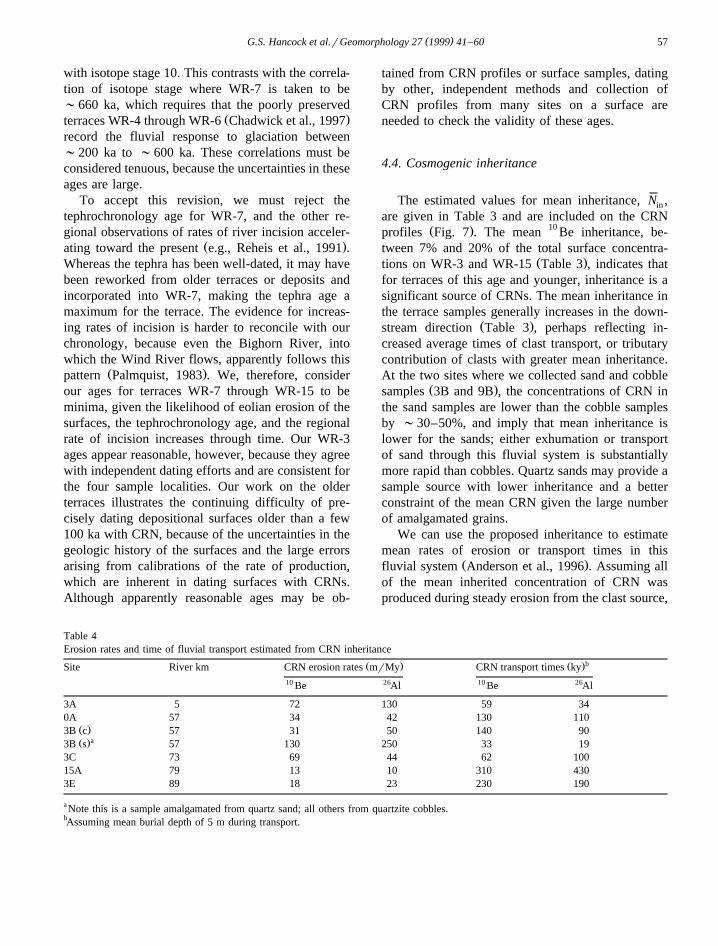
4.4. Cosmogenic inheritance
The estimated values for mean inheritance, N ,in
are given in Table 3 and are included on the CRNŽ . 10profiles Fig. 7 . The mean Be inheritance, be-
tween 7% and 20% of the total surface concentra-Ž .tions on WR-3 and WR-15 Table 3 , indicates that
for terraces of this age and younger, inheritance is asignificant source of CRNs. The mean inheritance inthe terrace samples generally increases in the down-
Ž .stream direction Table 3 , perhaps reflecting in-creased average times of clast transport, or tributarycontribution of clasts with greater mean inheritance.At the two sites where we collected sand and cobble
Ž .samples 3B and 9B , the concentrations of CRN inthe sand samples are lower than the cobble samplesby ;30–50%, and imply that mean inheritance islower for the sands; either exhumation or transportof sand through this fluvial system is substantiallymore rapid than cobbles. Quartz sands may provide asample source with lower inheritance and a betterconstraint of the mean CRN given the large numberof amalgamated grains.
We can use the proposed inheritance to estimatemean rates of erosion or transport times in this
Ž .fluvial system Anderson et al., 1996 . Assuming allof the mean inherited concentration of CRN wasproduced during steady erosion from the clast source,
Table 4Erosion rates and time of fluvial transport estimated from CRN inheritance
bŽ . Ž .Site River km CRN erosion rates mrMy CRN transport times ky10 26 10 26Be Al Be Al
3A 5 72 130 59 340A 57 34 42 130 110
Ž .3B c 57 31 50 140 90aŽ .3B s 57 130 250 33 19
3C 73 69 44 62 10015A 79 13 10 310 4303E 89 18 23 230 190
a Note this is a sample amalgamated from quartz sand; all others from quartzite cobbles.bAssuming mean burial depth of 5 m during transport.

( )G.S. Hancock et al.rGeomorphology 27 1999 41–6058
the average rate of exhumation, for the amalgamatedsamples is:
P z )
0)´s yl z . 4Ž .˙
Nin
The calculated mean rates of erosion are given inTable 4. Alternatively, we can assume all of theconcentration of CRN, accumulated during the trans-port of the material from the source rock to thesample location. Ignoring decay, the mean concentra-tion of a radionuclide accumulated during transport,N , can be expressed:trans
y Hrz )Ž .1yeN sN sP T 5Ž .trans in 0
)½ 5Hrz
where T is the mean total time in transit from sourceŽ .to deposit including burial and transport and H is
the mean depth of the clast during transit, which wemust estimate. In the Wind River system, the thick-ness of terrace gravels ranges from a few to ;25 mŽ .Chadwick et al., 1994 ; we have chosen an Hs5m for estimating the mean travel times given inTable 4. This choice for H is arbitrary, looselyconstrained to lie between a minimum depth of 0 mŽi.e., transport is accomplished only across the sur-
.face of the bed and a maximum of ;25 m, whichis approximately the maximum depth of gravel mea-sured on the terraces and in the modern river WindRiver system.
The estimated mean rates of erosion range fromŽ .13 to 130 mrMa Table 4 . These values are at the
upper end to several times higher than previous CRNmeasurements of the rates of rock erosion in the
Ž .Wind River Range ;10 mrMa, Small et al., 1997Ž .and elsewhere ;-30 mrMa, Bierman, 1994 .
These measurements, however, were made on slowlyeroding, bare-bedrock surfaces. On the other hand,our rates are quite similar to estimates of the meanrates of erosion obtained from sediment budgets in
Ž .the basin Ahnert, 1970 . Assuming all of the arisesduring transport, the mean travel times generallyincrease in the downstream direction, and range from;60–310 ka assuming a mean depth of transport of
Ž .5 m Table 4 . The estimated travel time is highlyŽ .sensitive to the value chosen for H in Eq. 5 , but
even choosing Hs0 m gives mean travel timesexceeding a few thousand years, which suggests that
the clasts might remain in fluvial transport and stor-age for significant periods of time.
5. Conclusions
The multiple-sample, CRN profile technique isneeded and apparently reliable for obtaining ages ondepositional surfaces younger than ;150 ka in theWind River basin. The measured CRN inheritancerepresents a significant fraction of the total CRN
Ž .abundance up to ;20% of surface concentrations ,and is highly variable; inheritance must, therefore, beconstrained to obtain reasonable model ages. Analy-sis of the modern river sample results indicates that
Ž .amalgamation of many clasts )30 are needed toŽ .obtain reasonable -"20% estimates of the mean
inheritance in this system. Our CRN profiles on theWR-3 terrace produce ages that are significantlycorrected for inheritance, are consistent over foursample sites, agree with independent estimates ofage, and highlight problems with the CRN historiesof surface clasts. Based on the WR-3 results, weconclude that our CRN profile technique is a reliablemethod for dating with inheritance correction, de-spite the additional complexities introduced in sam-pling. Difficulty in dating the older terraces, how-ever, emphasizes that considerable geologic caution,independent estimates of age, and multiple samplesites should ideally be part of dating depositionalsurfaces with CRNs.
ŽOur model ages for the WR-3 terrace mean of.four sitess;118 to 125 ka are consistent with a
model of terrace formation during periods of maxi-mum glacial extent, because they agree broadly withdates on Bull Lake-age moraines. The errors associ-ated with the CRN technique, however, precludefurther discrimination between formation duringoxygen isotope stage 5 or 6 glacial advances. Our
ŽCRN ages for the older terraces WR-7s;140 to.300 ka and WR-15s;430 to 510 ka are very
different from previous estimates, and require thatŽ .either 1 significant changes in terrace silt cover
have occurred since deposition of these terraces, orŽ .2 that the previous chronology proposed for thesesurfaces is not correct. We believe the most plausibleexplanation for the discrepancy on terraces WR-7

( )G.S. Hancock et al.rGeomorphology 27 1999 41–60 59
through WR-15 is eolian deflation of these surfaces,which leads to prediction of ages that are too young.Silt caps with mean thicknesses of ;0.5–1.5 msince deposition are required to reconcile our con-centrations of CRN with previous estimates of ter-race ages. Mean thicknesses of silt through the ter-race lifetime is a very difficult quantity to estimateby any other method, and is pertinent to studies ofpedogenesis in such deposits. Acceptance of ourCRN ages would require rejection of thetephrochronology age and the regional observationof increasing rates of river incision toward the pre-sent. We instead consider our age estimates on ter-races WR-7 through WR-15 to be minima. Thecomplications of geologic history, in addition toinherent CRN errors, suggest CRN dating of deposi-tional surfaces requires that other, independent dat-ing methods be used in conjunction with CRNs forsurfaces older than ;150 ka.
Measuring inheritance also allows rough estima-tion of maximum travel times in the fluvial systemand minimum basin erosion rates. Assuming all in-heritance comes from clast exhumation, we findminimum mean rates of exhumation of ;13–130mrMy for the quartzite source rocks in the WindRiver Range. These rates are quite reasonable whencompared to estimates of basin-wide rates of erosiondetermined using sediment budgets. Assuming in-stead that all inheritance comes from clast transport,we find the time of fluvial transport from source toterrace to be );10 ka over several 10s to 100s ofriver kilometers, with an increase in the downstreamdirection and a decrease with decreasing grain size.Whereas the numbers obtained are not unique, themeasurement of inheritance in clasts is a potentiallyuseful tool for constraining clast exhumation andrates of transport; these rates are very difficult toobtain for long time scales by any other availablemethods.
Acknowledgements
We appreciate the funding that has been providedto complete this work, which includes an IGPP-LLNLCenter for Accelerator Mass Spectrometry grant, aGeological Society of America Cole Award, and anNSF—Presidential Young Investigator Award to
RSA, and a GSA Robert Fahnestock Fluvial Geo-morphology grant and a UCSC Department of EarthSciences grant to GSD. The manuscript was greatlyimproved through reviews provided by Dr. PeterClark, Dr. Dennis Dahms, and an anonymous re-viewer. We thank Gregory Pratt, James Repka, Dr.Justin Revenaugh, Daniel Sampson, and Eric Smallfor help with field and lab work, data analysis,andror in reviewing drafts of this paper.
References
Ahnert, F., 1970. Functional relationships between denudation,relief, and uplift in large mid-latitude drainage basins. Ameri-
Ž .can Journal of Science 268 3 , 243–263.Anderson, R.S., Repka, J.L., Dick, G.S., 1996. Explicit treatment
of inheritance in dating depositional surfaces using in situ10 26 Ž .Be and Al. Geology 24 1 , 47–51.
Bierman, P.R., 1994. Using in situ produced cosmogenic isotopesto estimate rates of landscape evolution: a review from thegeomorphic perspective. Journal of Geophysical Research 99Ž .B7 , 13885–13896.
Blackwelder, E., 1915. Cenozoic history of the mountains ofcentral Wyoming. Journal of Geology, 23, pp. 97–117, 193–217, 307–340.
Brown, E.T., Brook, E.J., Raisbeck, G.M., Yiou, F., Kurz, M.D.,1992. Effective attenuation lengths of cosmic rays producing10 Be and 26Al in quartz: implications for exposure age dating.
Ž .Geophysical Research Letters 19 4 , 369–372.Cerling, T.E., Craig, H., 1994. Geomorphology and in-situ cosmo-
genic isotopes. Annual Review of Earth and Planetary Sci-ences 22, 273–317.
Chadwick, O.A., Hall, R.D., Kelly, G., Amundson, R., Gosse, J.,Phillips, F., Jaworowski, C., 1994. Quaternary Geology of the
Ž .Wind River Basin, Wyoming field trip guidebook . Friends ofthe Pleistocene, Rocky Mountain Cell.
Chadwick, O.A., Hall, R.D., Phillips, F.M., 1997. Chronology ofPleistocene glacial advances in the Central Rocky Mountains.
Ž .Geological Society of America Bulletin 109 11 , 1443–1452.Clark, D.H., Bierman, P.R., Larsen, P., 1995. Improving in situ
Ž .cosmogenic chronometers. Quaternary Research New YorkŽ .44 3 , 367–377.
Dahms, D.E., 1994. Mid-Holocene erosion of soil catenas onmoraines near the type Pinedale Till, Wind River Range,
Ž . Ž .Wyoming. Quaternary Research New York 42 1 , 41–48.Elmore, D., Phillips, F., 1987. Accelerator mass spectrometry for
measurement of long-lived radioisotopes. Science 236, 543–550.
Evenson, E.B., Klein, J., Lawn, B., Middleton, R., 1994. Glacialchronology of the Wind River Mountains from measurementsof cosmogenic radionuclides in boulders. Geological Societyof America Abstracts with Programs 26, 511.
Finkel, R.C., Suter, M., 1993. AMS in the Earth Sciences: tech-nique and applications. Advances in Analytical Chemistry 1,1–114.

( )G.S. Hancock et al.rGeomorphology 27 1999 41–6060
Forman, S.L., Smith, R.P., Hackett, W.R., Tullis, J.A., McDaniel,P.A., 1993. Timing of late Quaternary glaciations in theWestern United States based on the age of loess on the eastern
Ž .Snake River plain, Idaho. Quaternary Research New York 40Ž .1 , 30–37.
Gosse, J.C., Klein, J., Evenson, E.B., Lawn, B., Middleton, R.,1995. Beryllium-10 dating of the duration and retreat of the
Ž .last Pinedale glacial sequence. Science 268 5215 , 1329–1333.Hall, R.D., Shroba, R.R., 1993. Soils developed in the glacial
deposits of the type areas of the Pinedale and Bull Lakeglaciations, Wind River Range, Wyoming, USA. Arctic and
Ž .Alpine Research 25 4 , 368–373.Hall, R.D., Shroba, R.R., 1995. Soil evidence for a glaciation
intermediate between the Bull Lake and Pinedale glaciations atFremont Lake, Wind River Range, Wyoming, USA. Arctic
Ž .and Alpine Research 27 1 , 89–98.Howard, A.D., 1970. A study of process and history in desert
landforms near the Henry mountains, Utah. Doctoral thesis,The Johns Hopkins University.
Imbrie, J.D., Hays, D.G., Martinson, D.G., McIntyre, A.C., Mix,A.C., Morley, J.J., Pisias, N.G., Prell, W.L., Shackleton, N.J.,1984. The orbital theory of Pleistocene climate: support from arevised chronology of the d18O record. In: Berger, A., Imbrie,
Ž .J., Hays, J., Kukla, G., Saltzman, B. Eds. , Milankovitch andClimate: Understanding the Response to Astronomical Forc-ing, Part 1. Reidel, Bingham, MA, pp. 269–305.
Jaworowski, C., 1992. A probable new Lava Creek ash locality:implications for Quaternary geologic studies in the westernWind River basin, Wyoming, USA. Contributions to Geology,
Ž .University of Wyoming 29 2 , 111–117.Kohl, C.P., Nishiizumi, K., 1992. Chemical isolation of quartz for
measurement of in-situ-produced cosmogenic nuclides.Geochimica et Cosmochimica Acta 56, 3583–3587.
Lal, D., 1991. Cosmic ray labeling of erosion surfaces: in situnuclide production rates and erosion models. Earth and Plane-tary Science Letters 104, 424–439.
Love, J.D., 1979. Summary of Late Cenozoic history of the WindRiver Basin and adjacent uplands in Wyoming. US GeologicalSurvey Professional Paper, 1150, 75 pp.
Morris, D.A., Hackett, O.M., Vanlier, K.E., Moulder, E.A., 1959.Groundwater Resources of Riverton Irrigation Project,Wyoming. US Geological Survey Water-Supply Paper, 1375,205 pp.
Nishiizumi, K., Winterer, E.L., Kohl, C.P., Klein, J., Middleton,R., Lal, D., Arnold, J.R., 1989. Cosmic ray production rates of10 Be and 26Al in quartz from glacially polished rocks. Journal
Ž .of Geophysical Research 94 B12 , 17907–17915.Nishiizumi, K., Kohl, C.P., Arnold, J.R., Dorn, R.I., Klein, J.,
Fink, D., Middleton, R., Lal, D., 1993. Role of in situcosmogenic nuclides 10 Be and 26Al in the study of diversegeomorphic processes. Earth Surface Processes and Landforms18, 407–425.
Nishiizumi, K., Finkel, R.C., Klein, J., Kohl, C.P., 1996. Cosmo-genic production of 7Be and 10 Be in water targets. Journal of
Ž .Geophysical Research, B, Solid Earth and Planets 101 10 ,22225–22232.
Palmquist, R.C., 1983. Terrace chronologies in the Big Horn
Basin, Wyoming. Geological Association Guidebook for the34th Annual Field Conference, pp. 217–231.
Patton, P.C., Biggar, N., Condit, C.D., Gillam, M.L., Love, D.W.,Machette, M.N., Mayer, L., Morrison, R.B., Rosholt, J.N.,1991. Quaternary geology of the Colorado Plateau. In: Morri-
Ž .son, R.B. Ed. , Quaternary Nonglacial Geology: Contermi-nous U.S. The Geological Society of America, Boulder, pp.373–406.
Phillips, F.M., Zreda, M.G., Smith, S.S., Elmore, D., Kubik,P.W., Sharma, P., 1990. Cosmogenic Chlorine-36 chronologyfor glacial deposits at Bloody Canyon, eastern Sierra Nevada.Science 248, 1529–1532.
Phillips, F.M., Zreda, M.G., Gosse, J.C., Klein, J., Evenson, E.B.,Hall, R.D., Chadwick, O.A., Sharma, P., 1997. Cosmogenic36Cl and 10 Be ages of Quaternary glacial and fluvial depositsof the Wind River Range, Wyoming. Geological Society of
Ž .America Bulletin 109 11 , 1453–1463.Pierce, K.L., Obradovich, J.D., Freidman, I., 1976. Obsidian
hydration dating and correlation of Bull Lake and Pinedaleglaciations near West Yellowstone, Montana. Geological Soci-ety of America Bulletin 87, 703–710.
Reheis, M.C., Palmquist, R.C., Agard, S.S., Jaworowski, C.,Mears, B., Jr., Madole, R.F., Nelson, A.R., Osborn, G.D.,1991. Quaternary history of some southern and central RockyMountain basins; Bighorn Basin, Green Mountain–SweetwaterRiver area, Laramie Basin, Yampa River Basin, Northwestern
Ž .Uinta Basin. In: Morrison, R.B. Ed. , Quaternary NonglacialGeology: Conterminous U.S. The Geological Society of Amer-ica, Boulder, pp. 407–440.
Repka, J.L., Anderson, R.S., Finkel, R.C., 1997. Cosmogenicdating of fluvial terraces, Fremont River, Utah. Earth andPlanetary Science Letters 152, 59–73.
Richmond, G.M., Fullerton, D.S., 1986. Summation of Quaternaryglaciations in the United States of America. In: Sibrava, V.,
Ž .Bowen D.Q., Richmond, G.M. Eds. , Quaternary Glaciationof the Northern Hemisphere. Pergamon, Oxford, pp. 183–196.
Richmond, G.M., Murphy, J.F., 1965. Geologic map of the BullLake East quadrangle, Fremont County, Wyoming. GQ-431,U.S. Geological Survey Geologic Quadrangle Map.
Ritter, D.F., 1967. Terrace development along the front of theBeartooth Mountains, southern Montana. Geological Societyof America Bulletin 78, 467–484.
Sinnock, S., 1981. Glacial moraines, terraces and pediments ofGrand Valley, western Colorado. In: Epis, R.C., Callender,
Ž .J.F. Eds. , Guidebook—New Mexico Geological Society:Western Slope, Colorado; western Colorado and eastern Utah.New Mexico Geological Society, Socorro, NM, pp. 113–120.
Small, E.E., Anderson, R.S., Repka, J.L., Finkel, R., 1997. Ero-sion rates of alpine bedrock summit surfaces deduced from insitu 10 Be and 26Al. Earth and Planetary Science Letters 150Ž .3–4 , 413–425.
Talvitie, N.A., 1951. Determination of quartz in presence ofŽ .silicates using phosphoric acid. Analytical Chemistry 23 4 ,
623–626.Vincent, K.R., Chadwick, O.A., 1994. Synthesizing bulk density
for soils with abundant rock fragments. Soil Science SocietyŽ .of America Journal 58 2 , 455–464.