dating the origins of the epidemiologic paradox among ... · showed that total infant mortality...
TRANSCRIPT
ISSN 0191-913X Texas Population Research Center Papers
1997-1998
Paper No. 97-98-07
Dating the Origins of the Epidemiologic Paradox among Mexican Americans
Myron P. Gutmann W. Parker Frisbie
Population Research Center, The University of Texas at Austin
Peter DeTurk Department of Social and Health Services, State of Washington
K. Stephen Blanchard Our Lady of the Lake University
Paper Prepared for the Annual Meeting of the Population Association of America, Washington, D.C., March 26-29, 1997
Revised version, April 1998

Dating the Epidemiologic Paradox - Page 1
Dating the Origins of the Epidemiologic Paradox among Mexican Americans1
Abstract
This paper describes the history of the epidemiologic paradox, the surprising finding that in many circumstances Mexican American infants, children, and adults have lower mortality than one would expect given their social, economic, and demographic situation. In particular, they have mortality equal to or lower than comparable non-Hispanic whites, and lower than that of comparable African Americans. The epidemiologic paradox was first revealed by Teller and Clyburn (1974), writing about the mid-1960s. Later research by Forbes and Forbes (1991) showed that in San Antonio and for some parts of the population (espe-cially neonatal infant mortality rates) the paradox has existed since at least 1940. This paper uses four data sources that cover most of the twentieth century to fur-ther examine the history of the paradox. Two of those sources -- a sample of cen-sus records from 1910 and the linked birth and death certificate file for 1990 -- show the United states at the beginning and end of the century. The two other sources are drawn from death certificates for San Antonio for 1909-11, and for 1935-85. The national sources show that most, but not all, Hispanics had lower child mortality in the early twentieth century than Blacks, but not child mortality that was lower than non-Hispanic whites. The San Antonio data nuance that story to show that Hispanics did not have lower infant mortality overall than Blacks until the 1955-64 decade, and did not have lower infant mortality overall than non-Hispanic whites until the 1965-74 decade. The conclusion to the paper dis-cusses local political and social conditions in San Antonio in the 1920s and 1930s that led to improved public health resources being dedicated to the African American population, which led to the reduction in the infant death rates.
In 1974 Teller and Clyburn published a study of infant mortality in Texas in the mid-1960s that reported a totally unanticipated finding (Teller and Clyburn, 1974). Because published vital statistics at that time did not report either rates or events by Hispanic iden-tity, their work was based on special vital statistics tabulations. The surprising result was
1 Contact: Professor Myron P. Gutmann, Population Research Center, The University of Texas at Austin, Austin, Texas, 78712. Telephone: 512-471-8358. Fax: 512-471-4886. Email: [email protected]. The research reported in this paper has been supported by Grants No. 5 R01 HD32325 and 5 R01 HD32330 from the National Institute of Child Health and Human Development. An earlier version of this paper was presented at the 1997 Annual Meeting of the Population Association of America, Washington D.C., March, 1997. A number of individuals at the Texas Bureau of Vital Statistics and the San Antonio Metropolitan Health District have cooperated in our effort to gather data for Bexar County for 1909-1911 and 1919-1921. We would like to thank Tom Pollard, at the Bureau of Vital Statistics, and Fernando Guerra and Fernando Flores at the Metropolitan Health District. We are grateful to Starling G. Pullum for her assistance in preparing some of the data used in this paper.

Dating the Epidemiologic Paradox - Page 2
the recognition that in Texas ca. 1964, the infant mortality rate of the Spanish surname population was only slightly higher than that of the corresponding non-Hispanic white population.2 The similarity between the infant mortality rates of Hispanics and non-His-panic whites that Teller and Clyburn revealed was part of a process of convergence between the two groups; the 1972 vital statistics data showed that the two groups were even closer. In that year, the Spanish surname neonatal mortality rate was actually slightly lower than that of non-Hispanic whites (Teller and Clyburn, 1974).
This surprising finding has come to be called the epidemiologic paradox, because the story it tells is one where a specific social group – Mexican immigrants and Americans of Mexican origin – experience mortality in part of the population at a rate that is paradoxi-cally low. Their experience is especially interesting because Mexican Americans are a group with relatively low incomes and relatively low socio-economic status. As a result they lack many of the characteristics and experiences that should ensure good health for their children in the late twentieth century U.S. The advantage experienced by Mexican immigrants and Mexican Americans holds in recent years relative both to non-Hispanic whites and to African Americans.
In this paper we want to describe the history of the epidemiologic paradox, and try to reveal when it began. Part of that story is already fairly well known, based on work that some of us have reported elsewhere. Forbes and Frisbie (1991) have examined detailed data for Bexar County, Texas (San Antonio), beginning in 1935. Based on those data, they showed that total infant mortality rates for the groups they call “Anglo” and “Spanish Sur-name” have been relatively close since the 1960s, and that neonatal infant mortality rates for the two groups have been similar since at least 1940. Our goal is to extend the analysis further back in time than they were able to do, and to add to their analysis an examination of the timing of the change in infant mortality differences between the Mexican origin population and the African American population.
Our analysis is based on bringing together four quite different sources of data, and us-ing them despite those differences to tell a coherent story. Two sources of data are national or near-national in scope. The other two sources of data pertain only to Bexar County, Texas.
We establish a near-national baseline for Hispanic child mortality at the beginning of the century by using a sample of Hispanic-headed households (and non-Hispanics living nearby) identified in the 1910 U.S. Census of Population (Gutmann, Frisbie, and Blanchard, 1999, forthcoming). Because the 1910 census of population enumerated the number of children ever born and surviving to currently-married women, we can follow procedures developed by Preston and Haines (1991) to estimate child mortality levels in this population (Gutmann, et al, 1996).
2 The term "Mexican origin" refers to white U.S.-born Mexican Americans and Mexican immigrants. Since virtually all Mexican origin infants are Mexican Americans born in the U.S., these terms are used interchangeably here. "Anglo" refers to whites of non-Hispanic origin, and "black" or "African American" refers to blacks of non-Hispanic origin

Dating the Epidemiologic Paradox - Page 3
In order to get a national baseline in the late twentieth century we use the linked birth and infant death files produced by the National Center for Health Statistics. We use these files to compare the Mexican origin population with non-Hispanic whites and with African Americans throughout the United States.
There are few high quality data that allow us to understand the process of change that may have taken place between these national baseline data from the beginning and end of the twentieth century. In order to understand those potential changes we turn to data that we have collected for Bexar County, Texas. First, we use the data collected by Frisbie and Bradshaw for births and deaths in Bexar County between 1935 and 1985 (Forbes and Fris-bie, 1991: 642). We supplement those data with new data that we have collected from the San Antonio vital statistics for 1909-1911.3 For those years we have collected and tabulated death certificates, and calculated age specific death rates for infants and children. The Bexar county data allow us to say something about the timing of the epidemiologic paradox as it applies both to the Mexican origin population and non-Hispanic whites, and to the Mexican origin population and African Americans.
We will describe all these sources – as well as the different measures of mortality they produce – in somewhat greater detail below. Before we do that we will say more about the broader question of the epidemiologic paradox. After we review the literature, we will turn to sources and methods, to a description of our results, and finally to a narrative of the history of the epidemiologic paradox. The Nature and History of the Epidemiological Paradox
Surprisingly, for approximately a decade following Teller and Clyburn’s early discov-ery, the issue of Hispanic birth outcomes was largely ignored as a topic for empirical re-search, perhaps because the observation of relatively low levels of infant mortality seemed so anomalous. From the mid-1980s onward, however, a rapidly growing literature has repeatedly shown that Mexican Americans enjoy favorable pregnancy outcomes, despite the fact that Mexican Americans are characterized by a high risk profile, including early average age at first marriage and first childbearing, higher parities, less adequate prenatal care, and low socioeconomic status (Becerra et al., 1991; Cramer, 1987; Eberstein et al., 1987; Eberstein et al., 1990; Forbes and Frisbie, 1991, 1993; Frisbie et al., 1992; Frisbie et al., 1998; Hummer et al., 1992; Moss and Carver, 1992; Powell-Griner, 1988; Powell- 3 We have also collected data for 1919-1921. We do not report those results here because we do not yet have adequate data about the age and sex distribution of Bexar County by race and Mexican origin status for that time period. The preliminary 1920 public use micro sample of the U.S. Census of Population that is available at this time represents a one percent sample of one-half of the reels of microfilm on which the 1920 Census manuscripts have been stored. In our analysis of the data available from this source for Bexar county we have discovered that the sample as it exists now does not adequately represent the Mexican origin population in San Antonio in 1920. This is probably because the highly concentrated Mexican population from the west side of San Antonio is enumerated on pages that are on a reel of microfilm not yet sampled.
Dating the Epidemiologic Paradox - Page 4
Griner and Streck, 1982; Rogers, 1984; 1989; Schick and Schick, 1991; Selby et al., 1984; U.S. NCHS, 1990; Williams et al., 1986). Although blacks in many respects are the most disadvantaged of U.S. minority populations and experience adverse pregnancy outcomes at about twice the rate of Mexican Americans and non-Hispanic whites, recent research demonstrates that Mexican Americans have lower average levels of education than African Americans, and are less likely to receive adequate prenatal care or to have medical insurance to defray costs of delivery than are African Americans (Bean and Tienda, 1987; Frisbie et al., 1997).
Researchers are still striving to study all the possible elements that could explain why the Mexican American population does not have higher infant mortality, given the popula-tion’s poor economic circumstances and exposure to mortality risks. In understanding that problem, under-registration seems to constitute only a very minor portion of the explanation for relatively positive Mexican American infant mortality rates, primarily because of the infrequency of occurrence of the sequence of events required to produce more than negligible bias (see Forbes and Frisbie, 1991 for a summary; see also Cramer, 1987; Scribner and Dwyer, 1985; Williams et al., 1986). Perhaps the most promising explanation to emerge is the finding that women of Mexican origin are characterized by a more healthful lifestyle that buffers or offsets disadvantaged socio-demographic conditions For example, Mexican origin women smoke less, consume less alcohol, and have more nutritious diets than do non-Hispanic white women (Guendelman and Abrams, 1995; Rogers and Crank, 1988; Rumbaut and Weeks, 1991).
Although Mexican origin infant mortality was the outcome that first attracted attention, the paradox of a high risk socio-demographic profile coupled with relatively low mortality risk also pertains to ages beyond infancy. Age-specific mortality rates among adults are now similar for the non-Hispanic white and Mexican origin populations, while the risk of death for African Americans is greater. Both the mortality risk of adult immigrants from Mexico and the pregnancy outcomes of Mexican immigrant and less acculturated Mexican American women tend to be more favorable than those of their U.S.-born counterparts (Bradshaw and Frisbie, 1986; Rumbaut and Weeks, 1991; Scribner and Dwyer, 1989; Scribner, 1996). This suggests a cultural basis for the observed behavioral differentials that may be partially captured by nativity, though selectivity of immigration remains a viable hypothesis.
When we turn to the longer-term experience of Mexican Americans, we see that little research has examined infant or child mortality trends among Mexican Americans. One primary reason is that, until recently, data were simply not available to allow longitudinal analyses. Hispanic identifiers were not available in the vital statistics until circa 1980, and between 1980 and 1989, items about Hispanic ethnicity on birth and death records were included on the birth certificates of only 23 states and the District of Columbia (Schick and Schick, 1991). However, some knowledge of historical trends has been generated by re-searchers who have made use of local or state vital records that allow use of Spanish sur-name as an Hispanic identifier (Forbes and Frisbie, 1991) or recently available census data from the early decades of the twentieth century (Gutmann and Fliess, 1996; Gutmann et al.,

Dating the Epidemiologic Paradox - Page 5
1996). From such analyses, a useful, but clearly incomplete, account of the mortality tran-sition experienced by the Mexican origin population has begun to emerge.
From the application of child mortality ratios (see e.g., Preston, Ewbank, and Here-ward, 1994), to census data for 1900 and 1910 (which provide information on children surviving, as well as on children ever born), we know that mortality levels of Mexican origin children were quite high relative to all groups except African Americans at each point in time. Using a new sample of Hispanics in the U.S. for 1910 that contains over 70,000 persons of Hispanic origin, Gutmann, Frisbie, and Blanchard (1999, forthcoming) report that Hispanics were characterized by higher child mortality as compared to non-Hispanic whites, and by lower child mortality as compared to non-Hispanic blacks. However, levels of Hispanic child mortality varied substantially by region, urban/rural residence, and nativity. For example, in 1910, the risk of Hispanic child mortality was much higher in New Mexico than in other states where this population existed in substantial numbers. In general, the children of immigrant women were at greater risk, but significant interaction effects involving area of residence and nativity of mother were evident.
The historical transition of Mexican American infant mortality has also been examined based on a unique data set derived from official vital statistics, which includes deaths of both adults and children and a linked set of birth/infant death records, for Bexar County (San Antonio), Texas over a half-century. During the early portion of this time interval (1935-1945), Mexican American infant mortality rates “not only were extremely high (often averaging more than 100 deaths per 1,000 live births), but also were roughly twice as great as those experienced by Anglos” (Forbes and Frisbie, 1991: 643). Beginning in the immediate post-World War II period, very rapid convergence in Mexican American and Anglo infant mortality occurred, largely due to the trend in exogenous causes of death. Other findings of note are that (1) the relative contribution of exogenous and endogenous causes of Mexican American infant mortality shifted dramatically over time (Forbes and Frisbie, 1991), largely because of major improvements in sanitation and housing in San Antonio in the 1940s and 1950s (Blanchard, 1996), (2) all of the decline in infant mortality over time was due to a decrease in weight-specific risk (and none to change in birth weight composition) as compared to Anglos among whom 20-25 percent of the decline occurred due to compositional change, and (3) in the San Antonio data at least, similar infant mortal-ity rates result partly from the fact that commonly identified negative risk factors have a smaller impact, while positive factors have a larger effect, among Mexican Americans, as compared to Anglos (Forbes and Frisbie, 1991; Frisbie et al., 1992; Frisbie, 1994). Sources Of Data And The Methods Used With Each Source
In this Section of our paper we describe the four bodies of data that we have used to narrate the story of the epidemiologic paradox. In doing so we also highlight the kinds of analysis that each source can support.

Dating the Epidemiologic Paradox - Page 6
The Hispanic Oversample of the 1910 U.S. Census of Population
Until recently data have not existed that would permit a detailed study of Hispanic child mortality in a historical context. The already existing and widely used public use sample of the 1910 U.S. Census of Population is a one-in-250 sample drawn randomly from the entire United States (Strong, et al, 1989). It includes about 3,000 Hispanics, a fair representation of the roughly 845,000 who lived in the U.S. at that time (Gutmann, Frisbie and Blanchard, 1999, forthcoming). That small sample, however representative, is not large enough to permit the study of child mortality using the methods we employ, and it is certainly not large enough to explore the variations in child mortality experienced within the Hispanic population.
In order to study Hispanic child mortality in detail we have constructed a new sample of Hispanics in the U.S. in 1910 (Gutmann, et al. 1998; Gutmann, Frisbie, and Blanchard, 1999, forthcoming). This sample, designed both to stand independently and be merged with the existing 1910 Public Use Sample, includes data about 69,000 persons who lived in Hispanic-headed households, plus another 26,000 of their neighbors, who lived in 57 counties in six states: California, Arizona, New Mexico, Kansas, Texas, and Florida.4 This new data source contains information about 7,895 currently married Hispanic women and 2,643 currently married non-Hispanic women in 1910 whose child mortality experience can be studied. This is a considerable number, especially when we note that the national PUMS for 1910 only includes 42,654 such women from all race and ethnic groups combined.
The data available in the 1910 census manuscripts about children ever born, children surviving, plus woman’s age, marital status, and duration of marriage, allow us to estimate levels of child mortality in the population. Perhaps more importantly, these data permit us to measure differentials between groups within the population. The method we employ makes use of an index of child mortality that can be computed for individual women and for groups of women based on the data recorded in the census. In their study of childhood mortality for members of immigrant groups in 1910, Preston, Ewbank, and Hereward (1994, p. 41) present this succinct description of the computation of the index:
The index is the ratio of cumulative child deaths that a woman has experienced (i.e., the difference between her numbers of children born and surviving) to her expected number of child deaths. The expected number of deaths is calculated by multiplying her number of children-ever-born by an expected proportion dead. The expected proportion dead is based in turn on an estimate of the length of her children’s exposure to the risk of mortality, combined with a “West” model life table, level 13.73.
4 The data will be made available as part of the Integrated Public Use Microdata Series (IPUMS) from the University of Minnesota (Ruggles and Sobek, 1995; Ruggles and Menard, 1995; Gutmann et al 1998). Details about the IPUMS can be found on the World Wide Web at http://www.ipums.umn.edu/

Dating the Epidemiologic Paradox - Page 7
Our approach is the same as that used by these authors, except that we have scaled our expected proportion dead to a “West” model life table of 13.5 years, male and female com-bined, and we have used a more restricted group of women for our computation. A “West” model life table of this level (13.5) has an expectation of life at birth of 49.74 years. It rep-resents mortality that is slightly higher than in the life table used by Preston, Ewbank and Hereward for their analysis. The analytic results are the same, because the index values are proportional. In general, at the levels of fertility and mortality prevalent in the U.S. in the early twentieth century, the Child Mortality Index refers to children born during a sixteen-year period prior to the census, with the average child born eight years prior to the census. Thus, the child mortality indexes we use for the Hispanic Oversample population refer to a population of children born between 1894 and 1910, with the average child born in 1902.
In preparing this paper, we have computed the child mortality index for every currently married woman in the Hispanic Oversample population who was married only once , and who was married fewer than 25 years and had a known number of children ever born and children surviving, and a known number of years of marriage. We excluded women whose oldest child living with them was more than two years older than her number of years mar-ried, on the grounds that those children were likely to be children of a previous marriage. The index is irrelevant for childless women. Besides the difference in the reference life table between our work and that of Preston, Ewbank, and Hereward (1994), another difference between our analysis and theirs was that they included some women married more than once and some women married 25 or more years. In excluding such women we have followed the Child Mortality Index Method developed and used by Preston and Haines (1991), and used by Gutmann and Fliess (1996) in their analysis of ethnic and environmental differences in child mortality in Texas, based on samples from the 1900 and 1910 censuses.
Bexar County Death Certificates, 1909-1911
In order to supplement the national data that encompasses child mortality for children born between 1894 and 1910, and the Bexar County birth and death certificates (described later) for 1935 through 1985, we collected information from an additional group of Bexar County Death Certificates for 1909, 1910 and 1911. During those three years the deaths of 1,583 persons less than 5 years of age were recorded in Bexar County. The death certifi-cates all recorded the race of persons, and we differentiated between Spanish surnames and other surnames in order to divide the population between Hispanic and non-Hispanic whites. The certificates contained relatively sparse information. In general, they recorded name, sex, race, date of death, age, date of birth, and cause of death.
We have computed age-specific death rates for infants (age 0) and children (ages 1-4) based on these data. We use as the denominators the census population for Bexar County that is available by combining data from the 1910 national public use micro sample from the IPUMS series (Ruggles and Sobek, 1995), and the new 1910 Hispanic Oversample created by Gutmann and Ruggles (Gutmann, Frisbie, and Blanchard, 1999, forthcoming). We use the number of deaths (for three years) and the 1910 population to compute age,

Dating the Epidemiologic Paradox - Page 8
sex, and race-ethnicity specific death rates. We have not attempted to make these results comparable to the true infant mortality rates reported for Bexar County from 1935 through 1985, for which we have a linked sample of birth certificates.
Bexar County Birth and Death Certificates, 1935 - 1985
We gather our key data about the evolution of Mexican origin infant mortality over time from a collection of birth and death certificates for Bexar County, Texas, which is the county that includes San Antonio. Bexar county is located in south central Texas, and has a largely Hispanic population, with a substantial non-Hispanic white population, and a rela-tively small African American population. The Black population of Bexar county has never exceeded ten percent of the total, and throughout most of the twentieth century has been in the range of six or seven percent. The Bexar County data set contains all infant deaths that occurred in the county from 1935 through 1985, along with a 20 percent random sample of birth records, and is the only known source that allows identification of Mexican Americans and Mexican immigrants, as well as blacks and non-Hispanic whites (“Anglos”), over such an extended period of time.
The linked file of birth and death certificates contains a substantial amount of informa-tion about the characteristics of the father, the mother, the child, and the death. In addition to the racial category of the mother and child, and the surname (from which we determine Hispanic identity), we also know the birthplace of the child and the mother, the mother’s age, the occupation of the father, and a number of characteristics of the birth and the death. These characteristics of the birth and the death changed over time as reporting requirements changed, but for many births they include birth weight, gestational age, and the level of prenatal care. For most deaths they include the cause of death and the age of child at the time of death. The creators of the data set were very thorough about assigning correct ICD-9 codes to each death, which permits detailed analysis of cause of death (see Forbes and Frisbie, 1991).
In this paper we make use of relatively simple elements of the Bexar County data for 1935 through 1985. We divide the data into five ten-year time periods for births (excluding 1985, for which some deaths occurred in 1986, outside the time limit). We compute infant mortality rates for males and females for three race-ethnic groups, Spanish-Surname, Afri-can American, and non-Hispanic whites. We also estimate a logistic regression model of the odds of infant death based on these data, and using a limited number of independent variables. Our goal in the regression analysis is not to explain as much of the variance as possible (which is easy to do if we include birth weight in the model), but to construct a set of regression-type analyses for our various sources of data that might be compared. 1990 Linked Birth-Infant Death File
The 1990 data are from the National Center for Health Statistics (NCHS) Linked Birth/Infant Death Files. This is the most current, and by far the largest, data set relevant

Dating the Epidemiologic Paradox - Page 9
for our purposes. Of major importance for this study, the Hispanic-origin coverage area was expanded (in 1989) to encompass all states of the U.S. (except New Hampshire where the number of Hispanics is quite small). The analyses that follow include all non-Hispanic African American, Mexican American, and non-Hispanic white infant births that occurred in 1990 and all deaths that occurred to that cohort (including deaths that occurred in 1991 to infants born in 1990). The number of births and deaths total, respectively, 3,547,732 and 23,543. Results and Analysis
We begin our analysis by looking at the differences between the mortality experience of the Mexican origin population and that of other groups at the end of the twentieth century, and then at the beginning of the twentieth century.
[Table 1 About Here]
For the end of the twentieth century we can calculate infant mortality rates for the whole United States that differentiate between males and females, and between the Mexican origin population, African Americans, and non-Hispanic Whites. We report the results of this analysis in Table 1. The top panel of Table 1 reports infant mortality rates for all causes combined, while the lower panel reports those rates by causes divided into four major categories: endogenous, exogenous, sudden infant death syndrome, and all other. For all causes combined, infant mortality rates were roughly twice as high for African Americans as for the Mexican origin population and the non-Hispanic white population, which had rates that were very similar. When we compare the Mexican origin population with the non-Hispanic white population, we see that the Mexican origin population has slightly higher infant mortality than non-Hispanic whites.
We examine the simplified cause structure of infant mortality in the lower panel of Ta-ble 1. In these results we see that African-American infants experienced higher mortality from all causes, relative to both non-Hispanic whites and to Mexican origin infants. The comparison between the Mexican origin population and non-Hispanic whites is also reveal-ing. Here we see that the Mexican origin population had slightly higher rates for endoge-nous and exogenous causes of death, while the non-Hispanic white population had higher rates from sudden infant death syndrome. The rates for the small group of residual causes that we label as “all other” are higher for non-Hispanic whites.
[Table 2 About here]
We have enlarged this analysis of race and ethnic group differences in 1990 with a lo-gistic regression of the odds of infant death in the United States. We report the results in Table 2. Table 2 shows the operation of the epidemiologic paradox very clearly. When we control for a small number of covariates (designed to be comparable to later analyses we do), we see that the Mexican origin population has much lower odds of infant death than

Dating the Epidemiologic Paradox - Page 10
the African American population, and slightly lower odds of infant death than the non-Hispanic white reference group. All the other independent variables are as one would ex-pect: male infants are more likely to die than females, the foreign born do better than the native born, and the children of women with more education do better than the children of women with less education.
[Table 3 About Here]
At the beginning of the twentieth century, the situation is not at all the same as it later becomes, at least in the context of child mortality. In 1990 we see fully developed evidence of the epidemiologic paradox. At that recent date, Mexican origin infants experienced a lower risk of death than did African American infants, and about the same risk as that of non-Hispanic whites, although the cause structure differs. Earlier in the century, Hispanic children – many of them of Mexican origin – faced much higher risks than did non-Hispanic white children, and somewhat higher risks than African American children. At the top of Table 3 we report the overall results for our analysis of child mortality in the Hispanic Oversample of the 1910 U.S. Census. We show that when we group all Hispanics in the 1910 census together, their child mortality was slightly higher than that of African Americans who lived in the same counties, and much higher than that of non-Hispanic whites in the same counties. The balance of Table 3 provides comparable estimates from other sources to put the results from the Oversample in context.
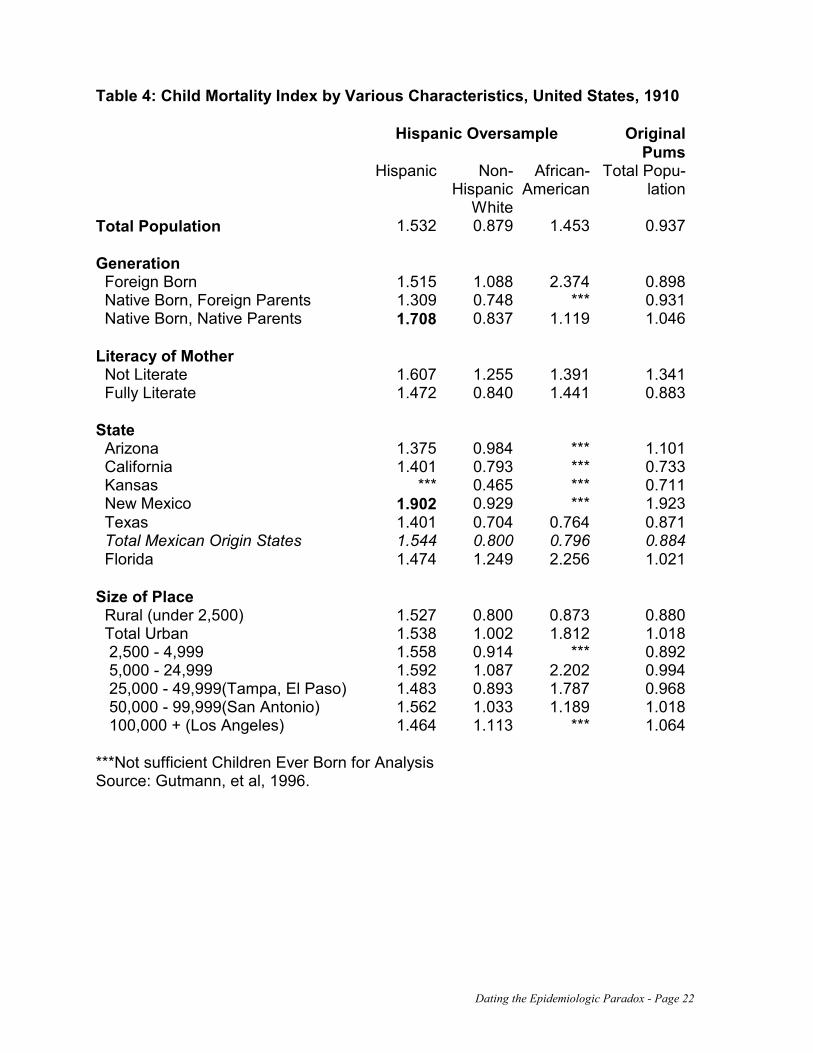
[Table 4 About Here]
When we subdivide the Hispanic population in 1910 into some of its components, we see that there were significant differences in child mortality, but that no parts of the His-panic population in 1910 had child mortality lower than that of the non-Hispanic White population. We report these results in Table 4. Two sub-groups within the Hispanic popu-lation stand out in our analysis, and we have highlighted those groups by putting their Child Mortality Index values in bold faced type. The largest value of all those from the Hispanic Oversample in the table is for residents of New Mexico. The other large value is for women who were the U.S.-born children of U.S.-born parents, in the category we label as “Generation”. In analyzing these groups we discovered that these high values represented many of the same people. The third generation residents of New Mexico constitute a distinct group, called Hispanos, who are the descendants of Spanish or Mexican settlers who came to the region hundreds of years ago. In the early twentieth century they lived in relative isolation and poverty, and had a distinct culture. We have shown elsewhere that they constitute a distinct population in terms of child mortality, and probably should not be grouped with other Hispanics (Gutmann, et al, 1996).
The discovery of the special demographic characteristics of the Hispano population led us to try to distinguish between the three significant Hispanic origin groups in our popula-tion. Rather than trying to group all Hispanics together, we separate them by taking into account state of residence and generation. We grouped all third generation and later women from New Mexico into a group we call Hispanos. We place all residents of Florida in a separate group that is made up of persons of Cuban and Spanish origin. All the remaining
Dating the Epidemiologic Paradox - Page 11
Hispanics in our sample we consider to be of Mexican origin. While this grouping probably places some persons in the wrong group, it is a very good start on understanding the structure of the Hispanic population in the United States in 1910.
[Table 5 About Here]
In order to see the role of these groups, and the combined role of a number of factors in determining child mortality in the early twentieth century, we undertook a regression analysis, in which a woman’s individual Child Mortality Index value was the dependent value. The results of that analysis are presented in Table 5. In this analysis we begin with a regression model that only includes race and ethnic group, and the woman’s marriage dura-tion. Then we add characteristics of the woman, of her husband, and of the size of place where she lived. We do not include state of residence in this model because it is largely encompassed by the divisions in the Hispanic groups.
The findings in Table 5 are very interesting, because they show that after we take a number of other characteristics of the woman, her husband, and their place of residence into account, the Mexican origin and Florida Hispanic populations have roughly similar coefficients, and therefore roughly similar levels of child mortality. Their child mortality is significantly lower than that of African Americans and much lower than that of the group that we have identified as Hispanos. On the other hand, the Mexican origin and Florida Hispanic populations have significantly higher child mortality than non-Hispanic whites, even after taking factors such as literacy, language, occupation, and place of residence into account.
We find no evidence in the early twentieth century child mortality data that the epide-miologic paradox existed for the Mexican origin population relative to non-Hispanic whites. This is what we would expect, because the work of Forbes and Frisbie (1991) dates that origin significantly later. What is somewhat surprising in our results is the low child mortality of the Mexican origin (and Florida) Hispanic populations relative to their African American neighbors. If that evidence is replicated by other research, then we might date the origins of the epidemiologic paradox for the Mexican origin population relative to Blacks to the time of the first large concentration of the Mexican origin population in the United States, at the beginning of the twentieth century.
[Table 6 About here]
We try to validate our dating of what we might call the “first epidemiologic paradox” by looking at detailed data for Bexar County, Texas. In Table 6 we present age specific death rates for infants and children, by sex (and with sexes combined), for our three race and ethnic groups, for 1909-1911. We see that for infants there is not much difference between non-whites and those with Spanish surnames. For children (ages 1 to 4), the difference is greater, but all the rates are very small. This results are in keeping with what we would expect, given the regression findings in the first column of Table 5. Without the addition of other characteristics about individuals, African American and Mexican origin

Dating the Epidemiologic Paradox - Page 12
infant and child mortality should be about the same. We have partly confirmed our findings based on the 1910 census data with these results based on the 1909-1911 death certificates.
[Table 7 About Here]
We continue this line of research with an analysis of the Bexar County data for 1935 through 1984. We report infant mortality rates in Table 7, with sexes combined. Here the results are different from what we have come to expect based on the research about the beginning of the century. For the first two time periods we examine, 1935-44 and 1945-54, the Spanish surname population had higher infant mortality rates than the African American population. Based on these results, the “first epidemiologic paradox” begins only in the 1950s, not at the turn of the century. We confirm these findings with a logistic regression analysis of the same data, reported in Table 8. The logistic regression results, which include information about father’s occupational group and age of mother, in addition to the race-ethnicity group, show that Spanish surname infant mortality was significantly higher than African American infant mortality in the 1935-44 time period, and somewhat higher in the 1945-54 time period. Our results also confirm that the epidemiologic paradox of the Mexican origin population relative to non-Hispanic whites has its origin in the late 1950s or early 1960s.
[Table 8 About Here]
What happened between 1910 and 1935 to change the health balance between the Mexican origin population and the African American population in Bexar County? While we cannot document our findings with quantitative data, we need to describe two processes that were at work in this time period.
The first event to take into account in telling our story is the Mexican Revolution of the early twentieth century. The Mexican Revolution caused a great deal of disruption in Mexico, and encouraged a great deal of emigration to the United States. San Antonio was a major destination of the migration, because it was located on the main rail line and was not far from Mexico (there was at this time no good road transport between San Antonio and Laredo on the Mexican border). The emigration that followed the Mexican revolution sharply increased the population and the population density on the Mexican west side of San Antonio, with disastrous health consequences. Housing quality deteriorated, and the city fathers took little or no action to improve matters. Only in the late 1930s did public pressure begin to force the city government to improve health conditions in the Mexican neighborhoods of San Antonio (Blanchard, 1996).
While conditions worsened between 1910 and 1935 for Mexican Americans in San Antonio, they appear to have improved for African Americans. This is a story of political influence and its consequences in an important political period. The basic facts are these: as the city of San Antonio began (belatedly) to build a sanitation infrastructure in the city after 1900, it began first in the neighborhoods on the near north side where members of the non-Hispanic white community lived. Surprisingly, by the 1920s, the city was building sanitation infrastructure in the predominantly African-American neighborhoods of the east

Dating the Epidemiologic Paradox - Page 13
side. The predominantly Hispanic Westside did not receive the developments to any great extent until the early 1940s (San Antonio Sanitation Dept., various dates).
The improvement in African American health conditions appears to be the result of what we might call the “Bellinger Effect.” Charles Bellinger was an African-American from the predominantly Black Eastside of San Antonio who became a power broker in the political structure of the city at a time of white supremacy ideology, white primaries, and the proliferation of Jim Crow. He was known to be the owner and operator of 3 saloons and a taxi-cab company (Thompson, 1978), and reputed to be the "kingfish" of San Antonio's underworld in the 1920s (Grannenberg, 1939).
As the story is told, Charles Bellinger, in 1918, struck a deal with the eleven churches in the “colored section” of the city that if the pastors would support Bellinger's wish to gain control of the voting power of the congregations, he would see to it that the city "paved the streets to the churchhouse doors" (White, 1937). Out of this agreement between Bellinger and the pastors arose a bloc of 5,000 to 8,000 Black votes that Bellinger helped to deliver at every local election between 1920 and 1937 (White, 1937). The bloc made up as much as 25% of the votes in some of the elections, despite the fact that the Black population of the city was only 8% of the total (Doyle, 1987).
From 1918 to 1935, Bellinger was known locally in the city as the “bag-man,” the real boss of local politics. Even John Tobin, city mayor during the 1920s and head of a promi-nent local white family, was known as Bellinger's mayor (Grannenber, 1939). By 1937, the “colored” section of the city was described as very different from the “Mexican quarter.” It was well-paved, well-serviced with light, water, and sewer connections, and had up-to date schools, fire houses, parks, a library, playgrounds, and a public auditorium (White, 1937).
The political opportunity for Bellinger came about because of the atypical nature of politics in Bexar County. Even though the Terrell Election Law of 1905 had virtually dis-enfranchised Blacks by establishing color of skin as a criterion of membership in Democratic Party primaries and the white primary became the law of Texas in 1923 (Hine, 1979), Bexar County was one of the few counties in Texas, indeed in the South, that continued to allow Blacks to vote in Democratic primaries. The U.S congressional district that included San Antonio contained one of the strongest Republican party organizations in the state. County and municipal elections in San Antonio were strong two-party contests and Bellinger's block of Black voters often held the political leverage (Doyle, 1987). Conclusion: Telling the Story of the Epidemiologic Paradox
The Bellinger story allows us to say that San Antonio was unusual, just as every major city in America was unique in some way. We cannot fully rely on its experience to tell the story of the epidemiologic paradox, at least as it relates to African Americans and Mexican Americans. In San Antonio and Bexar County, local political conditions spurred the im-provement of health conditions for African Americans, and delayed them for Mexican Americans. National and international conditions also contributed to the situation.

Dating the Epidemiologic Paradox - Page 14
The national data we have explored suggest that the Mexican origin population had in-fant and child mortality experiences that were similar to or slightly better than those of African Americans at the beginning of the twentieth century. The Mexican Origin Popula-tion had much worse infant and child mortality than non-Hispanic whites at the same time. By the end of the twentieth century this simple early paradox (of why poor Mexicans were as well off or better off than their Black neighbors) becomes an even more complex later paradox. Why does the Mexican origin population have as good or better infant (and also adult) mortality experience as the non-Hispanic white population? We haven’t dealt with explanations here, but the history is worth knowing.
The Bexar County data enriches the story, although it is risky to use Bexar County as a model for all of America. Health conditions worsened for Mexicans after 1910, probably because of the rapid influx of people during and after the Mexican revolution. In Bexar County infant mortality stayed high for Mexican origin people relative to African Americans until the 1950s, and relative to non-Hispanic whites until the 1960s. To some extent this was a result of changed social and economic conditions, and to some extent this was a result of change political conditions. We have highlighted the story of Bexar County here. The narrative of the exact timing of the multiple epidemiologic paradoxes for other parts of America remains to be explored.

Dating the Epidemiologic Paradox - Page 15
References Bean, F. D. and M. Tienda. 1987. The Hispanic Population of the United States. New
York: Russell Sage Foundation
Becerra, J. E., C .J. R. Hogue, H. K. Atrash, and N. Perez. 1991. Infant mortality among Hispanics: a portrait of heterogeneity. Journal of the American Medical Association. 265: 217-21.
Blanchard, K. S. 1996. The Decline in Diarrhea-Related Infant Mortality in San Antonio, Texas, 1935-1954: the Role of Sanitation. Unpublished Ph.D. Dissertation, University of Texas at Austin.
Bradshaw, B.W., W. P. Frisbie, and C. Eifler. 1986. Excess and deficit mortality due to selected causes of death and their contribution to differences in life expectancy of Span-ish surnamed and other white males--1970 and 1980. Report of the Secretary’s Task Force on Black & Minority Health, Vol. 2. Washington, DC: U.S. Government Printing Office.
Cramer, J. C. 1987. Social factors and infant mortality: identifying high-risk groups and proximate causes. Demography. 24: 299-322.
Doyle, J.K. 1987. Maury Maverick and Racial Politics in San Antonio, Texas, 1938-1941. Journal of Southern History 53:194-223.
Eberstein, I. W., C. B. Nam, and E. W. Terrie. 1987. A multiple cause of death approach to racial/ethnic differences in infant mortality. Presented at the annual meeting of the Population Association of America. New Orleans
Eberstein, I. W., C. B. Nam, and R. A. Hummer. 1990. Infant mortality by cause of death: main and interaction effects. Demography 27: 413-30.
Forbes, D. and W. P. Frisbie. 1991. Spanish surname and Anglo infant mortality: differen-tials over a half-century. Demography 28: 639-60.
Forbes, D. and W. P. Frisbie. 1993. Anticipating the enigma: models of ethnicity and infant mortality in Bexar County, Texas: 1949-1984. Presented at the annual meeting of the Population Association of America. Cincinnati.
Frisbie, W. P. 1994. Birth Weight and Infant Mortality in the Mexican Origin and Anglo Populations. Social Science Quarterly 75: 881-895..
Frisbie, W. P. and F. D. Bean. 1995. The Latino Family in Comparative Perspective: Trends and Current Conditions. Pp. 29-71 in Cardell Jacobson (ed.) Racial and Ethnic Families in the United States. New York: Garland.
Frisbie, W. P., D. Forbes, and R. Rogers. 1992. Neonatal and Postneonatal Mortality as Proxies for Cause of Death: Evidence from Ethnic and Longitudinal Comparisons. So-cial Science Quarterly 73: 535-549.
Frisbie, W. P., D. Forbes, and S. G. Pullum. 1996. Compromised birth outcomes and infant mortality among racial and ethnic groups. Demography 33: 469-481.

Dating the Epidemiologic Paradox - Page 16
Frisbie, W. P., M. Biegler, P. de Turk, D. Forbes, and S. G Pullum. 1997. Determinants of Intrauterine growth retardation and other compromised birth outcomes: a comparison of Mexican Americans, African Americans, and non-Hispanic whites. American Journal of Public Health 87(12).
Frisbie, W.P., D. Forbes, and R.A. Hummer. 1998. Hispanic Pregnancy Outcomes: Additional Evidence. Social Science Quarterly 79: 149-169.
Glover, J. W. 1921. United States Life Tables, 1890, 1901, 1910, and 1901-1910. Wash-ington, D. C.: U. S. G. P. O.
Grannenberg, A. 1939. Maury Maverick's San Antonio. Survey Graphics: A Magazine of Social Interpretation 28: 421-426.
Guendelman, S., and B. Abrams. 1995. Dietary Intake among Mexican-American Women: Generational Differences and a Comparison with White Non-Hispanic Women. Ameri-can Journal of Public Health 85(1): 20-25.
Gutmann, M. P., et al. 1998. The Hispanic Oversample of the 1910 U.S. Census of Population: User’s Guide. Minneapolis: Social History Research Laboratory, University of Minnesota.
Gutmann, M. P. and K. H. Fleiss. 1996. The social context of child mortality in the Ameri-can Southwest. Journal of Interdisciplinary History. 26: 589-618.
Gutmann, M.P., W. P. Frisbie, and K. S. Blanchard. 1999. A New Look at the Hispanic Population of the United States in 1910. Historical Methods, forthcoming.
Gutmann, M.P., M. R. Haines, W. P. Frisbie, and K. S. Blanchard. 1996. Intra-Ethnic Diversity in Hispanic Child Mortality, 1890-1910. Unpublished paper presented at the Annual Meeting of the Social Science History Association. New Orleans.
Hine, D.C. 1979. Black Victory: The Rise and Fall of the White Primary in Texas. New York: Kraus-Thomson Organization Press.
Hummer, R. A., I. W. Eberstein, and C. B. Nam. 1992. Infant mortality differentials among Hispanic groups in Florida. Social Forces. 70: 1055-75.
Markides, K. S. and J. Coreil. 1986. The Health of Hispanics in the Southwestern United States: An Epidemiologic Paradox. Public Health Reports 101:253-265.
Moss, N. and K. Carver. 1992. Explaining racial and ethnic differences in birth outcomes: the effect of household structure and resources. Presented at the annual meeting of the Population Association of America. Denver.
Powell-Griner, E. 1988. Differences in infant mortality among Texas Anglos, Hispanics, and Blacks. Social Science Quarterly 69: 452-67.
Powell-Griner, E. and D. Streck. 1982. A closer examination of neonatal mortality rates among the Texas Spanish surname population. American Journal of Public Health. 72: 993-9.
Preston, S. H., and M. R. Haines. 1991. Fatal Years. Child Mortality in Late Nineteenth-Century America. Princeton: Princeton University Press.
Dating the Epidemiologic Paradox - Page 17
Preston, S. H., D. Ewbank, and M. Hereward. 1994. Child mortality differences by ethnicity and race in the United States: 1900-1910. Pp. 35-82 in S. C. Watkins, ed., After Ellis Island: Newcomers and Natives in the 1910 Census. New York: Russell Sage Foundation.
Rogers, R. G. 1984. Infant mortality among New Mexican Hispanics, Anglos and Indians. Social Science Quarterly. 65: 876-84.
Rogers, R. G. 1989. Ethnic differences in infant mortality: fact or artifact? Social Science Quarterly. 70: 642-9.
Rogers, R. G. and J. Crank. 1988. Ethnic differences in smoking patterns: findings from NHIS. Public Health Reports. 103: 387-93.
Ruggles, S., and M. Sobek. 1995. Integrated Public Use Microdata Series: Version 1.0. Minneapolis: Social History Research Laboratory, University of Minnesota.
Ruggles, S., and R.R. Menard. 1995. The Minnesota Historical Census Projects. Historical Methods 28 (1995), 6-78.
Rumbaut, R. G. and J. R. Weeks. 1991. Perinatal Risks and Outcomes Among Low-Income Immigrants. Final Report for the Maternal and Child Health Research Program. Rockville: Department of Health and Human Services.
San Antonio Department of Sanitation. 1910-1936. Sanitation Notebooks. Department of Sanitation, City of San Antonio, Texas.
Schick, F. L. and R. Schick. 1991. Statistical Handbook on U.S. Hispanics. Phoenix: Oryx.
Scribner R. and J. H. Dwyer. 1989. Acculturation and low birthweight among Latinos in the Hispanic HANES. American Journal of Public Health. 79: 1263-7.
Scribner, R. 1996. Paradox as paradigm--the health outcomes of Mexican Americans. American Journal of Public Health. 86: 303-304
Selby, M. J., E. S. Lee, D. M. Tuttle, and H. D. Loe. 1984. Validity of the Spanish surname infant mortality rate as a health status indicator for the Mexican American population. American Journal of Public Health. 74: 998-1002.
Strong, M. A., et al. 1989. User’s Guide, Public Use Sample. 1910 United States Census of Population. Philadelphia: Population Studies Center, University of Pennsylvania.
Teller, C. H. and S. Clyburn. 1974. Trends in infant mortality. Texas Business Review. 29: 97-108.
Thompson, P. 1978. San Antonio Express News, January 19.
U. S. National Center for Health Statistics. 1990. Advance report of final mortality statis-tics, 1988. Monthly Vital Statistics Report. 39: Supplement.
White, O.P. 1937. Machine Made. Colliers, September 18:32-33.
Williams, R. L., N. J. Binkin and E .J. Clingman. 1986. Pregnancy Outcomes Among Spanish-Surname Women in California. American Journal of Public Health 76:387-391.

Dating the Epidemiologic Paradox - Page 18

Dating the Epidemiologic Paradox - Page 19
Table 1: Infant Mortality Estimates, United States, 1990 A. Infant Mortality by Sex and Race-Ethnicity (Times 1,000) Non-Hispanic
White African-American Mexican Origin
Male 6.32 12.72 6.48 Female 4.69 10.50 4.84 B. Cause-Specific Infant Mortality Rates by Sex and Race-Ethnicity (Times 10,000) Endogenous Exogenous Sudden Infant
Death Syn-drome
All Other (Unclassified, etc)
Male Non-Hispanic White 37.8 7.5 13.8 4.2 African-American 74.3 19.5 23.5 10.0 Mexican Origin 40.9 10.1 10.3 3.5 Female Non-Hispanic White 29.6 6.3 8.2 2.9 African-American 58.9 18.7 19.0 8.5 Mexican Origin 32.4 7.3 5.9 2.8

Dating the Epidemiologic Paradox - Page 20
Table 2: Logistic Regression of the Odds of Infant Death, United States, 1990 Odds Ratio Significance Intercept 0.00 0.000 Race-Ethnic Group Mexican Origin 0.94 0.067 African American 1.92 0.000 Non-Hispanic White reference group Region South 1.01 0.458 Southwest 0.98 0.224 All Other reference group Sex Male 1.31 0.000 Female reference group Nativity Foreign Born 0.72 0.000 U.S. Born reference group Mother’s Education 0-8 Years 1.85 0.000 9-11 Years 1.66 0.000 12 or more Years reference group

Dating the Epidemiologic Paradox - Page 21
Table 3: Childhood Mortality Estimates. United States. 1900 and 1910(a) 1900 1910 Mortality
Index q(5) Implied
e(0) Mortality
Index q(5) Implied
e(0) Hispanic Oversample, 1910 Hispanic 1.532 0.275 39.9 White Non-Hispanic 0.880 0.158 52.1 African American 1.483 0.261 41.2
United States Total 1.009 0.193 48.3 1.000 0.180 49.8 Race of Woman White 0.940 0.180 49.8 0.922 0.166 51.3 African American 1.465 0.280 39.4 1.486 0.267 40.7 Residence Rural 0.923 0.176 50.1 0.942 0.169 50.9 Urban 1.126 0.215 45.9 1.063 0.191 48.5 Cities 25,000+ 1.281 0.245 42.9 1.112 0.200 47.6 Nativity of Woman Native White 0.870 0.166 51.2 0.869 0.156 52.4 Britain 1.099 0.210 46.5 1.156 0.208 46.8 Ireland 1.288 0.246 42.7 1.223 0.220 45.5 Germany 1.198 0.229 44.5 0.911 0.164 51.5 East Europe 1.027 0.196 48.0 1.081 0.194 48.2 South Europe 1.134 0.217 45.8 1.266 0.228 44.7 Six Texas Counties Total 0.946 0.185 49.2 1.025 0.167 51.2 Ethnic Origin of Mother African American 1.152 0.226 44.9 1.278 0.208 46.7 German 0.558 0.109 58.4 0.652 0.106 58.8 Mexican 1.534 0.301 37.5 1.498 0.244 42.9 All Other White 0.908 0.178 50.0 0.998 0.163 51.7 Death Registration Area Life Tables Total 0.182 49.2 0.161 51.5 Race of Woman White 0.179 49.6 0.159 51.9 African American 0.338 33.8 0.294 35.8 Residence (White Population) Rural 0.140 54.7 0.128 56.2 Urban 0.207 45.9 0.176 49.3 (a) for a definition of the mortality index, see text. Q(5) is the probability of dying between birth and exact age 5. Sources: Preston & Haines (1991); Gutmann and Fliess (1996); Preston, Ewbank, and Hereward (1994); Glover (1921); Gutmann, et al., 1996.
Dating the Epidemiologic Paradox - Page 22
Table 4: Child Mortality Index by Various Characteristics, United States, 1910
Hispanic Oversample
Original Pums
Hispanic Non-Hispanic
White
African-American
Total Popu-lation
Total Population 1.532 0.879 1.453 0.937 Generation Foreign Born 1.515 1.088 2.374 0.898 Native Born, Foreign Parents 1.309 0.748 *** 0.931 Native Born, Native Parents 1.708 0.837 1.119 1.046 Literacy of Mother Not Literate 1.607 1.255 1.391 1.341 Fully Literate 1.472 0.840 1.441 0.883 State Arizona 1.375 0.984 *** 1.101 California 1.401 0.793 *** 0.733 Kansas *** 0.465 *** 0.711 New Mexico 1.902 0.929 *** 1.923 Texas 1.401 0.704 0.764 0.871 Total Mexican Origin States 1.544 0.800 0.796 0.884 Florida 1.474 1.249 2.256 1.021 Size of Place Rural (under 2,500) 1.527 0.800 0.873 0.880 Total Urban 1.538 1.002 1.812 1.018 2,500 - 4,999 1.558 0.914 *** 0.892 5,000 - 24,999 1.592 1.087 2.202 0.994 25,000 - 49,999(Tampa, El Paso) 1.483 0.893 1.787 0.968 50,000 - 99,999(San Antonio) 1.562 1.033 1.189 1.018 100,000 + (Los Angeles) 1.464 1.113 *** 1.064 ***Not sufficient Children Ever Born for Analysis Source: Gutmann, et al, 1996.

Dating the Epidemiologic Paradox - Page 23
Table 5: Child Mortality Regression Analysis, United States, 1910 Hispanic Oversample Data Only Dependent Variable is the Child Mortality Index
Ethnicity Woman's Additional
Characteristics
Add Husband's Characteristics
Add Family and Area Charac-
teristics Number of Observations 35,039 35,039 35,039 35,039 R-Squared 0.0483 0.0511 0.0555 0.0591 Adjusted R-Squared 0.0482 0.0509 0.0552 0.0586
Variable/Value Coefficient Sig. Coefficient Sig. Coefficient Sig. Coefficient Sig.
Constant 0.625 *** 0.610 *** 0.417 *** 0.410 ***
Woman's Ethnicity Non-Hispanic White (Omitted) N.I. N.I. N.I. N.I. Hispano (New Mexico) 1.054 *** 0.900 *** 0.914 *** 0.942 *** Florida Hispanic 0.580 *** 0.488 *** 0.390 *** 0.365 *** Mexican Origin 0.550 *** 0.397 *** 0.368 *** 0.357 *** African American 0.535 *** 0.550 *** 0.521 *** 0.485 ***
Marriage Duration (Years) 0.018 *** 0.017 *** 0.019 *** 0.018 ***
Woman's Literacy Fully Literate (Omitted) N.I. N.I. N.I. Not Fully Literate 0.076 *** 0.068 *** 0.085 ***
Woman's Language Speaks English (Omitted) N.I. N.I. N.I. Does Not Speak English 0.166 *** 0.162 *** 0.163 ***
Husband's Occupation Farmer (Omitted) N.I. N.I. High White Collar 0.212 *** 0.135 *** Low White Collar 0.272 *** 0.185 *** Skilled Manual 0.278 *** 0.200 *** Unskilled Manual 0.237 *** 0.193 *** Other Occupations/No Occupation 0.154 * 0.084
Size of Place or City ID Under 5,000 (Omitted) N.I. 5,000-24,999 0.207 *** Tampa (25,000-49,999) 0.029 El Paso (25,000-49,000) 0.315 *** San Antonio (50,000-99,999) 0.173 *** Los Angeles (100,000+) 0.119 *
N.I. = Not Included (Omitted Category) *** Significant at the .001 Level ** Significant at the .01 Level * Significant at the .1 Level

Dating the Epidemiologic Paradox - Page 24
Table 6: Age Specific Infant and Child Mortality Rates Bexar County, Texas, 1909-11
Non-Hispanic White
Non-White Hispanic
Male Female Male Female Male Female Age 0-1 Population (1910) 675 767 118 117 667 690 Deaths (3 years) 205 153 64 46 336 309 Rate (per 1,000) 101 66 181 131 168 149 Sexes Combined 83 156 158 Age 1-4 Population (1910) 2,355 3,008 440 385 1,996 2,126 Deaths (3 years) 84 68 18 12 143 145 Rate (per 1,000) 12 8 14 10 24 23 Sexes Combined 9 12 23

Dating the Epidemiologic Paradox - Page 25
Table 7: Infant Mortality Rates, Bexar County, Texas, 1935-1984 (Times 1,000) 1935-1944 1945-1954 1955-1964 1965-1974 1975-1984 Non-Hispanic White 37.2 25.5 23.0 17.0 9.4 African American 57.5 41.6 38.3 34.2 17.5 Spanish Surname 100.3 47.4 30.6 19.7 11.5 Total Population 69.4 36.8 28.1 19.7 11.1 *Note: These results include multiple births and children with mothers of unknown age. Table 8: Logistic Regression of the Odds of Infant Death, Bexar County, 1935-1984
1935-44 1945-54 1955-64 1965-74 1975-84 Odds Ratio Sig. Odds Ratio Sig. Odds Ratio Sig. Odds Ratio Sig. Odds Ratio Sig.
Race-Ethnicity Group Non-Hispanic White (omitted) African-American 1.230 ** 1.366 *** 1.348 *** 1.311 *** 1.300 ** Spanish Surname 2.206 *** 1.516 *** 1.103 ** 0.936 1.055
Father's Occupation White Collar (omitted) Skilled 1.357 *** 1.166 ** 1.350 *** 1.157 * 1.173 * Unskilled 1.782 *** 1.679 *** 1.608 *** 1.608 *** 1.414 *** Military 0.862 * 0.984 1.032 0.991 1.191 * Other Occupations 1.303 * 1.165 1.334 * 0.814 2.159 * Occupation missing* 1.623 *** 1.416 *** 1.820 *** 2.936 *** 2.465 ***
Age of Mother 13-17 1.132 * 1.188 * 1.253 *** 1.034 1.135 18-34 0.770 *** 0.914 * 0.815 *** 0.806 *** 0.942 35-49 (omitted)
Significance Levels: * p<= .1 **p<=.01 ***p<=.001
Note: Results do not include multiple births and children with mothers of unknown age. *Includes all unwed mothers as well as those with father’s occupation undetermined.