daubechies versus biorthogonal wavelets for moving object ... · daubechies versus biorthogonal...
TRANSCRIPT
Daubechies Versus Biorthogonal Wavelets forMoving Object Detection in Traffic Monitoring
Systems
Mohammed A. Salem, Nivin Ghamry, and Beate Meffert
Abstract
Moving object detection is a fundamental task for a variety of traffic ap-plications. In this paper the Daubechies and biorthogonal wavelet families areexploited for extracting the relevant movement information in moving imagesequences in a 3D wavelet-based segmentation algorithm. The proposed algo-rithm is applied for traffic monitoring systems. The objective and subjectiveexperimental results obtained by applying both wavelet types are comparedand interpreted in terms of the different wavelet properties and the character-istics of the image sequences. The comparisons show the superior performanceof the symmetric biorthogonal wavelets in the presence of noisy images andchanging lighting conditions when compared to the application of high orderDaubechies wavelets. The algorithm is evaluated using simulated images inthe Matlab environment.
Index Terms— 3D wavelet transform, Image segmentation, Biorthogonal wavelets,Daubechies wavelets, traffic monitoring systems.
1 IntroductionImage segmentation is essential in many advanced techniques of multi-dimensionalsignal processing and its applications. The goal of segmentation is to simplify and/orchange the representation of an image to make it more meaningful and easier to an-alyze. It is typically used to locate objects and boundaries (lines, curves, etc.)in images. Some of the practical applications of image segmentation are: medicalimaging, diagnosis, face- and fingerprint recognition, machine vision and automatictraffic controlling systems. Image segmentation for traffic monitoring systems meansdetection and extraction of the moving objects that take part in the updated currenttraffic situation. In other words, active objects in an image sequence are encodedwhile the background, which may have moving and non-moving parts, is excluded.The development of reliable and efficient segmentation algorithms which can meetthe requirements of the subsequent tracking and interpretation tasks as well as thehigh-speed response for real time applications is still a challenging problem. Themost widely used image segmentation method for traffic or even outdoor movingobject monitoring is based on background subtraction [2, 9, 20]. The backgroundis initially set as the first frame of the video sequence [18, 6] or it is modelled as aGaussian Mixture Model (GMM) [20]. In both cases, the background model must beupdated in order to deal with changing lighting conditions and movements of irrel-evant objects. Another approach uses a threshold based on the notion that vehicles
are compact objects having a different intensity as their background [13]. A generalproblem of this approach is that it cannot avoid false detection of shadows or misseddetection of vehicle parts with similar intensities as its environment. Binary andgrey-scale morphological operators can be used to improve background-foregroundsegmentation results [19]. In [6] background estimation and application of an adap-tively updated threshold are combined. Some other approaches use a model baseddetection [11]. It is based on edge detection as a first step followed by fitting aproposed model. In [15] an image segmentation and moving object extraction algo-rithm applying the 3D Haar wavelet transform is presented. In [17] it is comparedwith the 2D wavelet-based algorithm proposed by Töreyin et al. [18] to assess thevalidity of the algorithm. That comparison shows that the 3D wavelet-based algo-rithm is more reliable to detect objects entering the scene than the 2D wavelet-basedalgorithm. Due to the multiresolution analysis the segmentation is speeded up andthe performance of the algorithms is improved.
The application of Daubechies and the biorthogonal wavelets for edge detectionwas considered in [14] and further compared with other conventional methods in [3].In both works it was found that the short wavelets are capable of better edge detec-tion than long wavelets but the results were not explained in terms of the waveletfeatures. In the present work Daubechies as well as biorthogonal wavelets are usedin the 3D wavelet-based algorithm of [15]. Here, the focus is on studying the differ-ent features of the wavelets, namely the symmetry of the biorthogonal wavelets andthe irregularity of the high order Daubechies wavelets. Their effects on the imagesegmentation and moving object detection are investigated by comparing the simu-lation results of both types. The aim of this comparison is to get a relation betweenthe features of the wavelets, the characteristics of the input image sequence, and thesegmentation results.
The organization of the paper is as follows: In Section 2 the theory of Daubechiesand biorthogonal wavelets is briefly surveyed. The 3D wavelet transform is explainedin Section 3. Section 4 describes the 3D wavelet based algorithm. Section 5 presentsthe test data sets and the results of simulations. Matlab is used to assess theefficiency of the algorithm for the different wavelets objectively and subjectively.Finally, summary and conclusion are given.
2 Wavelets OverviewIn this section a brief review of the principles and the theory of the orthogonal andbiorthogonal wavelets is given to emphasize the features of each method.
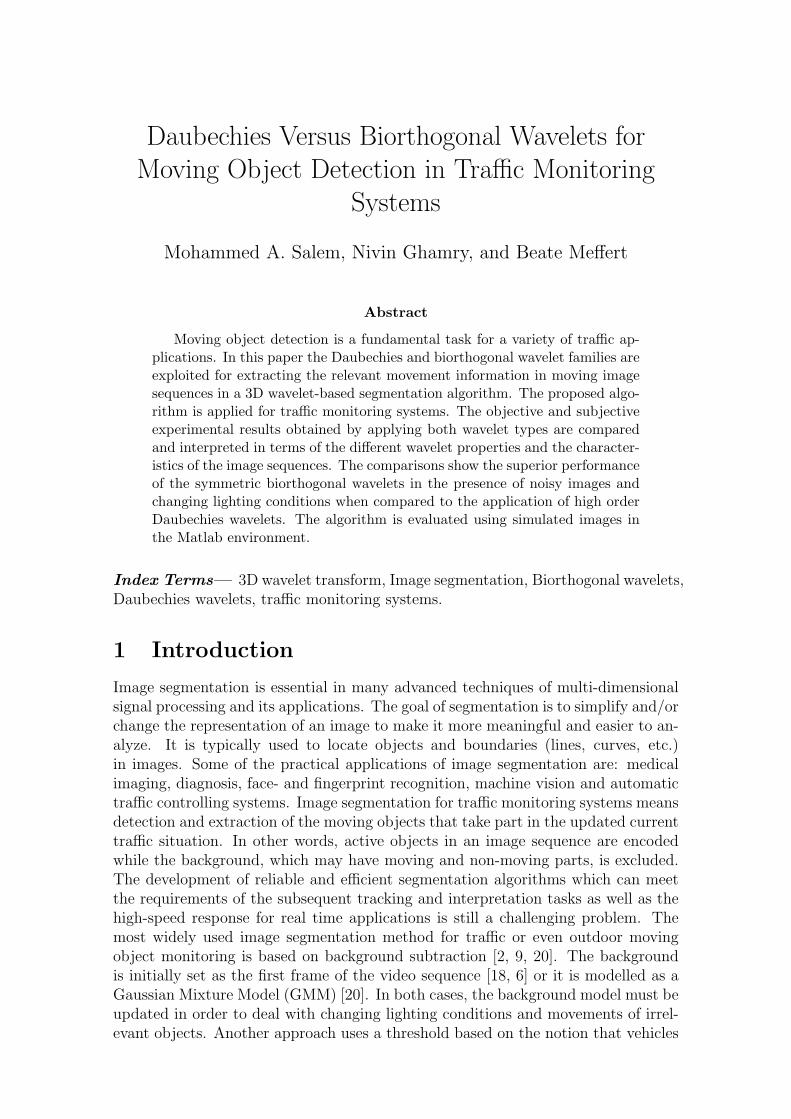
2.1 Daubechies WaveletsDaubechies constructed the first wavelet family of scale functions that are orthog-onal and have finite vanishing moments, i.e., compact support [7]. This propertyinsures that the number of non-zero coefficients in the associated filter is finite.This is very useful for local analysis. The Haar wavelet shown in Fig. 1(a) is thebasis of the simplest wavelet transform. It is also the only symmetric wavelet inthe Daubechies family and the only one that has an explicit expression in discreteform. Haar wavelets are related to a mathematical operation called Haar transform,which serves as a prototype for all other wavelet transforms. Like all wavelet trans-
2
forms, the Haar transform decomposes a discrete signal into two subsignals of half itslength. One subsignal is a running average or trend, the other subsignal is a runningdifference or fluctuation. The Haar wavelet transform has the advantages of beingconceptually simple, fast and memory efficient, since it can be calculated in placewithout a temporary array. Furthermore, it is exactly reversible without the edgeeffects that are a problem of other wavelet transforms. On the other hand, the Haartransform has its limitations because of its discontinuity, which can be a problemfor some applications, like compression and noise removal of audio signal processing.
(a) (b) (c)
Figure 1: Mother wavelet functions of Haar, DB4, and DB8, respectively.
The Daubechies wavelet transforms are defined in the same way as the Haarwavelet transform by computing the running averages and differences via scalarproducts with scaling signals and wavelets. For higher order Daubechies waveletsψdbN , N denotes the order of the wavelet and the number of the vanishing moments.The regularity increases with the order, as shown in Fig. 1. The support lengthis 2N − 1. The length of the associated filter is twice as the number of the van-ishing moments, i.e., 2N . The approximation and detail coefficients are of lengthfloor(n−1
2) + N , if n is the length of (f(t)) [12, 7]. This wavelet type has balanced
frequency responses but non-linear phase responses. The regularity of the waveletsincreases with the order. Figs. 1(b) and 1(c) show the wavelets DB4 and DB8. Thewavelets with fewer vanishing moments give less smoothing and remove less details,but the wavelets with more vanishing moments produce distortions [10].
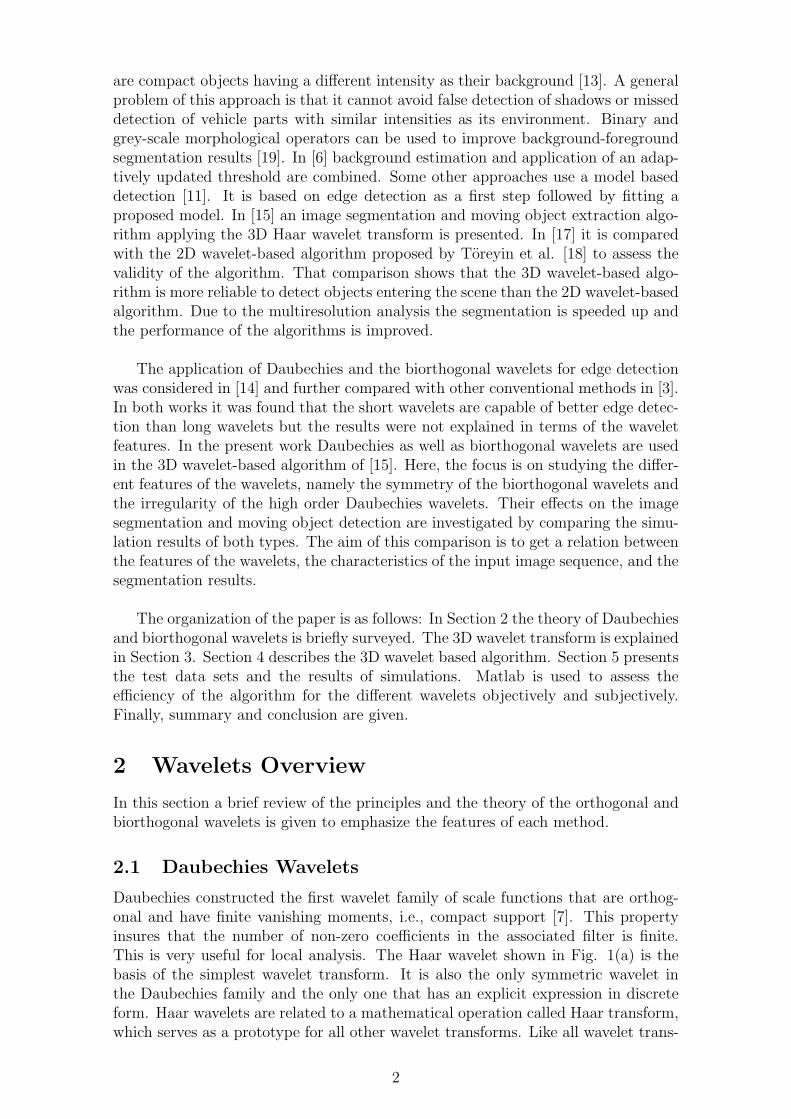
The analysis as proposed by Mallat [12] is done with some overlapping dependingon the number of the vanishing moments N , due to the independence between thelength of the wavelet function and the dyadic translation. The length of the associ-ated filter is 2N and the translation k of the wavelet during the dyadic analysis isdone in terms of the scale level j ∈ Z and not of the number of vanishing momentsN of the wavelet, i.e., k = 2jb, b ∈ Z. For example, for the Haar wavelet ψhaar thereis no overlapping at all because the translation step is equal to the width of thewavelet. However, for the wavelet ψdb2 the overlapping is equal to 2 sample points.Generally, for a wavelet of order N at scale j the length of the associated filter isconstant. Concerning the last discussion the detection of an event by higher orderwavelets takes longer than that by lower order. Fig. 2 shows a 1D signal that hasthree main events. The first event appears in the beginning of the signal in the formof a zigzag line, the second one consists of three sharp edges, and the last event isa wide edge with a slow transition. The detail coefficients of two levels of analysisshow that ψhaar has the ability to localize the event even in higher levels.
3
20 40 60 80 100 120
−5
0
5
10
15
The original signal with three events
20 40 60 80 100 120
−5
0
5
10
15
Details coefficients of Haar 1st level
20 40 60 80 100 120
−5
0
5
10
15
Details coefficients of DB4 1st level
20 40 60 80 100 120
−5
0
5
10
15
Details coefficients of DB8 1st level
(a)
20 40 60 80 100 120 140
−5
0
5
The original signal with three events
20 40 60 80 100 120 140
−5
0
5
Details coefficients of Haar 2nd level
20 40 60 80 100 120 140
−5
0
5
Details coefficients of DB4 2nd level
20 40 60 80 100 120 140
−5
0
5
Details coefficients of DB8 2nd level
(b)
Figure 2: Detail coefficients for a two level analysis by Haar, DB4, and DB8. Haarcoefficients detect all the rapid changes in the 1st level, while the detection of thewide edge lasts longer. Detection of events using the wavelets DB4 and DB8 comesshifted in position and distributed on a wider range.
2.2 Biorthogonal WaveletsIt is well known that bases that span a space do not have to be orthogonal. Inorder to gain greater flexibility in the construction of wavelet bases, the orthogonal-ity condition is relaxed allowing semi-orthogonal, biorthogonal or non-orthogonalwavelet bases. Biorthogonal Wavelets are families of compactly supported symmet-ric wavelets. The symmetry of the filter coefficients is often desirable since it resultsin linear phase of the transfer function. In the biorthogonal case, rather than hav-ing one scaling and wavelet function, there are two scaling functions φ, φ, that maygenerate different multiresolution analysis, and accordingly two different waveletfunctions ψ, ψ. ψ is used in the analysis and ψ is used in the synthesis. In addition,the scaling functions φ, φ and the wavelet functions ψ, ψ are related by duality inthe following sense: ∫
ψj,k(x)ψj,k(x)dx = 0 (1)
as soon as j 6= j or k 6= k and even.
∫φ0,k(x)φ0,k(x)dx = 0 (2)
as soon as k 6= k.
4
A theorem by Cohen, Daubechies and Fauveau [1] gives sufficient conditions forbuilding biorthogonal wavelets. The separation of analysis and synthesis is such thatthe useful properties for analysis (e.g., oscillations, zero moments) can be concen-trated on the ψ function. The interesting property for synthesis (regularity) whichis assigned to the ψ function has proven to be very useful.
The dual scaling and wavelet functions have the following properties:
1. They are zero outside of a segment.
2. The calculation algorithms are maintained, and thus very simple.
3. The associated filters are symmetrical.
4. The functions used in the calculations are easier to build numerically thanthose used in the Daubechies wavelets.
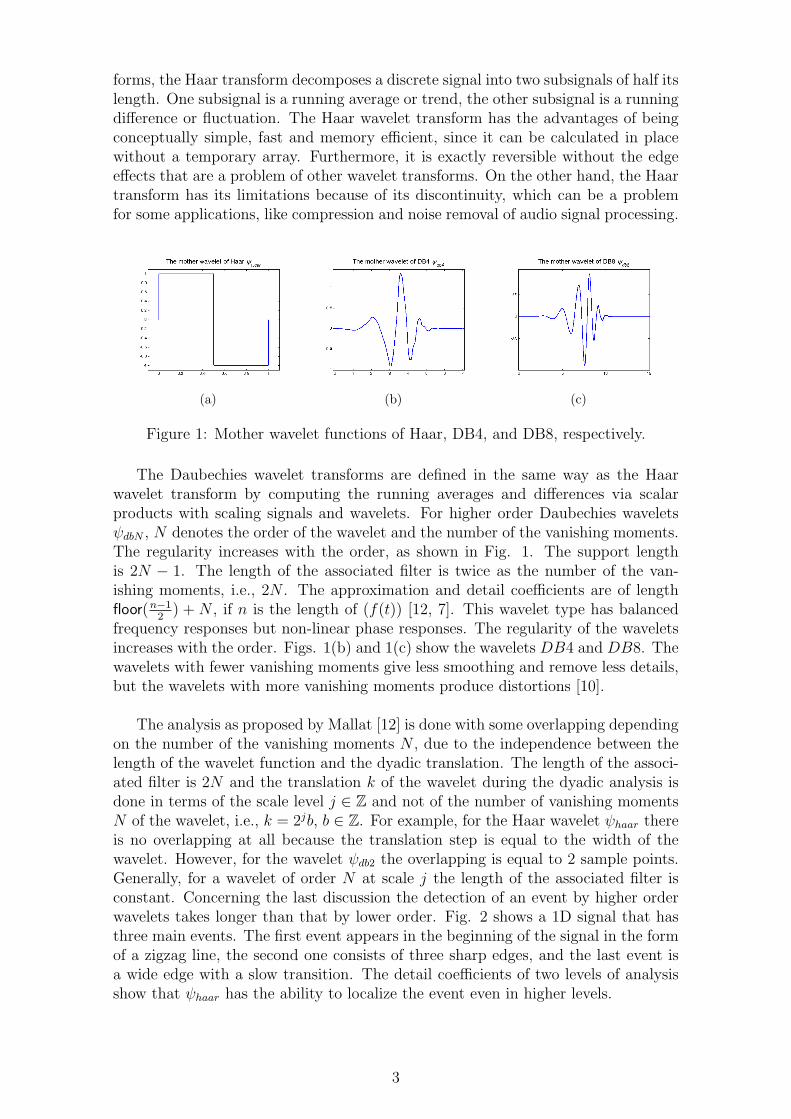
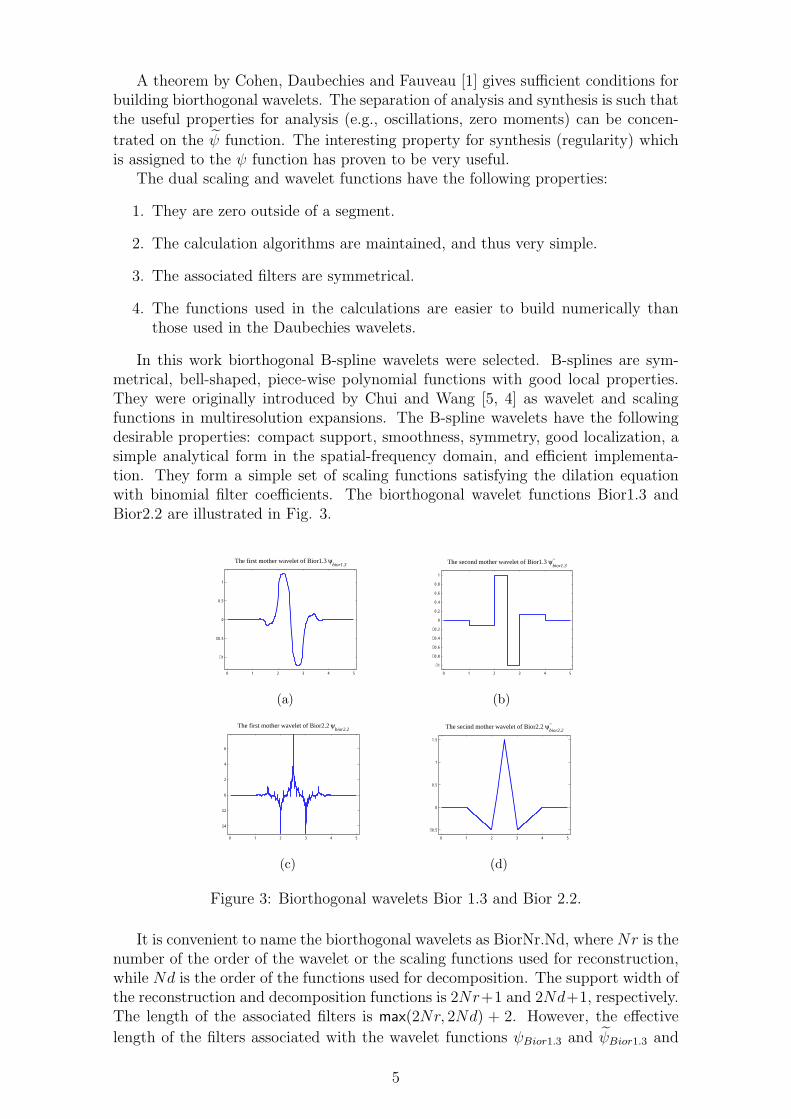
In this work biorthogonal B-spline wavelets were selected. B-splines are sym-metrical, bell-shaped, piece-wise polynomial functions with good local properties.They were originally introduced by Chui and Wang [5, 4] as wavelet and scalingfunctions in multiresolution expansions. The B-spline wavelets have the followingdesirable properties: compact support, smoothness, symmetry, good localization, asimple analytical form in the spatial-frequency domain, and efficient implementa-tion. They form a simple set of scaling functions satisfying the dilation equationwith binomial filter coefficients. The biorthogonal wavelet functions Bior1.3 andBior2.2 are illustrated in Fig. 3.
0 1 2 3 4 5
−1
−0.5
0
0.5
1
The first mother wavelet of Bior1.3 ψbior1.3
(a)
0 1 2 3 4 5
−1
−0.8
−0.6
−0.4
−0.2
0
0.2
0.4
0.6
0.8
1
The second mother wavelet of Bior1.3 ψ~bior1.3
(b)
0 1 2 3 4 5
−4
−2
0
2
4
6
The first mother wavelet of Bior2.2 ψbior2.2
(c)
0 1 2 3 4 5
−0.5
0
0.5
1
1.5
The secind mother wavelet of Bior2.2 ψ~bior2.2
(d)
Figure 3: Biorthogonal wavelets Bior 1.3 and Bior 2.2.
It is convenient to name the biorthogonal wavelets as BiorNr.Nd, where Nr is thenumber of the order of the wavelet or the scaling functions used for reconstruction,while Nd is the order of the functions used for decomposition. The support width ofthe reconstruction and decomposition functions is 2Nr+1 and 2Nd+1, respectively.The length of the associated filters is max(2Nr, 2Nd) + 2. However, the effectivelength of the filters associated with the wavelet functions ψBior1.3 and ψBior1.3 and
5
ψBior2.2 and ψBior2.2 is 2 and 3, respectively, and the effective length of the filtersassociated with the scaling functions φBior1.3 and φBior1.3 and φBior2.2 and φBior2.2 is6 and 5, respectively.Similar to the Daubechies wavelets, the analysis by the biorthogonal wavelets isdone with some overlapping based on the effective length of the filters, except forBior1.1, since it is the Haar wavelet.
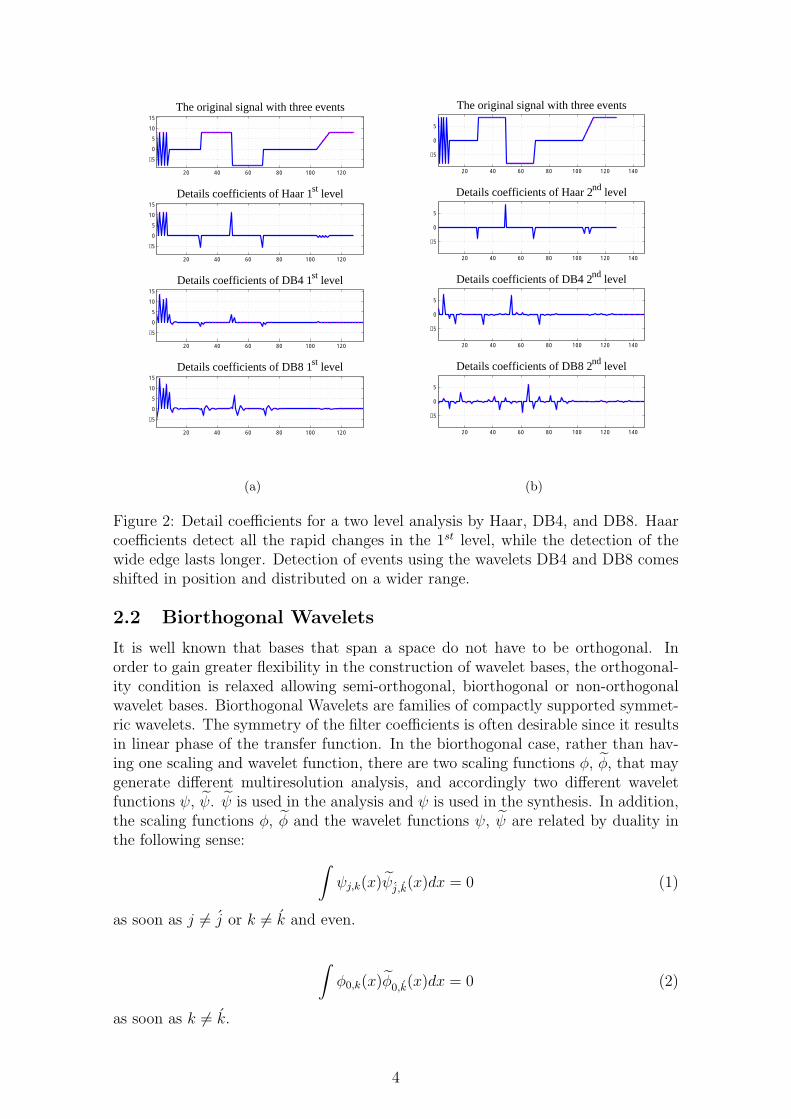
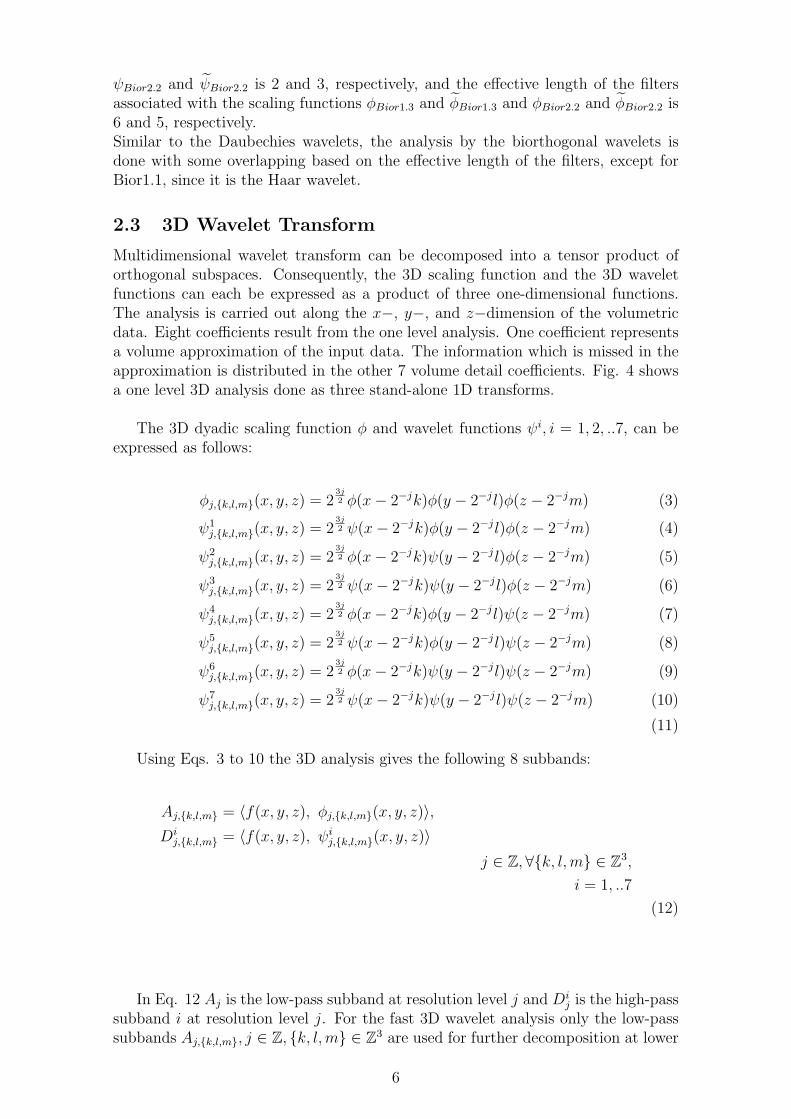
2.3 3D Wavelet TransformMultidimensional wavelet transform can be decomposed into a tensor product oforthogonal subspaces. Consequently, the 3D scaling function and the 3D waveletfunctions can each be expressed as a product of three one-dimensional functions.The analysis is carried out along the x−, y−, and z−dimension of the volumetricdata. Eight coefficients result from the one level analysis. One coefficient representsa volume approximation of the input data. The information which is missed in theapproximation is distributed in the other 7 volume detail coefficients. Fig. 4 showsa one level 3D analysis done as three stand-alone 1D transforms.
The 3D dyadic scaling function φ and wavelet functions ψi, i = 1, 2, ..7, can beexpressed as follows:
φj,{k,l,m}(x, y, z) = 23j2 φ(x− 2−jk)φ(y − 2−jl)φ(z − 2−jm) (3)
ψ1j,{k,l,m}(x, y, z) = 2
3j2 ψ(x− 2−jk)φ(y − 2−jl)φ(z − 2−jm) (4)
ψ2j,{k,l,m}(x, y, z) = 2
3j2 φ(x− 2−jk)ψ(y − 2−jl)φ(z − 2−jm) (5)
ψ3j,{k,l,m}(x, y, z) = 2
3j2 ψ(x− 2−jk)ψ(y − 2−jl)φ(z − 2−jm) (6)
ψ4j,{k,l,m}(x, y, z) = 2
3j2 φ(x− 2−jk)φ(y − 2−jl)ψ(z − 2−jm) (7)
ψ5j,{k,l,m}(x, y, z) = 2
3j2 ψ(x− 2−jk)φ(y − 2−jl)ψ(z − 2−jm) (8)
ψ6j,{k,l,m}(x, y, z) = 2
3j2 φ(x− 2−jk)ψ(y − 2−jl)ψ(z − 2−jm) (9)
ψ7j,{k,l,m}(x, y, z) = 2
3j2 ψ(x− 2−jk)ψ(y − 2−jl)ψ(z − 2−jm) (10)
(11)
Using Eqs. 3 to 10 the 3D analysis gives the following 8 subbands:
Aj,{k,l,m} = 〈f(x, y, z), φj,{k,l,m}(x, y, z)〉,Di
j,{k,l,m} = 〈f(x, y, z), ψij,{k,l,m}(x, y, z)〉
j ∈ Z,∀{k, l,m} ∈ Z3,
i = 1, ..7
(12)
In Eq. 12 Aj is the low-pass subband at resolution level j and Dij is the high-pass
subband i at resolution level j. For the fast 3D wavelet analysis only the low-passsubbands Aj,{k,l,m}, j ∈ Z, {k, l,m} ∈ Z3 are used for further decomposition at lower
6
resolution levels. Therefore, it requires only O(n) computations [8]. The subbandA is generated applying the scaling function φ to all the three dimensions of thedata. So it represents the approximation in all axes. It can be used to replace theoriginal data if no relevant changes occur. The subbands D1, D3, D5, and D7 arethe result of applying the wavelet function ψ on the x-axis. So all of them containinformation about the possible changes along the x-axis. Therefore, informationabout vertical edges can be easily obtained from such subbands. The subbandsD2, D3, D6, and D7 and the subbands D4, D5, D6, and D7 can be explained inthe same way as gradient information along the y-axis and z-axis, respectively. Ifthe z-axis represents the time dimension, then the differences can be interpreted asa temporal change of illumination. Because movement means a change in spatialdomains that follows the temporal change we think that the movement should berepresented with the subband D7.
x-axis
y-axis
z-axis
A D4 D2 D6 D1 D5 D3 D7
X
YZ
���� ����
Figure 4: 3D Wavelet analysis as three one-dimensional transforms.
2.4 The 3D Wavelet-based AlgorithmIn [15] a 3D wavelet-based algorithm for the detection of moving objects in a trafficsurveillance video was proposed. The 3D algorithm has the advantage of consideringthe relevant spatial as well as temporal information of the movement. A movement intime sequence images is a three-dimensional change, two spatial dimensions and thetime. Under this assumption, the detection of the moving objects is the answer tothe question where and when there is a change in the local and temporal information.
The algorithm benefits from the multiresolution characteristics of the waveletanalysis. The analysis of an image sequence is done in different resolution levels.This speeds up the processing and improves the performance of the segmentation. Inrecent years multiresolution representation of images has got significant attention.But it has not been widely used for segmentation of time sequence images.
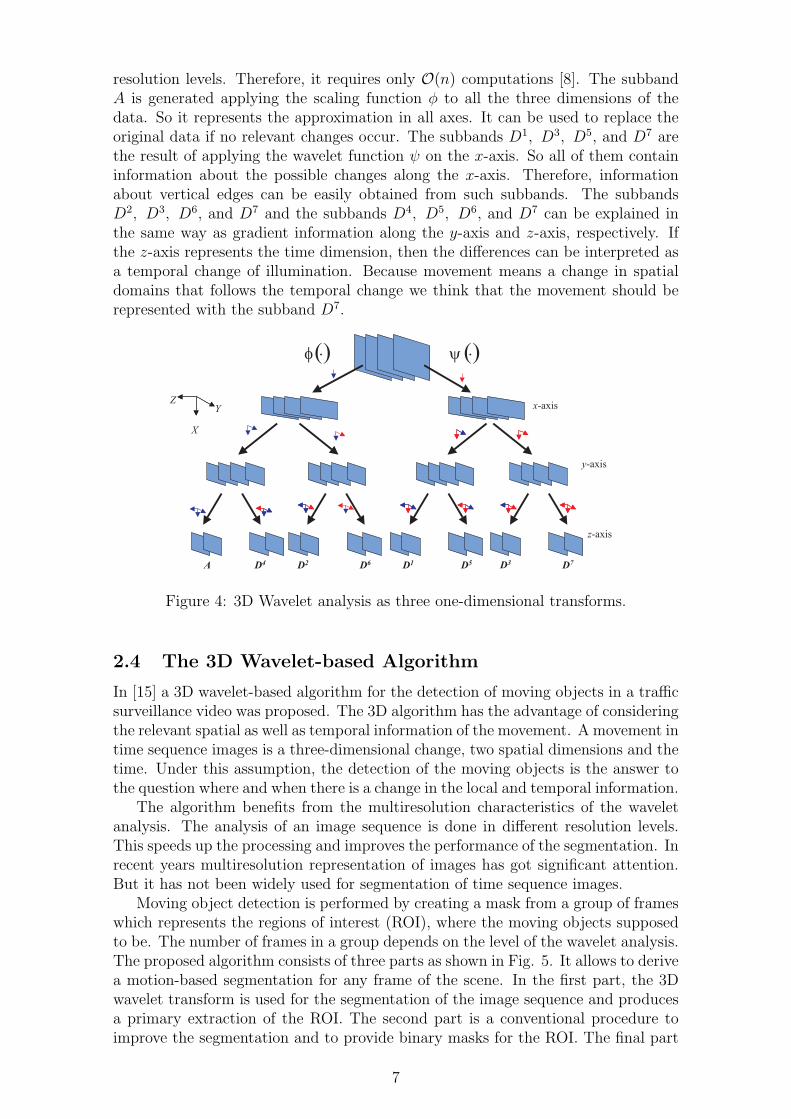
Moving object detection is performed by creating a mask from a group of frameswhich represents the regions of interest (ROI), where the moving objects supposedto be. The number of frames in a group depends on the level of the wavelet analysis.The proposed algorithm consists of three parts as shown in Fig. 5. It allows to derivea motion-based segmentation for any frame of the scene. In the first part, the 3Dwavelet transform is used for the segmentation of the image sequence and producesa primary extraction of the ROI. The second part is a conventional procedure toimprove the segmentation and to provide binary masks for the ROI. The final part
7
is a projection of the created masks onto the original images to extract the ROI inthe original resolution. The first part is the only part that is affected by the choiceof the wavelet function, therefore this is the only part described here.
The first and main part of the algorithm is the analysis of the input image se-quence by the 3D wavelet transform. The input sequence is divided into groupsof frames based on the analysis level. For the first level of the analysis only twoframes are analyzed at once. For further levels the number of frames is equal to2j, where j is the analysis level. As already shown in Fig. 4, the results of the 3Dwavelet transform are eight subbands, but only the subbands D4 and D7 are usedfor further processing. In general, the detail subbands have low intensity values.The subband D4 shows relative high intensity values where events have occurredin time, while the subband D7 shows events in all three dimensions. The subbandD7 represents a great part of the motion information in changes of the spatial andtemporal domains. But its results show only the borders of the moving objects. Ithas been found that combining D7 with other subbands improves the results. Thecombination with the subband D4 has been found to give the best results becauseit represents the change between the approximations of successive frames. It showsthe area where the movement occurs clearly. However, any changes in the pixelintensity between the processed frames also appear around the moving region sothat its results are very noisy and cannot be used alone to extract the region of mo-tion. That is why a simple average is used for the combination with the subband D7.
The output of this step is a sequence of images with low intensities. The imageshave their highest intensity values where the movements are occurring and valuesnear to zero otherwise. This step can be considered as a primary segmentation stepthat needs enhancements.
3 Simulation ResultsTo investigate the algorithm for the extraction of ROI many data sets were used andevaluated manually by a human operator. More statistical results and discussionabout the accuracy of the segmentation in comparison with other methods are givenin [15, 17].
In this paper the main objective is to compare the different wavelet types for theproposed application. Simulation results from four data sets are presented. All thedata sets were captured using a stationary video camera. A summarized descriptionof the data sets is shown in Table 1. The data sets can be categorized into two groupsdepending on the scene and the complexity of the movements. The first category,including set1 and set2, represents a simple scene of a front view with small cameraobservation angle to a street, where only a few cars are passing through. The secondcategory, including set3 and set4, represents a complex scene of a wide view of across, where almost all types of moving traffic objects are present. Fig. 6 showsexamples for both scenes.
For this study, a software program has been developed to enable a flexible ex-periment environment. The user is able to define the data set by giving the prefixname of the images and specifying the number of images and the starting serialnumber. It is assumed that all the images have the same prefix name and differonly by a postfix serial number. If the images are coloured, the tool converts themautomatically into grey level images. All the wavelets available in the MATLAB
8

Generating Binary Masks
Detection of Motion
Divide the sequence into group of frames
Input image
sequence
Combine two subbands Xj = avrg(Dj4, Dj
7)
Apply the 3D wavelet transform
d4
d7 x
After
thresholding
After
smoothing
After
dilation
Thresholding
Median filtering
Dilation operation
Ma
ny
levels
an
aly
sis
Level of the
extracted
regions
Level of
processing
Extraction of
ROI and
Active Traffic
Area
Figure 5: Block diagram of the 3D wavelet-based segmentation algorithm.
wavelet toolbox can be chosen by the user to perform the analysis for any givennumber of levels. The user can control the segmentation enhancement steps. Hecan choose different thresholding methods and decide which of the smoothing anddilation operations shall be performed and which filter setting should be chosen.The main feature of this program is that its commands can be put together andfurther modified to build the core of a toolbox for moving object detection in futurework.
Output of the algorithm is a sequence of images showing the extracted ROI inthe original resolution of the input images. For statistics and better presentationsthe ROIs are represented by their smallest bounding boxes. Generally, very smallregions were neglected and considered as noise. The error is measured as false alarmrate and missed object rate. The false alarm rate is the ratio of the boxes that con-tain no objects relative to the total number of bounding boxes. The missed objectrate is computed as the ratio of objects that are not contained in any box relativeto the total number of moving objects. For the first data set two levels of waveletanalysis were applied because of its size, while for the other data sets three levelsof analysis were applied. Tables 2 and 3 show the results of each data set at thedifferent levels using different wavelets in terms of false alarms and missing objectsrates.
9
(a) (b)
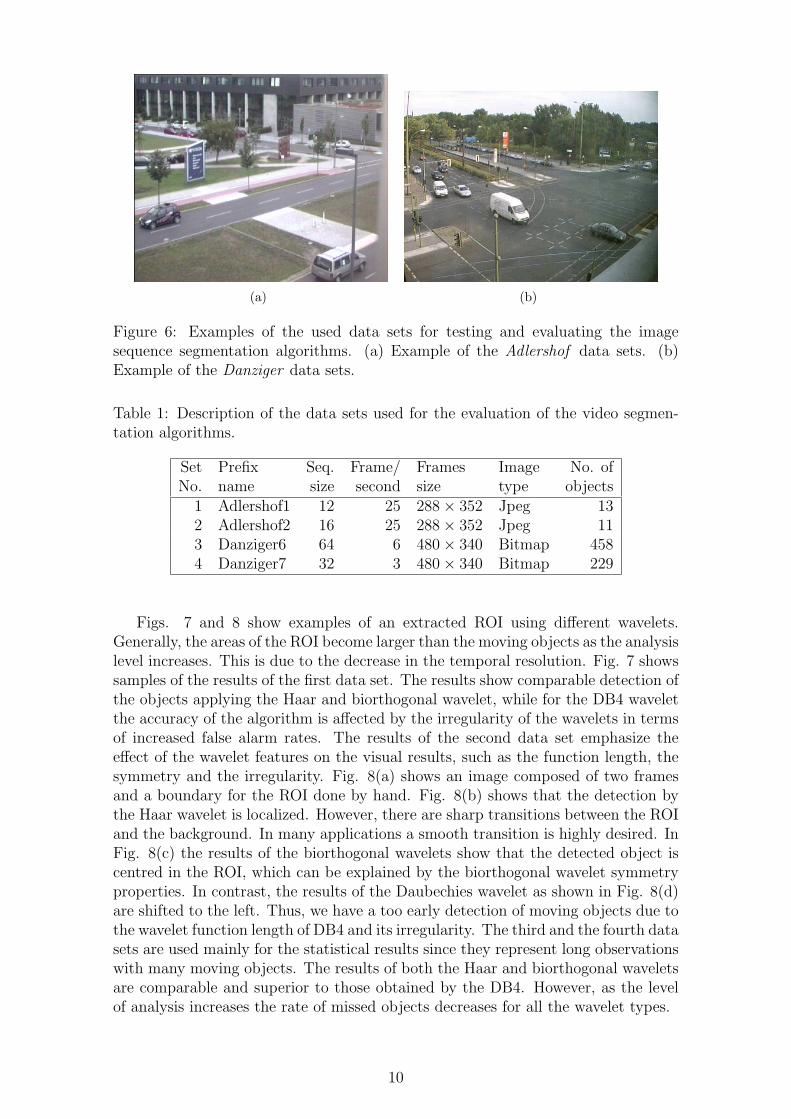
Figure 6: Examples of the used data sets for testing and evaluating the imagesequence segmentation algorithms. (a) Example of the Adlershof data sets. (b)Example of the Danziger data sets.
Table 1: Description of the data sets used for the evaluation of the video segmen-tation algorithms.
Set Prefix Seq. Frame/ Frames Image No. ofNo. name size second size type objects
1 Adlershof1 12 25 288× 352 Jpeg 132 Adlershof2 16 25 288× 352 Jpeg 113 Danziger6 64 6 480× 340 Bitmap 4584 Danziger7 32 3 480× 340 Bitmap 229
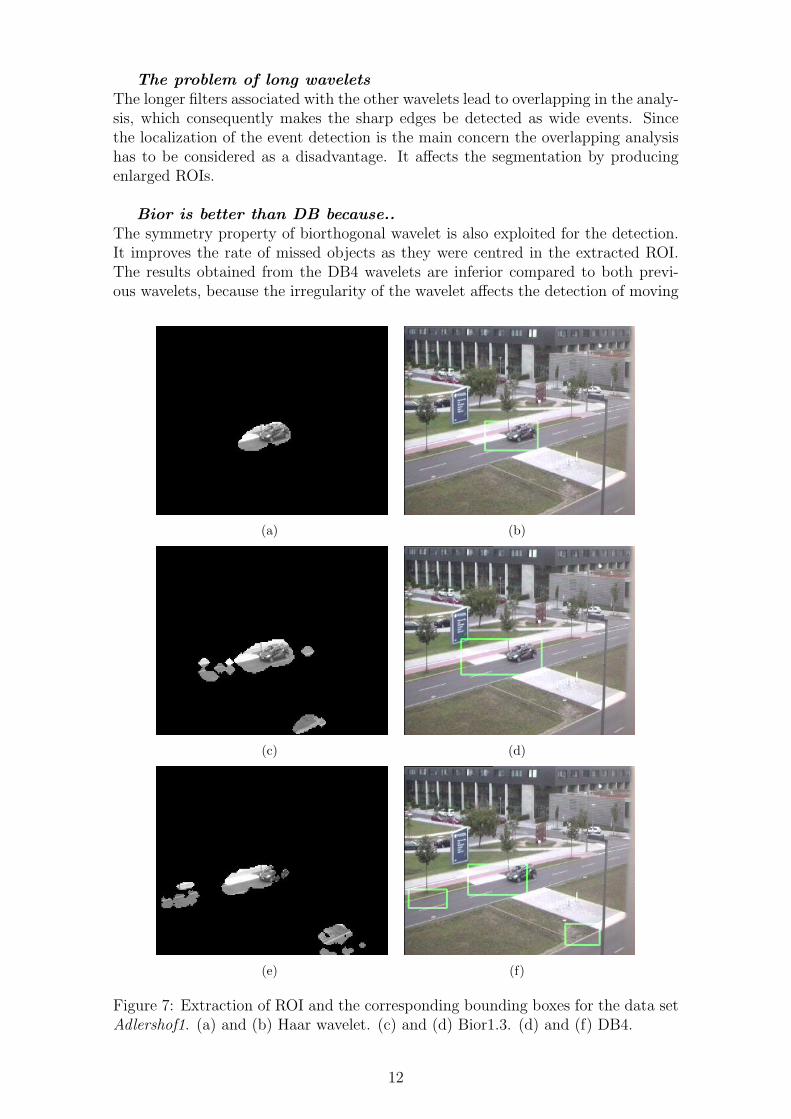
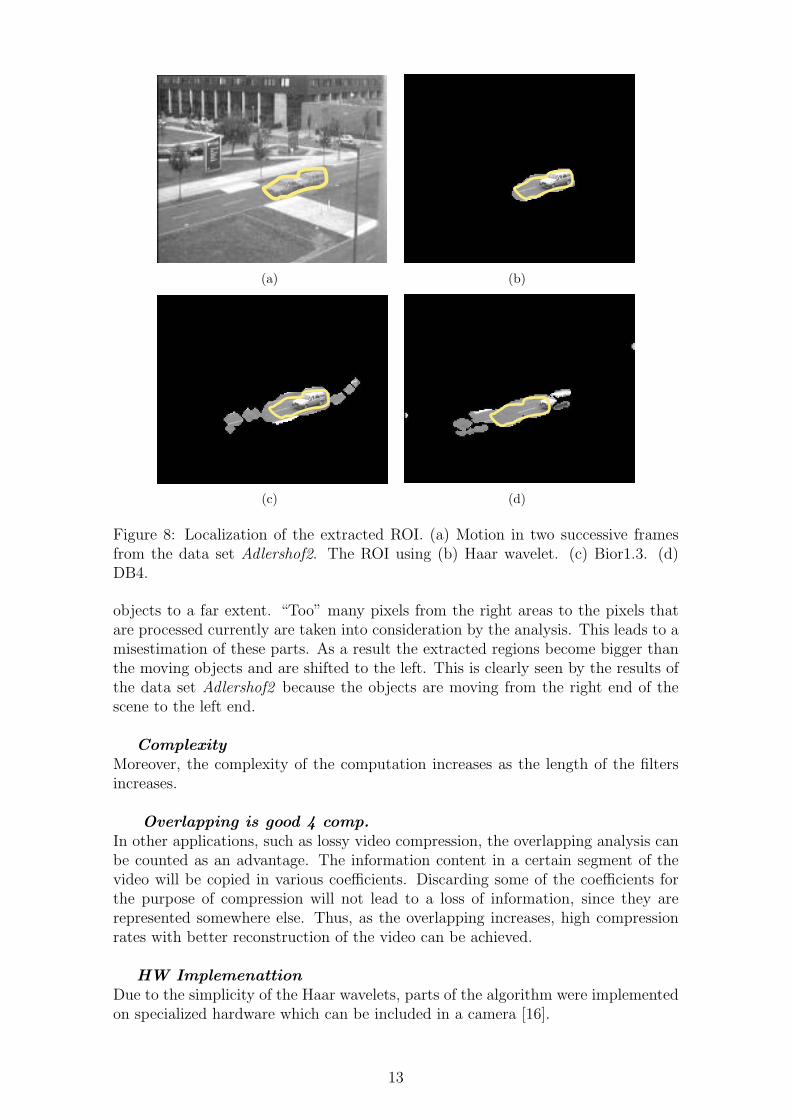
Figs. 7 and 8 show examples of an extracted ROI using different wavelets.Generally, the areas of the ROI become larger than the moving objects as the analysislevel increases. This is due to the decrease in the temporal resolution. Fig. 7 showssamples of the results of the first data set. The results show comparable detection ofthe objects applying the Haar and biorthogonal wavelet, while for the DB4 waveletthe accuracy of the algorithm is affected by the irregularity of the wavelets in termsof increased false alarm rates. The results of the second data set emphasize theeffect of the wavelet features on the visual results, such as the function length, thesymmetry and the irregularity. Fig. 8(a) shows an image composed of two framesand a boundary for the ROI done by hand. Fig. 8(b) shows that the detection bythe Haar wavelet is localized. However, there are sharp transitions between the ROIand the background. In many applications a smooth transition is highly desired. InFig. 8(c) the results of the biorthogonal wavelets show that the detected object iscentred in the ROI, which can be explained by the biorthogonal wavelet symmetryproperties. In contrast, the results of the Daubechies wavelet as shown in Fig. 8(d)are shifted to the left. Thus, we have a too early detection of moving objects due tothe wavelet function length of DB4 and its irregularity. The third and the fourth datasets are used mainly for the statistical results since they represent long observationswith many moving objects. The results of both the Haar and biorthogonal waveletsare comparable and superior to those obtained by the DB4. However, as the levelof analysis increases the rate of missed objects decreases for all the wavelet types.
10
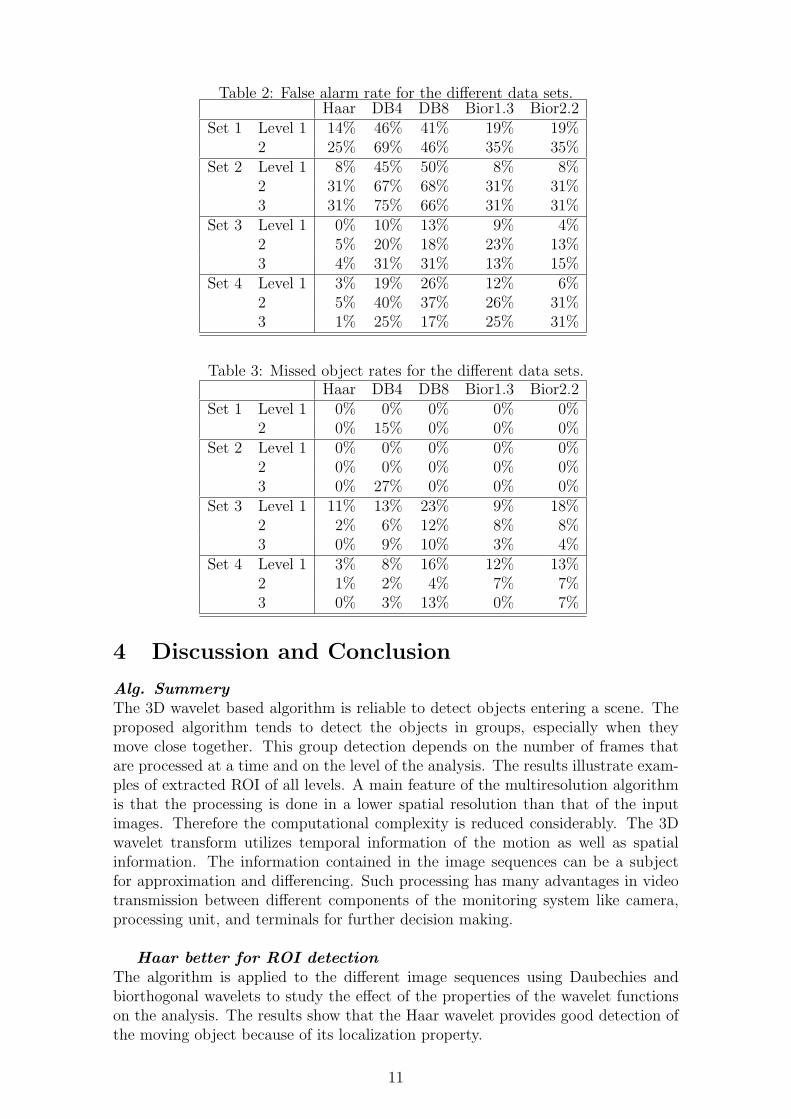
Table 2: False alarm rate for the different data sets.Haar DB4 DB8 Bior1.3 Bior2.2
Set 1 Level 1 14% 46% 41% 19% 19%2 25% 69% 46% 35% 35%
Set 2 Level 1 8% 45% 50% 8% 8%2 31% 67% 68% 31% 31%3 31% 75% 66% 31% 31%
Set 3 Level 1 0% 10% 13% 9% 4%2 5% 20% 18% 23% 13%3 4% 31% 31% 13% 15%
Set 4 Level 1 3% 19% 26% 12% 6%2 5% 40% 37% 26% 31%3 1% 25% 17% 25% 31%
Table 3: Missed object rates for the different data sets.Haar DB4 DB8 Bior1.3 Bior2.2
Set 1 Level 1 0% 0% 0% 0% 0%2 0% 15% 0% 0% 0%
Set 2 Level 1 0% 0% 0% 0% 0%2 0% 0% 0% 0% 0%3 0% 27% 0% 0% 0%
Set 3 Level 1 11% 13% 23% 9% 18%2 2% 6% 12% 8% 8%3 0% 9% 10% 3% 4%
Set 4 Level 1 3% 8% 16% 12% 13%2 1% 2% 4% 7% 7%3 0% 3% 13% 0% 7%
4 Discussion and ConclusionAlg. SummeryThe 3D wavelet based algorithm is reliable to detect objects entering a scene. Theproposed algorithm tends to detect the objects in groups, especially when theymove close together. This group detection depends on the number of frames thatare processed at a time and on the level of the analysis. The results illustrate exam-ples of extracted ROI of all levels. A main feature of the multiresolution algorithmis that the processing is done in a lower spatial resolution than that of the inputimages. Therefore the computational complexity is reduced considerably. The 3Dwavelet transform utilizes temporal information of the motion as well as spatialinformation. The information contained in the image sequences can be a subjectfor approximation and differencing. Such processing has many advantages in videotransmission between different components of the monitoring system like camera,processing unit, and terminals for further decision making.
Haar better for ROI detectionThe algorithm is applied to the different image sequences using Daubechies andbiorthogonal wavelets to study the effect of the properties of the wavelet functionson the analysis. The results show that the Haar wavelet provides good detection ofthe moving object because of its localization property.
11
The problem of long waveletsThe longer filters associated with the other wavelets lead to overlapping in the analy-sis, which consequently makes the sharp edges be detected as wide events. Sincethe localization of the event detection is the main concern the overlapping analysishas to be considered as a disadvantage. It affects the segmentation by producingenlarged ROIs.
Bior is better than DB because..The symmetry property of biorthogonal wavelet is also exploited for the detection.It improves the rate of missed objects as they were centred in the extracted ROI.The results obtained from the DB4 wavelets are inferior compared to both previ-ous wavelets, because the irregularity of the wavelet affects the detection of moving
(a) (b)
(c) (d)
(e) (f)
Figure 7: Extraction of ROI and the corresponding bounding boxes for the data setAdlershof1. (a) and (b) Haar wavelet. (c) and (d) Bior1.3. (d) and (f) DB4.
12
(a) (b)
(c) (d)
Figure 8: Localization of the extracted ROI. (a) Motion in two successive framesfrom the data set Adlershof2. The ROI using (b) Haar wavelet. (c) Bior1.3. (d)DB4.
objects to a far extent. “Too” many pixels from the right areas to the pixels thatare processed currently are taken into consideration by the analysis. This leads to amisestimation of these parts. As a result the extracted regions become bigger thanthe moving objects and are shifted to the left. This is clearly seen by the results ofthe data set Adlershof2 because the objects are moving from the right end of thescene to the left end.
ComplexityMoreover, the complexity of the computation increases as the length of the filtersincreases.
Overlapping is good 4 comp.In other applications, such as lossy video compression, the overlapping analysis canbe counted as an advantage. The information content in a certain segment of thevideo will be copied in various coefficients. Discarding some of the coefficients forthe purpose of compression will not lead to a loss of information, since they arerepresented somewhere else. Thus, as the overlapping increases, high compressionrates with better reconstruction of the video can be achieved.
HW ImplemenattionDue to the simplicity of the Haar wavelets, parts of the algorithm were implementedon specialized hardware which can be included in a camera [16].
13
References[1] J.-C. Feauveau A. Cohen, Ingrid Daubechies. Biorthogonal bases of com-
pactly supported wavelets. Communications on Pure and Applied Mathematics,45(5):485–560, 1992.
[2] M. Bramberger, J. Brunner, B. Rinner, and H. Schwabach. Real time videoanalysis on a smart camera for traffic surveillance. In 10th IEEE Real-Time andImbedded Technology and Applications Symposium (RTAS 04). IEEE ComputerSociety, 2004.
[3] Evelyn Brannock and Michael Weeks. Edge detection using wavelets. In ACM-SE 44: Proceedings of the 44th Annual Southeast Regional Conference, pages649–654, New York, NY, USA, 2006. ACM.
[4] Andrea Cavallaro. From Visual Information to Knowledge. PhD thesis, Lau-sanne, Switzerland, 2002.
[5] Charles K. Chui and Jian-Zhong Wang. On compactly supported splinewavelets and a duality principle. Transactions of the American Mathemati-cal Society, 330(2):903–915, 1992.
[6] R.T. Collins, A.J. Lipton, T. Kanade, H. Fujiyoshi, D. Duggins, Y. Tsin, D. Tol-liver, N. Enomoto, O. Hasegawa, P. Burt, and L. Wixson. A system for videosurveillance and monitoring. Technical Report CMURI-TR-00-12, CarnegieMellon University, 2000.
[7] Ingrid Daubechies. Ten Lectures on Wavelets. Society for Industrial and AppliedMathematics, 1992.
[8] Anca Dima. Computer Aided Image Segmentation and Graph Construction ofNerve Cells from 3D Confocal Microscopy Scan. PhD thesis, Technical Univer-sity Berlin, Department of Neuronal Information Processing, 2002.
[9] P.J. Figueroa, N.J. Leite, and R. Barros. Background recovering in outdoorimage sequences: An example of soccer players segmentation. Image and VisionComputing, 24(4):363–374, April 2006.
[10] Ashish Khare and Uma Shanker Tiwary. Soft-thresholding for denoising ofmedical images - a multiresolution approach. International Journal of Wavelets,Multiresolution and Information Processing, 3(4):477–496, April 2005.
[11] Z.W. Kim and J. Malik. Fast vehicle detection with probabilistic feature group-ing and its application to vehicle tracking. In IEEE International Conferenceon Computer Vision. IEEE Computer Society, 2003.
[12] Stéphane G. Mallat. A theory for multiresolution signal decomposition, thewavelet representation. IEEE Transaction on Pattern Analysis and MachineIntelligence, 2(7):674–693, 1989.
[13] Y. Park. Shape-resolving local thresholding for object detection. Pattern Recog-nition Letters, 22:883–890, 2001.
[14] Saleem, Touqir, and Siddiqui. Novel edge detection. In ITNG, pages 175–180,Los Alamitos, CA, USA, 2007. IEEE Computer Society.
14
[15] Mohammed A-Megeed Salem. Application of the 3D wavelet transform onlane extraction on traffic monitoring images. In Wavelets and Applications,wavE2006, Lausanne, Switzerland, July 10-14 2006.
[16] Mohammed A-Megeed Salem, Markus Appel, Frank Winkler, and Beate Mef-fert. FPGA-based smart camera for 3D wavelet-based image segmentation.In 2nd ACM/IEEE International Conference on Distributed Smart Cameras(ICDSC-08), Stanford, California, USA, September 7-11 2008. Stanford Uni-versity.
[17] Mohammed A-Megeed Salem and Beate Meffert. A comparison between 2D and3D wavelet-based segmentation for traffic monitoring systems. In 3rd Interna-tional Conference on Intelligent Computing and Information Systems, Cairo,Egypt, March 15-18 2007.
[18] B. Ugur Töreyin, A. Enis Cetin, Anil Aksay, and M. Bilgay Akhan. Mov-ing object detection in wavelet compressed video. Signal Processing: ImageCommunication, 20:255–264, March 2005.
[19] Y. Won, J. Nam, and B.-H. Lee. Image pattern recognition in natural environ-ment using morphological feature extraction. In SSPR & SPR 2000; F.J. Ferri(Ed.), pages 806–815, Berlin, 2001. Springer.
[20] Q. Zang and R. Klette. Object classification and tracking in video surveillance.In 10th International Conference of Computer Analysis of Images and Patterns,CAIP, volume 2756, pages 198–205, Groningen, The Netherlands, August 25-272003. Springer Berlin / Heidelberg.
15