david dean e friction refresh tunis ais 04jun15v3
TRANSCRIPT

Which Wheels to Grease? Reducing Friction in the Internet Economy
David R. Dean Africa Internet Summit Tunis, 4 June, 2015

ICANN e-friction Refresh AIS Tunis 04Jun15.pptx 1
Cop
yrig
ht ©
201
5 by
The
Bos
ton
Con
sulti
ng G
roup
, Inc
. All
right
s re
serv
ed.
Africa: 300 million people online—10 per cent of the global Internet population
Source: www.internetworldstats.com
But: 20 per cent of world’s offline population is in Africa
0
10
20
30
40
50
60
70
80
90
100
N. America Oceania Europe LatAm/Carib. Middle East Asia Africa
Online population by continent (%)
ICANN e-friction Refresh AIS Tunis 04Jun15.pptx 2
Cop
yrig
ht ©
201
5 by
The
Bos
ton
Con
sulti
ng G
roup
, Inc
. All
right
s re
serv
ed.
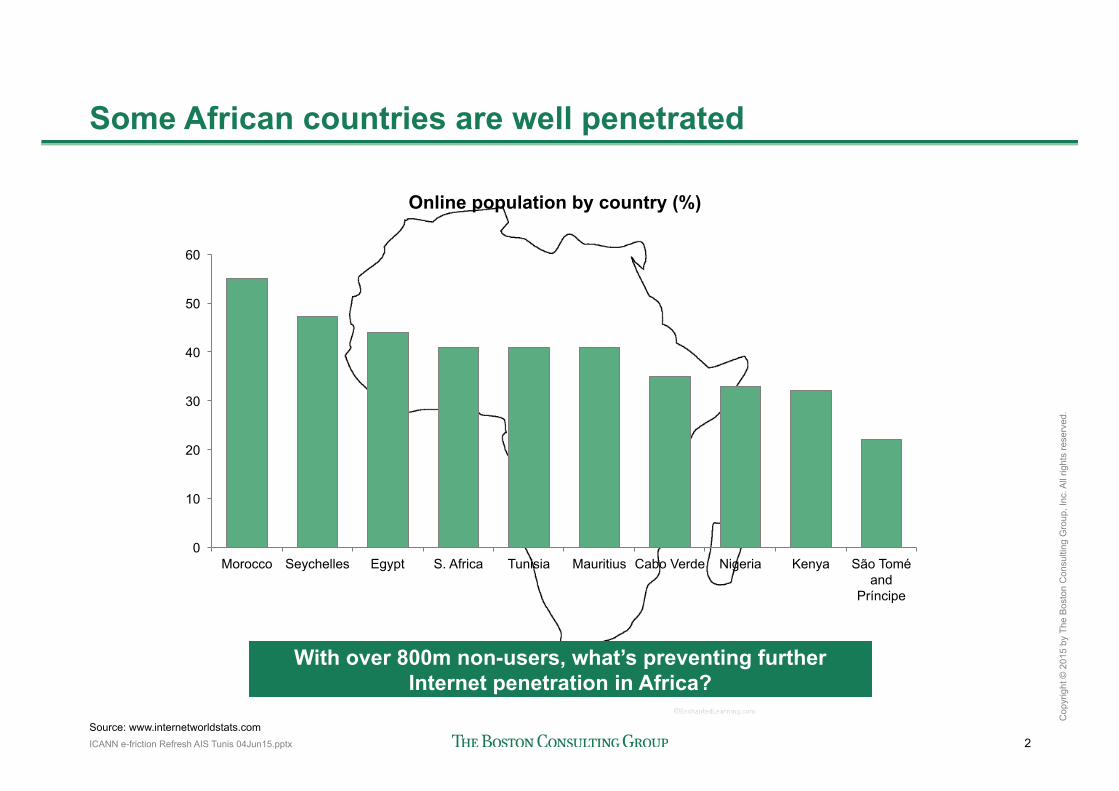
Some African countries are well penetrated
Source: www.internetworldstats.com
With over 800m non-users, what’s preventing further Internet penetration in Africa?
0
10
20
30
40
50
60
Morocco Seychelles Egypt S. Africa Tunisia Mauritius Cabo Verde Nigeria Kenya São Tomé and
Príncipe
Online population by country (%)
ICANN e-friction Refresh AIS Tunis 04Jun15.pptx 3
Cop
yrig
ht ©
201
5 by
The
Bos
ton
Con
sulti
ng G
roup
, Inc
. All
right
s re
serv
ed.
e-Friction: The Global Perspective

ICANN e-friction Refresh AIS Tunis 04Jun15.pptx 4
Cop
yrig
ht ©
201
5 by
The
Bos
ton
Con
sulti
ng G
roup
, Inc
. All
right
s re
serv
ed.
More users, traffic, and international capacity
Global Internet users (Bn) • 0.5 (2000) • 2.3 (2014) • 5.0 (2020)
Monthly Internet traffic per user • 10 MB (2000) • 5 GB (2013) • 14 GB (2018)
International bandwidth capacity • 14 Tbps (2008) • 137 Tbps (2014)
+12% p.a. +50% p.a.
+46% p.a.
Source: BCG Analysis

ICANN e-friction Refresh AIS Tunis 04Jun15.pptx 5
Cop
yrig
ht ©
201
5 by
The
Bos
ton
Con
sulti
ng G
roup
, Inc
. All
right
s re
serv
ed.
The Internet is no longer discretionary
… to social …
… to commerce and entertainment …
… to ubiquity From
academia …

ICANN e-friction Refresh AIS Tunis 04Jun15.pptx 6
Cop
yrig
ht ©
201
5 by
The
Bos
ton
Con
sulti
ng G
roup
, Inc
. All
right
s re
serv
ed.
The Internet is a pervasive, fast-growing economic force
0
+10.8%
Developing
Developed
2016
4.2
1.4
2.8
2010
2.3
0.5
1.7 1
2
5
G20 Internet economy (trillion $)
3
4
CAGR
8%
18%
Note: G20 countries only Source: EIU; Ovum; Gartner; Euromonitor; OECD; country-specific sources; BCG analysis
4.1% of GDP
5.3% of GDP

ICANN e-friction Refresh AIS Tunis 04Jun15.pptx 7
Cop
yrig
ht ©
201
5 by
The
Bos
ton
Con
sulti
ng G
roup
, Inc
. All
right
s re
serv
ed.
Some digital economies growing much faster than others
G-20 average: 4.1%
0
5
10
15
20
25
0 2 4 6 8 10
2010–16 e-GDP CAGR (%)
e-GDP as % of GDP, 2010
Spain Netherlands
Denmark
Sweden
Belgium
Indonesia
Turkey
Russia
Argentina
Brazil
Mexico
India
China
Italy
KSA
France
Canada Germany
Australia USA
Japan S. Korea
UK EU27
RSA
350
e-GDP: Internet contribution to GDP (US$B)
Developing Developed
G-20 average: 11%
Powering ahead
Pioneers
Catching up
Lagging behind
Source: EIU; Ovum; Gartner; Euromonitor; OECD; BCG analysis

ICANN e-friction Refresh AIS Tunis 04Jun15.pptx 8
Cop
yrig
ht ©
201
5 by
The
Bos
ton
Con
sulti
ng G
roup
, Inc
. All
right
s re
serv
ed.
Not for wider circulation beyond today's call
The Internet has multiple indirect impacts too
Consumer Surplus ca. €3-4k p.a. per user in many developed economies • Ca. 8-10x what consumers pay for the Internet several European countries • Ca. $3T in value globally
Research Online, Purchase Offline (ROPO), B2B, C2C • ROPO over $1.5T in G20 • ROPO up to 15-25% of retail sales in UK, USA, France and Germany
SMEs with heavy Internet use benefit significantly from the Internet • Grow 1.5-2x faster • Sell further afield, with ~50% higher exports – e.g. virtually all eBay sellers in Chile,
India and S. Africa export, vs. only 12-25% of offline sellers

ICANN e-friction Refresh AIS Tunis 04Jun15.pptx 9
Cop
yrig
ht ©
201
5 by
The
Bos
ton
Con
sulti
ng G
roup
, Inc
. All
right
s re
serv
ed.
The Internet economy is not frictionless
"Is there network coverage?"
"I don't speak Thai!"
"No connectivity ….."
"Can it be delivered here?"
"Can I trust online payments?"
"How much is this going to cost me?"
"Do I have an access device?"
"Will my bid go through in time?"

ICANN e-friction Refresh AIS Tunis 04Jun15.pptx 10
Cop
yrig
ht ©
201
5 by
The
Bos
ton
Con
sulti
ng G
roup
, Inc
. All
right
s re
serv
ed.
“e-Friction”: factors holding back the development of the Internet economy
Source: BCG e-Friction model
Infrastructure Weighted 3/6
Industry Weighted 1/6
Frictions holding back companies from adopting the Internet
Frictions related to the availability of content
Frictions deterring consumers from online activity
Frictions reducing opportunities to access the Internet

ICANN e-friction Refresh AIS Tunis 04Jun15.pptx 11
Cop
yrig
ht ©
201
5 by
The
Bos
ton
Con
sulti
ng G
roup
, Inc
. All
right
s re
serv
ed.
Infrastructure Information Industry Individuals
Infra
stru
ctur
e
Number of Wikipedia pages in home language (Wikipedia)
Number of micro messages made in home language, messages/day (Twitter)
Freedom of the press index, 0-100 (Reporters Without Borders)
Freedom on the Net, score 0-100 (Freedom House)
ONI transparency rating, 1-15 (Open Net Initiative)
Commitment to open data, 0-1 (Open Knowledge Foundation)
Info
rmat
ion
Volu
me
Indu
stry
Infra
Te
ch
Labo
ur
Cap
ital
Eco
nom
y
Quality of transport infra for physical fulfilment, 0-7 (WEF)
Quality of electricity and telephony infra, 0-7 (WEF)
ICT skills, 1-10 (IMD)
Quality of math and science education, 0-7 (WEF)
Availability of qualified engineers, 0-7 (WEF)
Capacity for innovation, 0-7 (WEF)
Firm-level technology absorption, 0-7 (WEF)
Business fixed broadband penetration, % (Pyramid Research)
Venture capital availability, 0-7 (WEF)
Financial market sophistication, 0-7 (WEF)
Financing through local equity market, 0-7 (WEF)
Ease of access to loans, 0-7 (WEF)
Foreign direct investment to GDP, ratio (WEF)
Strength of IP protection, 0-7 (WEF)
Burden of customs procedures, 0-7 (WEF)
Prevalence of trade barriers, 0-7 (WEF)
Number of days to set up a business (WEF)
Abi
lity
Ban
king
Quality of educational system, 0-7 (WEF)
Adult literacy rate, % (WEF)
ICT skills, 1-10 (IMD)
Consumer broadband penetration, % (Pyramid)
Availability of financial services, 0-7 (WEF)
Affordability of financial services, 0-7 (WEF)
Market penetration of bank accounts, % (WEF)
Acc
ess
Trus
t
Indi
vidu
als
Cyber security being adequately addressed, 1-10 (IMD)
Population using online personal finance, % (ComSc)
Debit card penetration, % (WEF)
Trust in privacy of credit card/financial data, survey score (BCG)
Trust in privacy of other personal data, survey score (BCG)
No. of domains registered to each ccTLD/cap (Google)
Obs
tacl
es
Atti
tude
s
Pay
men
ts
The components of e-Friction – 55 indicators S
peed
Peak fixed BB connection speed, Mbps (Akamai)
Peak mobile connection speed, Mbps (Akamai)
Average fixed BB connection speed, Mbps (Akamai)
Pric
e Fixed BB pricing, $/month at PPP (WEF) Mobile pricing, $/min local call off-net (peak) at PPP (IMD)
Arc
hite
ctur
e
Number of networks (ASNs)/cap (Potaroo)
Exchange points/capita (Euro-IX)
Existence of indep. regulator, 0-1 score (ITU)
Number of IPv4 registrations/capita (Potaroo) Number of IPv6 registrations/capita (Potaroo)
Traf
fic
International Internet bandwidth/cap (Telegeography)
International traffic volumes /capita, Mbps (Telegeography)
Traffic volumes/capita, Mbps (Cisco)
Average mobile connection speed, Mbps (Akamai)
Content registered to ccTLD hosted onshore, % (Pingdom)
Internet users, % of pop (World Bank)
Mobile Internet subscription penetration, % (Ovum)
Acc
ess
Internet bandwidth/capita (ITU)
Fraction of population using social networks, % (Comscore)
Source: BCG e-Friction model

ICANN e-friction Refresh AIS Tunis 04Jun15.pptx 12
Cop
yrig
ht ©
201
5 by
The
Bos
ton
Con
sulti
ng G
roup
, Inc
. All
right
s re
serv
ed.
e-Friction Index includes 65 countries Covering 92% of global economy and 81% of global population
Country e-Friction score
Infra-structure Industry Individual Infor-
mation 1. Sweden 14 15 15 10 16 2. Finland 17 21 16 8 14 3. Denmark 21 21 37 15 11 4. Switzerland 21 22 21 13 27 5. Hong Kong 21 18 9 22 43 6. United States 22 23 26 28 11 7. Iceland 22 17 34 36 14 8. Norway 23 25 26 14 20 9. Netherlands 25 28 21 13 30 10. Canada 25 32 28 13 15 11. Germany 26 28 35 17 18 12. United Kingdom 28 29 27 29 25 13. Austria 29 27 40 25 29 14. Australia 30 38 26 27 15 15. Singapore 31 30 9 25 66 16. Belgium 32 34 27 23 42 17. New Zealand 33 42 30 27 17 18. Ireland 34 34 41 36 24 19. France 34 38 33 26 32 20. Estonia 35 35 47 43 19 21. Japan 39 33 32 50 53 22. Israel 39 37 39 39 48 23. Qatar 40 51 19 23 44 24. UAE 41 45 25 33 49 25. Korea, Rep. 41 28 45 47 69 26. Slovenia 44 34 58 56 47 27. Bahrain 44 41 42 36 60 28. Malaysia 44 52 28 42 40 29. Poland 45 45 65 42 31 30. Portugal 45 43 43 49 51 31. Romania 46 29 81 70 35 32. Czech Republic 46 38 62 47 54
Country e-Friction score
Infra-structure Industry Individual Infor-
mation 33. Spain 47 46 52 43 51 34. Panama 48 42 39 57 65 35. Hungary 48 47 62 59 30 36. Italy 49 42 64 62 41 37. Bulgaria 53 39 71 76 55 38. Greece 53 49 65 65 43 39. Ukraine 54 45 77 74 33 40. Kuwait 56 55 73 53 47 41. Chile 57 60 44 55 61 42. Jordan 57 53 48 67 69 43. Russia 57 49 73 59 66 44. Saudi Arabia 58 54 36 54 92 45. Turkey 58 52 60 59 76 46. Kazakhstan 64 58 70 61 76 47. Philippines 64 71 61 65 43 48. Thailand 64 61 59 63 81 49. Argentina 67 61 91 76 53 50. South Africa 67 75 50 63 68 51. Mexico 68 66 69 79 59 52. Brazil 69 67 71 71 68 53. China 69 73 56 66 75 54. Morocco 70 72 58 76 73 55. Venezuela 71 66 88 80 58 56. Colombia 71 72 76 75 61 57. Kenya 71 80 71 68 51 58. India 73 79 52 71 77 59. Indonesia 74 78 56 75 78 60. Peru 75 79 71 84 55 61. Vietnam 75 69 73 82 87 62. Bangladesh 75 74 86 90 53 63. Egypt 76 78 77 92 55 64. Pakistan 82 79 72 89 92 65. Nigeria 82 89 77 86 59 Top Bottom - Quintiles
Note: Best e-Friction available is 0, worst is 100

ICANN e-friction Refresh AIS Tunis 04Jun15.pptx 13
Cop
yrig
ht ©
201
5 by
The
Bos
ton
Con
sulti
ng G
roup
, Inc
. All
right
s re
serv
ed.
Country e-Friction score
Infra-structure Industry Individual Infor-
mation 1. Sweden 14 15 15 10 16 2. Finland 17 21 16 8 14 3. Denmark 21 21 37 15 11 4. Switzerland 21 22 21 13 27 5. Hong Kong 21 18 9 22 43 6. United States 22 23 26 28 11 7. Iceland 22 17 34 36 14 8. Norway 23 25 26 14 20 9. Netherlands 25 28 21 13 30 10. Canada 25 32 28 13 15 11. Germany 26 28 35 17 18 12. United Kingdom 28 29 27 29 25 13. Austria 29 27 40 25 29 14. Australia 30 38 26 27 15 15. Singapore 31 30 9 25 66 16. Belgium 32 34 27 23 42 17. New Zealand 33 42 30 27 17 18. Ireland 34 34 41 36 24 19. France 34 38 33 26 32 20. Estonia 35 35 47 43 19 21. Japan 39 33 32 50 53 22. Israel 39 37 39 39 48 23. Qatar 40 51 19 23 44 24. UAE 41 45 25 33 49 25. Korea, Rep. 41 28 45 47 69 26. Slovenia 44 34 58 56 47 27. Bahrain 44 41 42 36 60 28. Malaysia 44 52 28 42 40 29. Poland 45 45 65 42 31 30. Portugal 45 43 43 49 51 31. Romania 46 29 81 70 35 32. Czech Republic 46 38 62 47 54
Country e-Friction score
Infra-structure Industry Individual Infor-
mation 33. Spain 47 46 52 43 51 34. Panama 48 42 39 57 65 35. Hungary 48 47 62 59 30 36. Italy 49 42 64 62 41 37. Bulgaria 53 39 71 76 55 38. Greece 53 49 65 65 43 39. Ukraine 54 45 77 74 33 40. Kuwait 56 55 73 53 47 41. Chile 57 60 44 55 61 42. Jordan 57 53 48 67 69 43. Russia 57 49 73 59 66 44. Saudi Arabia 58 54 36 54 92 45. Turkey 58 52 60 59 76 46. Kazakhstan 64 58 70 61 76 47. Philippines 64 71 61 65 43 48. Thailand 64 61 59 63 81 49. Argentina 67 61 91 76 53 50. South Africa 67 75 50 63 68 51. Mexico 68 66 69 79 59 52. Brazil 69 67 71 71 68 53. China 69 73 56 66 75 54. Morocco 70 72 58 76 73 55. Venezuela 71 66 88 80 58 56. Colombia 71 72 76 75 61 57. Kenya 71 80 71 68 51 58. India 73 79 52 71 77 59. Indonesia 74 78 56 75 78 60. Peru 75 79 71 84 55 61. Vietnam 75 69 73 82 87 62. Bangladesh 75 74 86 90 53 63. Egypt 76 78 77 92 55 64. Pakistan 82 79 72 89 92 65. Nigeria 82 89 77 86 59 Top Bottom - Quintiles
Note: Best e-Friction available is 0, worst is 100
So how do African countries perform?

ICANN e-friction Refresh AIS Tunis 04Jun15.pptx 14
Cop
yrig
ht ©
201
5 by
The
Bos
ton
Con
sulti
ng G
roup
, Inc
. All
right
s re
serv
ed.
Lower e-Friction – higher Internet penetration National Internet penetration vs. e-Friction score
Source: Digital, Social and Mobile 2015 – slide 17 – Quoted source: InternetLiveStats Q12015, InternetWorldStats Q12015. Wikipedia for population data.
0% 20% 40% 60% 80% 100%
Germany Hong Kong
National Internet penetration (%)
United Kingdom
United States
e-Friction score
Canada
United Arab Emirates
Singapore
Korea, Rep. Japan
France Australia
Spain
Poland Malaysia Italy
Turkey
Thailand
South Africa
Russia Philippines
Brazil Argentina
Vietnam Nigeria
Indonesia India
Egypt
Top Bottom - Quintiles
0
100
20
40
60
80
R2 = 0.76

ICANN e-friction Refresh AIS Tunis 04Jun15.pptx 15
Cop
yrig
ht ©
201
5 by
The
Bos
ton
Con
sulti
ng G
roup
, Inc
. All
right
s re
serv
ed.
Positive economic impact of lower e-Friction Relationship between size of digital economy and e-Friction
0%
8%
6%
70
4%
2%
50 0 10 20 30 40 80 60
Turkey
Sweden
South Africa Saudi Arabia Russia
Poland
Netherlands
Mexico
Korea, Rep. Japan
Italy
Indonesia
India
Hong Kong
Greece Germany
France
e-Friction score, 2013
Denmark
Czech Republic
China
Canada
Brazil Egypt
Australia
Argentina
2013 digital economy1 as % of GDP (est.)
United States
United Kingdom
Belgium
R2=0.60
Equivalent to 2.5 pts of the
overall economy
Bottom quintile e-Friction
Top quintile e-Friction
1. 2013 estimates interpolated from 2010 and 2011 actuals and 2016 forecasts; 2. in the 65 countries covered. Source: BCG e-GDP model, BCG e-Friction model
Significant impact "beyond GDP": "ROPO", consumer surplus, C2C, SME growth, etc.
>3.2 B unconnected people2
ICANN e-friction Refresh AIS Tunis 04Jun15.pptx 16
Cop
yrig
ht ©
201
5 by
The
Bos
ton
Con
sulti
ng G
roup
, Inc
. All
right
s re
serv
ed.
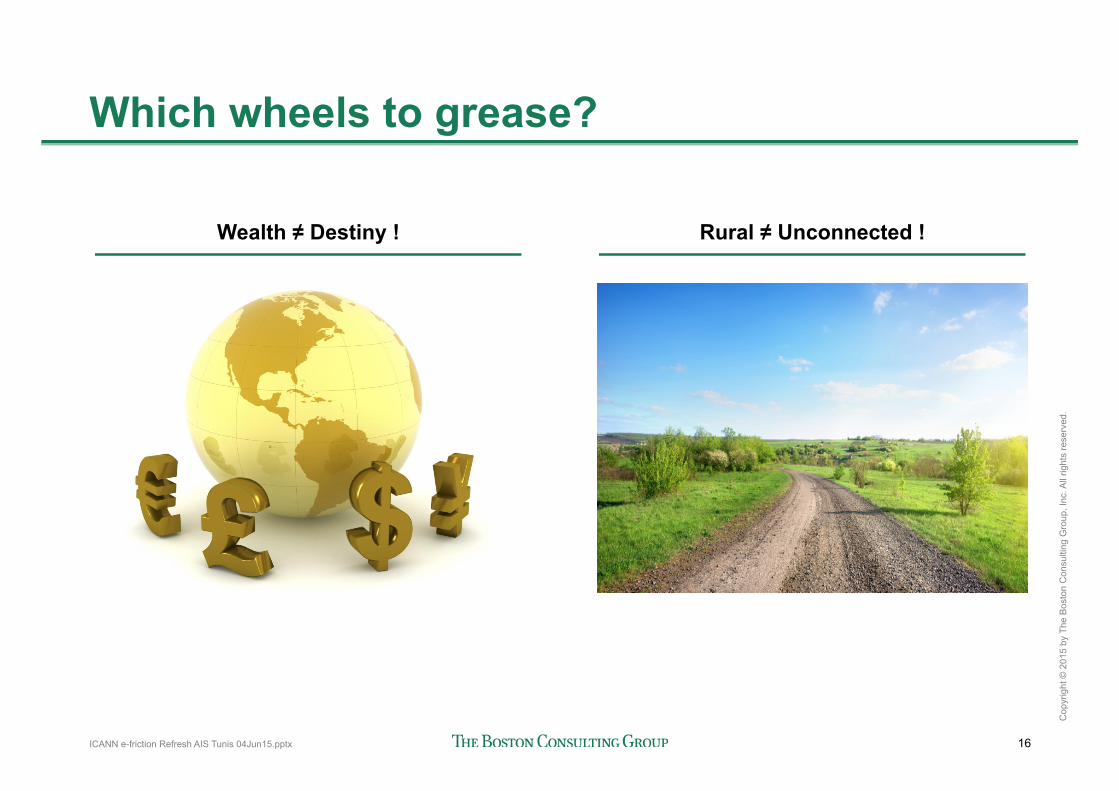
Which wheels to grease?
Wealth ≠ Destiny ! Rural ≠ Unconnected !

ICANN e-friction Refresh AIS Tunis 04Jun15.pptx 17
Cop
yrig
ht ©
201
5 by
The
Bos
ton
Con
sulti
ng G
roup
, Inc
. All
right
s re
serv
ed.
Richer countries tend to have lower e-Friction
10 100 1
e-Friction score
GDP per capita ('000 US$ - log scale)
0
100
20
40
60
80
GDP per capita vs. e-Friction score
Source: World Bank GDP per capita (current US$) year 2012; Bangladesh omitted on this chart as GDP per capita under $1,000
R2 = 0.63
But wealth is not necessarily destiny – widespread of e-Friction scores at each wealth level

ICANN e-friction Refresh AIS Tunis 04Jun15.pptx 18
Cop
yrig
ht ©
201
5 by
The
Bos
ton
Con
sulti
ng G
roup
, Inc
. All
right
s re
serv
ed.
Wealth is important, but doesn’t alone explain e-Friction
e-Friction score vs. GDP per capita
Source: World Bank GDP per capita (current US$) year 2012; Bangladesh omitted on this chart as GDP per capita under $1,000
How to reduce e-Friction in Developing Rural countries?
100 10 1
Jordan
Japan
Italy
Israel
Ireland
Indonesia
Iceland
Hungary
HK
Greece
Germany
France
Finland
Estonia
Egypt
Denmark
Czech Qatar
China
Chile
Canada
Bulgaria
Brazil
Belgium
Bahrain
Austria
Australia
Argentina
Russia
Colombia
Romania
Portugal Poland
Philippines
Peru
Panama
Pakistan
Norway
Nigeria
NZ NL
Morocco Mexico
Malaysia
Kuwait
e-Friction score
GDP per capita ('000 US$ - log scale)
Korea
Kenya Kazakhstan
Vietnam Venezuela
US
India
UAE
Ukraine
Turkey
Thailand
Switzerland
Sweden
Spain
SA
Slovenia Singapore
Saudi
UK
Well-oiled
Developing Rural Middle-Income Rural
Middle-Income Urban Aspirants
High-Income Aspirants
All-rounders 0
100
20
40
60
80
High-Income Overachievers Middle-Income
Overachievers ë
ë ë
ë

DDI - Working Group discussion 4_15January_vff.pptx 19
Approach to building rural infra can be different based on degree of urbanization and wealth of the country
Urban Environment
Wealth
Moderate GDP per Capita ($5-15k)
Rural
Potential priorities: — Leapfrog infrastructure (4G) — Spur local app ecosystems to drive
demand — Encourage enabling applications like
identity, payments Example case studies: — Philippines
Potential priorities: — Invest in enabling infrastructure (IXPs,
fiber-optics) — Engage SMEs in digital economy — Expand digital employment Example case studies: — China: Balance of mobile/fixed
infrastructure investment
Potential priorities: — Publicly fund basic infrastructure
access — Reduce connectivity costs — Provide remote eGov, eHealth,
eEducation services Example case studies: — Rwanda
Potential priorities: — Encourage private infrastructure
investment — Prove value of internet to encourage
adoption
Example case studies: — Malaysia PPP
Source: BCG Project “Delivering on Digital Infrastructure” for The World Economic Forum
Low GDP per Capita
(<$5k)
Rural connectivity

DIA - working session- Oct 514_v03.pptx 20
Choosing the right tech critical from a cost and service quality perspective
Urban area with backbone
Source: BCG Analysis, Filiago, Google, Facebook, BCG Project “Delivering on Digital Infrastructure” for The World Economic Forum
Rural area
Facebook Drone
Google Loon
Node
• Geo-stationary orbit • Middle earth orbit • Lower earth orbit
Satellite connectivity
Mobile/Fixed wireless
• Line of sight unit • Indoor unit
Fiber
• FTTN • FTTP
Fixe
d gr
ound
W
irele
ss
1k-3
6k k
m
Mob
ile/F
ixed
w
irele
ss, <
1km
Fiber
Copper
Legend Experimental Operational
Affordability, quality High Medium
Low Unknown

DIA - working session- Oct 514_v03.pptx 21
4G3
4G 4G1 4G2 4G1
2G 2G 2G 2G 2G 2G 2G 2G 2G/3G 2G
4G 4G 4G 4G 4G 4G 4G
2G/3G/ 4G 2G 2G 2G/3G
4G2
4G 4G 4G
2G 2G 2G/4G 2G/4G 2G 2G/3G 2G/4G 2G/4G 2G 2G/4G
3G/4G 3G 3G 3G 3G 3G 3G 4G3 4G 3G 3G/4G 3G 3G
2G/3G 2G/3G 2G/3G 2G/3G
4G 4G 4G
4G
3G
3G
3G/4G
3G/4G
4G
2G
4G
583 447 n/a 605 n/a 459 314 240 279 390 n/a n/a 190
Current spectrum snapshot shows potential for higher allocation and utilization across countries
Spectrum
"Coverage" frequencies (sub 1GHz)
"Capacity" frequencies
USA China Singap. India
Asia
S. Arabia U.A.E. Qatar
Middle East
Bolivia Colombia Brazil
Latin America
Angola S. Africa
Total mobile spectrum
700MHz
450MHz
900MHz
2.5GHz
1.9GHz
2.3GHz
Nigeria
Africa
3.5GHz
1.8GHz
2.1GHz
850MHz
800MHz
Refarming potential to increase network
capacity where spectrum becomes scarce resource
Ineffective roll out of allocated spectrum: US MNO have more
than 583MHz but only about 192MHz are in use. Thereof about
90% are used for 2G, 3G and 3.5G
Allocation and clearance of established mobile spectrum has high potential in
emerging markets (mostly locked in military and analog TV)
Spectrum allocated to high speed Spectrum allocated to low speed Spectrum not allocated to mobile
1. Announced to be auctioned 2. Partial coverage only (i.e., large cities) 3. Allocated to mobile but not deployed Note: 2.6GHz included in 2.5GHz; 1.7GHz included in 2.1GHz; For some countries total spectrum varies strongly by region or n/a Source: GSM Arena; BCG analysis, BCG Project “Delivering on Digital Infrastructure” for The World Economic Forum

ICANN e-friction Refresh AIS Tunis 04Jun15.pptx 22
Cop
yrig
ht ©
201
5 by
The
Bos
ton
Con
sulti
ng G
roup
, Inc
. All
right
s re
serv
ed.
Which wheels to grease beyond infrastructure?
Literacy
Local Content
ICT Skills

ICANN e-friction Refresh AIS Tunis 04Jun15.pptx 23
Cop
yrig
ht ©
201
5 by
The
Bos
ton
Con
sulti
ng G
roup
, Inc
. All
right
s re
serv
ed.
Higher literacy – lower e-Friction
Top Bottom - Quintiles
Illiteracy and e-Friction score by e-Friction quintile
0
100
20
40
60
80
Source: WEF GCI http://www.weforum.org/issues/competitiveness-0/gci2012-data-platform/ - 01/10/2013 - 2011 data
0.1 100 10 1
Sweden
Vietnam
Venezuela Peru
Pakistan Nigeria
Morocco Kenya
Indonesia
India
Egypt Colombia China
Norway
Japan Israel
Ireland France
Estonia Belgium
Malaysia
Italy Hungary
Greece
Czech Bulgaria
Bangladesh
US
NL Iceland
Germany
Finland Denmark
Canada
e-Friction score
Illiteracy (%) – log scale
UK
Switzerland
Austria
UAE Slovenia
Singapore
Qatar
NZ
Korea, Rep.
Bahrain
Turkey
Thailand
SA
Saudi Russia Philippines Mexico
Kuwait
Kazakhstan
Jordan Chile
Brazil Argentina
Australia
Ukraine
Spain Romania
Portugal
Poland Panama
Over 98 percent of illiterate people can be found in countries with high or very high e-Friction – with over 800 million in predominantly rural countries

ICANN e-friction Refresh AIS Tunis 04Jun15.pptx 24
Cop
yrig
ht ©
201
5 by
The
Bos
ton
Con
sulti
ng G
roup
, Inc
. All
right
s re
serv
ed.
Most illiterate people live in predominantly rural countries
20%
40%
60%
80%
100%
10 100 1 0.1
Switzerland
Israel
Ireland
France
Estonia
Belgium
Ukraine
Spain
Romania
Portugal Poland
Panama Malaysia
Italy
Hungary
Urban population (%)
Sweden Norway
Netherlands
Germany
Denmark
Austria
United Arab Emirates
Slovenia
Singapore
Qatar Japan
Greece
Czech Republic Bulgaria
Bahrain
Turkey
Thailand
South Africa
Saudi Arabia
Russia
Philippines
Mexico
Illiteracy (%-log scale)
Kazakhstan
Jordan Chile
Brazil
Argentina
Vietnam
Venezuela
Peru
Pakistan
Kuwait
Morocco
Kenya
Indonesia
India
Egypt
Colombia
China
Bangladesh
United Kingdom
Nigeria
Top Bottom - Quintiles
Illiteracy rate (log scale) vs Urban population (%)
Sources: e-Friction component scores from BCG e-Friction model Literacy rate from: WEF GCI http://www.weforum.org/issues/competitiveness-0/gci2012-data-platform/ - 01/10/2013 - 2011 data Urban population %: from Euromonitor and are 2012 numbers
Over 800m illiterate people

ICANN e-friction Refresh AIS Tunis 04Jun15.pptx 25
Cop
yrig
ht ©
201
5 by
The
Bos
ton
Con
sulti
ng G
roup
, Inc
. All
right
s re
serv
ed.
Is English proficiency a pre-requisite for low e-Friction?
35 40 45 50 55 60 65 70
Poland
Peru
Portugal
Qatar Romania
Panama
Russia
Indonesia India
Hungary
Germany
France
Norway Netherlands
Morocco Mexico
Malaysia
English Proficiency1
e-Friction score
Vietnam
Venezuela
Ukraine
Turkey
Thailand
Switzerland
Sweden
Kuwait
Kazakhstan
Jordan
Japan
Italy
Slovenia
Saudi
Spain
Singapore
Finland
Estonia
Egypt
Denmark
Czech
Colombia
Argentina China
Chile
Brazil
Belgium Austria
Top Bottom - Quintiles
English proficiency and e-Friction score
0
20
40
60
80
Source: 1. EF English Proficiency Index 2014
R2 = 0.53
Two interventions possible: creation of more local language content, and/or development of English-language skills

ICANN e-friction Refresh AIS Tunis 04Jun15.pptx 26
Cop
yrig
ht ©
201
5 by
The
Bos
ton
Con
sulti
ng G
roup
, Inc
. All
right
s re
serv
ed.
Key messages so far
A high share of the global population is in countries with above average e-Friction • 80 percent of the global population, but over 90 percent of the global offline
population
Countries in the top quintile have digital economies that are, on average, 2.5 percentage points larger than those in the bottom quintile • A conservative indication of the Internet’s impact, given that much impact is “beyond
GDP”
Some countries “get it right” on all components of e-Friction • Most have quite variable performance across the four components of e-Friction
Important to recognize that there is no “silver bullet” for capturing the Internet’s impact • Many levers need addressing simultaneously and in a coordinated manner

ICANN e-friction Refresh AIS Tunis 04Jun15.pptx 27
Cop
yrig
ht ©
201
5 by
The
Bos
ton
Con
sulti
ng G
roup
, Inc
. All
right
s re
serv
ed.
e-Friction: The SME Perspective

ICANN e-friction Refresh AIS Tunis 04Jun15.pptx 28
Cop
yrig
ht ©
201
5 by
The
Bos
ton
Con
sulti
ng G
roup
, Inc
. All
right
s re
serv
ed.
Greasing the wheels to get SMEs online
Sonitus Engenharia: Brazilian automotive engineering company: Growth through
online tools–Flavio Quintela
Dowhile: S. African graphics company: Online marketing & training
–Dennis Ngwepe

ICANN e-friction Refresh AIS Tunis 04Jun15.pptx 29
Cop
yrig
ht ©
201
5 by
The
Bos
ton
Con
sulti
ng G
roup
, Inc
. All
right
s re
serv
ed.
+7%
-30369121518212427303336394245%
The Internet helps SMEs grow their revenues
Higher e-Friction
Lower e-Friction
Average
Past three years Cumulative revenue growth
Heavy web use
+18%
Med / light web use
+11%
Source: BCG SME Internet e-Friction survey 2013
In addition, extended geographical reach of sales – Higher domestic coverage and higher international sales

ICANN e-friction Refresh AIS Tunis 04Jun15.pptx 30
Cop
yrig
ht ©
201
5 by
The
Bos
ton
Con
sulti
ng G
roup
, Inc
. All
right
s re
serv
ed.
0
25
50
75
100
City
93% 97%
Neighbour- hood
Med/light web use
Heavy web use
World
13%
22%
Country
48%
58%
Region
71%
81%
% of SMEs +6%
+17%
+34%
+49%
0
25
50
75
100
Heavy web use
Region
65%
77%
City
90% 96%
% of SMEs
Neighbour- hood
World
12% 18%
Country
40%
53%
Med/light web use
The Internet helps SMEs extend their geographical reach
Geographical reach of sales Geographical reach of purchases
+5%
+14%
+23%
+63%
Source: BCG SME Internet e-Friction survey 2013

ICANN e-friction Refresh AIS Tunis 04Jun15.pptx 31
Cop
yrig
ht ©
201
5 by
The
Bos
ton
Con
sulti
ng G
roup
, Inc
. All
right
s re
serv
ed.
Reducing e-Friction essential to help SMEs do more online
Indu
stry
In
divi
dual
s In
fras
truc
ture
35%36%
47%48%43%46%
30%28%31%30%
36%33%31%
42%45%
38%52%
57%23%
31%39%40%
44%57%
42%43%40%
48%54%Difficulty to obtain a website domain 22%
Cost to obtain a website domain 26% Choice of online tools providers 27%
Complexity to set up and maintain a website 29% Cost to set up and maintain a website 30%
Customers interest to interact via website 23% Customers’ skills to be online 28%
Customers ownership of tools to be online 30% Safety to store our data or sell online 31%
Consumer trust in online payment systems 38% Belief in safety of personal data online 51%
Employees access to computers 23% Belief in Internet’s contribution to the business 25%
Willingness to buy online due to return policy 30% Staff preparedness for online activities 30%
Company’s fund to further develop the online offer 30% Reliability of intellectual property rights online 33%
Offline infrastructure to support online sales 34% Hiring of managers for online activities 35%
Availability of market funding for online offer 36% Availability of industry support group 37%
Supportive regulations to encourage online sales 37% Process to start a new business 41%
Reliability of Internet service providers 24% Choice of internet providers 27%
Cost of internet access 27% Quality of internet connection 28% Regulations to operate online 31%
Cost of access to tools to be online 32%
Info
r-m
atio
n
SMEs' view on e-Frictions within their country
Problem Neutral No problem
Source: BCG SME Internet e-Friction survey 2013
ICANN e-friction Refresh AIS Tunis 04Jun15.pptx 32
Cop
yrig
ht ©
201
5 by
The
Bos
ton
Con
sulti
ng G
roup
, Inc
. All
right
s re
serv
ed.
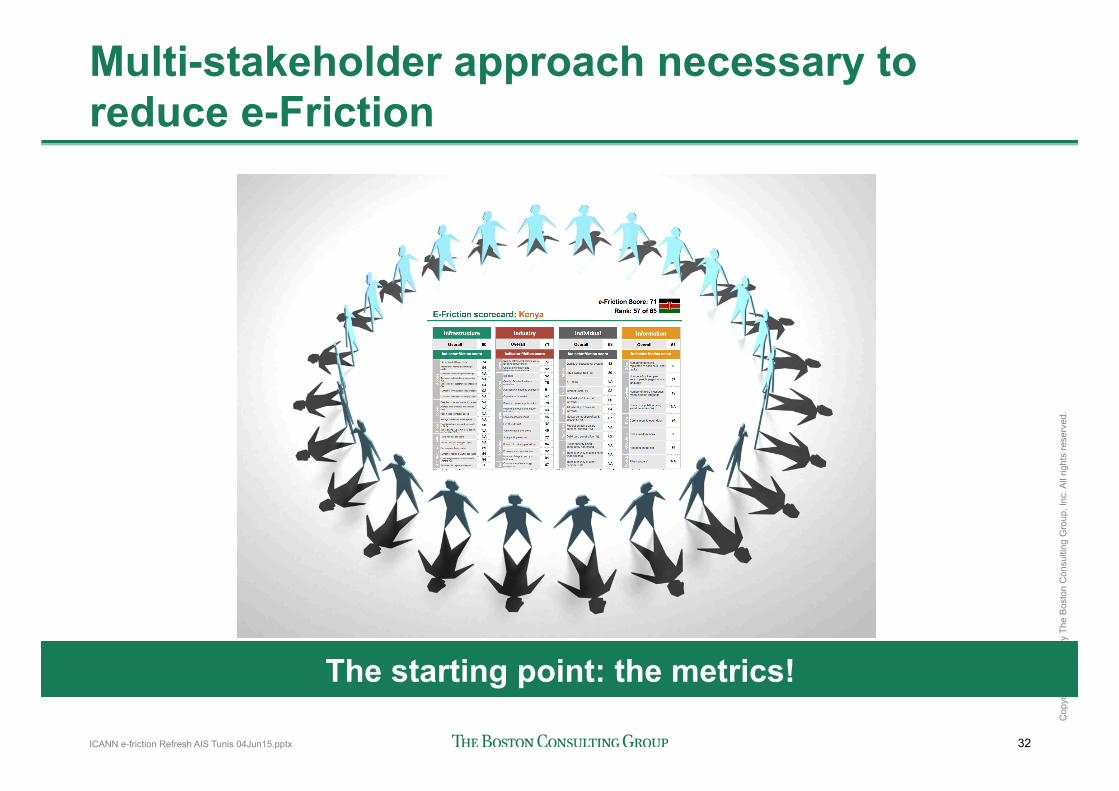
Multi-stakeholder approach necessary to reduce e-Friction
The starting point: the metrics!

ICANN e-friction Refresh AIS Tunis 04Jun15.pptx 33
Cop
yrig
ht ©
201
5 by
The
Bos
ton
Con
sulti
ng G
roup
, Inc
. All
right
s re
serv
ed.
Reducing e-Friction across Africa can deliver enormous potential
An Internet economy of 5 per cent of GDP • An additional $100B for the continent’s economy • Many indirect benefits too
Another 500 million people online
• $150-250B in consumer surplus Investment in skills
• ca. 20 million jobs created for each percentage point increase in the size of the Internet economy
Social benefits
• Access to health, education, financial services, etc. Trade
• Increasingly, the Internet drives cross-border and international trade

ICANN e-friction Refresh AIS Tunis 04Jun15.pptx 34
Cop
yrig
ht ©
201
5 by
The
Bos
ton
Con
sulti
ng G
roup
, Inc
. All
right
s re
serv
ed.
“Which Wheels to Grease?” An Agenda for policy makers
§ Do not see "wealth as destiny": many levers exist to reduce e-Friction, whatever the level of GDP
§ Innovate in infrastructure deployment: affordable infrastructure for low population density areas requires new technologies, business models and policies
§ Drive for literacy: basic literacy, English-language skills and ICT skills all help reduce e-Friction
§ Encourage local relevance: local content in local languages drives usage, requiring encouragement of local ecosystems, including e-government services
§ Get companies online: SMEs that use the Internet intensively grow faster, employ more people than those that don’t, and trade more internationally
§ Encourage “joined-up” policy making: drive for multi-stakeholder involvement from across the ecosystem and learnings from relevant peers
1
2
3
4
5
6

ICANN e-friction Refresh AIS Tunis 04Jun15.pptx 35
Cop
yrig
ht ©
201
5 by
The
Bos
ton
Con
sulti
ng G
roup
, Inc
. All
right
s re
serv
ed.
Where to find the reports
BCG’s website: http://tinyurl.com/o65xoob http://tinyurl.com/pe3gjc5 ICANN’s website: http://tinyurl.com/n9lw5kg

Thank you
bcg.com | bcgperspectives.com

ICANN e-friction Refresh AIS Tunis 04Jun15.pptx 37
Cop
yrig
ht ©
201
5 by
The
Bos
ton
Con
sulti
ng G
roup
, Inc
. All
right
s re
serv
ed.
Extra Slides

ICANN e-friction Refresh AIS Tunis 04Jun15.pptx 38
Cop
yrig
ht ©
201
5 by
The
Bos
ton
Con
sulti
ng G
roup
, Inc
. All
right
s re
serv
ed.
E-Friction scorecard: Egypt
Infrastructure
Overall 78
Indicator friction score
Acc
ess
Internet bandwidth per capita 92 International Internet bandwidth per capita 89 Consumer broadband penetration (%) 91 Business fixed broadband penetration (%) 89 Mobile internet subscription penetration (%) 88 Number of IPv4 registrations per capita 84 Number of IPv6 registrations per capita 92
Spe
ed
Peak fixed broaband connection speed 96 Average fixed broadband connection speed 100 Peak mobile connection speed 90 Average mobile connection speed 100
Pric
e Fixed broadband pricing ($ per month at PPP) 10 Mobile pricing ($ per min local call off-net (peak) at PPP) NA
Traf
fic
Traffic volumes per capita NA International traffic vols per capita NA
Arc
hite
ctur
e Exchange points per capita 86 Number of networks (ASNs) per capita 91 Content registered to cc'TLD hosted onshore (%) 58 Existence of independent regulator* 1
Industry
Overall 77
Indicator friction score
Infra
Quality of transport infrastructure for physical fulfillment 78 Quality of electricity and telephony infrastructure 91
Labo
ur
ICT skills NA Quality of maths & science education 98
Availability of qualified engineers 58
Capacity for innovation 92
Cap
ital
Financial market sophistication* 81 Financing through local equity market 53
Ease of access to loans 78
FDI to GDP ratio NA
Venture capital availability 52
Eco
nom
y
Strength IP protection 80
Burden of customs procedures 78
Prevalence of trade barriers 97 Number of days to set up a business 47
Tech
Company-level technology absorption 86
Individual
Overall 92
Indicator friction score
Abi
lity
Quality of educational system 98
Adult literacy rate (%) 92
ICT skills NA
Acc
ss
Internet users (%) 76
Ban
king
Availability of financial services 95
Affordability of financial services 88
Market penetration of bank accounts (%) 100
Pay
men
ts
Population using online personal finance (%) NA
Debit card penetration (%) 96 Tr
ust
Cyber security being adequately addressed NA
Trust in privacy of credit card/financial data NA
Trust in privacy of other personal data NA
Information
Overall 55
Indicator friction score
Site
s Number of domains registered to each ccTLD per capita
81
Con
tent
Number of online open encyclopaedia pages in local language
31
Number of micro messages made in home language* 8
Share of population using social networks (%) NA
Dat
a
Commitment to open data 83
Obj
ectiv
ity
Press freedom index 91
Freedom on the net 81
Obs
tcls
Filtering score* 1
e-Friction Score: 76
Notes: the best e-Friction score a country can achieve on any given indicator is 0 while the worse is 100, * some variables are in a discrete scale with several countries sharing an equal ranking Source: BCG e-Friction model. Found in BCG Perspectives "Greasing the Wheels of the Internet Economy: a Country by Country e-Friction Analysis"
Rank: 63 of 65

ICANN e-friction Refresh AIS Tunis 04Jun15.pptx 39
Cop
yrig
ht ©
201
5 by
The
Bos
ton
Con
sulti
ng G
roup
, Inc
. All
right
s re
serv
ed.
E-Friction scorecard: Kenya
Infrastructure
Overall 80
Indicator friction score
Acc
ess
Internet bandwidth per capita 74 International Internet bandwidth per capita 94 Consumer broadband penetration (%) NA Business fixed broadband penetration (%) NA Mobile internet subscription penetration (%) 94 Number of IPv4 registrations per capita 92 Number of IPv6 registrations per capita NA
Spe
ed
Peak fixed broaband connection speed NA Average fixed broadband connection speed NA Peak mobile connection speed NA Average mobile connection speed NA
Pric
e Fixed broadband pricing ($ per month at PPP) 98 Mobile pricing ($ per min local call off-net (peak) at PPP) NA
Traf
fic
Traffic volumes per capita NA International traffic vols per capita NA
Arc
hite
ctur
e Exchange points per capita 89 Number of networks (ASNs) per capita 84 Content registered to cc'TLD hosted onshore (%) 94 Existence of independent regulator* 1
Industry
Overall 71
Indicator friction score
Infra
Quality of transport infrastructure for physical fulfillment 74 Quality of electricity and telephony infrastructure 92
Labo
ur
ICT skills NA Quality of maths & science education 75
Availability of qualified engineers 61
Capacity for innovation 47
Cap
ital
Financial market sophistication* 76 Financing through local equity market 43
Ease of access to loans 46
FDI to GDP ratio NA
Venture capital availability 49
Eco
nom
y
Strength IP protection 77
Burden of customs procedures 84
Prevalence of trade barriers 92 Number of days to set up a business 94
Tech
Company-level technology absorption 67
Individual
Overall 68
Indicator friction score
Abi
lity
Quality of educational system 43
Adult literacy rate (%) 89
ICT skills NA
Acc
ss
Internet users (%) 92
Ban
king
Availability of financial services 60
Affordability of financial services 64
Market penetration of bank accounts (%) 67
Pay
men
ts
Population using online personal finance (%) NA
Debit card penetration (%) 62 Tr
ust
Cyber security being adequately addressed NA
Trust in privacy of credit card/financial data NA
Trust in privacy of other personal data NA
Information
Overall 51
Indicator friction score
Site
s Number of domains registered to each ccTLD per capita
75
Con
tent
Number of online open encyclopaedia pages in local language
27
Number of micro messages made in home language* 19
Share of population using social networks (%) NA
Dat
a
Commitment to open data 94
Obj
ectiv
ity
Press freedom index 50
Freedom on the net 36
Obs
tcls
Filtering score* NA
e-Friction Score: 71
Notes: the best e-Friction score a country can achieve on any given indicator is 0 while the worse is 100, * some variables are in a discrete scale with several countries sharing an equal ranking Source: BCG e-Friction model. Found in BCG Perspectives "Greasing the Wheels of the Internet Economy: a Country by Country e-Friction Analysis"
Rank: 57 of 65

ICANN e-friction Refresh AIS Tunis 04Jun15.pptx 40
Cop
yrig
ht ©
201
5 by
The
Bos
ton
Con
sulti
ng G
roup
, Inc
. All
right
s re
serv
ed.
E-Friction scorecard: Morocco
Infrastructure
Overall 72
Indicator friction score
Acc
ess
Internet bandwidth per capita 72 International Internet bandwidth per capita 81 Consumer broadband penetration (%) 89 Business fixed broadband penetration (%) 98 Mobile internet subscription penetration (%) NA Number of IPv4 registrations per capita 86 Number of IPv6 registrations per capita NA
Spe
ed
Peak fixed broaband connection speed NA Average fixed broadband connection speed NA Peak mobile connection speed 62 Average mobile connection speed 83
Pric
e Fixed broadband pricing ($ per month at PPP) 19 Mobile pricing ($ per min local call off-net (peak) at PPP) NA
Traf
fic
Traffic volumes per capita NA International traffic vols per capita 82
Arc
hite
ctur
e Exchange points per capita NA Number of networks (ASNs) per capita 100 Content registered to cc'TLD hosted onshore (%) 88 Existence of independent regulator* 1
Industry
Overall 58
Indicator friction score
Infra
Quality of transport infrastructure for physical fulfillment 58 Quality of electricity and telephony infrastructure 69
Labo
ur
ICT skills NA Quality of maths & science education 50
Availability of qualified engineers 46
Capacity for innovation 98
Cap
ital
Financial market sophistication* 63 Financing through local equity market 47
Ease of access to loans 64
FDI to GDP ratio 53
Venture capital availability 55
Eco
nom
y
Strength IP protection 78
Burden of customs procedures 58
Prevalence of trade barriers 24 Number of days to set up a business 18
Tech
Company-level technology absorption 80
Individual
Overall 76
Indicator friction score
Abi
lity
Quality of educational system 88
Adult literacy rate (%) 98
ICT skills NA
Acc
ss
Internet users (%) 62
Ban
king
Availability of financial services 66
Affordability of financial services 63
Market penetration of bank accounts (%) 76
Pay
men
ts
Population using online personal finance (%) NA
Debit card penetration (%) 75 Tr
ust
Cyber security being adequately addressed NA
Trust in privacy of credit card/financial data NA
Trust in privacy of other personal data NA
Information
Overall 73
Indicator friction score
Site
s Number of domains registered to each ccTLD per capita
53
Con
tent
Number of online open encyclopaedia pages in local language
52
Number of micro messages made in home language* 100
Share of population using social networks (%) NA
Dat
a
Commitment to open data 100
Obj
ectiv
ity
Press freedom index 75
Freedom on the net 56
Obs
tcls
Filtering score* 68
e-Friction Score: 70
Notes: the best e-Friction score a country can achieve on any given indicator is 0 while the worse is 100, * some variables are in a discrete scale with several countries sharing an equal ranking Source: BCG e-Friction model. Found in BCG Perspectives "Greasing the Wheels of the Internet Economy: a Country by Country e-Friction Analysis"
Rank: 54 of 65

ICANN e-friction Refresh AIS Tunis 04Jun15.pptx 41
Cop
yrig
ht ©
201
5 by
The
Bos
ton
Con
sulti
ng G
roup
, Inc
. All
right
s re
serv
ed.
E-Friction scorecard: Nigeria
Infrastructure
Overall 89
Indicator friction score
Acc
ess
Internet bandwidth per capita 100 International Internet bandwidth per capita 98 Consumer broadband penetration (%) 100 Business fixed broadband penetration (%) 100 Mobile internet subscription penetration (%) 96 Number of IPv4 registrations per capita 100 Number of IPv6 registrations per capita 90
Spe
ed
Peak fixed broaband connection speed NA Average fixed broadband connection speed NA Peak mobile connection speed NA Average mobile connection speed NA
Pric
e Fixed broadband pricing ($ per month at PPP) 100 Mobile pricing ($ per min local call off-net (peak) at PPP) NA
Traf
fic
Traffic volumes per capita NA International traffic vols per capita NA
Arc
hite
ctur
e Exchange points per capita 94 Number of networks (ASNs) per capita 92 Content registered to cc'TLD hosted onshore (%) 100 Existence of independent regulator* 1
Industry
Overall 77
Indicator friction score
Infra
Quality of transport infrastructure for physical fulfillment 97 Quality of electricity and telephony infrastructure 100
Labo
ur
ICT skills NA Quality of maths & science education 91
Availability of qualified engineers 74
Capacity for innovation 74
Cap
ital
Financial market sophistication* 77 Financing through local equity market 60
Ease of access to loans 92
FDI to GDP ratio 34
Venture capital availability 81
Eco
nom
y
Strength IP protection 94
Burden of customs procedures 92
Prevalence of trade barriers 74 Number of days to set up a business 47
Tech
Company-level technology absorption 74
Individual
Overall 86
Indicator friction score
Abi
lity
Quality of educational system 91
Adult literacy rate (%) 95
ICT skills NA
Acc
ss
Internet users (%) 91
Ban
king
Availability of financial services 86
Affordability of financial services 77
Market penetration of bank accounts (%) 84
Pay
men
ts
Population using online personal finance (%) NA
Debit card penetration (%) 78 Tr
ust
Cyber security being adequately addressed NA
Trust in privacy of credit card/financial data NA
Trust in privacy of other personal data NA
Information
Overall 59
Indicator friction score
Site
s Number of domains registered to each ccTLD per capita
97
Con
tent
Number of online open encyclopaedia pages in local language
100
Number of micro messages made in home language* NA
Share of population using social networks (%) NA
Dat
a
Commitment to open data 87
Obj
ectiv
ity
Press freedom index 66
Freedom on the net 42
Obs
tcls
Filtering score* 1
e-Friction Score: 82
Notes: the best e-Friction score a country can achieve on any given indicator is 0 while the worse is 100, * some variables are in a discrete scale with several countries sharing an equal ranking Source: BCG e-Friction model. Found in BCG Perspectives "Greasing the Wheels of the Internet Economy: a Country by Country e-Friction Analysis"
Rank: 65 of 65

ICANN e-friction Refresh AIS Tunis 04Jun15.pptx 42
Cop
yrig
ht ©
201
5 by
The
Bos
ton
Con
sulti
ng G
roup
, Inc
. All
right
s re
serv
ed.
E-Friction scorecard: South Africa
Infrastructure
Overall 75
Indicator friction score
Acc
ess
Internet bandwidth per capita 77 International Internet bandwidth per capita 91 Consumer broadband penetration (%) 94 Business fixed broadband penetration (%) 75 Mobile internet subscription penetration (%) 71 Number of IPv4 registrations per capita 56 Number of IPv6 registrations per capita 68
Spe
ed
Peak fixed broaband connection speed 100 Average fixed broadband connection speed 85 Peak mobile connection speed 100 Average mobile connection speed 75
Pric
e Fixed broadband pricing ($ per month at PPP) 86 Mobile pricing ($ per min local call off-net (peak) at PPP) 38
Traf
fic
Traffic volumes per capita 89 International traffic vols per capita NA
Arc
hite
ctur
e Exchange points per capita 68 Number of networks (ASNs) per capita 76 Content registered to cc'TLD hosted onshore (%) 61 Existence of independent regulator* 35
Industry
Overall 50
Indicator friction score
Infra
Quality of transport infrastructure for physical fulfillment 50 Quality of electricity and telephony infrastructure 88
Labo
ur
ICT skills 98 Quality of maths & science education 100
Availability of qualified engineers 95
Capacity for innovation 46
Cap
ital
Financial market sophistication* 4 Financing through local equity market 2
Ease of access to loans 24
FDI to GDP ratio 89
Venture capital availability 36
Eco
nom
y
Strength IP protection 24
Burden of customs procedures 56
Prevalence of trade barriers 35 Number of days to set up a business 4
Tech
Company-level technology absorption 47
Individual
Overall 63
Indicator friction score
Abi
lity
Quality of educational system 100
Adult literacy rate (%) 87
ICT skills 98
Acc
ss
Internet users (%) 79
Ban
king
Availability of financial services 2
Affordability of financial services 16
Market penetration of bank accounts (%) 58
Pay
men
ts
Population using online personal finance (%) 92
Debit card penetration (%) 40 Tr
ust
Cyber security being adequately addressed 58
Trust in privacy of credit card/financial data NA
Trust in privacy of other personal data NA
Information
Overall 68
Indicator friction score
Site
s Number of domains registered to each ccTLD per capita
74
Con
tent
Number of online open encyclopaedia pages in local language
97
Number of micro messages made in home language* NA
Share of population using social networks (%) 92
Dat
a
Commitment to open data 81
Obj
ectiv
ity
Press freedom index 39
Freedom on the net 31
Obs
tcls
Filtering score* NA
e-Friction Score: 67
Notes: the best e-Friction score a country can achieve on any given indicator is 0 while the worse is 100, * some variables are in a discrete scale with several countries sharing an equal ranking Source: BCG e-Friction model. Found in BCG Perspectives "Greasing the Wheels of the Internet Economy: a Country by Country e-Friction Analysis"
Rank: 50 of 65
Thank you
bcg.com | bcgperspectives.com