david freed (8 rivers capital), eleep virtual discussion on net power
TRANSCRIPT
Truly Clean, Cheaper Energy
July 2016
NET Power
June 2016 Material Confidential and/or Proprietary to 8 Rivers Capital and/or NET Power ─ Not To Be Disclosed or Republished Without Written Consent 2
World Economic Forum
calling for
investing in “no regrets” areas that have a positive business case, and so will be palatable in almost any economic climate.
Steve Bolze and Ignacio Galan, Chairs
“The Future of Electricity”
July 2016 3
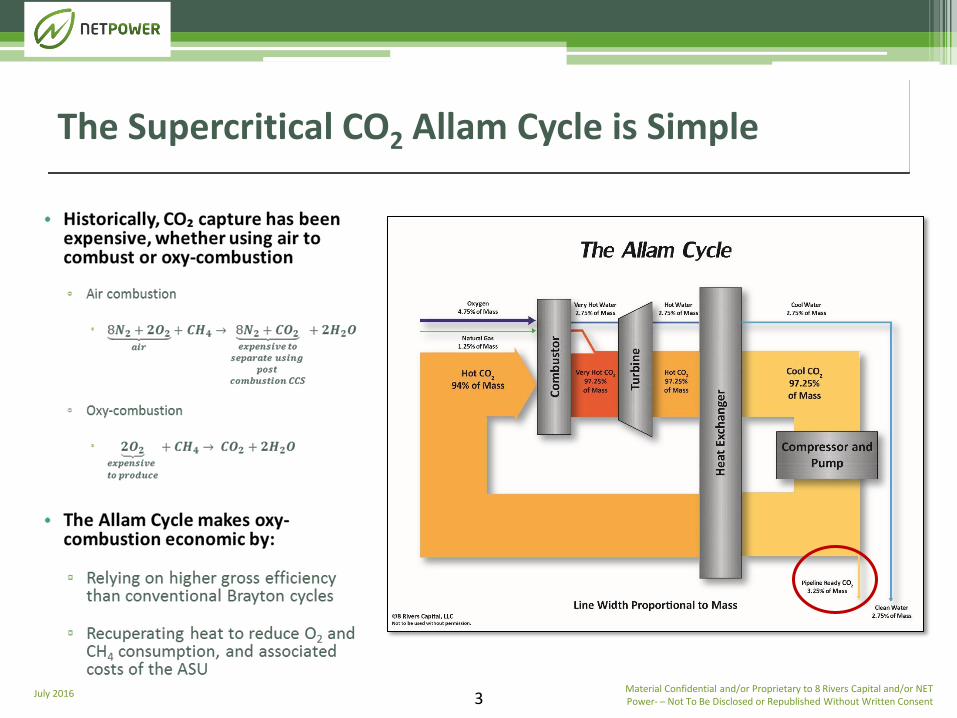
The Supercritical CO2 Allam Cycle is Simple
Material Confidential and/or Proprietary to 8 Rivers Capital and/or NET Power ─ Not To Be Disclosed or Republished Without Written Consent
July 2016 4
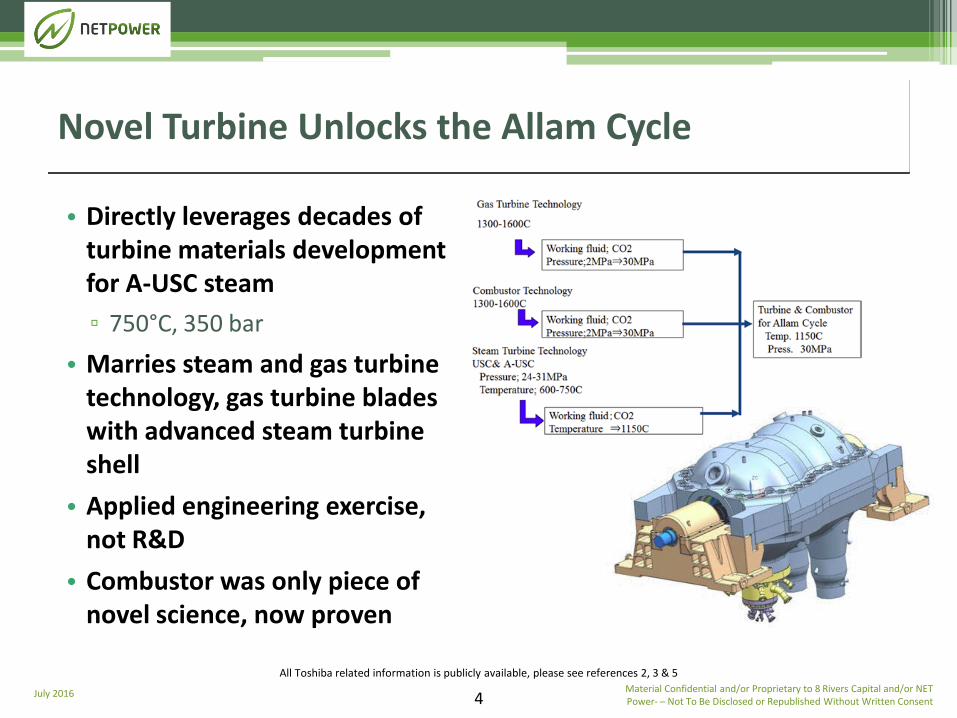
• Directly leverages decades of turbine materials development for A-USC steam
▫ 750°C, 350 bar
• Marries steam and gas turbine technology, gas turbine blades with advanced steam turbine shell
• Applied engineering exercise, not R&D
• Combustor was only piece of novel science, now proven
Novel Turbine Unlocks the Allam Cycle
Material Confidential and/or Proprietary to 8 Rivers Capital and/or NET Power ─ Not To Be Disclosed or Republished Without Written Consent
All Toshiba related information is publicly available, please see references 2, 3 & 5
July 2016 5
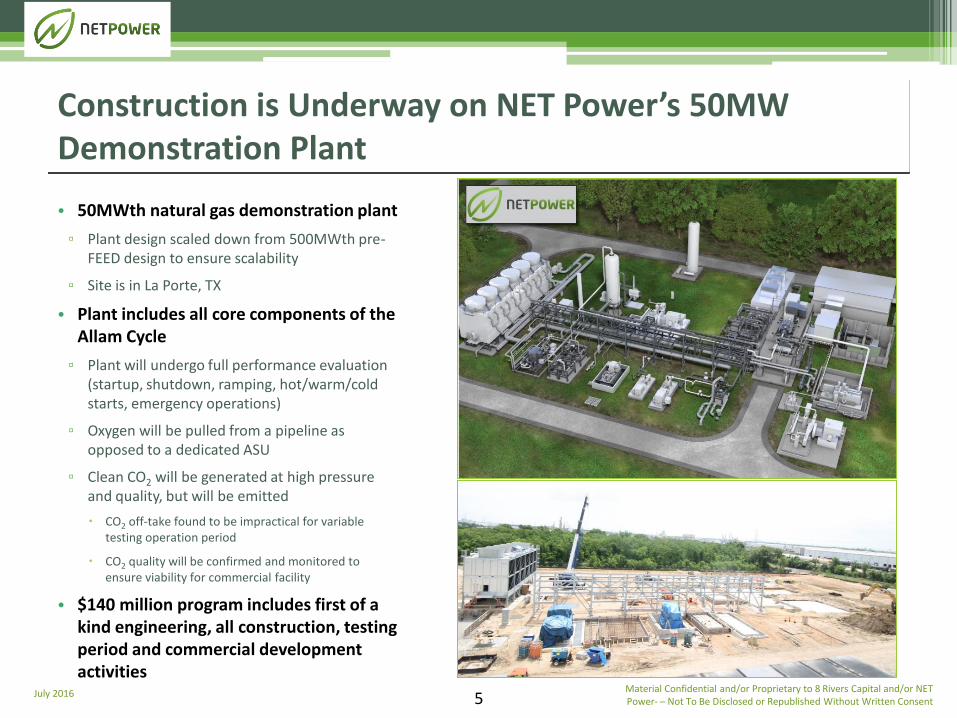
• 50MWth natural gas demonstration plant
▫ Plant design scaled down from 500MWth pre-FEED design to ensure scalability
▫ Site is in La Porte, TX
• Plant includes all core components of the Allam Cycle
▫ Plant will undergo full performance evaluation (startup, shutdown, ramping, hot/warm/cold starts, emergency operations)
▫ Oxygen will be pulled from a pipeline as opposed to a dedicated ASU
▫ Clean CO2 will be generated at high pressure and quality, but will be emitted
CO2 off-take found to be impractical for variable testing operation period
CO2 quality will be confirmed and monitored to ensure viability for commercial facility
• $140 million program includes first of a kind engineering, all construction, testing period and commercial development activities
Construction is Underway on NET Power’s 50MW Demonstration Plant
Material Confidential and/or Proprietary to 8 Rivers Capital and/or NET Power ─ Not To Be Disclosed or Republished Without Written Consent
July 2016 6
• Large amount of operational flexibility
▫ Electrical turndown not limited by air permit constraints
▫ Enables rapid responsiveness to load requirements down to zero load to the grid
▫ Significant operational flexibility added through on-site storage of oxygen (~30 MWe) and carbon dioxide output
▫ Ramp-rate
Cold (after being down for 36 hours): no more than 3 to 4 hours
Warm/hot (being down less than 12 hours): 2-5% per minute from warm/hot start
• Large amount of siting flexibility
▫ Ability to cool with hybrid or air cooling configurations, eliminating water needs (no make-up water required), with minimal (2-3%) efficiency impact
▫ Simplified configuration capable of using alternative water resources (non-potable and/or brackish)
▫ Elimination of air emissions enables siting in non-attainment zones without requiring purchase of offsets
▫ Less than 1% reduction in output with low air density locations
▫ Flexible with small contaminants in fuel gas chemistry such as sulfur, nitrogen, and other acid gas
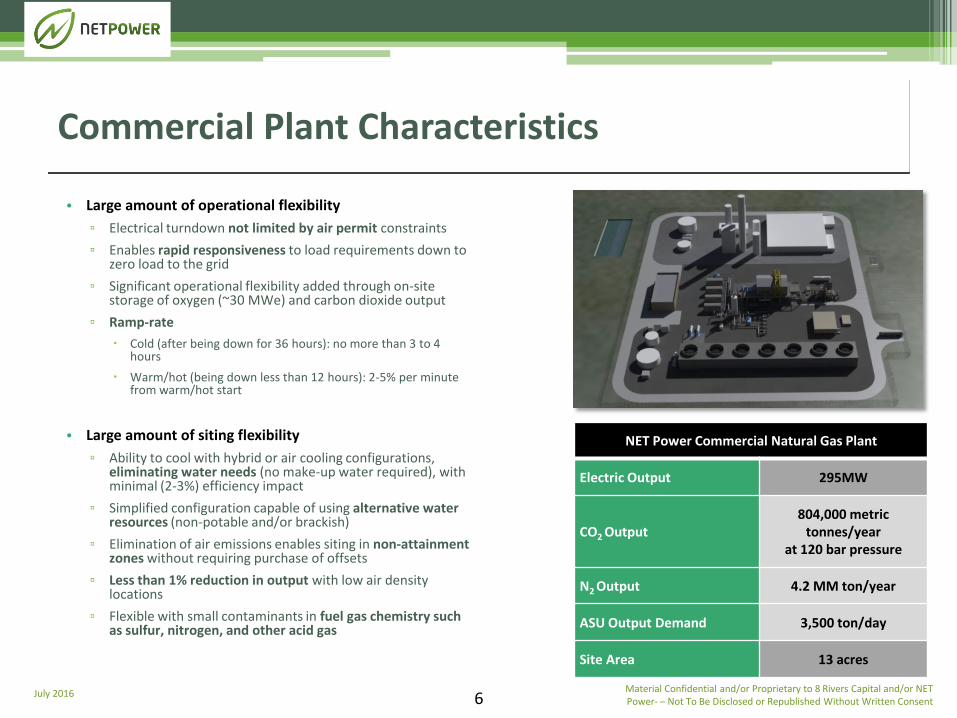
Commercial Plant Characteristics
NET Power Commercial Natural Gas Plant
Electric Output 295MW
CO2 Output
804,000 metric tonnes/year
at 120 bar pressure
N2 Output 4.2 MM ton/year
ASU Output Demand 3,500 ton/day
Site Area 13 acres
Material Confidential and/or Proprietary to 8 Rivers Capital and/or NET Power ─ Not To Be Disclosed or Republished Without Written Consent

July 2016 Material Confidential and/or Proprietary to 8 Rivers Capital and/or NET Power ─ Not To Be Disclosed or Republished Without Written Consent 7
Development Pathway Schedule
NET Power
Commercialiation Plan
Activity Owner Q1 Q2 Q3 Q4 Q1 Q2 Q3 Q4 Q1 Q2 Q3 Q4 Q1 Q2 Q3 Q4 Q1 Q2 Q3 Q4 Q1 Q2 Q3 Q4 Q1 Q2 Q3
Demo Plant
Turbine Toshiba
EPC CB&I
Testing All
Performance testing
Mechanical integrity testing
Optional testing
First Commercial Plant
Turbine Toshiba
Commercial Design CB&I/NP
EPC Owner/CB&I
Site Owner/NP
Other (finance/offtake) Owner/NP
2021
Turbine Design
P.O.
Long-Lead Items
Spec
2015 2016 2017 2018 2019 2020
Site Selection & Perm.
Finance
Procure/Build
EPC
Detailed Design
Target NTP#1
Target COD#2
Target COD#1
FEED, site selection and negotiation of contracts simultaneously with testing, to allow NTP at end of 2017.
June 2016 Material Confidential and/or Proprietary to 8 Rivers Capital and/or NET Power ─ Not To Be Disclosed or Republished Without Written Consent 8
• In a world evolving towards cleaner energy, NET Power is more relevant and required than ever before: ▫ Using the most up-to-date IEA projections, a total addressable market of 1500 GW exists
through 2040
▫ While focus and investment in clean energy will continue, relying completely on renewables does not enable us to meet our climate targets without cost implications
▫ NET Power will be needed to keep power prices low, to maintain grid stability/flexibility, to support a growing industrial load while meeting proposed climate targets
• The size of the prize for NET Power is huge and NOT dependent on CO2 off-takes or sales today: ▫ The EOR opportunity is large enough to support CO2 off-takes from far more than the total
fossil capacity build projected out to 2040
▫ At NET Power’s low cost of CO2 production, expanding the existing 5600 mile CO2 transmission infrastructure is clearly executable and economic, and new CO2 utilization technologies are enabled
▫ NET Power is a true “no regrets” option.
Plants can be built capture ready, producing electricity at costs comparable to combined cycle
Sequestration can be added immediately, or later, for additional revenue stream.
Summary
June 2016 Material Confidential and/or Proprietary to 8 Rivers Capital and/or NET Power ─ Not To Be Disclosed or Republished Without Written Consent 9
NET Power will enable climate goals to be met while preventing unacceptable electricity cost increases
-10
0
10
20
30
40
50
60
70
80
90
100
0 50 100 150 200 250 300 350
% C
O₂
red
uct
ion
Cost of electricity ($/MW)
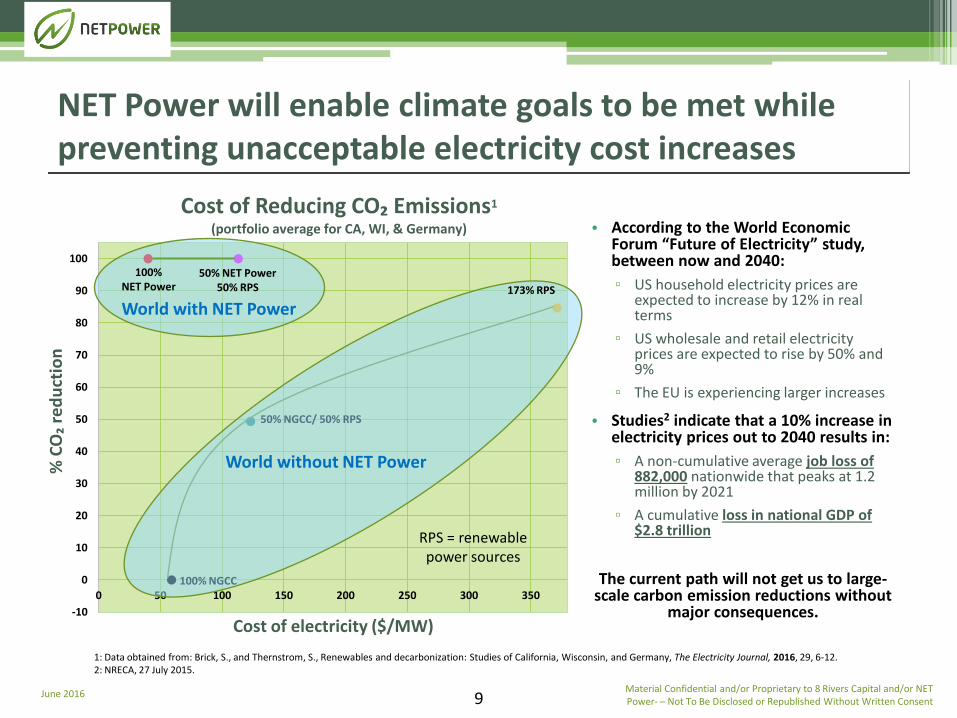
Cost of Reducing CO₂ Emissions1 (portfolio average for CA, WI, & Germany)
100% NET Power
50% NET Power 50% RPS
1: Data obtained from: Brick, S., and Thernstrom, S., Renewables and decarbonization: Studies of California, Wisconsin, and Germany, The Electricity Journal, 2016, 29, 6-12. 2: NRECA, 27 July 2015.
100% NGCC
50% NGCC/ 50% RPS
173% RPS
World without NET Power
World with NET Power
• According to the World Economic Forum “Future of Electricity” study, between now and 2040:
▫ US household electricity prices are expected to increase by 12% in real terms
▫ US wholesale and retail electricity prices are expected to rise by 50% and 9%
▫ The EU is experiencing larger increases
• Studies2 indicate that a 10% increase in electricity prices out to 2040 results in:
▫ A noncumulative average job loss of 882,000 nationwide that peaks at 1.2 million by 2021
▫ A cumulative loss in national GDP of $2.8 trillion
The current path will not get us to large-scale carbon emission reductions without
major consequences.
RPS = renewable power sources
June 2016 Material Confidential and/or Proprietary to 8 Rivers Capital and/or NET Power ─ Not To Be Disclosed or Republished Without Written Consent 10
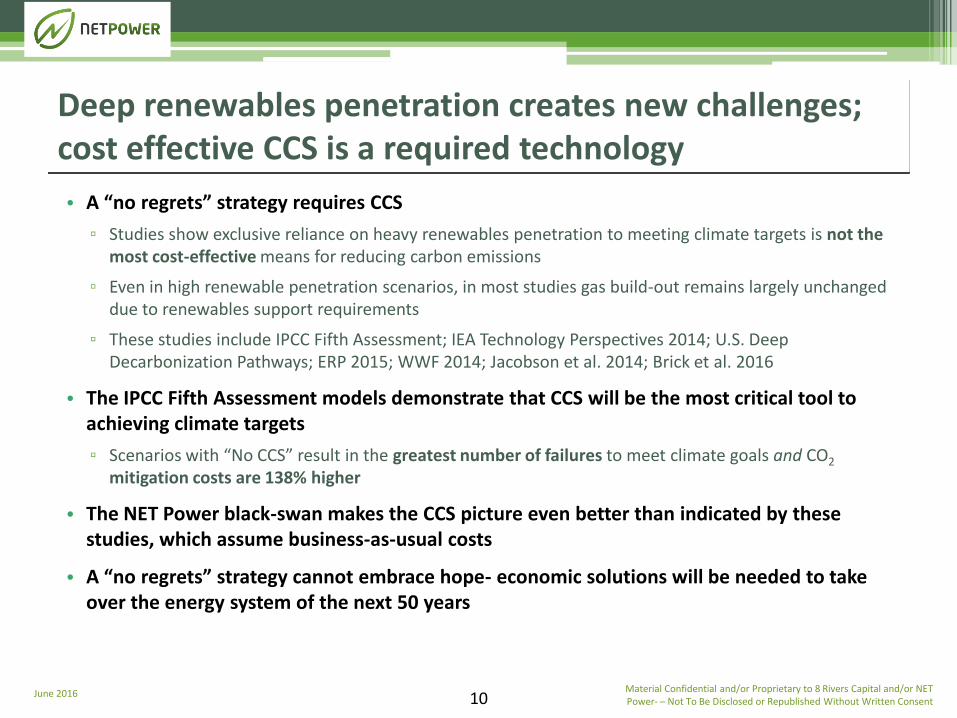
• A “no regrets” strategy requires CCS
▫ Studies show exclusive reliance on heavy renewables penetration to meeting climate targets is not the most cost-effective means for reducing carbon emissions
▫ Even in high renewable penetration scenarios, in most studies gas build-out remains largely unchanged due to renewables support requirements
▫ These studies include IPCC Fifth Assessment; IEA Technology Perspectives 2014; U.S. Deep Decarbonization Pathways; ERP 2015; WWF 2014; Jacobson et al. 2014; Brick et al. 2016
• The IPCC Fifth Assessment models demonstrate that CCS will be the most critical tool to achieving climate targets
▫ Scenarios with “No CCS” result in the greatest number of failures to meet climate goals and CO2 mitigation costs are 138% higher
• The NET Power black-swan makes the CCS picture even better than indicated by these studies, which assume business-as-usual costs
• A “no regrets” strategy cannot embrace hope- economic solutions will be needed to take over the energy system of the next 50 years
Deep renewables penetration creates new challenges; cost effective CCS is a required technology
June 2016 Material Confidential and/or Proprietary to 8 Rivers Capital and/or NET Power ─ Not To Be Disclosed or Republished Without Written Consent 11
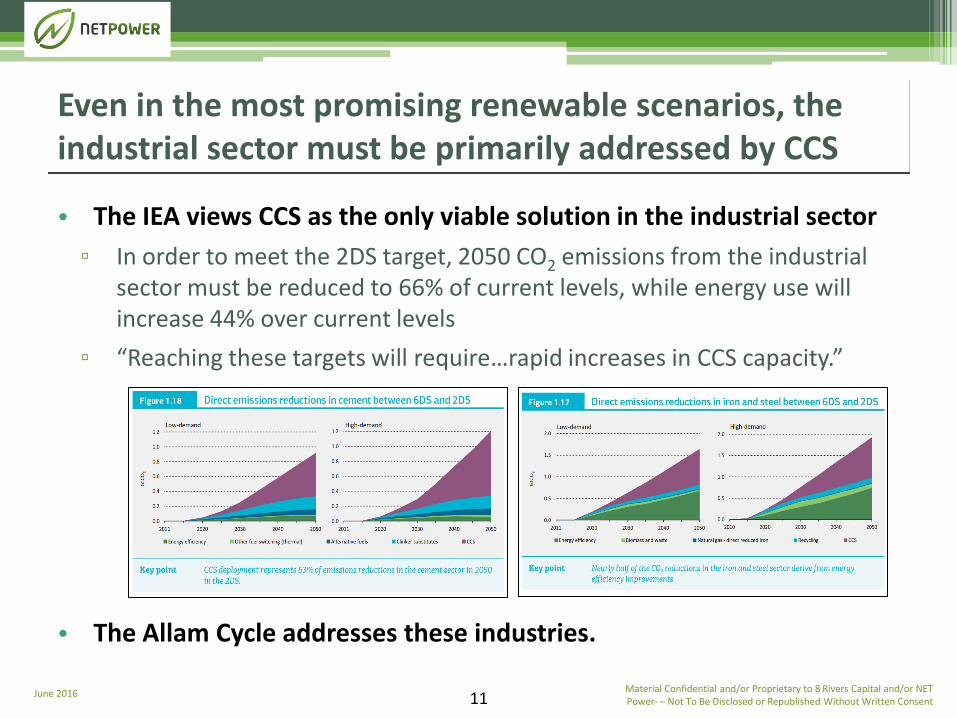
• The IEA views CCS as the only viable solution in the industrial sector
▫ In order to meet the 2DS target, 2050 CO2 emissions from the industrial sector must be reduced to 66% of current levels, while energy use will increase 44% over current levels
▫ “Reaching these targets will require…rapid increases in CCS capacity.”
• The Allam Cycle addresses these industries.
Even in the most promising renewable scenarios, the industrial sector must be primarily addressed by CCS
June 2016 Material Confidential and/or Proprietary to 8 Rivers Capital and/or NET Power ─ Not To Be Disclosed or Republished Without Written Consent 12
• Each NET Power turbine produces enough CO2 to justify a 60 mile pipeline
▫ This analysis has been vetted by one of the largest EOR system operators in the world
• New gas demand in US (203 GW) would support enough NET Power turbines (688) to justify 4100 miles of pipelines
▫ The United States is only 3,000 miles from coast to coast
▫ NET Power plants can either be co-located to justify a pipeline or daisy-chained together
• Existing EOR infrastructure and operations ARE tethered to geologic sources of CO2, but EOR opportunities exist outside of this network
▫ Michigan, Illinois, Indiana, Ohio, West Virginia, Pennsylvania, California
▫ NET Power enables these stranded fields to be accessed
• Regions of largest projected capacity demand (West, Sun Belt)
NET Power is not tethered to existing EOR infrastructure
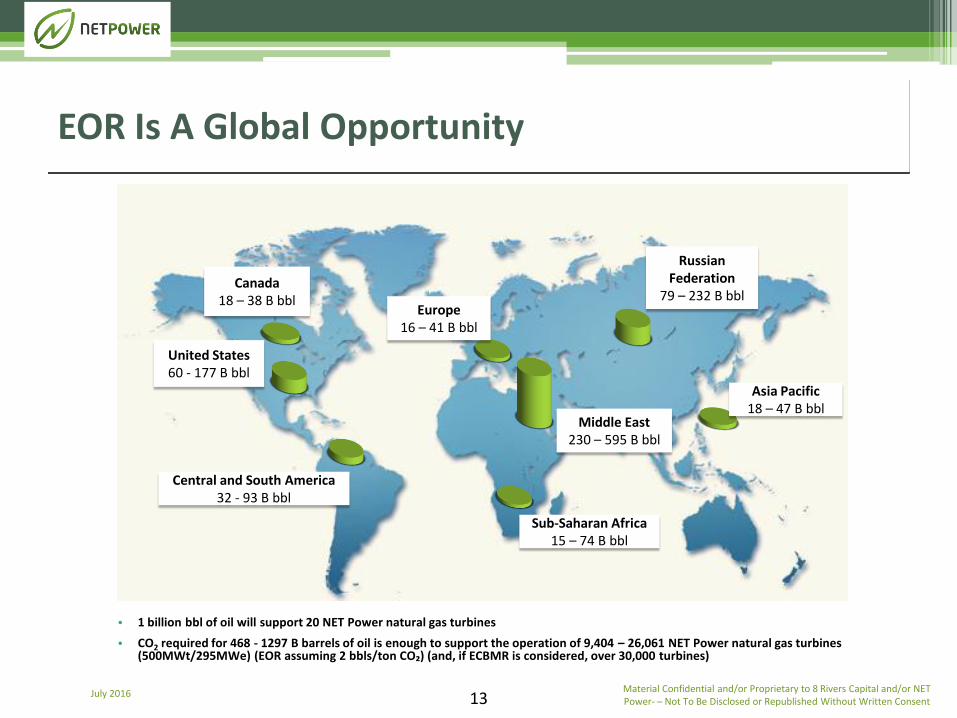
United States 60 - 177 B bbl
Central and South America 32 - 93 B bbl
Sub-Saharan Africa 15 – 74 B bbl
Middle East 230 – 595 B bbl
Europe 16 – 41 B bbl
Russian Federation
79 – 232 B bbl
Asia Pacific 18 – 47 B bbl
Canada 18 – 38 B bbl
July 2016 13
• 1 billion bbl of oil will support 20 NET Power natural gas turbines
• CO2 required for 468 - 1297 B barrels of oil is enough to support the operation of 9,404 – 26,061 NET Power natural gas turbines (500MWt/295MWe) (EOR assuming 2 bbls/ton CO₂) (and, if ECBMR is considered, over 30,000 turbines)
EOR Is A Global Opportunity
Material Confidential and/or Proprietary to 8 Rivers Capital and/or NET Power ─ Not To Be Disclosed or Republished Without Written Consent
June 2016 Material Confidential and/or Proprietary to 8 Rivers Capital and/or NET Power ─ Not To Be Disclosed or Republished Without Written Consent 14
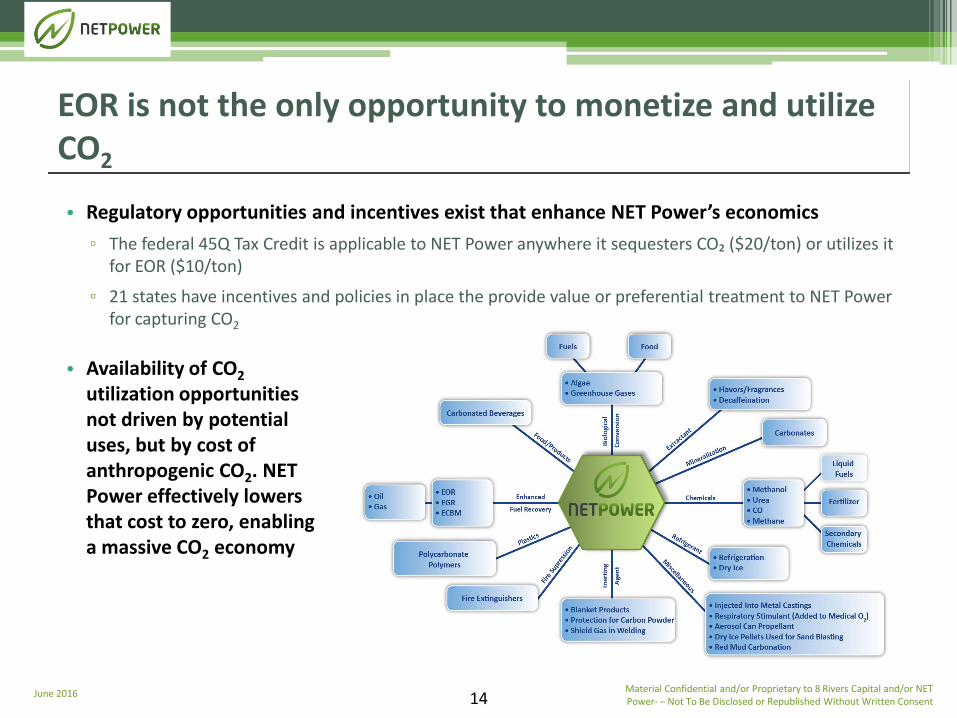
• Regulatory opportunities and incentives exist that enhance NET Power’s economics
▫ The federal 45Q Tax Credit is applicable to NET Power anywhere it sequesters CO₂ ($20/ton) or utilizes it for EOR ($10/ton)
▫ 21 states have incentives and policies in place the provide value or preferential treatment to NET Power for capturing CO2
EOR is not the only opportunity to monetize and utilize CO2
• Availability of CO2 utilization opportunities not driven by potential uses, but by cost of anthropogenic CO2. NET Power effectively lowers that cost to zero, enabling a massive CO2 economy