day 2 - 1 macro-fiscal framework - world...
TRANSCRIPT

Macro-Fiscal Framework
PRMED Trainning
1
DSA at Subnational Level Trainning , Brasilia , December 5-9, 2011PRMED in collaboration with LAC PREM
Slides prepared by A. Manoel, J. Pradelli, L. Bandiera, and L. GarridoWorld Bank Copyright

Outline• Introduction and basic concepts
• Key assumptions
• Revenues and Expenditures
• Borrowing
• Sensitivity analysis
• Conclusions

Introduction and basic concepts
• Linkages between a DSA and a Macroeconomic Framework at the national level
• Elements of a Macroeconomic Framework at the national level
• Sub-national Macroeconomic Framework

Baseline Scenario (Be realistic!) Ingredients for the baseline scenario…• Macroeconomic projections (key variables)
» Country’s capacity to repay• PPG external and domestic debt stocks and flows
» Fiscal Balance» Balance of Payments» New borrowing assumptions
• Macroeconomic projections and the change in PPG external and domestic debts are linked through the Fiscal Balance

5
GDP
Govt Revenue
Fiscal Balance
Govt Expenditure (Cg + Ig)
Domestic Borrowing External Borrowing
BOP
Monetary and Exch.Rate Policy
Macroeconomic Framework and the Fiscal Sustainability Analysis
Rest ofthe World
5

Medium Term Macroeconomic and Fiscal Framework
Key variables
– Fiscal: • Revenues, Expenditures• Overall and Primary balance• External and domestic financing
– BOP: • Current account balance, • Financial accounts, of which
external borrowing and amortization
• Change in NFA and international reserves
– GDP, Population and Prices• Real GDP, GDP deflator and
Inflation rates• Exchange rates• Interest rates (foreign, domestic)• Population
– Monetary Survey• Net foreign assets, Reserves
Years– 10 years of actual data: e.g.
2001-10 – 3-5 years of projections• Considerations to average
maturity of debt• Economic cycle• Structural changes

Sub-national Macroeconomic Framework
• Piggybacking on the national framework projections for the debt decomposition– Inflation rates
• domestic and foreign
– Exchange rate
– National GDP Y*• used to calculate shared revenues and transfers from
central government
– Foreign interest rates
– Domestic interest rate (unless spreads available)

Sub-national Macroeconomic Framework 1/3
• Specific Sub-national framework needed for– Sub-national GDP– Population
– Medium term fiscal framework• Revenues• Expenditure• Overall balance/Financing
– Domestic borrowing– External borrowing
– Market variables• Regional spreads

Sub-national Macroeconomic Framework 2/3
2001/02 2005/06 2009/10 2010/11 2011/12 2012/13 2013/14 2014/15GDP and Prices(In billions of LCU)
Nominal national GDP 2,226.3 3,507.7 5,850.0 6,581.3 7,436.8 8,440.8 9,580.3 10,873.6 Nominal S-GDP 158.3 261.8 453.8 512.8 579.5 654.8 739.9 836.1
Real national GDP growth (%) 3.46% 7.8% 5.0% 7.1% 7.6% 8.1% 8.1% 8.1%Real S-GDP growth (%) 4.94% 4.1% 6.6% 7.6% 7.6% 7.6% 7.6% 7.6%
CPI Inflation, Ave. (%) 4.0% 6.0% 6.0% 5.0% 5.0% 5.0% 5.0% 5.0%GDP Deflator (Index 2001/02=100) 100.0 122.7 154.9 162.6 170.8 179.3 188.3 197.7
Fiscal Balance(In billions of LCU)
I. Revenue 26.1 55.4 94.9 112.4 124.6 138.3 153.5 170.8 Own tax revenue 9.7 17.8 35.6 40.4 45.4 51.1 57.5 65.0 Own non-tax revenue 1.6 6.5 6.3 6.8 7.4 8.0 8.6 9.3 Share of central tax 1.5 10.1 15.5 23.3 26.3 29.8 33.8 38.4 Grants from the center 13.2 20.9 37.5 41.9 45.5 49.4 53.6 58.1
II. Primary expenditure 27.1 66.1 109.3 116.8 128.8 142.1 156.3 173.9 Non-plan primary expenditure (net of interest) 19.5 34.1 69.6 72.7 80.0 88.0 96.8 108.4 Plan expenditure 4.8 14.0 23.6 25.5 28.0 30.8 33.9 37.3 Net capital expenditure 2.8 18.0 16.1 18.5 20.8 23.3 25.6 28.1
III. Interest expenditure 5.1 8.1 13.4 14.3 15.6 17.3 19.0 21.3
IV. Primary balance (I-II) (1.1) (10.7) (14.5) (4.3) (4.2) (3.8) (2.8) (3.0)
V. Overall balance (IV-III) (6.1) (18.8) (27.8) (18.6) (19.8) (21.1) (21.8) (24.4)
Memorandum items:Primary balance-to-SGDP % -0.7% -4.1% -3.2% -0.8% -0.7% -0.6% -0.4% -0.4%Overall balance-to-SGDP % -3.9% -7.2% -6.1% -3.6% -3.4% -3.2% -2.9% -2.9%
Tax rate subnational % 6.1% 6.8% 7.8% 7.9% 7.8% 7.8% 7.8% 7.8%Tax rate national % 13.0% 13.0% 13.0% 13.0% 13.0% 13.0% 13.0% 13.0%Coparticipation rate % 5.1% 6.8% 7.0% 7.6% 7.4% 7.2% 7.0% 6.8%
Historical Projection

Sub-national Macroeconomic Framework 3/3
2001/02 2005/06 2009/10 2010/11 2011/12 2012/13 2013/14 2014/15
Financing (In billions of LCU) 6.1 18.8 27.8 18.6 19.8 21.1 21.8 24.4
Gross borrowing / Gross financing needs 32.4 50.0 43.7 33.3 47.7 49.8 50.6 Amortization … 13.6 22.1 25.2 13.5 26.6 28.1 26.2
Debt(In billions of LCU)
Debt Outstanding and Disbursed (DOD) 42.0 106.8 167.7 186.3 206.0 227.1 248.9 273.3
New debt - Mkt loans - Gross issuance - - - 26.2 20.0 28.6 29.9 30.4 New debt - NSSF - Gross issuance - - - 17.5 13.3 19.1 19.9 20.2
DOD 2001/02 - 2009/10 - Principal payments … 13.6 22.1 25.2 9.3 19.3 16.2 9.6 DOD 2001/02 - 2009/10 - Interest payments (est.using int.rate avge implicit in series)5.1 8.1 13.4 14.3 11.9 11.1 9.3 8.4
DOD 2001/02 - 2009/10 - Interest rate (% average, implicit) - 8.9% 9.1% 8.5% 8.3% 8.3% 8.2% 8.6%
New debt - Mkt loans - Principal payments 3.3 5.8 9.4 13.1 New debt - NSSF - Principal payments 0.9 1.5 2.5 3.5
New debt - Mkt loans - Interest payments 2.0 3.2 4.9 6.5 New debt - NSSF - Interest payments 1.7 3.0 4.7 6.5
New borrowing assumptions:New debt - Mkt loans - Share of gross borrowing (%) 60.0 60.0 60.0 60.0 60.0 New debt - NSSF - Share of gross borrowing (%) 40.0 40.0 40.0 40.0 40.0 New debt - Mkt loans - Interest rate (% average, implicit, floating rate) 7.5% 7.5% 7.5% 7.5% 7.5%New debt - NSSF - Interest rate (% average, implicit, floating rate) 10.0% 10.0% 10.0% 10.0% 10.0%New debt - Mkt loans - Maturity of newly issued instruments (years) 8.0 8.0 8.0 8.0 8.0 New debt - NSSF - Maturity of newly issued instruments (years) 20.0 20.0 20.0 20.0 20.0
Memorandum items:Debt-to-SGDP % 26.6% 40.8% 36.9% 36.3% 35.6% 34.7% 33.6% 32.7%Debt service-to-revenue (%) 39.1% 37.4% 35.1% 23.3% 31.8% 30.7% 27.8%Debt service-to-own revenue (%) 121.4% 99.8% 97.5% 64.0% 85.9% 81.8% 73.2%
Historical Projection
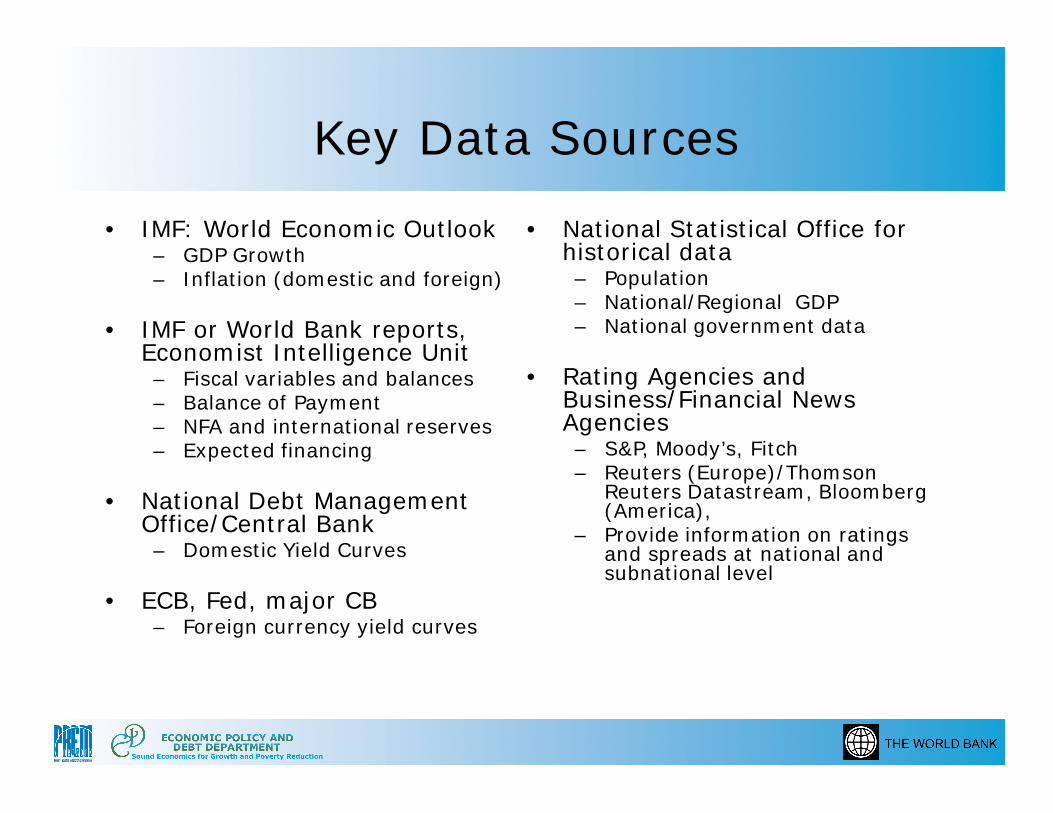
Key Data Sources
• IMF: World Economic Outlook– GDP Growth– Inflation (domestic and foreign)
• IMF or World Bank reports, Economist Intelligence Unit
– Fiscal variables and balances– Balance of Payment– NFA and international reserves– Expected financing
• National Debt Management Office/Central Bank
– Domestic Yield Curves
• ECB, Fed, major CB– Foreign currency yield curves
• National Statistical Office for historical data
– Population– National/Regional GDP– National government data
• Rating Agencies and Business/Financial News Agencies
– S&P, Moody’s, Fitch– Reuters (Europe)/Thomson
Reuters Datastream, Bloomberg (America),
– Provide information on ratings and spreads at national and subnational level
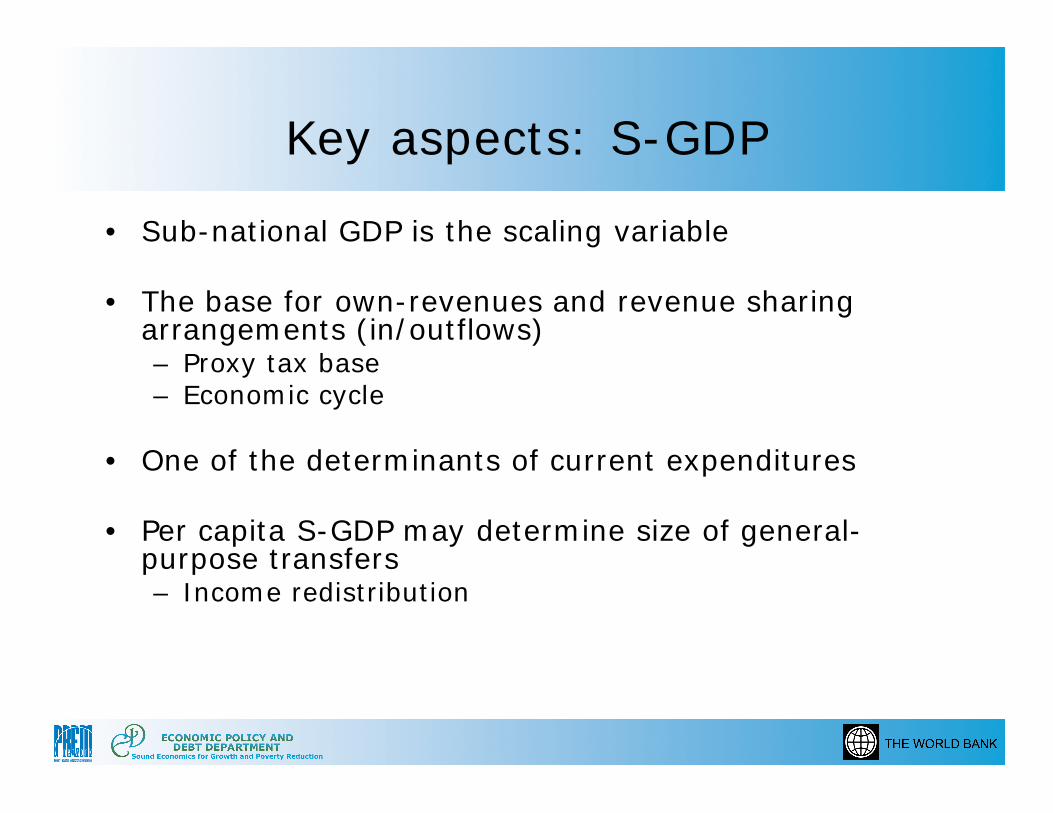
Key aspects: S-GDP
• Sub-national GDP is the scaling variable
• The base for own-revenues and revenue sharing arrangements (in/outflows)– Proxy tax base– Economic cycle
• One of the determinants of current expenditures
• Per capita S-GDP may determine size of general-purpose transfers– Income redistribution

National Fiscal System
• Local or sub-national taxes need to be viewed in context of overall national fiscal system of public expenditures and financing
• National governments typically have comparative advantage in revenue raising, while sub-national have comparative advantage in public service delivery
• Expenditure and revenue functions need to be assigned to levels of government and imbalances have to be filled with transfers

Expenditure and Revenue Assignment
• Conceptually, begin by assigning expenditure functions to sub-national governments
• Then, determine financing– Own source revenues including taxes and fees– Transfers– Debt financing
• All sub-national governments must confront a hard budget constraint

Key aspects: Revenues
• Own-source revenue: sub-national defines both the definition of taxable bases and rate structure of the revenue source
• Surcharges or piggybacking on central taxes: (bounded) degree of control over the tax rate, but not the base
• Revenue sharing arrangements: bases and rates are defined by the central government
• Intergovernmental grants: general purpose; special purpose

Tax Revenues
• Very few absolutes– Taxes with large and elastic bases—such as
income taxes—should be assigned to the central government as the best instruments for both macroeconomic stabilization and income redistribution
– Higher level should have taxes which could distort location of economic activity
– Higher level should have taxes that are difficult to administer locally –e.g.,economies of scale in administration

Sub-National Tax Revenues
• Personal Income Tax• Corporate Income Tax• User fees and charges• Property Tax• Sales and Excise Tax• Value-Added Tax• Resource Tax

Example 1: Property Tax
• Pros– Immobile tax base– Visible– Stable yield– Linked to benefits
• Challenges– Difficult administration
• Set up well-functioning cadastres• Can discourage property transfers
– Often low yield

Example 2: Personal Income Tax
• Pros– Buoyant revenues– Visible (increases accountability)– Cost-effective if piggybacked on national taxation
• Challenges– May create or aggravate horizontal imbalances
(rich vs. poor regions)– In areas where average incomes are below
threshold, insufficient yield as most people would not pay
– If levied at different rates among jurisdictions, it may create distortions if people are mobile.

Forecasting Tax Revenue 1/2
Effective Tax Rate Approach– Observed data for the effective tax rate of a tax category
• Effective tax rate = tax revenues/tax base– Forecast the tax base– Revenue = [Tax base]*[Effective tax rate]– Key assumptions: Unchanged tax base structure, tax system, and
compliance
Type of tax Proxy base
VAT, Excises, Sales Private consumption
Individual income tax GDP
Corporate income tax Corporate profits or GDP
Other taxes GDP

Forecasting Tax Revenue 2/2
Tax Elasticity Approach
• If GDP is a proxy for actual tax base, then
• Where:AT is the tax receipts from an unchanged tax system, and the change during a period.
elasticity of tax
revenue =
base tax the in change percentage systemtax unchanged an under
revenues tax in change percent
GDPGDPATAT
//

Other revenues 1/2
• Other revenues are a small proportion of revenues at the national level– Except in resource rich countries
• Are an important source of revenues at the sub-national level– Revenue-sharing, often used to close vertical fiscal imbalances– They can be based on either individual taxes or total tax
collection
• Transfers also correct vertical imbalances between the spending responsibilities and tax revenues devolved to the local level– General purpose– Special purpose

Other revenues 2/2
• Three key factors in the design of intergovernmental revenue sharing and fiscal transfers
– Size of the pool available for distribution– Rules for distributing revenues and transfers– Conditionality
• Three possible ways to determine distribution of intergovernmental fiscal revenues/transfers
– Fixed proportion of central government revenues or some other “macro” basis, for example, as a percentage of gross domestic product
– On an ad hoc basis, that is, in the same way as any other discretionary budgetary expenditure
– On a formula-driven basis, for instance, as a proportion of specific local expenditures
• Institutional setting is key to determine the reliability of a flow of intergovernmental revenues and transfers

Key aspects: Expenditures
• Vertical fiscal imbalances are covered mainly by transfers from central government
Source: Eyraud and Lusinyan, 2011
-20
0
20
40
60
80
100
-20
0
20
40
60
80
100
IS DE
CA
CH SE FI FR AT LU NO CZ PT IL DK SI ES EE PL IT HU KR GR BE NL
UK IE MX
Vertical fiscal imbalanceNet transfersBorrowing
Level(Average over 1995–2007)

Key aspects: Expenditure
• Decentralization of expenditure usually precedes that of revenues
• Central government influence on key expenditure is usually high
• Definition of expenditure– Economic classification
• Recurrent expenditure– Interest
• Capital expenditure
– Functional classification

Economic Classification
• Compensation of employees/Wages and salaries
• Goods and services• Interest payments• Transfers (to municipalities/horizontal tr.)• Pensions• Unemployment

0%
10%
20%
30%
40%
50%
60%
70%
80%
90%
100%
All functions (100 %)
General public
services (13.96 %)
Environment protection
(1.56 %)
Health (14.50 %)
Education (13.07 %)
Social protection (34.45 %)
Economic affairs,
housing and community amenities (12.62 %)
Other(1) (9.84 %)
1995
2005
Functional Classification: Share of Sub-National Government Spending
Bach, Blöchliger, Wallau, (OECD, 2009) Share in 2005 total government expenditure

Expenditure Shares and Powers• Power of SNGs over their own budget is limited
– difficulties to set spending priorities or to enforce pending cuts
Bach, Blöchliger, Wallau, (OECD, 2009) Spending power indicators: 1 lowest; 10 highest
012345678910
0
50
100
Pub.
Tra
nsp.
Educ
ation
Child
& E
eld.
Car
e
Pub.
Tra
nsp.
Educ
ation
Child
& E
eld.
Car
e
Pub.
Tra
nsp.
Educ
ation
Child
& E
eld.
Car
e
Pub.
Tra
nsp.
Educ
ation
Child
& E
eld.
Car
e
Educ
ation
DEU DNK PRT SVK IRL
Exp. Shares (in percent)Spending power (right axis)

Forecasting Expenditures 1/3
• Two main categories of expenditures:– Discretionary
• Depend on government policies• Some discretionary expenditures are entitlements
that depend on business cycle
– Non-discretionary • Interest payments• Determined by law: Social security payments,
unemployment benefits, pensions

Forecasting Expenditures 2/3
Discretionary Expenditures• Wages and salaries
– Number of employees is influenced by institutional reforms in government sector
– Prices can be forecasted from GDP deflator
• Goods and services– Volumes– Prices
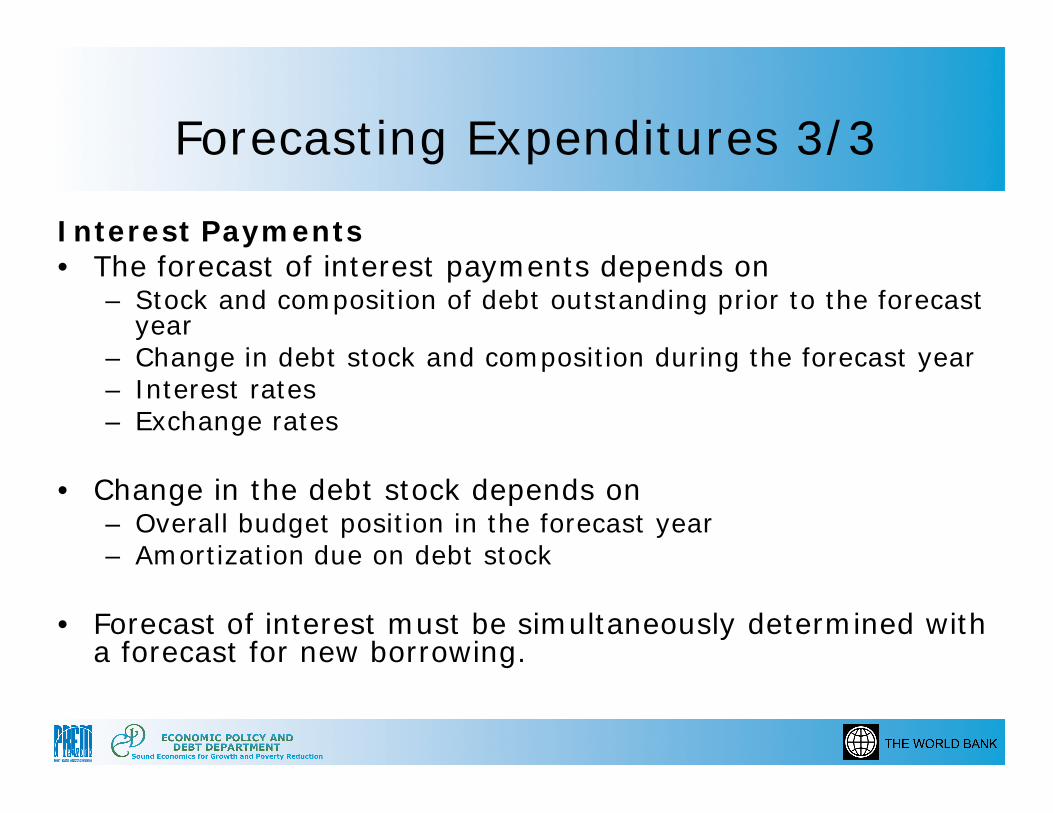
Forecasting Expenditures 3/3
Interest Payments • The forecast of interest payments depends on
– Stock and composition of debt outstanding prior to the forecast year
– Change in debt stock and composition during the forecast year– Interest rates– Exchange rates
• Change in the debt stock depends on– Overall budget position in the forecast year– Amortization due on debt stock
• Forecast of interest must be simultaneously determined with a forecast for new borrowing.

Forecasting Expenditures 3/3 -Concluded
Interest Payments
• Effective interest rate
dttt
tftttt
t
iDomAmtNewBorrowDomDebt
eiForAmtForBorrowExtDebtymentsInterestPa
*]2/12/1[
**2/1($)2/1($)
1
1
1/ ttt DebtymentsInterestPaEffIntRate

Sub-National Borrowing
• State and local debt and guaranteed debt for quasi-public agencies have been growing in importance– Examples: India, Brazil, China
• Subnationals account for 50% or more of public investment – Bolivia, China, Czech, France, Indonesia,
Latvia, Peru, Poland, Serbia, Slovak, Ukraine

Factors Critical to Sustainable Subnational Borrowing
• The sovereign’s macroeconomic fundamentals will continue to be vital to the fiscal sustainability of SNGs
• Sovereign rating as a binding constraint for sub-sovereign ratings (Fitch, Moody’s, S&P)
• Macroeconomic cycles and subnational credit market development– Recent global financial crisis and subnational credit market– With the gradual withdrawal of fiscal stimulus packages and
the ending of monetary easing, pressures on SNGs’ fiscal space could increase through various channels, such as reduced fiscal transfers and higher borrowing costs
• Risks from unregulated subnational borrowing in unstable macroeconomic environment

Macroeconomic Fundamentals (cont)
• Correlation Between Sovereign and SubsovereignRatings of European Countries
Source: Canuto and Liu 2010, based on S&Ps

Available Financing
• Foreign vs domestic interest rates
• Foreign exchange repayment capacity– Available foreign exchange reserves at the
national level– Access to those reserves
• Access to international markets
• Guarantee of the Central Government

Domestic Financing
• Commercial Bank Financing– Interest rates – Alternative lending opportunities
• On-lending from Central Government– Terms of on-lending– Foreign exchange risk
• Non-Bank Financing– Interest rates – Alternative investment assets– Confidence– Must be consistent with overall demand for domestic assets

Subnational Borrowing Control Rules
Macro Policy Lessons for a Sound Design of Fiscal Decentralization, IMF 2009, Based on Ter-Minassian and Craig, 1997.
Approach Market Discipline
Cooperative Approach
Rules-based Controls
Administrative Controls
Advantages Emphasis on self-control Monitoring by credit rating agencies
Promotes dialogue Enhances responsibility of subnational policymakers
Transparent Avoids bargaining
Potential central government (CG) control Better terms and conditions Useful for foreign borrowing
Preconditions Comprehensive, timely, and reliable information Developed financial markets No access to privileged financing No previous history of bailouts
Constitutional underpinnings Culture of fiscal discipline Existence of institutions for cooperative decision-making or strong bargaining position of central government
Sound and credible rules (e.g., well defined, transparent, and flexible) Clear coverage and full information needed
Ability of CG to effectively monitor and implement controls
Examples Canada Australia
Argentina’s bilateral pacts Austria Denmark DSPs in EU countries
Brazil Chile Spain United States
China France Japan United Kingdom

Sensitivity Analysis
– Econometric techniques if historical data available
• Stochastic simulations
– Stress tests• Deterministic• Alternative scenarios
– Discussion of fiscal risks• Pension funds• Banks• SPV, SOEs• Arrears (a.k.a. floating)• Judiciary decisions
– Constraints to fiscal adjustments
• Revenue• Expenditure
• Fiscal sustainability analysis should account for uncertainty linked to projections of economic variables

Conclusions
• Sub-national fiscal sustainability analysis needs– Macroframework– Medium term Fiscal Framework
• Consistent with the national macroframework– Exchange rate, inflation rates– Shared revenues, transfers, expenditures– Borrowing costs
• The subnational fiscal framework needs detailed assumptions– Own revenues– Rules governing transfers and borrowing– Spending power– Financing assumptions
• Sensitivity analysis to account for uncertainty
• Importance of the institutional settings which shape fiscal and debt management policies of subnational and national governments

References
– Bach Steffen, Hansjörg Blöchliger, and Dominik Wallau [2009], The Spending Power of Sub-Central Governments, OECD.
– Bird Richard M. [2010], Subnational Taxation in Developing Countries, World Bank Policy Research Working Paper 5450.
– Bird Richard M., and François Vaillancourt (Ed.) [2006], Perspectives on Fiscal Federalism, The World Bank.
– Canuto Otaviano, and Lili Liu [2010], Subnational Debt Finance and the Global Financial Crisis, Economic Premise, The World Bank.
– Elena Ianchovichina, and Lili Liu [2008], Subnational Fiscal Sustainability Analysis, PREM Notes. The World Bank.
– Eyraud Luc, and Lusine Lusinyan [2011], Decentralizing Spending More than Revenue: Does It Hurt Fiscal Performance?, IMF WP WP/11/226
– Fiscal Affairs Department [2009], Macro Policy Lessons for a Sound Design of Fiscal Decentralization, IMF.