day 4 considerations for interpretation confounding 1
TRANSCRIPT
DAY 4
Considerations for Interpretation
Confounding
1
Introduction
Understanding what the data can tell us and cannot tell us
2
3
Approach to understanding the data
If we see an association, what other possible explanations can there be besides causation?
- Confounding

Confound
“To confuse”
4
Webster’s Online Dictionary www.webster-dictionary.org
“To mistake for another”

5
Guilt by association
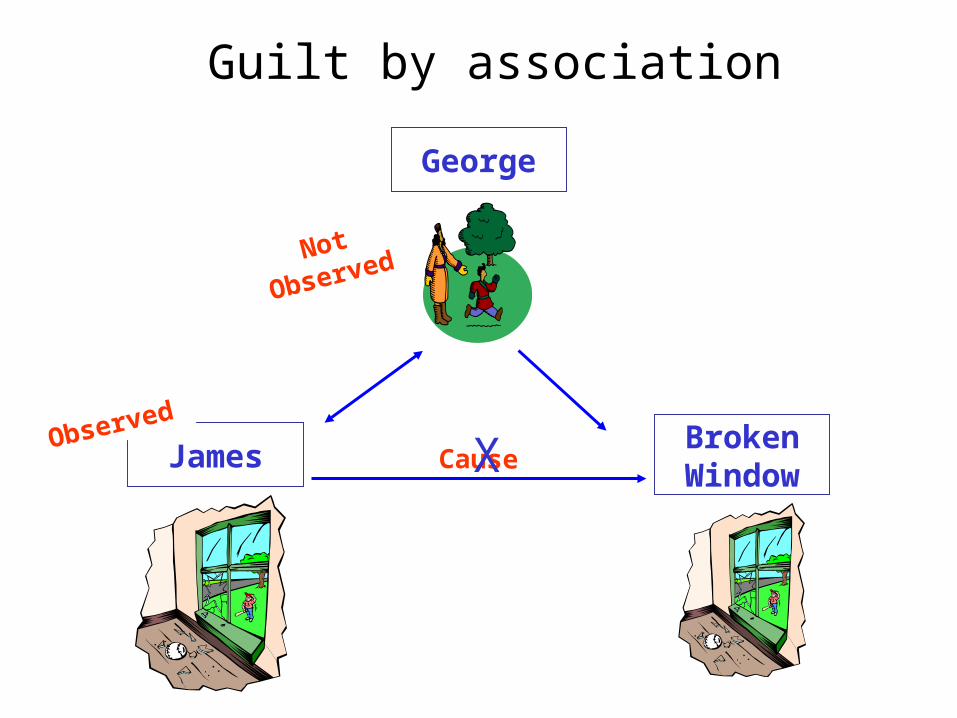
Not Observed
James CauseXObservedBroken Window
George
Guilt by association
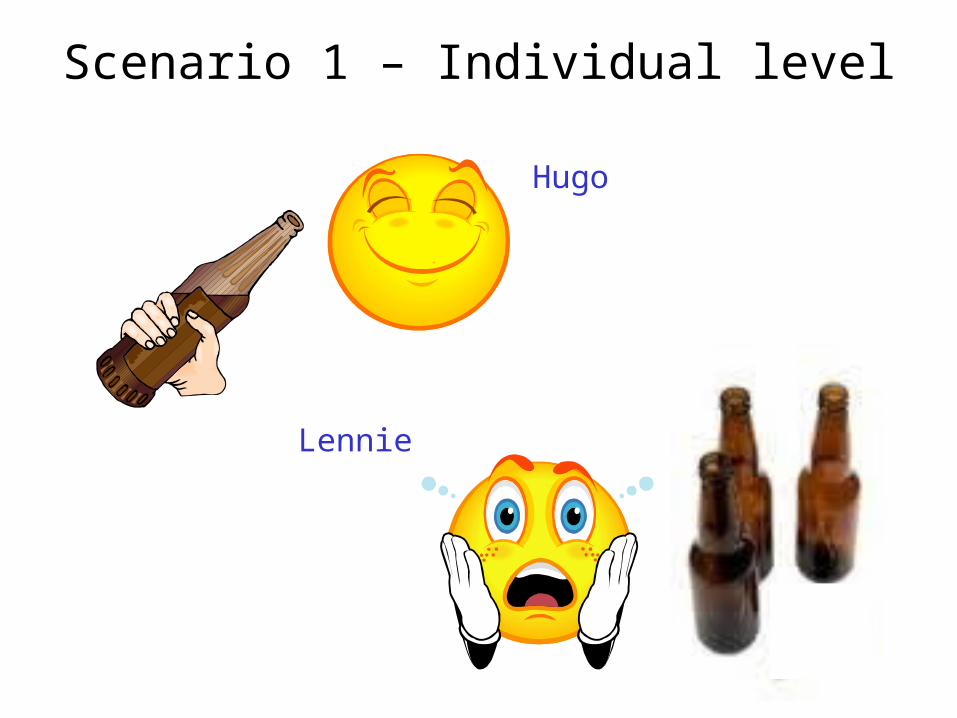
Scenario 1 – Individual level
Hugo
Lennie
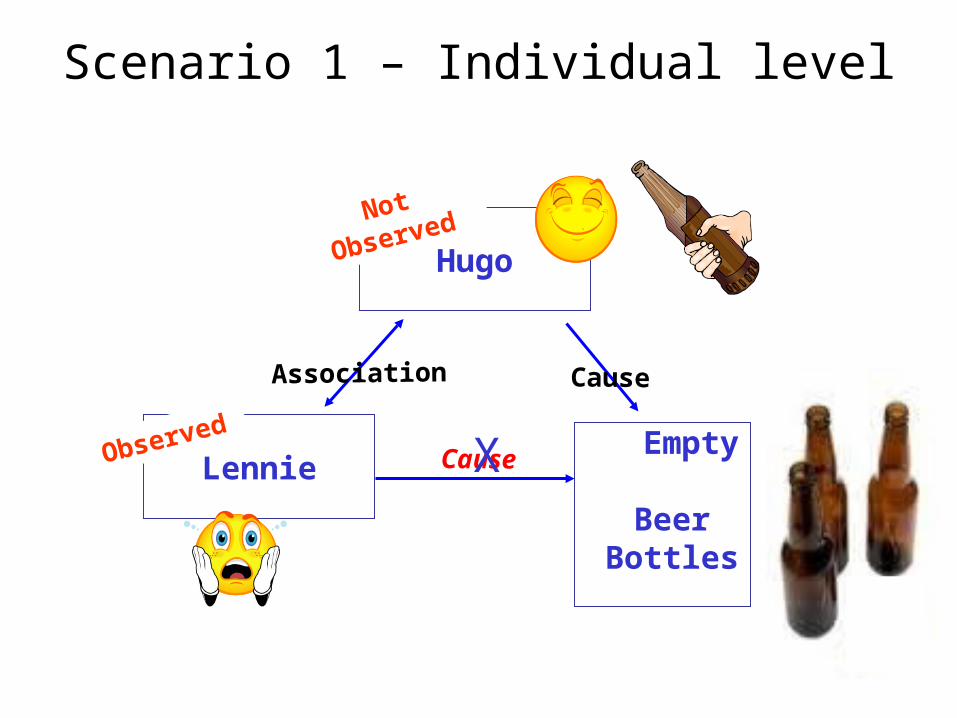
HugoNot Observed
Empty Beer Bottles
Lennie Cause
Association Cause
XObserved
Scenario 1 – Individual level

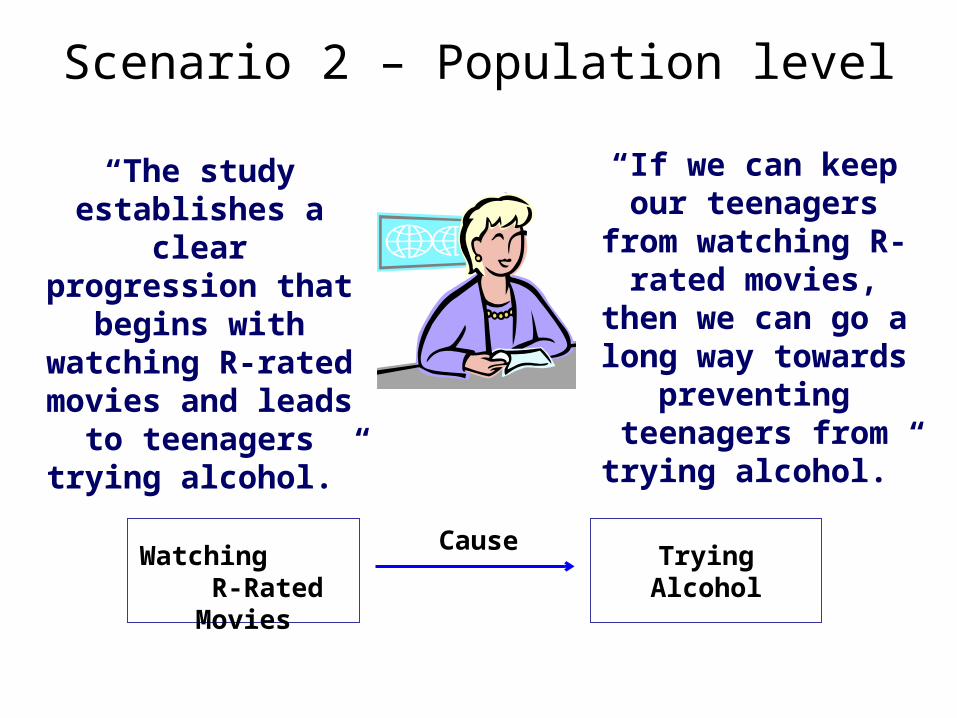
Scenario 2 – Population level

Try Alcohol Not Try Alcohol
6Yes R-Rated
Movies
No R-Rated Movies
90
b
d
a
c
PrevalencePrevalence
Ratio
Scenario 2 – Population level
People who _____________ are ______times as likely
to __________ as people who ____________.
Trying Alcohol Watching
R-Rated Movies
“The study establishes a clear progression that
begins with watching R-rated
movies and leads to teenagers trying
alcohol.”
“If we can keep our teenagers from
watching R-rated movies, then we
can go a long way towards preventing
teenagers from trying alcohol.”
Cause
Scenario 2 – Population level

?
Trying Alcohol Watching
R-Rated Movies
Cause
Association Cause
X
Scenario 2 – Population level

13
A situation in which an association between an exposure and an outcome is observed as a result of the influence of a third, unobserved, factor, called a confounder.
The true effect of an exposure on an outcome is distorted because it is mixed up with another factor that can influence the outcome.
The confounder is both associated with the observed exposure and is a possible cause of the outcome.
Confounding

Unobserved Exposure
Try alcoholWatch
R-rated movies
Limited Adult
Supervision
Watch out for lurking variables!

Unobserved Exposure
Try alcoholWatch R-rated movies
Willingness to
Break the Rules

Unobserved Exposure
Try alcoholWatch R-rated movies
Poor Self-Control
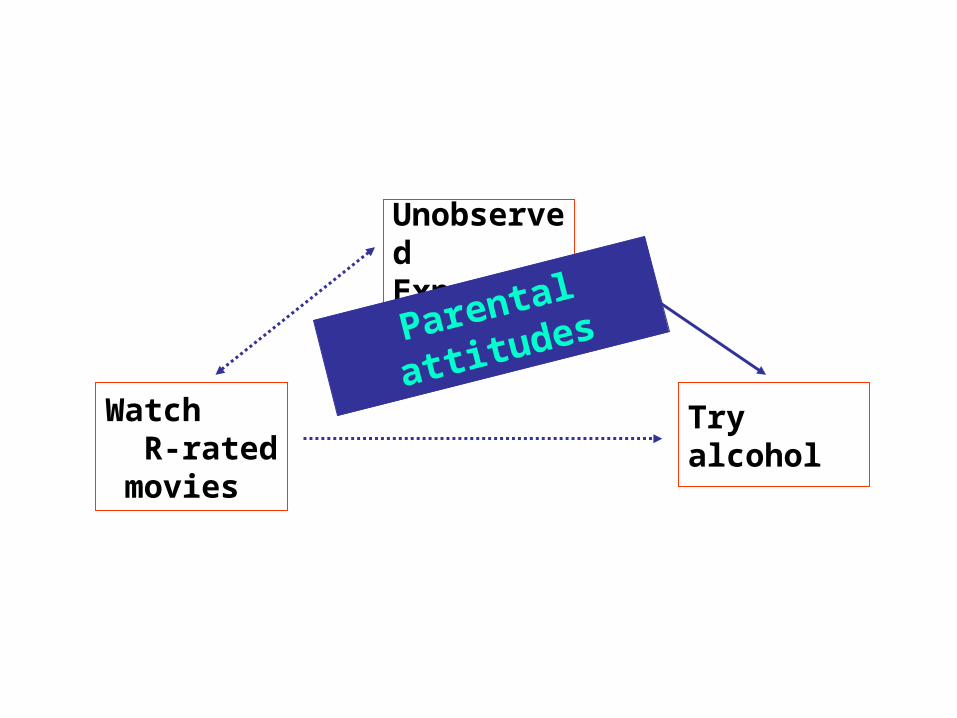
Unobserved Exposure
Try alcoholWatch R-rated movies
Parental attitudes

Unobserved Exposure
Try alcoholWatch R-rated movies
Risk taker
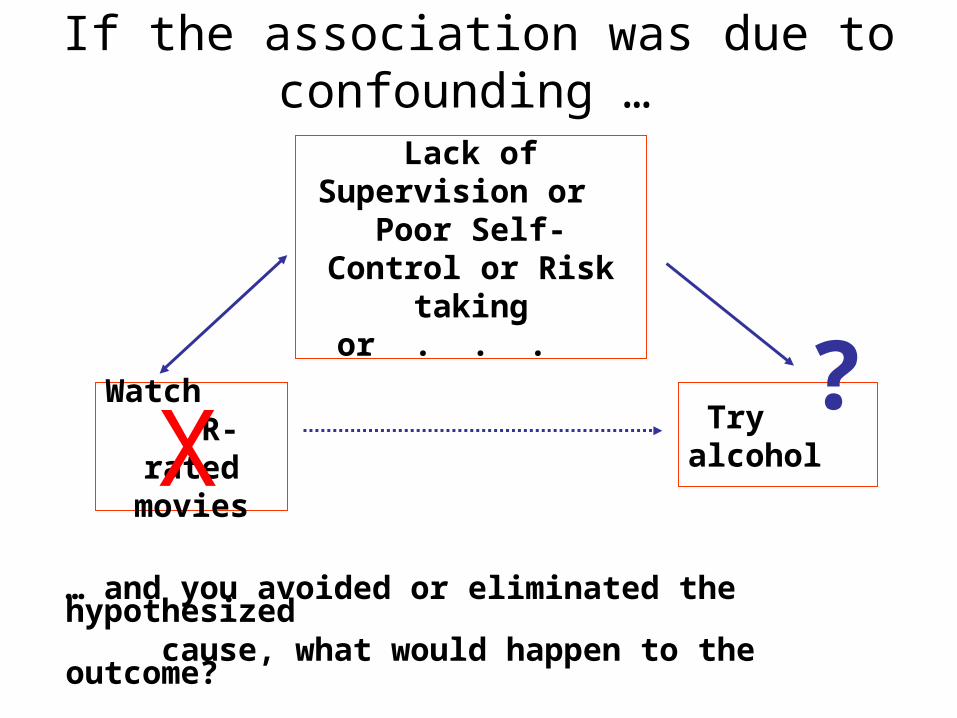
Lack of Supervision or Poor Self- Control or Risk taking or . . .
Try alcoholWatch
R-rated moviesX
… and you avoided or eliminated the hypothesized cause, what would happen to the outcome?
?
If the association was due to confounding …
Cause
Association Cause
X
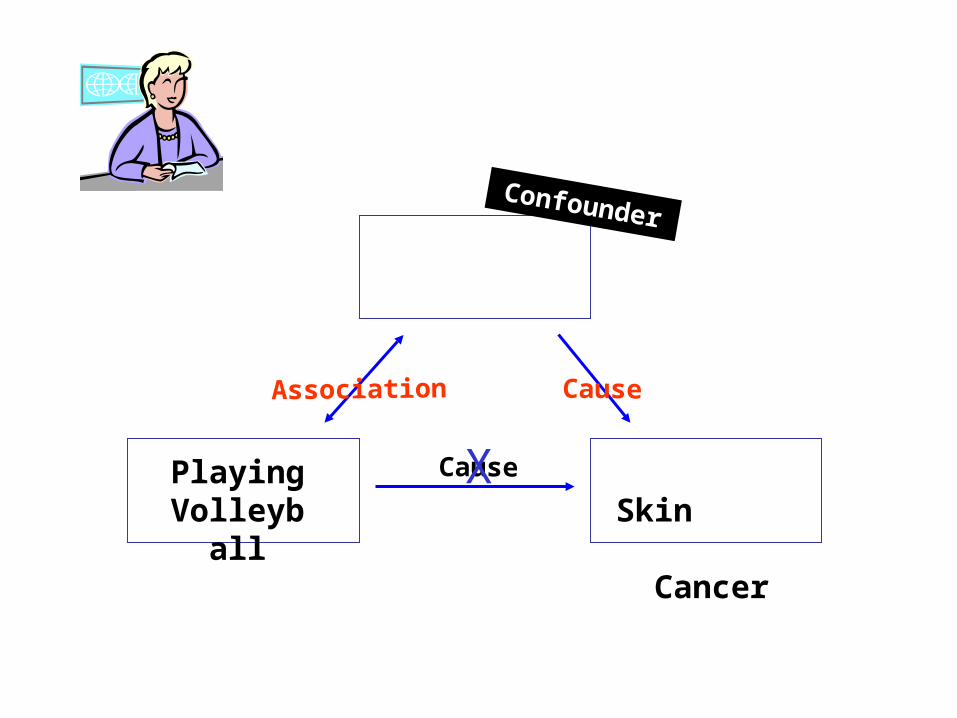
Confounder
Playing Volleyball
Skin Cancer

Cause
Association Cause
X
Confounder
Drinking Alcohol
Lung Cancer

Cause
Association Cause
X
Confounder
Eating Pretzels
Auto Accidents
Cause
Association Cause
X
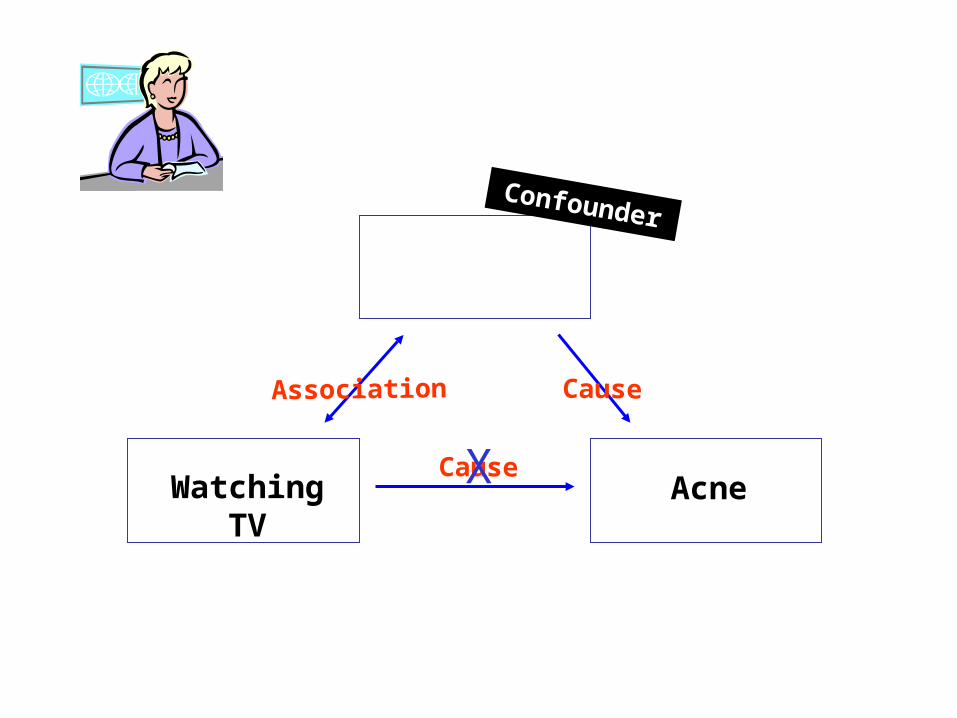
Confounder
Watching TV Acne
Cause
Association Cause
X
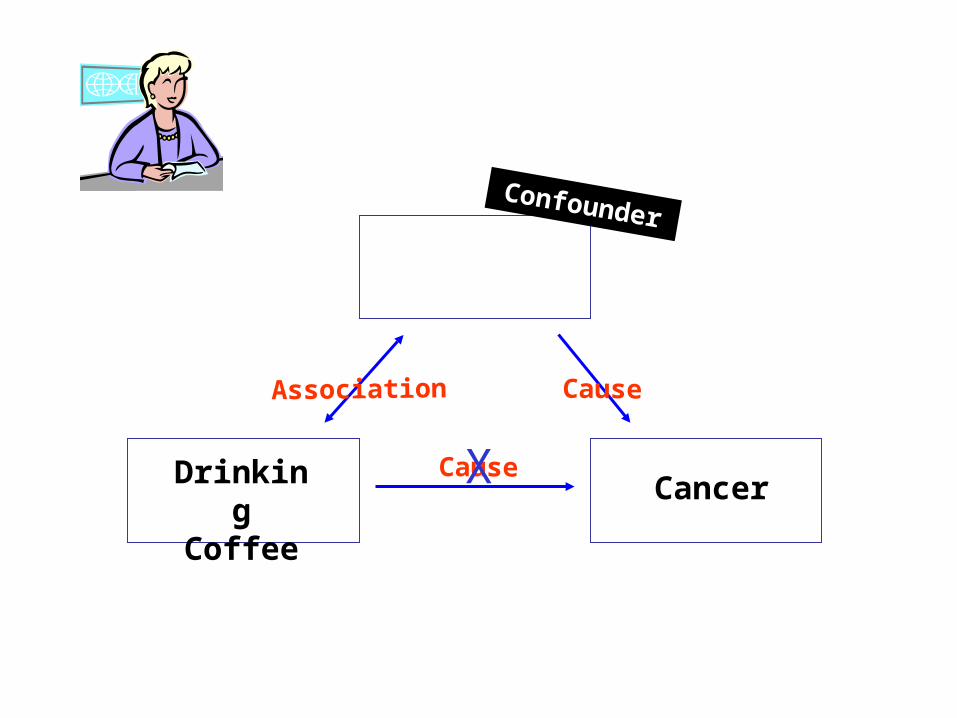
Confounder
Drinking Coffee
Cancer
Cause
Association Cause
X
Confounder
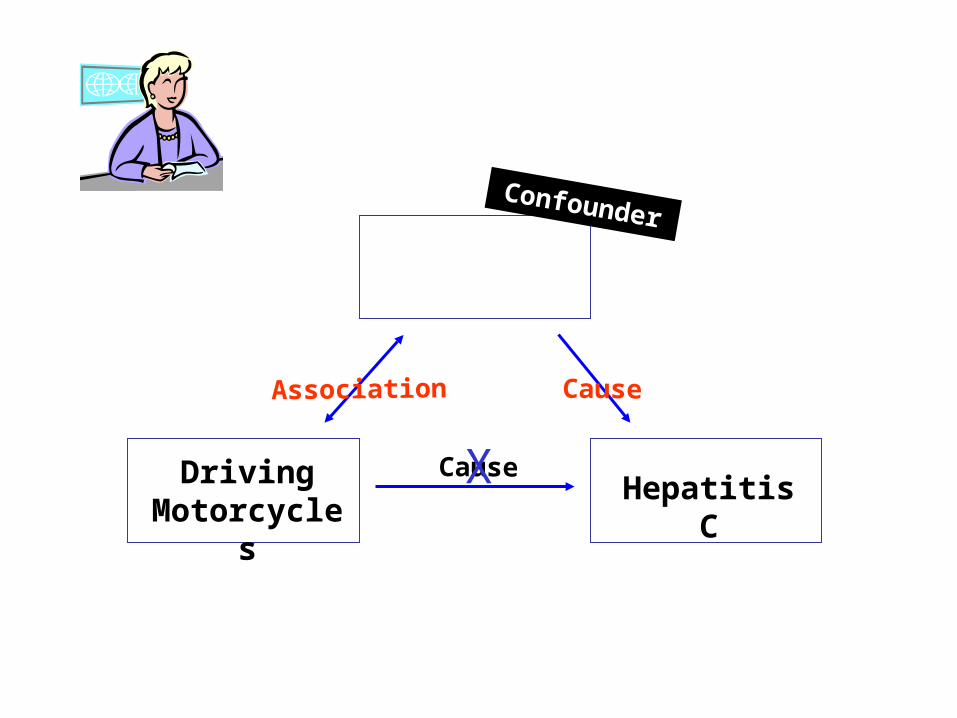
Driving Motorcycles
Hepatitis C
Cause
Association Cause
X
Confounder
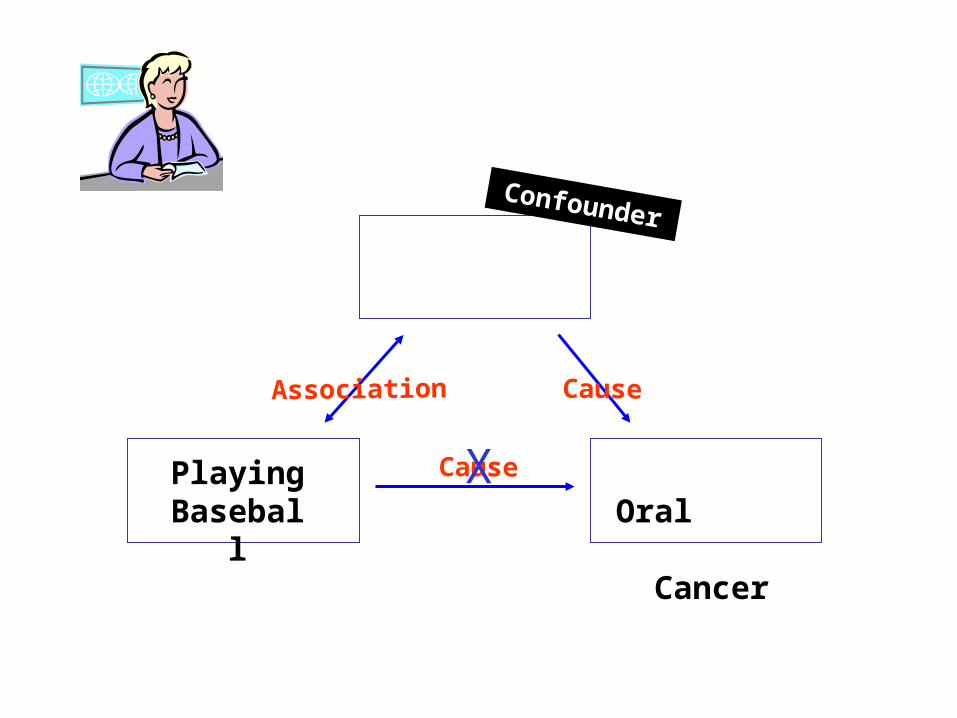
Playing Baseball
Oral Cancer

Cause
Association Cause
X
Confounder
Sand Skin
Cancer

Association is not necessarily causation.
Association is not necessarily causation.
Association is not necessarily causation.
Association is not necessarily causation.
Association is not necessarily causation.
Association is not necessarily causation.
Association is not necessarily causation.
Association is not necessarily causation.
Always Remember

Supplementary Lesson about Confounding

The confounder is associated with the observed exposure (but not affected by the exposure).
The confounder is a possible cause of the outcome.
Two criteria for Confounding
Possible Confounder
OutcomeExposure

31
• We suspect a factor to be a potential confounder based on intuition and evidence that it is associated with the exposure under study and a cause of the outcome under study
• But is this true in the data at hand?
• We can assess this by calculating the strength of association between: 1) exposure and the suspected confounder; and 2) between suspected confounder and outcome.
Possible Confounder
OutcomeExposure
PR = ?PR = ?
PR = ?
32
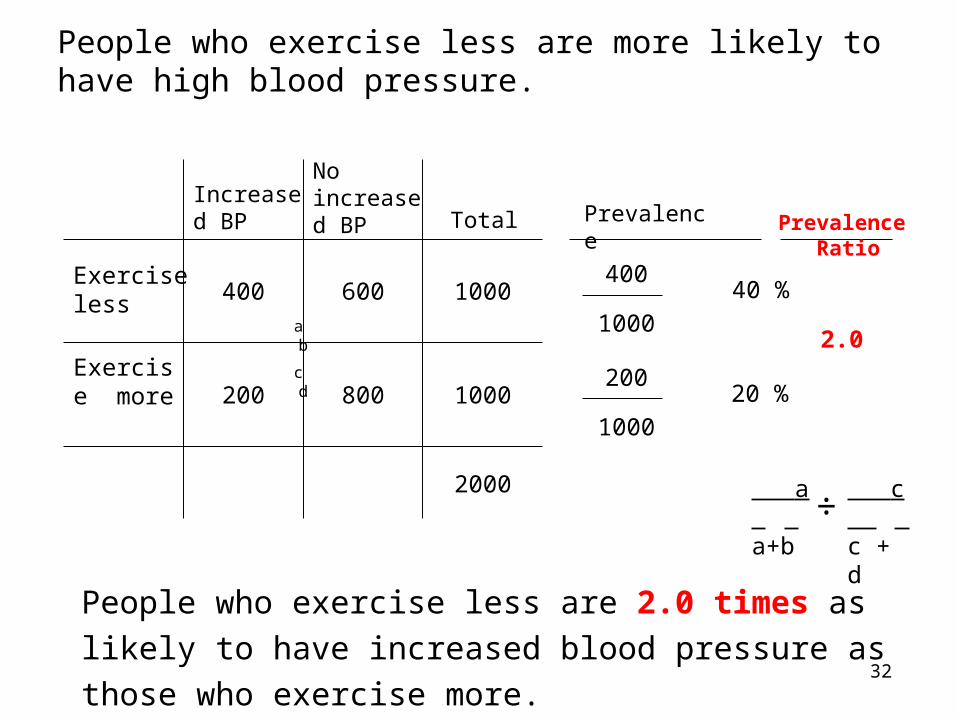
400
1000
40 %400 600 1000 a b
c d
Exercise less
Exercise more
TotalIncreased BP
No increased BP Prevalence
200
1000
20 %200 800 1000
Prevalence Ratio
2.0
÷ a a+b
c c + d
People who exercise less are more likely to have high blood pressure.
People who exercise less are 2.0 times as likely to have
increased blood pressure as those who exercise more.
2000

Cause
Association Cause
X
Confounder?
Exercise less
Increased blood pressure

Smoking
Increased blood
pressure
Exercise Less
PR = ?PR = ?
PR = 2.0
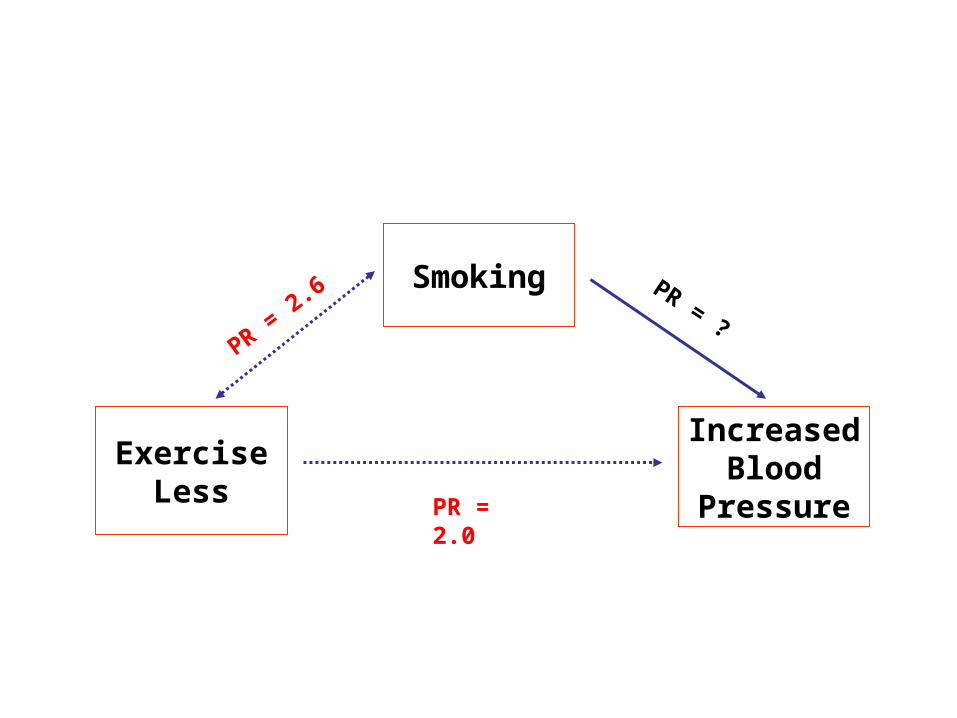
Assessment of smoking as a potential confounder
See if it meets two criteria for confounding
1. Associated
with
the exposure?
2. A possible cause
of the outcome?
35
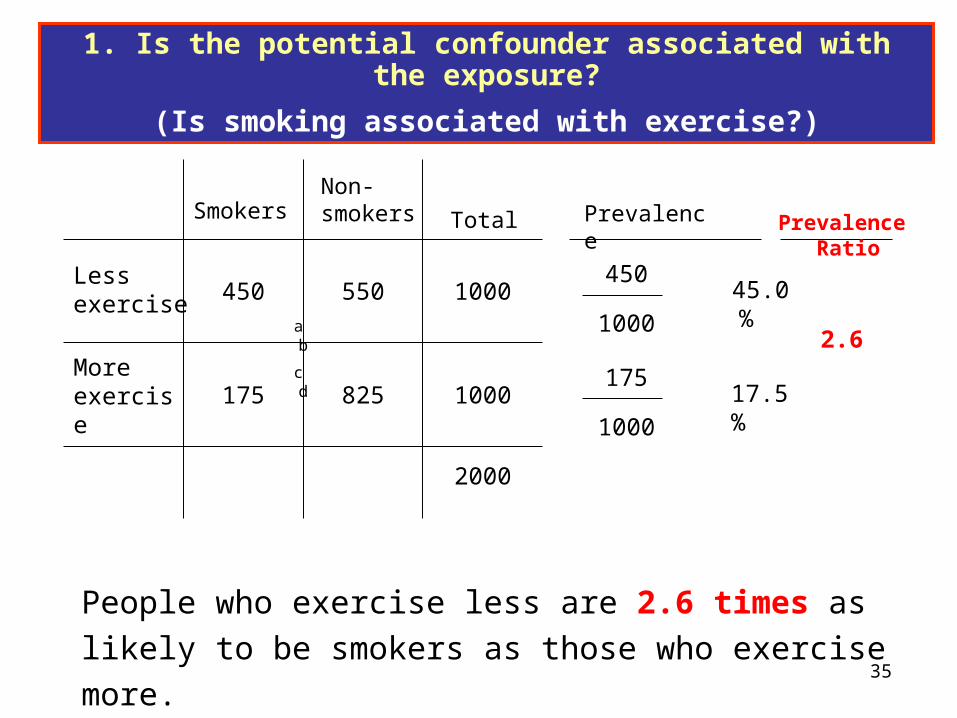
450
1000
45.0 %450 550 1000 a b
c d
Less exercise
More exercise
TotalSmokersNon-smokers Prevalence
175
1000
17.5 %175 825 1000
Prevalence Ratio
2.6
People who exercise less are 2.6 times as likely to be
smokers as those who exercise more.
2000
1. Is the potential confounder associated with the exposure?
(Is smoking associated with exercise?)
Smoking
Increased Blood
Pressure
Exercise Less
PR = 2.6PR = ?
PR = 2.0

37
475
625
76.0 %475 150 625 a b
c d
Smokers
Non-smokers
TotalIncreased BP
No increased BP Prevalence
125
1250
10.0 %125 1250 1375
Prevalence Ratio
7.6
Smokers are 7.6 times as likely to have increased blood
pressure compared to non-smokers.
2000
2. Is the potential confounder a possible cause of the outcome?
(Is smoking a possible cause of increased blood pressure?)
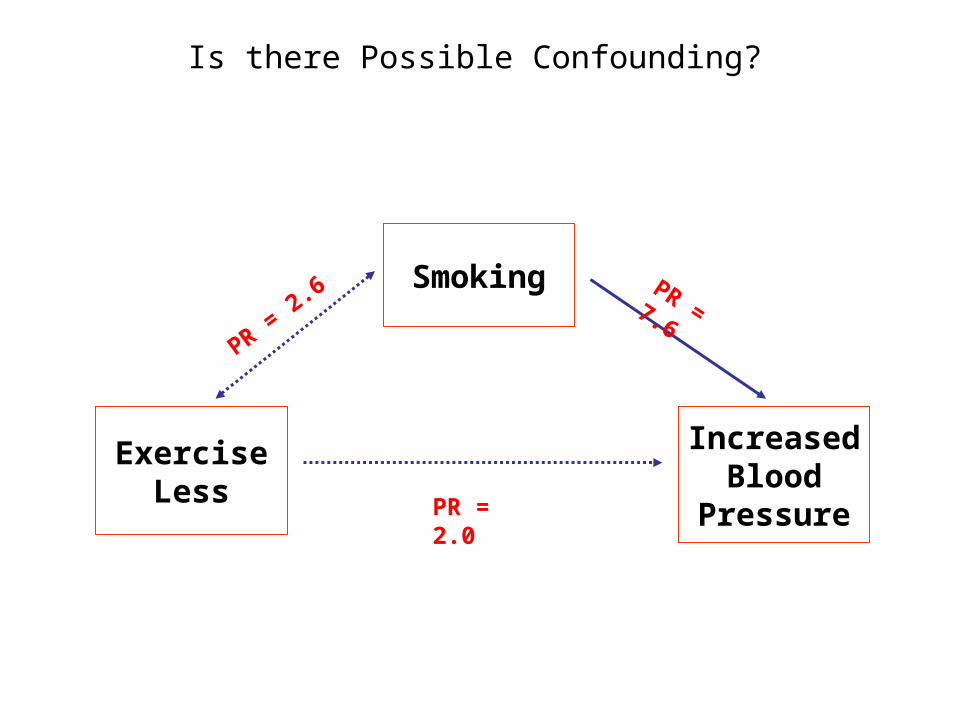
Smoking
Increased Blood
Pressure
Exercise Less
PR = 2.6PR = 7.6
PR = 2.0
Is there Possible Confounding?
39
Marijuana Use and Getting Tattoos

People who ____________________________________________
are ______ times as likely to _______________________________
compared to people who __________________________________ 40
50
200
25 %50 150 200 a b
c d
MarijuanaUser
Not a marijuana User
TotalTattoos
No Tattoos Prevalence
30
200
15 %30 170 200
Prevalence Ratio
1.7
÷ a a+b
c c + d
People who smoke marijuana are more likely to get tattoos than people who do not smoke marijuana.
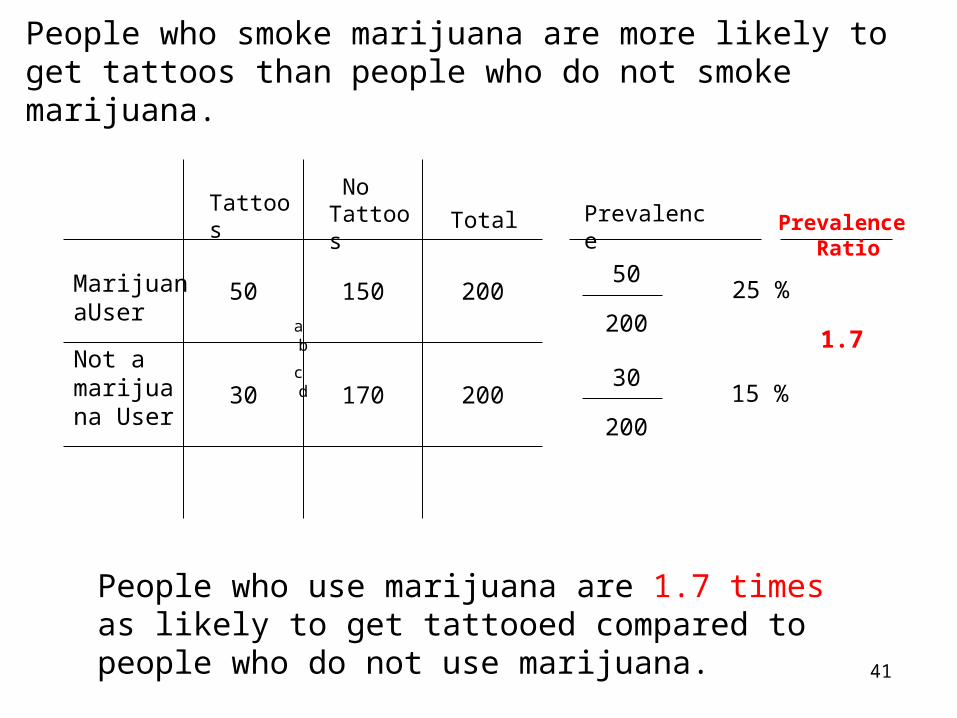
People who use marijuana are 1.7 times as likely to get tattooed compared to people who do not use marijuana. 41
50
200
25 %50 150 200 a b
c d
MarijuanaUser
Not a marijuana User
TotalTattoos
No Tattoos Prevalence
30
200
15 %30 170 200
Prevalence Ratio
1.7
People who smoke marijuana are more likely to get tattoos than people who do not smoke marijuana.
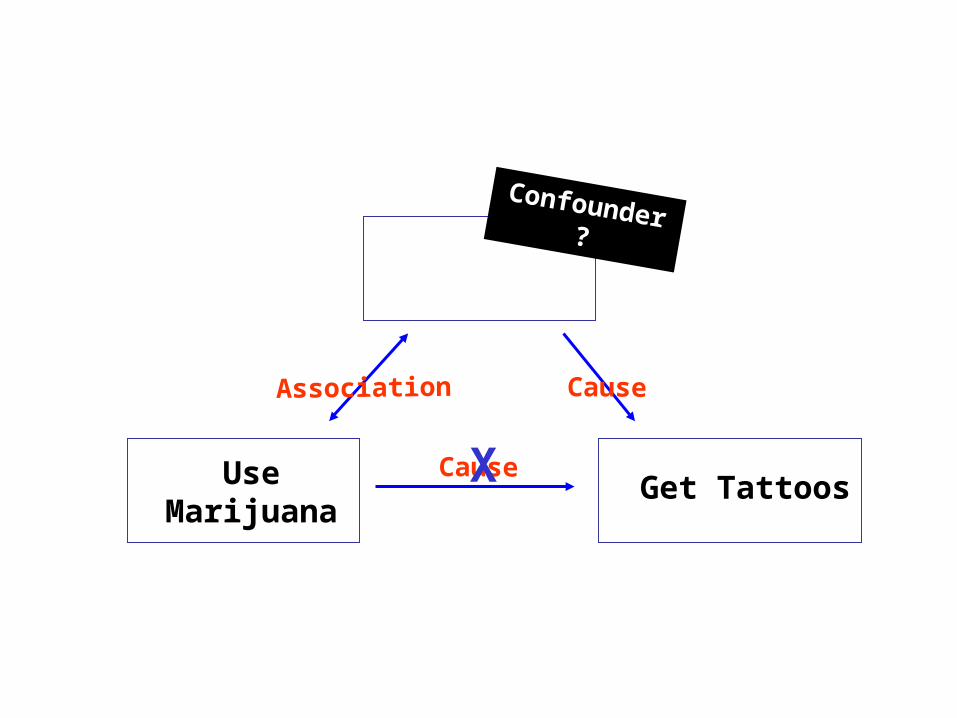
Cause
Association Cause
X
Confounder?
Use Marijuana
Get Tattoos
Access to Money
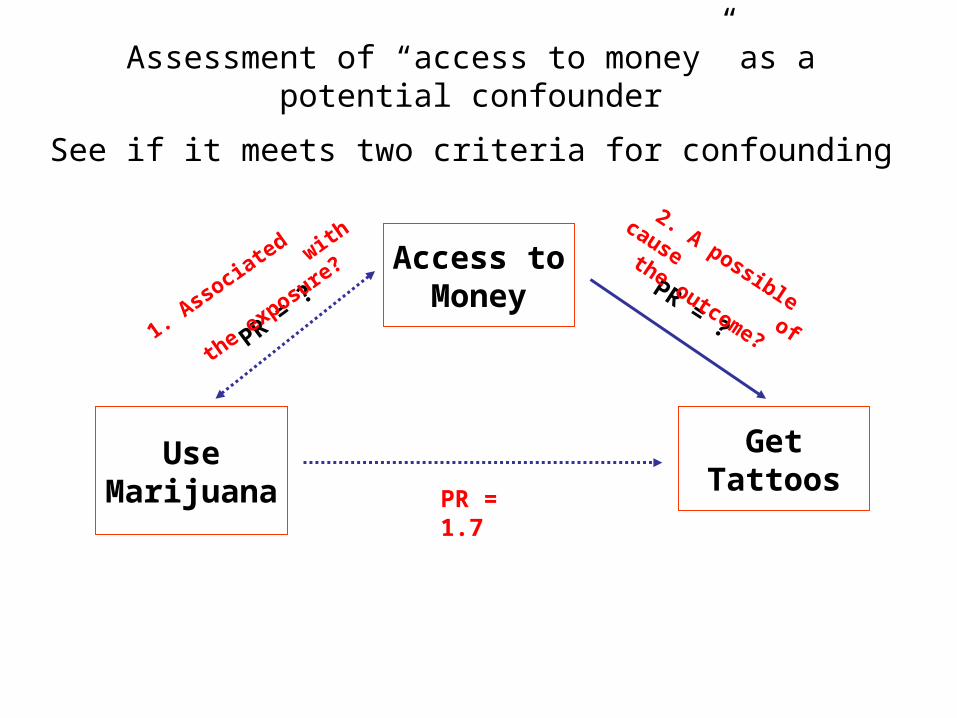
Get TattoosUse Marijuana
PR = ?PR = ?
PR = 1.7
Assessment of “access to money” as a potential confounder
See if it meets two criteria for confounding
1. Associated
with
the exposure?
2. A possible cause
of the outcome?

44
150
200
75.0 %150 50 200 a b
c d
Total Prevalence
50
200
25.0 %50 150 200
Prevalence Ratio
3.0
People who use marijuana are 3.0 times as likely to have
access to money than non-users.
400
MarijuanaUser
Not a marijuana User
Access to Money
No Access to Money
1. Is the potential confounder associated with the exposure?
(Is access to money associated with marijuana use?)
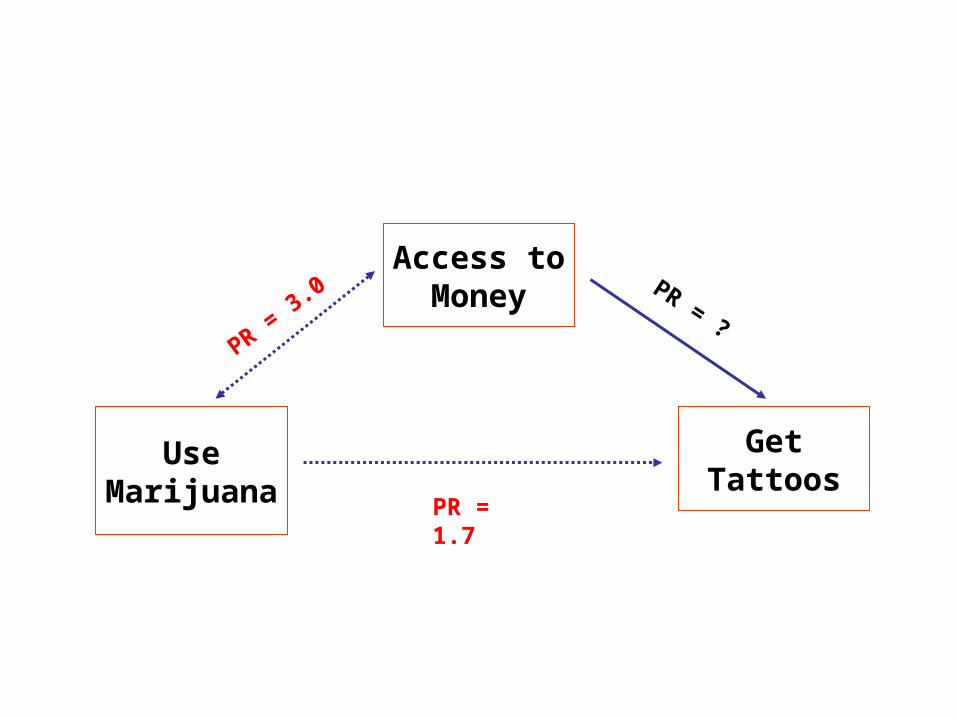
Access to Money
Get TattoosUse Marijuana
PR = 3.0PR = ?
PR = 1.7
46
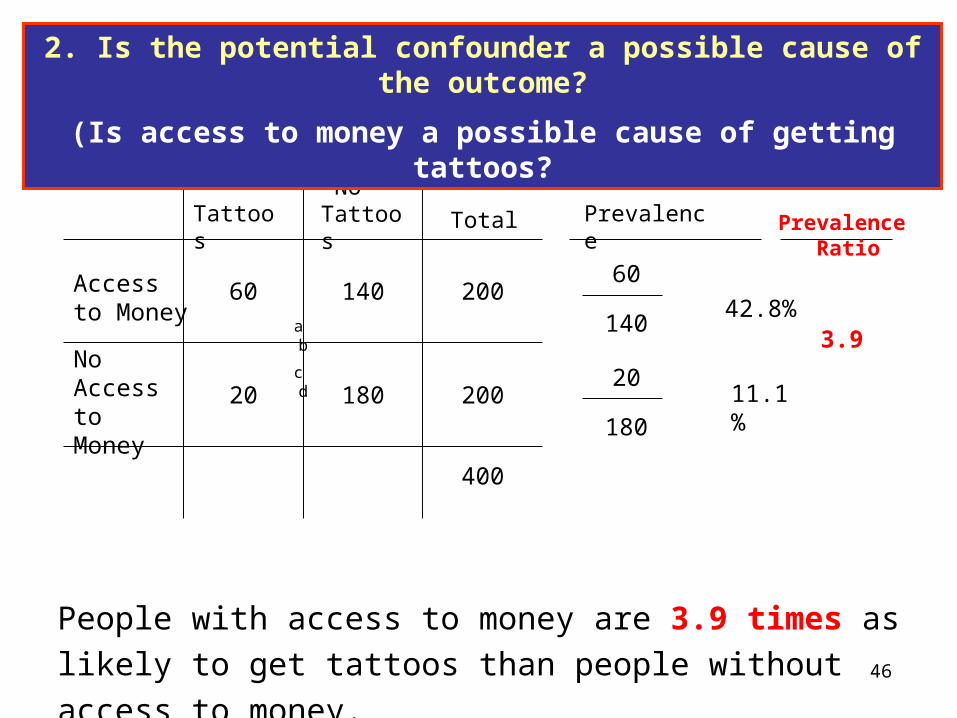
60
140 42.8%
60 140 200 a b
c d
Total Prevalence
20
180
11.1 %20 180 200
Prevalence Ratio
3.9
People with access to money are 3.9 times as likely to get
tattoos than people without access to money.
400
Access to Money
No Access to Money
Tattoos No Tattoos
2. Is the potential confounder a possible cause of the outcome?
(Is access to money a possible cause of getting tattoos?

Access to Money
Get TattoosUse Marijuana
PR = 3.0PR = 3.9
PR = 1.7
Is there Possible Confounding?

Possible Confounder
OutcomeExposure
PR = 0.97 PR = 1.10
PR = 1.8
Associated
with th
e exposure?
A possible cause
of the outcome?
Another Example - Is there Possible Confounding?

Day 4
First Morning Breakout
Assessing Possibility of Confounding
49

50
Use the 54 cards in the deck to explore the potential for confounding in this data set
Deck Worksheet – pages 3-5

Less Frequent Breakfast
High Physical Activity
High SleepPR = ?
PR = ? PR = ?Associa
ted
with th
e exposure?
A possible cause
of the outcome?
Assess Possibility of Confounding by Frequency of Breakfast
Assessing confounding in your study
Assembly to brainstorm ideas . . .
52
Day 4
Second Morning Breakout
Possible confounders you should examine?
53

Possible Confounder(s)?
Your Outcome
Your Exposure
Discuss possible confounding in your study
Label your possible confounding triangle on large post-it
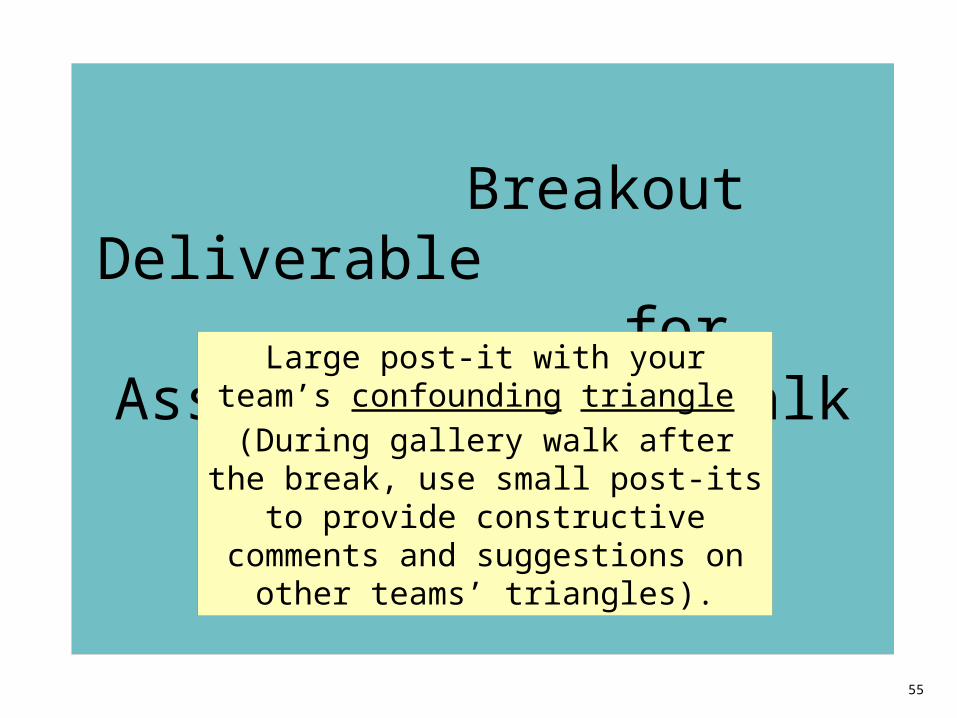
Breakout Deliverable for Assembly/Gallery
walk
55
Large post-it with your team’s confounding triangle
(During gallery walk after the break, use small post-its to provide constructive comments and
suggestions on other teams’ triangles).

56
Study Proposal: Section 7a
7. Considerations for Interpretation
7a. Confounding
Describe how a confounding variable could influence your hypothesized association
Develop one or two additional study questions to help assess possible confounding
If you have time, start this . . .

57
Breakout Session Tips
• Create one or two questions for your survey that will assess possible confounding.
• Your question(s) must be school appropriate
• Limit your answer options to two answers, such as Yes/No, Male/Female, or other 2-choice answers.
Anything else?
58
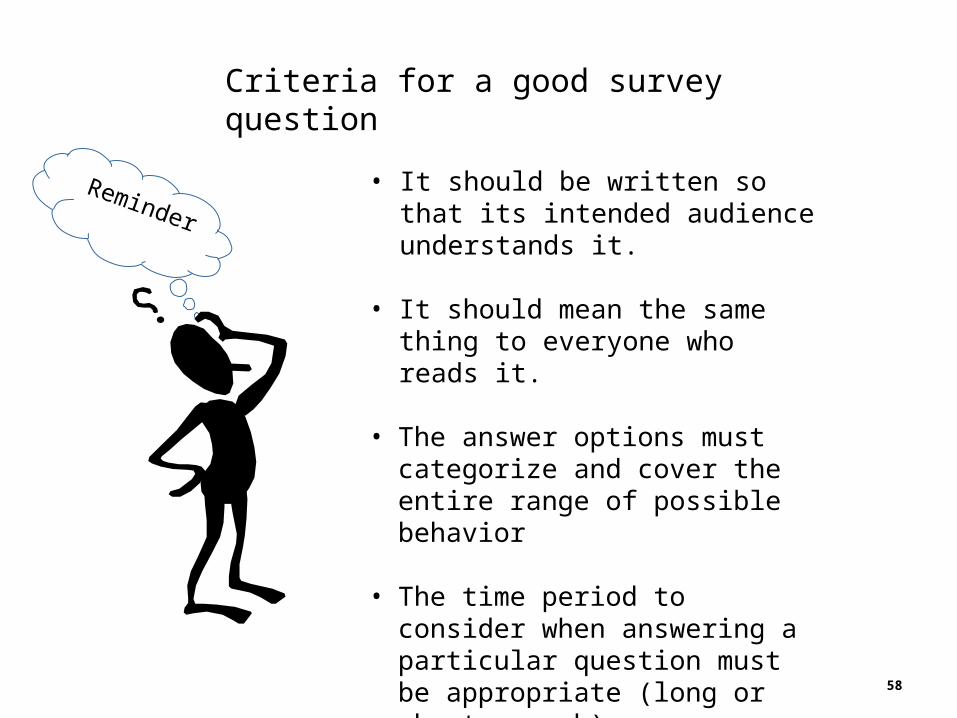
Reminder
• It should be written so that its intended audience understands it.
• It should mean the same thing to everyone who reads it.
• The answer options must categorize and cover the entire range of possible behavior
• The time period to consider when answering a particular question must be appropriate (long or short enough)
Criteria for a good survey question