db16 latin america
TRANSCRIPT

7/24/2019 DB16 Latin America
http://slidepdf.com/reader/full/db16-latin-america 1/101
Regional Profile 2016
Latin America

7/24/2019 DB16 Latin America
http://slidepdf.com/reader/full/db16-latin-america 2/101
LATIN AMERICADoing Business 2016
© 2016 The International Bank for Reconstruction and Development / The World Bank
1818 H Street NW, Washington, DC 20433
Telephone: 202-473-1000; Internet: www.worldbank.org
Some rights reserved1 2 3 4 18 17 16 15
This work is a product of the staff of The World Bank with external contributions. The findings, interpretations,
and conclusions expressed in this work do not necessarily reflect the views of The World Bank, its Board of
Executive Directors, or the governments they represent. The World Bank does not guarantee the accuracy of
the data included in this work. The boundaries, colors, denominations, and other information shown on any
map in this work do not imply any judgment on the part of The World Bank concerning the legal status of any
territory or the endorsement or acceptance of such boundaries.
Nothing herein shall constitute or be considered to be a limitation upon or waiver of the privileges and
immunities of The World Bank, all of which are specifically reserved.
This work is available under the Creative Commons Attribution 33.0 IGO license (CC BY 3.0
IGO). http://creativecommons.org/licenses/by/3.0/igo. Under the Creative CommonsAttribution license, you are free to copy, distribute, transmit, and adapt this work, including for commercial
purposes, under the following conditions:
Attribution—Please cite the work as follows: World Bank. 2016. Doing Business 2016: Measuring Regulatory
Quality and Efficiency . Washington, DC: World Bank Group. DOI: 10.1596/978-1-4648-0667-4. License: Creative
Commons Attribution CC BY 3.0 IGO
Translations— If you create a translation of this work, please add the following disclaimer along with the
attribution: This translation was not created by The World Bank and should not be considered an official World
Bank translation. The World Bank shall not be liable for any content or error in this translation.
Adaptations— If you create an adaptation of this work, please add the following disclaimer along with the
attribution: This is an adaptation of an original work by The World Bank. Views and opinions expressed in the
adaptation are the sole responsibility of the author or authors of the adaptation and are not endorsed by The
World Bank.
Third-party content—The World Bank does not necessarily own each component of the content contained
within the work. The World Bank therefore does not warrant that the use of any third-party-owned individual
component or part contained in the work will not infringe on the rights of those third parties. The risk of claims
resulting from such infringement rests solely with you. If you wish to re-use a component of the work, it is your
responsibility to determine whether permission is needed for that re-use and to obtain permission from the
copyright owner. Examples of components can include, but are not limited to, tables, figures or images.
All queries on rights and licenses should be addressed to the Publishing and Knowledge Division, The World
Bank, 1818 H Street NW, Washington, DC 20433, USA; fax: 202-522-2625; e-mail: [email protected].
ISBN (paper): 978-1-4648-0667-4ISBN (electronic): 978-1-4648-0668-1
DOI: 10.1596/978-1-4648-0667-4
ISSN: 1729-2638
Cover design: Corporate Visions, Inc.

7/24/2019 DB16 Latin America
http://slidepdf.com/reader/full/db16-latin-america 3/101
LATIN AMERICADoing Business 2016
CONTENTS
Introduction .................................................................................................................................. 4
The business environment .......................................................................................................... 5
Starting a business ..................................................................................................................... 14
Dealing with construction permits ........................................................................................... 23
Getting electricity ....................................................................................................................... 32
Registering property .................................................................................................................. 40
Getting credit .............................................................................................................................. 49
Protecting minority investors ................................................................................................... 56
Paying taxes ................................................................................................................................ 62
Trading across borders .............................................................................................................. 72
Enforcing contracts .................................................................................................................... 86
Resolving insolvency .................................................................................................................. 92
Distance to frontier and ease of doing business ranking ...................................................... 97
Resources on the Doing Business website ............................................................................ 100

7/24/2019 DB16 Latin America
http://slidepdf.com/reader/full/db16-latin-america 4/101
LATIN AMERICADoing Business 2016
INTRODUCTIONDoing Business sheds light on how easy or difficult it is
for a local entrepreneur to open and run a small tomedium-size business when complying with relevant
regulations. It measures and tracks changes in
regulations affecting 11 areas in the life cycle of a
business: starting a business, dealing with construction
permits, getting electricity, registering property, getting
credit, protecting minority investors, paying taxes,
trading across borders, enforcing contracts, resolving
insolvency and labor market regulation. Doing Business
2016 presents the data for the labor market regulation
indicators in an annex. The report does not present
rankings of economies on labor market regulation
indicators or include the topic in the aggregate distanceto frontier score or ranking on the ease of doing
business.
In a series of annual reports Doing Business presents
quantitative indicators on business regulations and the
protection of property rights that can be compared
across 189 economies, from Afghanistan to Zimbabwe,
over time. The data set covers 47 economies in Sub-
Saharan Africa, 32 in Latin America and the Caribbean, 25
in East Asia and the Pacific, 25 in Eastern Europe and
Central Asia, 20 in the Middle East and North Africa and
8 in South Asia, as well as 32 OECD high-incomeeconomies. The indicators are used to analyze economic
outcomes and identify what reforms have worked, where
and why.
This regional profile presents the Doing Business
indicators for economies in Latin America. It also shows
the regional average, the best performance globally for
each indicator and data for the following comparator
regions: Caribbean States, East Asia and the Pacific (EAP),European Union (EU), South Asia (SA) and OECD High
Income.. The data in this report are current as of June 1,
2015 (except for the paying taxes indicators, which cover
the period January–December 2014).
The Doing Business methodology has limitations. Other
areas important to business—such as an economy’s
proximity to large markets, the quality of its
infrastructure services (other than those related to
trading across borders and getting electricity), the
security of property from theft and looting, the
transparency of government procurement,
macroeconomic conditions or the underlying strength of
institutions—are not directly studied by Doing Business.
The indicators refer to a specific type of business,
generally a local limited liability company operating in
the largest business city. Because standard assumptions
are used in the data collection, comparisons and
benchmarks are valid across economies. The data not
only highlight the extent of obstacles to doing business;
they also help identify the source of those obstacles,
supporting policy makers in designing regulatory reform.
More information is available in the full report. Doing
Business 2016 presents the indicators, analyzes theirrelationship with economic outcomes and recommends
regulatory reforms. The data, along with information on
ordering the Doing Business 2016 report, are available on
the Doing Business website at
http://www.doingbusiness.org.

7/24/2019 DB16 Latin America
http://slidepdf.com/reader/full/db16-latin-america 5/101
LATIN AMERICADoing Business 2016
THE BUSINESS ENVIRONMENT
CHANGES IN DOING BUSINESS 2016
As part of a two-year update in methodology, Doing
Business 2016 expands the focus of five indicator sets
(dealing with construction permits, getting electricity,
registering property, enforcing contracts and labor
market regulation), substantially revises the
methodology for one indicator set (trading across
borders) and implements small updates to the
methodology for another (protecting minority investors).
The indicators on dealing with construction permits nowinclude an index of the quality of building regulation and
its implementation. The getting electricity indicators now
include a measure of the price of electricity consumption
and an index of the reliability of electricity supply and
transparency of tariffs. Starting this year, the registering
property indicators include an index of the quality of the
land administration system in each economy in addition
to the indicators on the number of procedures and the
time and cost to transfer property. And for enforcing
contracts an index of the quality and efficiency of judicial
processes has been added while the indicator on the
number of procedures to enforce a contract has beendropped.
The scope of the labor market regulation indicator set
has also been expanded, to include more areas capturing
aspects of job quality. The labor market regulation
indicators continue to be excluded from the aggregate
distance to frontier score and ranking on the ease of
doing business.
The case study underlying the trading across borders
indicators has been changed to increase its relevance.
For each economy the export product and partner are
now determined on the basis of the economy’s
comparative advantage, the import product is auto parts,
and the import partner is selected on the basis of which
economy has the highest trade value in that product. The
indicators continue to measure the time and cost to
export and import.
Beyond these changes there is one other update in
methodology, for the protecting minority investors
indicators. A few points for the extent of shareholder
governance index have been fine-tuned, and the index
now also measures aspects of the regulations applicable
to limited companies rather than privately held joint
stock companies.
For more details on the changes, see the “What is
changing in Doing Business?” chapter starting on page
27 of the Doing Business 2016 report. For more details
on the data and methodology, please see the “DataNotes” chapter starting on page 119 of the Doing
Business 2016 report. For more details on the distance to
frontier metric, please see the “Distance to frontier and
ease of doing business ranking” chapter in this profile.

7/24/2019 DB16 Latin America
http://slidepdf.com/reader/full/db16-latin-america 6/101
LATIN AMERICADoing Business 2016
THE BUSINESS ENVIRONMENT
For policy makers trying to improve their economy’s
regulatory environment for business, a good place to
start is to find out how it compares with the regulatory
environment in other economies. Doing Business
provides an aggregate ranking on the ease of doing
business based on indicator sets that measure and
benchmark regulations applying to domestic small to
medium-size businesses through their life cycle.
Economies are ranked from 1 to 189 by the ease of
doing business ranking. Doing Business presents results
for 2 aggregate measures: the distance to frontier score
and the ease of doing business ranking. The ranking ofeconomies is determined by sorting the aggregate
distance to frontier scores, rounded to two decimals. An
economy’s distance to frontier score is indicated on a
scale from 0 to 100, where 0 represents the worst
performance and 100 the frontier. (See the chapter on
the distance to frontier and ease of doing business).
The 10 topics included in the ranking in Doing Business
2016: starting a business, dealing with construction
permits, getting electricity, registering property,
getting credit, protecting minority investors, paying
taxes, trading across borders, enforcing contracts
and resolving insolvency. The labor market
regulation indicators are not included in this year’s
aggregate ease of doing business ranking, but the
data are presented in the economy profile.
The ease of doing business ranking compares
economies with one another; the distance to frontier
score benchmarks economies with respect to
regulatory best practice, showing the absolutedistance to the best performance on each Doing
Business indicator. When compared across years, the
distance to frontier score shows how much the
regulatory environment for local entrepreneurs in an
economy has changed over time in absolute terms,
while the ease of doing business ranking can show
only how much the regulatory environment has
changed relative to that in other economies.
Figure 1.1 Where economies stand in the global ranking on the ease of doing business
Source: Doing Business database.

7/24/2019 DB16 Latin America
http://slidepdf.com/reader/full/db16-latin-america 7/101
LATIN AMERICADoing Business 2016
THE BUSINESS ENVIRONMENT
For policy makers, knowing where their economy stands in
the aggregate ranking on the ease of doing business is
useful. Also useful is to know how it ranks compared with
other economies in the region and compared with the
regional average (figure 1.2). Another perspective is
provided by the regional average rankings on the topics
included in the ease of doing business ranking (figure 1.3)
and the distance to frontier scores (figures 1.4 and 1.5).
Figure 1.2 How economies in Latin America rank on the ease of doing business
Note: The rankings are benchmarked to June 2015 and based on the average of each economy’s distance to frontier
(DTF) scores for the 10 topics included in this year’s aggregate ranking. The distance to frontier score benchmarks
economies with respect to regulatory practice, showing the absolute distance to the best performance in each Doing
Business indicator. An economy’s distance to frontier score is indicated on a scale from 0 to 100, where 0 represents the
worst performance and 100 the frontier. For the economies for which the data cover 2 cities, scores are a population-
weighted average for the 2 cities.
Source: Doing Business database.
7/24/2019 DB16 Latin America
http://slidepdf.com/reader/full/db16-latin-america 8/101
LATIN AMERICADoing Business 2016
THE BUSINESS ENVIRONMENT
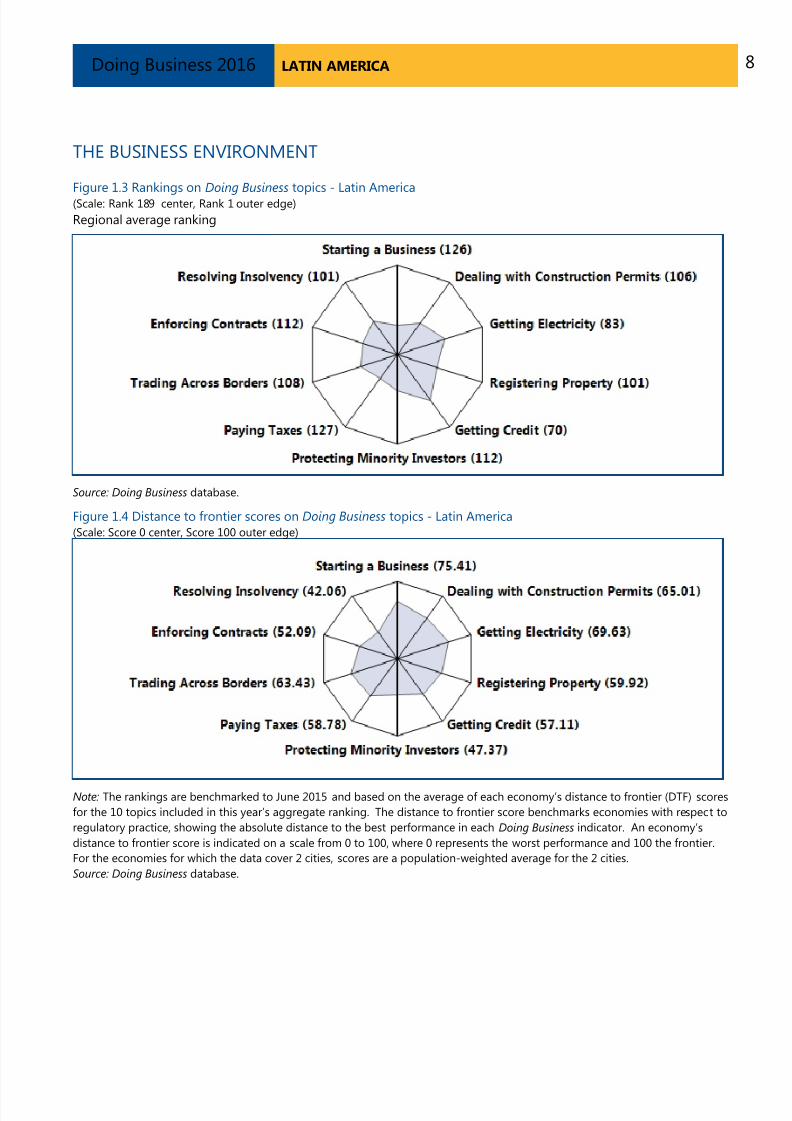
Figure 1.3 Rankings on Doing Business topics - Latin America(Scale: Rank 189 center, Rank 1 outer edge)
Regional average ranking
Source: Doing Business database.
Figure 1.4 Distance to frontier scores on Doing Business topics - Latin America(Scale: Score 0 center, Score 100 outer edge)
Note: The rankings are benchmarked to June 2015 and based on the average of each economy’s distance to frontier (DTF) scores
for the 10 topics included in this year’s aggregate ranking. The distance to frontier score benchmarks economies with respect to
regulatory practice, showing the absolute distance to the best performance in each Doing Business indicator. An economy’s
distance to frontier score is indicated on a scale from 0 to 100, where 0 represents the worst performance and 100 the frontier.
For the economies for which the data cover 2 cities, scores are a population-weighted average for the 2 cities.
Source: Doing Business database.

7/24/2019 DB16 Latin America
http://slidepdf.com/reader/full/db16-latin-america 9/101
LATIN AMERICADoing Business 2016
Figure 1.5 How far has Latin America come in the areas measured by Doing Business?
Source: Doing Business database.
Note: The distance to frontier score shows how far on average an economy is from the best performance achieved by
any economy on each Doing Business indicator. Starting a business is comparable to 2010. Getting credit, protecting
minority investors, paying taxes and resolving insolvency had methodology changes in 2014 and thus are only
comparable to 2013. Dealing with construction permits, registering property, trading across borders, enforcing
contracts and getting electricity had methodology changes in 2015 and thus are only comparable to 2014. The measure
is normalized to range between 0 and 100, with 100 representing the best performance (the frontier). See the data notes
starting on page 119 of the Doing Business 2016 report for more details on the distance to frontier score.

7/24/2019 DB16 Latin America
http://slidepdf.com/reader/full/db16-latin-america 10/101
LATIN AMERICADoing Business 2016
THE BUSINESS ENVIRONMENT
Just as the overall ranking on the ease of doing business
tells only part of the story, so do changes in that ranking.
Yearly movements in rankings can provide some
indication of changes in an economy’s regulatory
environment for firms, but they are always relative. An
economy’s ranking might change because of
developments in other economies. An economy that
implemented business regulation reforms may fail to rise
in the rankings (or may even drop) if it is passed by
others whose business regulation reforms had a more
significant impact as measured by Doing Business.
The absolute values of the indicators tell another part of
the story (table 1.1). Policy makers can learn much by
comparing the indicators for their economy with those
for the lowest- and highest-scoring economies in the
region as well as those for the best performers globally.
These comparisons may reveal unexpected strengths in
an area of business regulation—such as a regulatory
process that can be completed with a small number of
procedures in a few days and at a low cost.
Table 1.1 Summary of Doing Business indicators for Latin America
Indicator Lowest regional
performance
Best regional
performance Regional average
Best global
performance
Starting a Business
(rank) 186 (Venezuela, RB) 44 (Panama) 126 1 (New Zealand)
Starting a Business
(DTF Score) 40.38 (Venezuela, RB) 91.95 (Panama) 75.41 99.96 (New Zealand)
Procedures (number) 17.0 (Venezuela, RB) 5.0 (Panama*) 9.3 1.0 (New Zealand*)
Time (days) 144.0 (Venezuela, RB) 6.0 (Panama) 35.5 0.5 (New Zealand)
Cost (% of income per
capita)100.7 (Suriname) 3.8 (Brazil) 33.0 0.0 (Slovenia)
Paid-in min. capital (%
of income per capita)18.1 (Guatemala) 0.0 (13 Economies*) 1.8 0.0 (105 Economies*)
Dealing with
Construction Permits
(rank)
173 (Argentina) 38 (Colombia) 106 1 (Singapore)
Dealing with
Construction Permits
(DTF Score)
49.67 (Argentina) 75.99 (Colombia) 65.01 92.97 (Singapore)
Procedures (number) 25.0 (El Salvador) 7.0 (Guyana) 14.3 7.0 (5 Economies*)
Time (days) 425.7 (Brazil) 73.0 (Colombia) 186.3 26.0 (Singapore)
Cost (% of warehouse
value)10.2 (Mexico) 0.2 (Suriname) 2.8 0.0 (Qatar)
Building quality control
index (0-15)1.0 (Guyana) 12.0 (Peru) 8.5 15.0 (New Zealand)
Getting Electricity
(rank) 171 (Venezuela, RB) 21 (Guatemala) 83 1 (Korea, Rep.)

7/24/2019 DB16 Latin America
http://slidepdf.com/reader/full/db16-latin-america 11/101
LATIN AMERICADoing Business 2016
Indicator Lowest regional
performance
Best regional
performance Regional average
Best global
performance
Getting Electricity
(DTF Score) 39.60 (Venezuela, RB) 85.76 (Guatemala) 69.63 99.88 (Korea, Rep.)
Procedures (number) 8.0 (3 Economies*) 4.0 (3 Economies*) 5.8 3.0 (14 Economies*)
Time (days) 178.0 (Venezuela, RB) 35.0 (Panama) 71.3 18.0 (Korea, Rep.*)
Cost (% of income per
capita)1,783.3 (Venezuela, RB) 9.4 (Panama) 459.4 0.0 (Japan)
Reliability of supply
and transparency of
tariff index (0-8)
0.0 (3 Economies*) 7.0 (Mexico*) 4.3 8.0 (18 Economies*)
Registering Property
(rank)
176 (Suriname) 35 (Peru) 101 1 (New Zealand)
Registering Property
(DTF Score) 36.27 (Suriname) 76.77 (Peru) 59.92 94.46 (New Zealand)
Procedures (number) 13.6 (Brazil) 4.0 (Peru) 7.0 1.0 (4 Economies*)
Time (days) 106.0 (Suriname) 6.5 (Peru) 46.3 1.0 (3 Economies*)
Cost (% of property
value)13.7 (Suriname) 1.9 (Paraguay*) 4.5 0.0 (Saudi Arabia)
Quality of the land
administration index
(0-30)
5.5 (Venezuela, RB) 20.5 (Uruguay) 12.4 28.5 (3 Economies*)
Getting Credit (rank) 174 (Suriname) 2 (Colombia) 70 1 (New Zealand)
Getting Credit (DTF
Score) 10.00 (Suriname) 95.00 (Colombia) 57.11 100.00 (New Zealand)
Strength of legal rights
index (0-12)0.0 (Bolivia) 12.0 (Colombia) 5.0 12.0 (3 Economies*)
Depth of credit
information index (0-8)0.0 (3 Economies*) 8.0 (9 Economies*) 6.4 8.0 (26 Economies*)
Credit registry
coverage (% of adults)15.0 (Bolivia) 84.1 (Uruguay) 19.4 100.0 (Portugal)
Credit bureau coverage
(% of adults)2.4 (Guyana) 100.0 (5 Economies*) 54.1 100.0 (22 Economies*)
Protecting Minority
Investors (rank) 178 (Venezuela, RB) 14 (Colombia) 112 1 (3 Economies*)
Protecting Minority
Investors (DTF Score) 31.67 (Venezuela, RB) 71.67 (Colombia) 47.37 83.33 (3 Economies*)
Strength of minority
investor protection
index (0-10)
3.2 (Venezuela, RB) 7.2 (Colombia) 4.7 8.3 (3 Economies*)

7/24/2019 DB16 Latin America
http://slidepdf.com/reader/full/db16-latin-america 12/101
LATIN AMERICADoing Business 2016
Indicator Lowest regional
performance
Best regional
performance Regional average
Best global
performance
Extent of conflict of
interest regulationindex (0-10)
2.3 (Suriname) 8.0 (Colombia) 4.8 9.3 (Singapore*)
Extent of shareholder
governance index (0-
10)
2.7 (Paraguay) 7.3 (Brazil) 4.7 8.0 (4 Economies*)
Paying Taxes (rank) 189 (Bolivia) 50 (Peru*) 1271 (United Arab
Emirates*)
Paying Taxes (DTF
Score) 12.18 (Bolivia) 81.18 (Peru*) 58.78
99.44 (United Arab
Emirates*)
Payments (number per
year) 70.0 (Venezuela, RB) 6.0 (Mexico) 27.5
3.0 (Hong Kong SAR,
China*)
Time (hours per year) 2,600.0 (Brazil) 147.0 (Belize) 478.2 55.0 (Luxembourg)
Total tax rate (% of
profit)137.4 (Argentina) 27.9 (Suriname) 52.3 25.9 (Ireland)
Trading Across
Borders (rank) 186 (Venezuela, RB) 46 (El Salvador) 108 1 (16 Economies*)
Trading Across
Borders (DTF Score) 6.14 (Venezuela, RB) 87.78 (El Salvador) 63.43 100.00 (16 Economies*)
Time to export: Border
compliance (hours) 816 (Venezuela, RB) 20 (Mexico*) 116 0 (15 Economies*)
Cost to export: Border
compliance (USD)1,475 (Venezuela, RB) 65 (Bolivia) 511 0 (18 Economies*)
Time to export:
Documentary
compliance (hours)
528 (Venezuela, RB) 6 (Panama) 94 0 (Jordan)
Cost to export:
Documentary
compliance (USD)
375 (Venezuela, RB) 25 (Bolivia) 135 0 (20 Economies*)
Time to import: Border
compliance (hours) 1,330 (Venezuela, RB) 13 (Uruguay) 139 0 (19 Economies*)
Cost to import: Border
compliance (USD)1,750 (Venezuela, RB) 160 (El Salvador) 561 0 (28 Economies*)
Time to import:
Documentary
compliance (hours)
1,090 (Venezuela, RB) 6 (Panama) 128 1 (21 Economies*)
Cost to import:
Documentary
compliance (USD)
400 (Venezuela, RB) 30 (Bolivia) 113 0 (30 Economies*)
7/24/2019 DB16 Latin America
http://slidepdf.com/reader/full/db16-latin-america 13/101
LATIN AMERICADoing Business 2016
Indicator Lowest regional
performance
Best regional
performance Regional average
Best global
performance
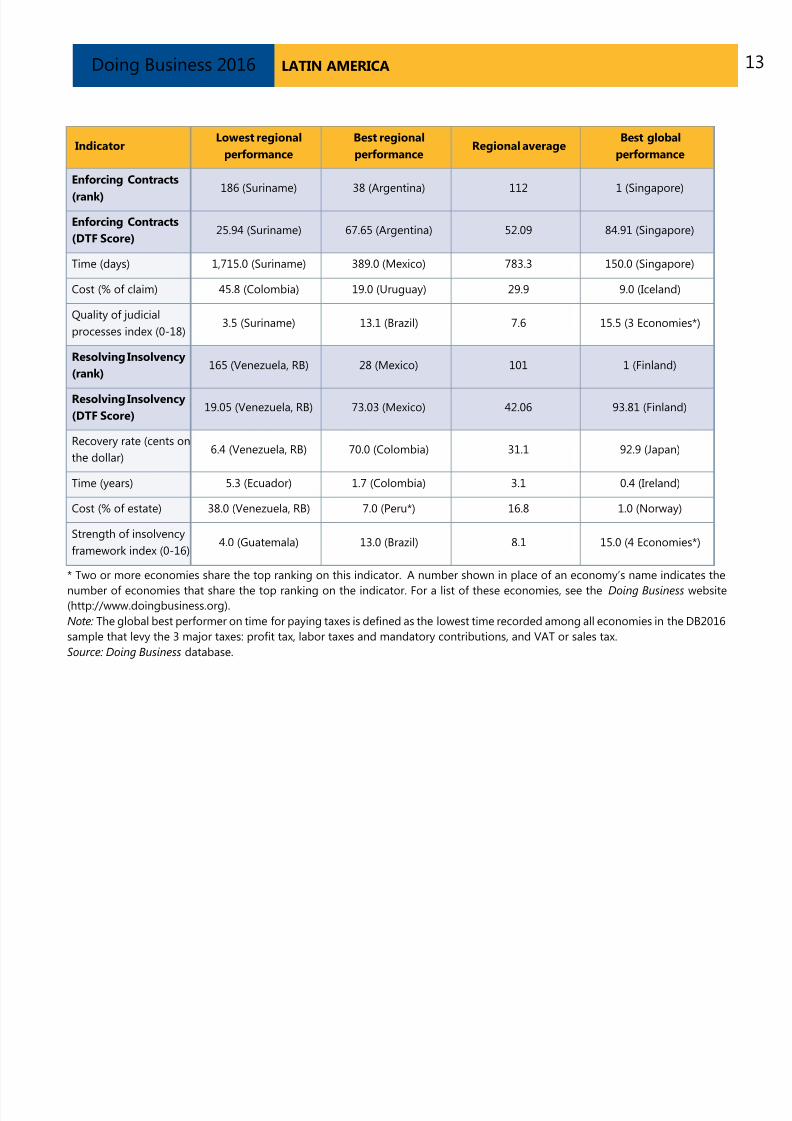
Enforcing Contracts
(rank) 186 (Suriname) 38 (Argentina) 112 1 (Singapore)
Enforcing Contracts
(DTF Score) 25.94 (Suriname) 67.65 (Argentina) 52.09 84.91 (Singapore)
Time (days) 1,715.0 (Suriname) 389.0 (Mexico) 783.3 150.0 (Singapore)
Cost (% of claim) 45.8 (Colombia) 19.0 (Uruguay) 29.9 9.0 (Iceland)
Quality of judicial
processes index (0-18)3.5 (Suriname) 13.1 (Brazil) 7.6 15.5 (3 Economies*)
Resolving Insolvency
(rank) 165 (Venezuela, RB) 28 (Mexico) 101 1 (Finland)
Resolving Insolvency
(DTF Score) 19.05 (Venezuela, RB) 73.03 (Mexico) 42.06 93.81 (Finland)
Recovery rate (cents on
the dollar)6.4 (Venezuela, RB) 70.0 (Colombia) 31.1 92.9 (Japan)
Time (years) 5.3 (Ecuador) 1.7 (Colombia) 3.1 0.4 (Ireland)
Cost (% of estate) 38.0 (Venezuela, RB) 7.0 (Peru*) 16.8 1.0 (Norway)
Strength of insolvency
framework index (0-16)4.0 (Guatemala) 13.0 (Brazil) 8.1 15.0 (4 Economies*)
* Two or more economies share the top ranking on this indicator. A number shown in place of an economy’s name indicates the
number of economies that share the top ranking on the indicator. For a list of these economies, see the Doing Business website(http://www.doingbusiness.org).
Note: The global best performer on time for paying taxes is defined as the lowest time recorded among all economies in the DB2016
sample that levy the 3 major taxes: profit tax, labor taxes and mandatory contributions, and VAT or sales tax.
Source: Doing Business database.
7/24/2019 DB16 Latin America
http://slidepdf.com/reader/full/db16-latin-america 14/101
LATIN AMERICADoing Business 2016
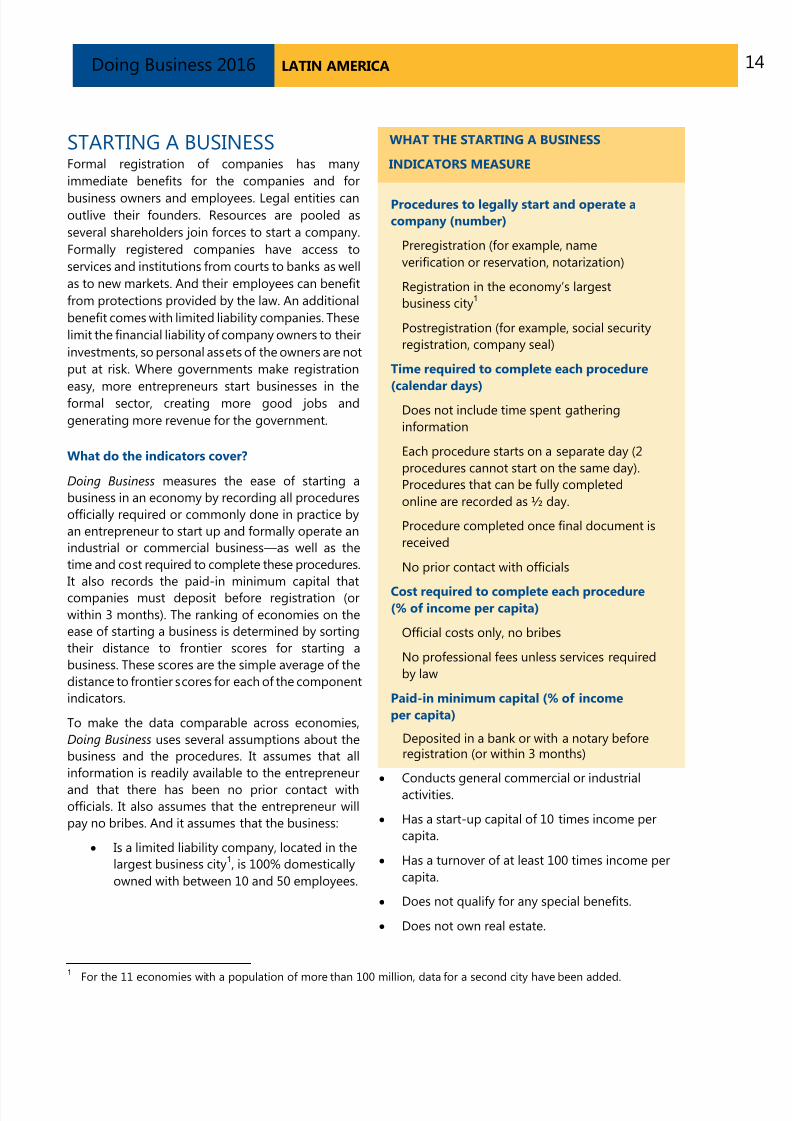
STARTING A BUSINESSFormal registration of companies has many
immediate benefits for the companies and for
business owners and employees. Legal entities canoutlive their founders. Resources are pooled as
several shareholders join forces to start a company.
Formally registered companies have access to
services and institutions from courts to banks as well
as to new markets. And their employees can benefit
from protections provided by the law. An additional
benefit comes with limited liability companies. These
limit the financial liability of company owners to their
investments, so personal assets of the owners are not
put at risk. Where governments make registration
easy, more entrepreneurs start businesses in theformal sector, creating more good jobs and
generating more revenue for the government.
What do the indicators cover?
Doing Business measures the ease of starting a
business in an economy by recording all procedures
officially required or commonly done in practice by
an entrepreneur to start up and formally operate an
industrial or commercial business—as well as the
time and cost required to complete these procedures.
It also records the paid-in minimum capital that
companies must deposit before registration (or
within 3 months). The ranking of economies on the
ease of starting a business is determined by sorting
their distance to frontier scores for starting a
business. These scores are the simple average of the
distance to frontier scores for each of the component
indicators.
To make the data comparable across economies,
Doing Business uses several assumptions about the
business and the procedures. It assumes that all
information is readily available to the entrepreneur
and that there has been no prior contact withofficials. It also assumes that the entrepreneur will
pay no bribes. And it assumes that the business:
Is a limited liability company, located in the
largest business city1, is 100% domestically
owned with between 10 and 50 employees.
Conducts general commercial or industrial
activities.
Has a start-up capital of 10 times income per
capita.
Has a turnover of at least 100 times income per
capita.
Does not qualify for any special benefits.
Does not own real estate.
WHAT THE STARTING A BUSINESS
INDICATORS MEASURE
Procedures to legally start and operate a
company (number)
Preregistration (for example, name
verification or reservation, notarization)
Registration in the economy’s largest
business city1
Postregistration (for example, social security
registration, company seal)
Time required to complete each procedure
(calendar days)Does not include time spent gathering
information
Each procedure starts on a separate day (2
procedures cannot start on the same day).
Procedures that can be fully completed
online are recorded as ½ day.
Procedure completed once final document is
received
No prior contact with officials
Cost required to complete each procedure(% of income per capita)
Official costs only, no bribes
No professional fees unless services required
by law
Paid-in minimum capital (% of income
per capita)
Deposited in a bank or with a notary beforeregistration (or within 3 months)
1
For the 11 economies with a population of more than 100 million, data for a second city have been added.

7/24/2019 DB16 Latin America
http://slidepdf.com/reader/full/db16-latin-america 15/101
LATIN AMERICADoing Business 2016
STARTING A BUSINESS
Where do the region’s economies stand today?
How easy is it for entrepreneurs in economies in Latin
America to start a business? The global rankings of these
economies on the ease of starting a business suggest an
answer (figure 2.1). The average ranking of the region
and comparator regions provide a useful benchmark.
Figure 2.1 How economies in Latin America rank on the ease of starting a business
Source: Doing Business database.

7/24/2019 DB16 Latin America
http://slidepdf.com/reader/full/db16-latin-america 16/101
LATIN AMERICADoing Business 2016
STARTING A BUSINESS
The indicators underlying the rankings may be morerevealing. Data collected by Doing Business show what
it takes to start a business in each economy in the
region: the number of procedures, the time, the cost
and the paid-in minimum capital requirement (figure2.2). Comparing these indicators across the region and
with averages both for the region and for comparator
regions can provide useful insights.
Figure 2.2 What it takes to start a business in economies in Latin America
Procedures (number)

7/24/2019 DB16 Latin America
http://slidepdf.com/reader/full/db16-latin-america 17/101
LATIN AMERICADoing Business 2016
STARTING A BUSINESS
Time (days)

7/24/2019 DB16 Latin America
http://slidepdf.com/reader/full/db16-latin-america 18/101
LATIN AMERICADoing Business 2016
STARTING A BUSINESS
Cost (% of income per capita)

7/24/2019 DB16 Latin America
http://slidepdf.com/reader/full/db16-latin-america 19/101
LATIN AMERICADoing Business 2016
STARTING A BUSINESS
Paid-in minimum capital (% of income per capita)
Source: Doing Business database.

7/24/2019 DB16 Latin America
http://slidepdf.com/reader/full/db16-latin-america 20/101
LATIN AMERICADoing Business 2016
STARTING A BUSINESS
What are the changes over time?
Economies around the world have taken steps making it
easier to start a business—streamlining procedures by
setting up a one-stop shop, making procedures simpler
or faster by introducing technology, and reducing or
eliminating minimum capital requirements. Many have
undertaken business registration reforms in stages—and
often as part of a larger regulatory reform program.
Among the benefits have been greater firm satisfaction
and savings and more registered businesses, financial
resources and job opportunities.
What business registration reforms has Doing Business
recorded in Latin America (table 2.1)?
Table 2.1 How have economies in Latin America made starting a business easier—or not? By Doing Business report year DB2011 to DB2016
DB year Economy Reform
DB2016 EcuadorEcuador made starting a business easier by simplifying theregistration process and by eliminating the need to deposit50% of the minimum capital in a special account.
DB2016 UruguayUruguay made starting a business more difficult by increasingincorporation costs.
DB2016 Venezuela, RBRepública Bolivariana de Venezuela made starting a businessmore difficult by increasing incorporation costs.
DB2015 GuatemalaGuatemala made starting a business easier by eliminatingcertain registration fees and reducing the time to publish anotice of incorporation.
DB2015 NicaraguaNicaragua made starting a business easier by combiningmultiple registration procedures.
DB2015 SurinameSuriname made starting a business easier by introducing anonline system for obtaining trade licenses.
DB2015 Venezuela, RBRepública Bolivariana de Venezuela made starting a businessmore difficult by increasing incorporation costs.
DB2014 Argentina
Argentina made starting a business more difficult by
increasing the incorporation costs.
DB2014 Costa Rica
Costa Rica made starting a business easier by creating anonline platform for business registration, eliminating therequirement to have accounting books legalized andsimplifying the legalization of company books.
DB2014 GuatemalaGuatemala made starting a business easier by creating anonline platform that allows simultaneous registration of a newcompany with different government agencies..
DB2014 NicaraguaNicaragua made starting a business easier by merging theprocedures for registering with the revenue authority andwith the municipality and by reducing the time required for

7/24/2019 DB16 Latin America
http://slidepdf.com/reader/full/db16-latin-america 21/101
LATIN AMERICADoing Business 2016
DB year Economy Reform
incorporation.
DB2014 PanamaPanama made starting a business easier by eliminating theneed to visit the municipality to obtain the municipal taxpayernumber.
DB2014 SurinameSuriname made starting a business easier by reducing thetime required to obtain the president’s approval for theregistration of a new company.
DB2014 Venezuela, RBRepública Bolivariana de Venezuela made starting a businessmore costly by increasing the company registration fees.
DB2013 ColombiaColombia made starting a business easier by eliminating therequirement to purchase and register accounting books at
the time of incorporation.
DB2013 Costa RicaCosta Rica made starting a business easier by streamliningthe process of obtaining a sanitary permit from theauthorities for low-risk activities.
DB2013 MexicoMexico made starting a business easier by eliminating theminimum capital requirement for limited liability companies.
DB2013 Venezuela, RBRepública Bolivariana de Venezuela made starting a businessmore difficult by increasing the cost of companyincorporation.
DB2012 PeruPeru made starting a business easier by eliminating therequirement for micro and small enterprises to deposit start-up capital in a bank before registration.
DB2012 UruguayUruguay made starting a business easier by establishing aone-stop shop for general commercial companies.
DB2012 PanamaPanama extended the operating hours of the public registry,reducing the time required to register a new company.
DB2012 GuyanaGuyana eased the process of starting a business by reducingthe time needed for registering a new company and forobtaining a tax identification number.
DB2012 ColombiaColombia reduced the costs associated with starting abusiness, by no longer requiring upfront payment of the
commercial license fee.
DB2011 ColombiaColombia eased the process of Starting a Business byreducing the number of days to register with the SocialSecurity System.
DB2011 BrazilBrazil eased business start-up by further enhancing theelectronic synchronization between federal and state taxauthorities.
DB2011 EcuadorEcuador made starting a business easier by introducing anonline registration system for social security.
DB2011 GuyanaGuyana eased business start-up by digitizing companyrecords, which speeded up the process of company name

7/24/2019 DB16 Latin America
http://slidepdf.com/reader/full/db16-latin-america 22/101
LATIN AMERICADoing Business 2016
DB year Economy Reform
search and reservation.
DB2011 MexicoMexico launched an online one-stop shop for initiatingbusiness registration.
DB2011 PanamaPanama eased business start-up by increasing efficiency atthe registrar.
DB2011 Venezuela, RBRepública Bolivariana de Venezuela made starting a businessmore difficult by introducing a new procedure for registeringa company.
DB2011 PeruPeru eased business start-up by simplifying the requirementsfor operating licenses and creating an online one-stop shopfor business registration.
DB2010 PeruPeru made starting a business easier by allowing onlinesubmission of electronic payroll books at no cost and bymaking company forms available online.
DB2010 Honduras
Honduras simplified business start-up by improving theefficiency of business registration at the one-stop shop,improving the tax registration process and eliminating theneed for a lawyer’s services to obtain a municipal license.
DB2010 Mexico
Mexico made starting a business easier by establishing anelectronic platform for company registration, by substantiallyreducing the time required for registration and by eliminatingthe requirement to register with the statistical office.
DB2010 Guyana
Guyana made starting a business easier by applying a flatregistration fee for all companies, regardless of capitalamount; eliminating the duty payable upon incorporation;and streamlining tax registration through the introduction ofa unique tax identification number (TIN) system.
DB2010 Colombia
Colombia made starting a business easier by establishing anew public-private health provider (Nueva EPS) that enablesfaster enrollment of employees and by introducing onlinepreenrollment with the Social Security Institute (Instituto deSeguro Social).
DB2010 Argentina
Argentina made starting a business easier by eliminating the
requirement for registration with the private pension fundand expediting the publication process.
DB2010 BrazilBrazil made starting a business easier by eliminating therequirement to obtain a fire brigade license and inspectionbefore obtaining an operating permit from the municipality.
Note: For information on reforms in earlier years (back to DB2005), see the Doing Business reports for these years, available at
http://www.doingbusiness.org.
Source: Doing Business database.
7/24/2019 DB16 Latin America
http://slidepdf.com/reader/full/db16-latin-america 23/101
LATIN AMERICADoing Business 2016
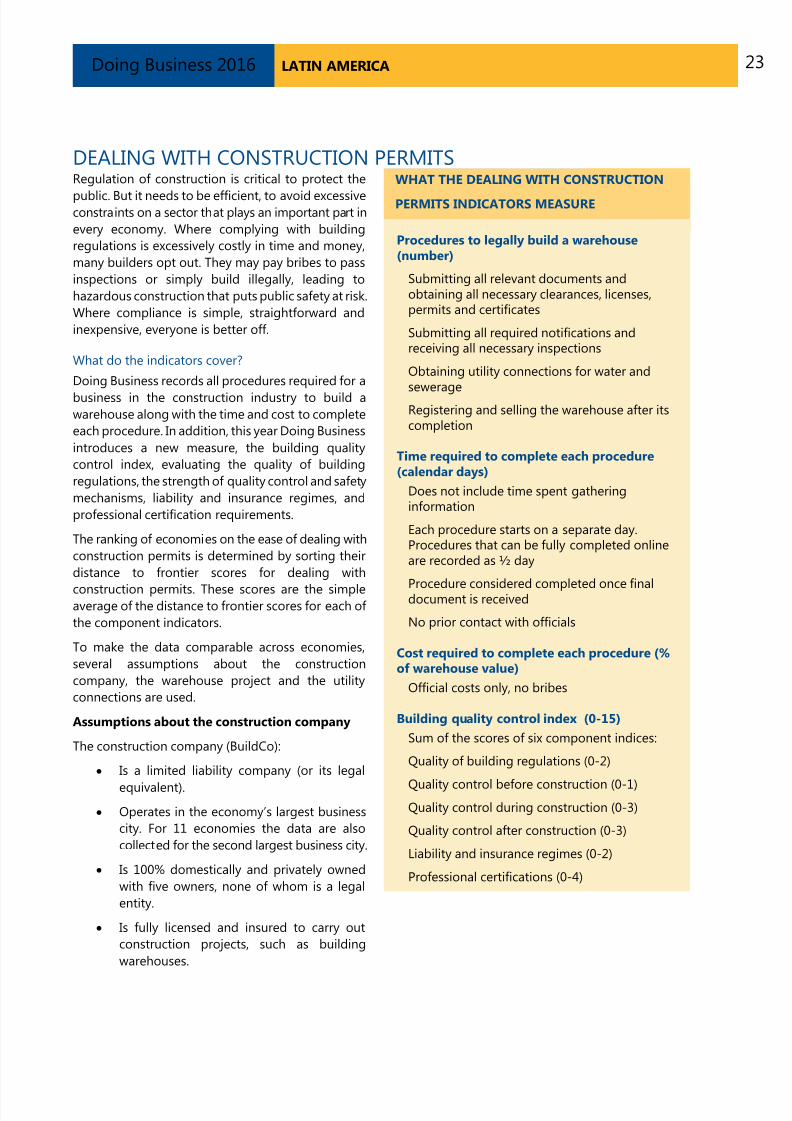
DEALING WITH CONSTRUCTION PERMITSRegulation of construction is critical to protect the
public. But it needs to be efficient, to avoid excessiveconstraints on a sector that plays an important part in
every economy. Where complying with building
regulations is excessively costly in time and money,
many builders opt out. They may pay bribes to pass
inspections or simply build illegally, leading to
hazardous construction that puts public safety at risk.
Where compliance is simple, straightforward and
inexpensive, everyone is better off.
What do the indicators cover?
Doing Business records all procedures required for a
business in the construction industry to build awarehouse along with the time and cost to complete
each procedure. In addition, this year Doing Business
introduces a new measure, the building quality
control index, evaluating the quality of building
regulations, the strength of quality control and safety
mechanisms, liability and insurance regimes, and
professional certification requirements.
The ranking of economies on the ease of dealing with
construction permits is determined by sorting their
distance to frontier scores for dealing with
construction permits. These scores are the simpleaverage of the distance to frontier scores for each of
the component indicators.
To make the data comparable across economies,
several assumptions about the construction
company, the warehouse project and the utility
connections are used.
Assumptions about the construction company
The construction company (BuildCo):
Is a limited liability company (or its legal
equivalent).
Operates in the economy’s largest business
city. For 11 economies the data are also
collected for the second largest business city.
Is 100% domestically and privately owned
with five owners, none of whom is a legal
entity.
Is fully licensed and insured to carry out
construction projects, such as building
warehouses.
WHAT THE DEALING WITH CONSTRUCTION
PERMITS INDICATORS MEASURE
Procedures to legally build a warehouse(number)
Submitting all relevant documents andobtaining all necessary clearances, licenses,permits and certificates
Submitting all required notifications andreceiving all necessary inspections
Obtaining utility connections for water and
sewerageRegistering and selling the warehouse after itscompletion
Time required to complete each procedure(calendar days)
Does not include time spent gatheringinformation
Each procedure starts on a separate day.Procedures that can be fully completed onlineare recorded as ½ day
Procedure considered completed once finaldocument is received
No prior contact with officials
Cost required to complete each procedure (%of warehouse value)
Official costs only, no bribes
Building quality control index (0-15)
Sum of the scores of six component indices:
Quality of building regulations (0-2)
Quality control before construction (0-1)Quality control during construction (0-3)
Quality control after construction (0-3)
Liability and insurance regimes (0-2)
Professional certifications (0-4)

7/24/2019 DB16 Latin America
http://slidepdf.com/reader/full/db16-latin-america 24/101
LATIN AMERICADoing Business 2016
The construction company (BuildCo) (continued ):
Has 60 builders and other employees, all of
them nationals with the technical expertise
and professional experience necessary toobtain construction permits and approvals.
Has at least one employee who is a
licensed architect or engineer and
registered with the local association of
architects or engineers. BuildCo is not
assumed to have any other employees who
are technical or licensed experts, such as
geological or topographical experts.
Has paid all taxes and taken out all
necessary insurance applicable to its
general business activity (for example,accidental insurance for construction
workers and third-person liability).
Owns the land on which the warehouse will
be built and will sell the warehouse upon
its completion.
Is valued at 50 times income per capita.
Assumptions about the warehouse
The warehouse:
Will be used for general storage activities,such as storage of books or stationery. The
warehouse will not be used for any goods
requiring special conditions, such as food,
chemicals or pharmaceuticals.
Will have two stories, both above ground,
with a total constructed area of
approximately 1,300.6 square meters
(14,000 square feet). Each floor will be 3
meters (9 feet, 10 inches) high.
Will have road access and be located in the
periurban area of the economy’s largestbusiness city (that is, on the fringes of the
city but still within its official limits). For 11
economies the data are also collected for
the second largest business city.
• Will not be located in a special economic
or industrial zone. Will be located on a land
plot of approximately 929 square meters
(10,000 square feet) that is 100% owned by
BuildCo and is accurately registered in the
cadastre and land registry.
Will be a new construction (there was no
previous construction on the land), with no
trees, natural water sources, natural reservesor historical monuments of any kind on the
plot.
Will have complete architectural and
technical plans prepared by a licensed
architect. If preparation of the plans requires
such steps as obtaining further
documentation or getting prior approvals
from external agencies, these are counted as
procedures.
Will include all technical equipment required
to be fully operational.
Will take 30 weeks to construct (excluding all
delays due to administrative and regulatory
requirements).
Assumptions about the utility connections
The water and sewerage connections:
• Will be 150 meters (492 feet) from the
existing water source and sewer tap. If there is no
water delivery infrastructure in the economy, a
borehole will be dug. If there is no sewerage
infrastructure, a septic tank in the smallest sizeavailable will be installed or built.
Will not require water for fire protection
reasons; a fire extinguishing system (dry
system) will be used instead. If a wet fire
protection system is required by law, it is
assumed that the water demand specified
below also covers the water needed for fire
protection.
Will have an average water use of 662 liters
(175 gallons) a day and an average
wastewater flow of 568 liters (150 gallons) aday. Will have a peak water use of 1,325 liters
(350 gallons) a day and a peak wastewater
flow of 1,136 liters (300 gallons) a day.
Will have a constant level of water demand
and wastewater flow throughout the year.
Will be 1 inch in diameter for the water
connection and 4 inches in diameter for the
sewerage connection.

7/24/2019 DB16 Latin America
http://slidepdf.com/reader/full/db16-latin-america 25/101
LATIN AMERICADoing Business 2016
DEALING WITH CONSTRUCTION PERMITS
Where do the region’s economies stand today?
How easy it is for entrepreneurs in economies in Latin
America to legally build a warehouse? The global
rankings of these economies on the ease of dealing with
construction permits suggest an answer (figure 3.1). The
average ranking of the region and comparator regions
provide a useful benchmark.
Figure 3.1 How economies in Latin America rank on the ease of dealing with construction permits
Source: Doing Business database.

7/24/2019 DB16 Latin America
http://slidepdf.com/reader/full/db16-latin-america 26/101
LATIN AMERICADoing Business 2016
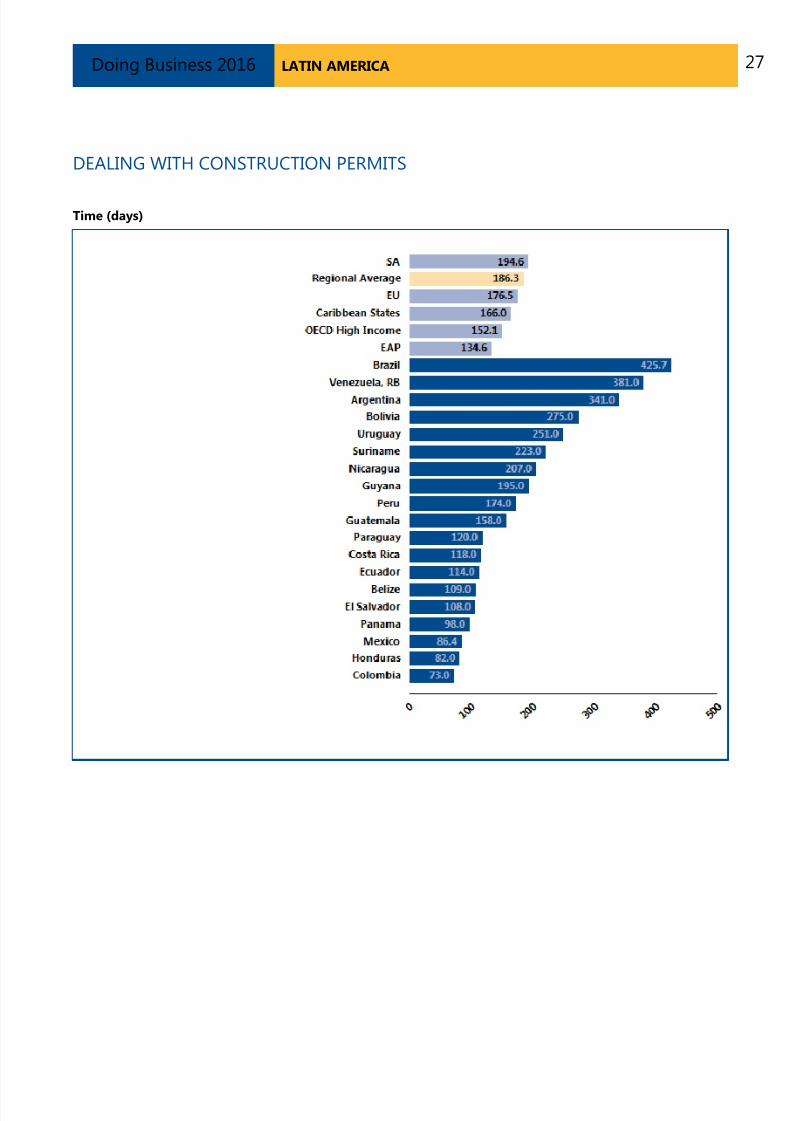
DEALING WITH CONSTRUCTION PERMITS
The indicators underlying the rankings may be morerevealing. Data collected by Doing Business show what it
takes to comply with formalities to build a warehouse in
each economy in the region: the number of procedures,
the time and the cost (figure 3.2). Comparing theseindicators across the region and with averages both for
the region and for comparator regions can provide
useful insights.
Figure 3.2 What it takes to comply with formalities to build a warehouse in economies in Latin America
Procedures (number)
7/24/2019 DB16 Latin America
http://slidepdf.com/reader/full/db16-latin-america 27/101
LATIN AMERICADoing Business 2016
DEALING WITH CONSTRUCTION PERMITS
Time (days)

7/24/2019 DB16 Latin America
http://slidepdf.com/reader/full/db16-latin-america 28/101
LATIN AMERICADoing Business 2016
DEALING WITH CONSTRUCTION PERMITS
Cost (% of warehouse value)
* Indicates a “no practice” mark. If an economy has no laws or regulations covering a specific area—for example, insolvency—itreceives a “no practice” mark. Similarly, an economy receives a “no practice” or “not possible” mark if regulation exists but is
never used in practice or if a competing regulation prohibits such practice. Either way, a “no practice” mark puts the economy
at the bottom of the ranking on the relevant indicator.
Source: Doing Business database.
7/24/2019 DB16 Latin America
http://slidepdf.com/reader/full/db16-latin-america 29/101
LATIN AMERICADoing Business 2016
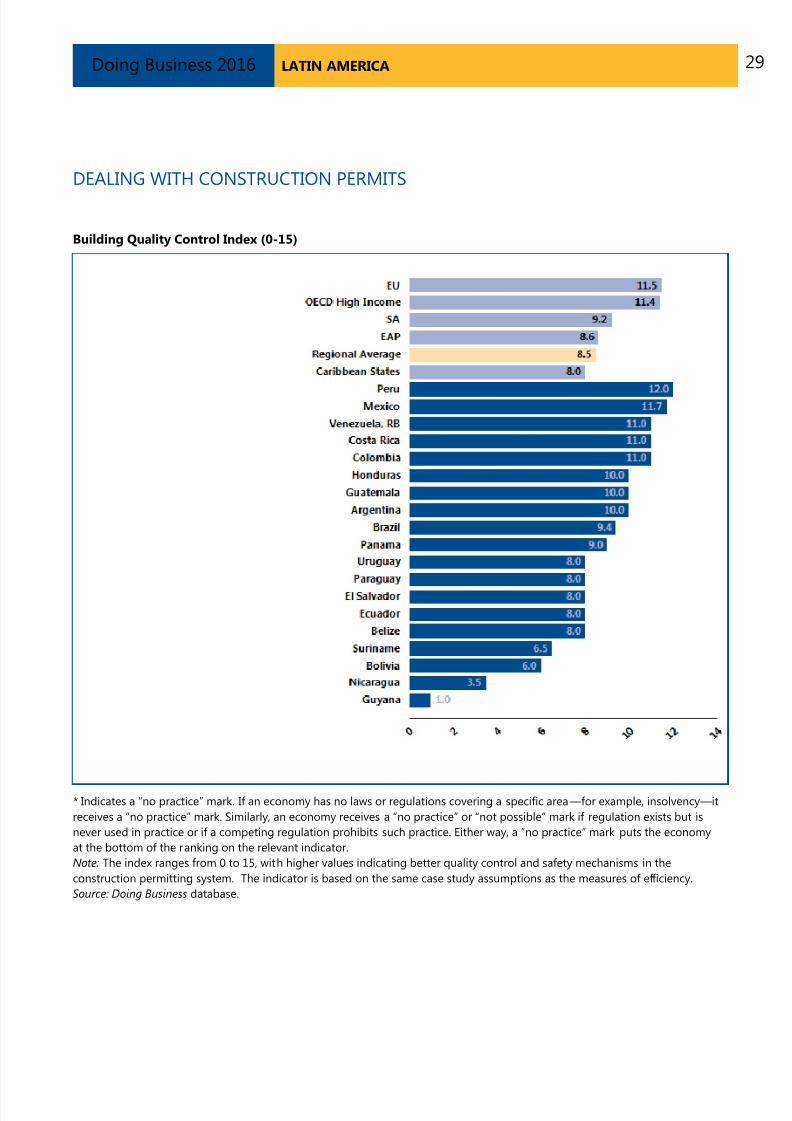
DEALING WITH CONSTRUCTION PERMITS
Building Quality Control Index (0-15)
* Indicates a “no practice” mark. If an economy has no laws or regulations covering a specific area—for example, insolvency—it
receives a “no practice” mark. Similarly, an economy receives a “no practice” or “not possible” mark if regulation exists but is
never used in practice or if a competing regulation prohibits such practice. Either way, a “no practice” mark puts the economy
at the bottom of the ranking on the relevant indicator.
Note: The index ranges from 0 to 15, with higher values indicating better quality control and safety mechanisms in the
construction permitting system. The indicator is based on the same case study assumptions as the measures of efficiency.
Source: Doing Business database.
7/24/2019 DB16 Latin America
http://slidepdf.com/reader/full/db16-latin-america 30/101
LATIN AMERICADoing Business 2016
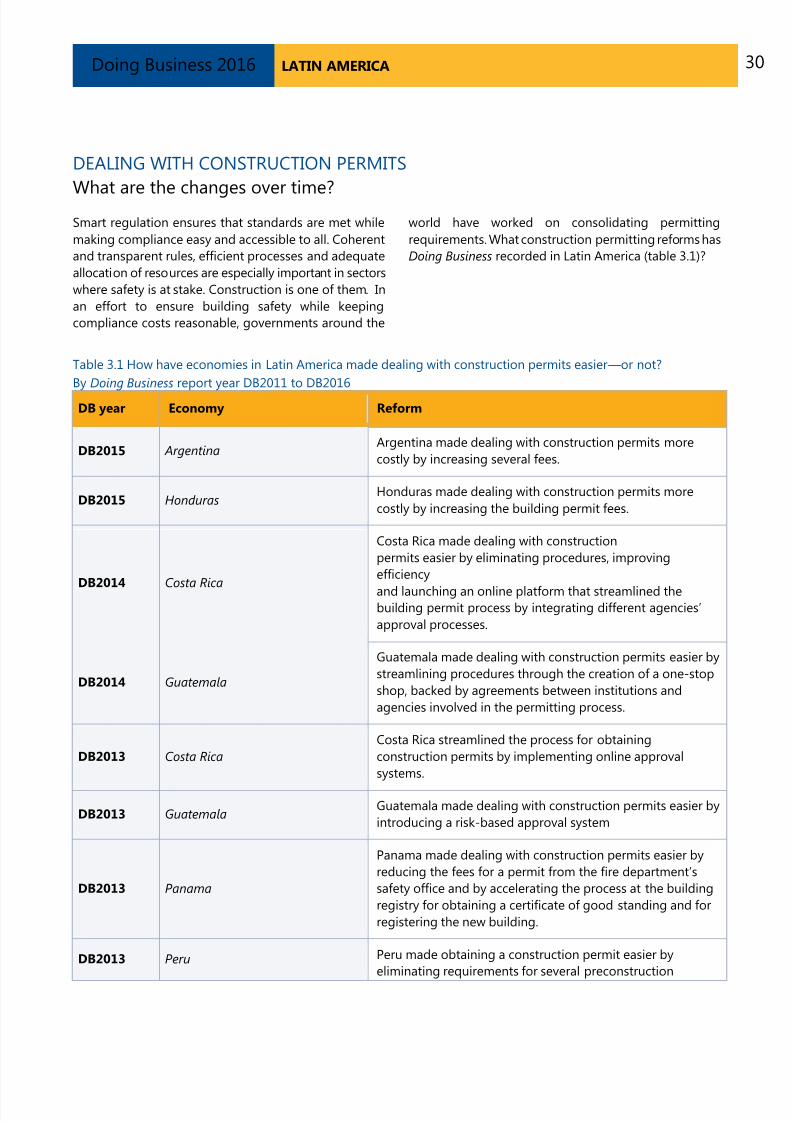
DEALING WITH CONSTRUCTION PERMITS
What are the changes over time?Smart regulation ensures that standards are met while
making compliance easy and accessible to all. Coherent
and transparent rules, efficient processes and adequate
allocation of resources are especially important in sectors
where safety is at stake. Construction is one of them. In
an effort to ensure building safety while keeping
compliance costs reasonable, governments around the
world have worked on consolidating permitting
requirements. What construction permitting reforms has
Doing Business recorded in Latin America (table 3.1)?
Table 3.1 How have economies in Latin America made dealing with construction permits easier—or not?
By Doing Business report year DB2011 to DB2016
DB year Economy Reform
DB2015 ArgentinaArgentina made dealing with construction permits more
costly by increasing several fees.
DB2015 HondurasHonduras made dealing with construction permits more
costly by increasing the building permit fees.
DB2014 Costa Rica
Costa Rica made dealing with construction
permits easier by eliminating procedures, improving
efficiency
and launching an online platform that streamlined thebuilding permit process by integrating different agencies’
approval processes.
DB2014 Guatemala
Guatemala made dealing with construction permits easier by
streamlining procedures through the creation of a one-stop
shop, backed by agreements between institutions and
agencies involved in the permitting process.
DB2013 Costa Rica
Costa Rica streamlined the process for obtaining
construction permits by implementing online approval
systems.
DB2013 GuatemalaGuatemala made dealing with construction permits easier by
introducing a risk-based approval system
DB2013 Panama
Panama made dealing with construction permits easier by
reducing the fees for a permit from the fire department’s
safety office and by accelerating the process at the building
registry for obtaining a certificate of good standing and for
registering the new building.
DB2013 Peru Peru made obtaining a construction permit easier by
eliminating requirements for several preconstruction

7/24/2019 DB16 Latin America
http://slidepdf.com/reader/full/db16-latin-america 31/101
LATIN AMERICADoing Business 2016
DB year Economy Reform
approvals.
DB2012 Paraguay
Paraguay made dealing with construction permits easier by
implementing a risk-based approval system and a single
window for obtaining construction permits.
DB2012 MexicoMexico made dealing with construction permits faster by
consolidating internal administrative procedures.
DB2011 Paraguay
Paraguay made dealing with construction permits easier by
creating a new administrative structure and a better tracking
system in the municipality of Asunción.
DB2011 PeruPeru streamlined construction permitting by implementing
administrative reforms.
DB2011 ColombiaColombia eased construction permitting by improving the
electronic verification of prebuilding certificates.
DB2010 PanamaPanama made dealing with construction permits easier by
eliminating some procedures and simplifying others.
DB2010 Honduras
Honduras reduced the time required for dealing with
construction permits by streamlining administrativeprocesses in the Construction Control Department.
DB2010 Guatemala
Guatemala made dealing with construction permits easier
through a new land management plan that simplified the
risk-based approval process for building permits and
through new zoning regimes that speeded up the approval
process.
DB2010 Colombia
Colombia made dealing with construction permits easier by
introducing regulations that categorize building projects on
the basis of risk and allow electronic verification for certain
documents.Note: For information on reforms in earlier years (back to DB2005), see the Doing Business reports for these years, available at
http://www.doingbusiness.org.
Source: Doing Business database.

7/24/2019 DB16 Latin America
http://slidepdf.com/reader/full/db16-latin-america 32/101
LATIN AMERICADoing Business 2016
GETTING ELECTRICITYAccess to reliable and affordable electricity is vital
for businesses. To counter weak electricity supply,many firms in developing economies have to rely on
self-supply, often at a prohibitively high cost.
Whether electricity is reliably available or not, the
first step for a customer is always to gain access by
obtaining a connection.
What do the indicators cover?
Doing Business records all procedures required for a
local business to obtain a permanent electricity
connection and supply for a standardized
warehouse, as well as the time and cost to complete
them. These procedures include applications andcontracts with electricity utilities, clearances from
other agencies and the external and final connection
works. In addition, this year Doing Business adds
two new measures: the reliability of supply and
transparency of tariffs index (included in the
aggregate distance to frontier score and ranking on
the ease of doing business) and the price of
electricity (omitted from these aggregate measures).
The ranking of economies on the ease of getting
electricity is determined by sorting their distance to
frontier scores for getting electricity. These scores
are the simple average of the distance to frontierscores for each of the component indicators. To
make the data comparable across economies,
several assumptions are used.
Assumptions about the warehouse
The warehouse:
Is owned by a local entrepreneur.
Is located in the economy’s largest business
city. For 11 economies the data are also
collected for the second largest business city.
Is located in an area where similar warehouses
are typically located. In this area a new
electricity connection is not eligible for a
special investment promotion regime (offering
special subsidization or faster service, for
example), and located in an area with no
physical constraints. For example, the property
is not near a railway.
Is a new construction and is being connected
to electricity for the first time.
WHAT THE GETTING ELECTRICITY
INDICATORS MEASURE
Procedures to obtain an electricity connection(number)
Submitting all relevant documents andobtaining all necessary clearances and permits
Completing all required notifications andreceiving all necessary inspections
Obtaining external installation works andpossibly purchasing material for these works
Concluding any necessary supply contract andobtaining final supply
Time required to complete each procedure(calendar days)
Is at least 1 calendar day
Each procedure starts on a separate day
Does not include time spent gatheringinformation
Reflects the time spent in practice, with littlefollow-up and no prior contact with officials
Cost required to complete each procedure (%of income per capita)
Official costs only, no bribes
Excludes value added tax
The reliability of supply and transparency oftariffs index
Sum of the scores of six component indices:
Duration and frequency of outages
Tools to monitor power outages
Tools to restore power supply
Regulatory monitoring of utilities’ performance
Financial deterrents aimed at limiting outages
Transparency and accessibility of tariffs
Price of electricity (cents per kilowatt-hour)*
Price based on monthly bill for commercialwarehouse in case study
*Price of electricity is not included in the calculation of
distance to frontier nor ease of doing business ranking

7/24/2019 DB16 Latin America
http://slidepdf.com/reader/full/db16-latin-america 33/101
LATIN AMERICADoing Business 2016
The warehouse (continued):
Has two stories, both above ground, with
a total surface area of approximately
1,300.6 square meters (14,000 square
feet). The plot of land on which it is builtis 929 square meters (10,000 square feet).
Is used for storage of goods.
Assumptions about the electricity connection
The electricity connection:
Is a permanent one.
Is a three-phase, four-wire Y, 140-kilovolt-
ampere (kVA) (subscribed capacity)
connection (where the voltage is 120/208V, the current would be 400 amperes;
where it is 230/400 B, the current would
be nearly 200 amperes).
Is 150 meters long. The connection is to
either the low-voltage or the medium-
voltage distribution network and either
overhead or underground, whichever is
more common in the area where the
warehouse is located.
Requires works that involve the crossing
of a 10-meter road (such as by excavation
or overhead lines) but are all carried out
on public land. There is no crossing of
other owners’ private property because
the warehouse has access to a road.
Includes only a negligible length in the
customer’s private domain.
Will supply monthly electricity
consumption of 26,880 kilowatt-hours
(kWh).
Does not involve work to install theinternal electrical wiring. This has already
been completed, up to and including the
customer’s service panel or switchboard
and installation of the meter base.
Assumptions about the monthly consumption
It is assumed that the warehouse operates 8
hours a day for 30 days a month, withequipment utilized at 80% of capacity on
average, and that there are no electricity cuts
(assumed for simplicity). The subscribed
capacity of the warehouse is 140 kVA, with a
power factor of 1 (1 kVA = 1 kW). The monthly
energy consumption is therefore 26,880 kWh,
and the hourly consumption 112 kWh (26,880
kWh/30 days/8 hours).
If multiple electricity suppliers exist, the
warehouse is served by the cheapest supplier.
Tariffs effective in March of the current yearare used for calculation of the price of
electricity for the warehouse.

7/24/2019 DB16 Latin America
http://slidepdf.com/reader/full/db16-latin-america 34/101
LATIN AMERICADoing Business 2016
GETTING ELECTRICITY
Where do the region’s economies stand today?
How easy is it for entrepreneurs in economies in Latin
America to connect a warehouse to electricity? The
global rankings of these economies on the ease of
getting electricity suggest an answer (figure 4.1). The
average ranking of the region and comparator regions
provide a useful benchmark.
Figure 4.1 How economies in Latin America rank on the ease of getting electricity
Source: Doing Business database.
7/24/2019 DB16 Latin America
http://slidepdf.com/reader/full/db16-latin-america 35/101
LATIN AMERICADoing Business 2016
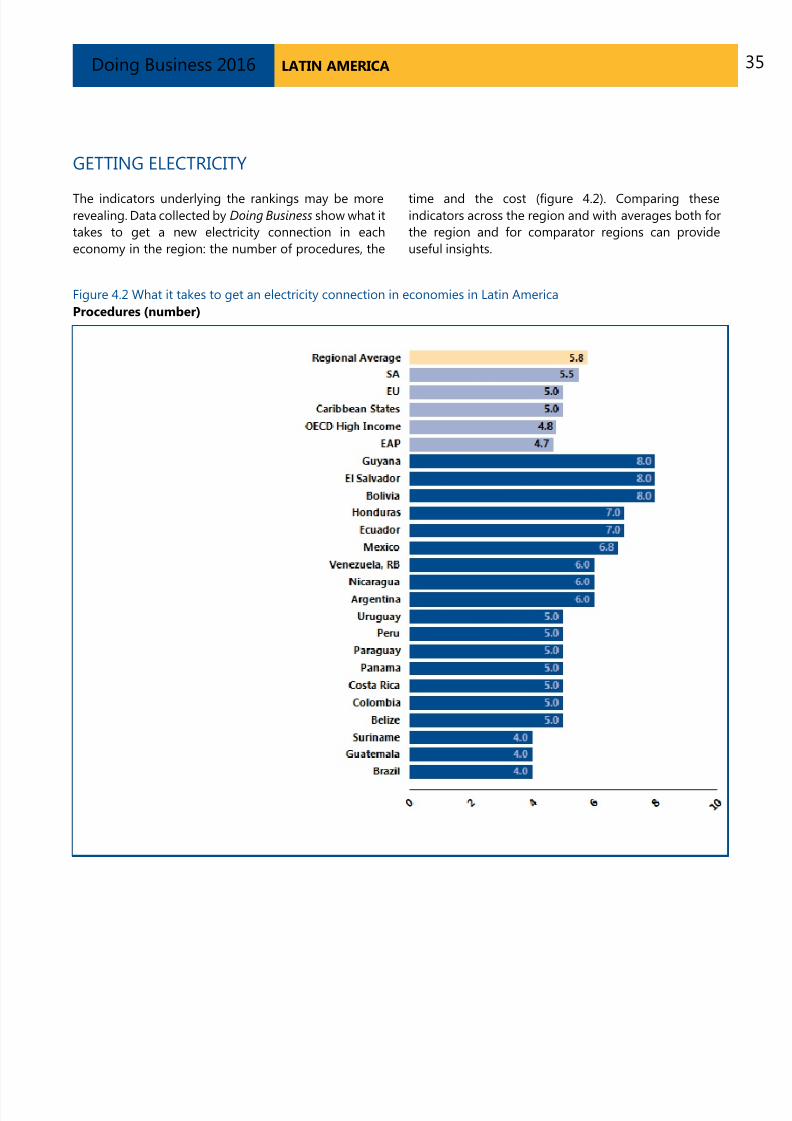
GETTING ELECTRICITY
The indicators underlying the rankings may be morerevealing. Data collected by Doing Business show what it
takes to get a new electricity connection in each
economy in the region: the number of procedures, the
time and the cost (figure 4.2). Comparing theseindicators across the region and with averages both for
the region and for comparator regions can provide
useful insights.
Figure 4.2 What it takes to get an electricity connection in economies in Latin America
Procedures (number)

7/24/2019 DB16 Latin America
http://slidepdf.com/reader/full/db16-latin-america 36/101
LATIN AMERICADoing Business 2016
GETTING ELECTRICITY
Time (days)

7/24/2019 DB16 Latin America
http://slidepdf.com/reader/full/db16-latin-america 37/101
LATIN AMERICADoing Business 2016
GETTING ELECTRICITY
Cost (% of income per capita)
Source: Doing Business database.

7/24/2019 DB16 Latin America
http://slidepdf.com/reader/full/db16-latin-america 38/101
LATIN AMERICADoing Business 2016
GETTING ELECTRICITY
Reliability of supply and transparency of tariff index (0-8)
Source: Doing Business database.
Note: The index ranges from 0 to 8, with higher values indicating greater reliability of electricity supply and greater transparency
of tariffs.
7/24/2019 DB16 Latin America
http://slidepdf.com/reader/full/db16-latin-america 39/101
LATIN AMERICADoing Business 2016
GETTING ELECTRICITY
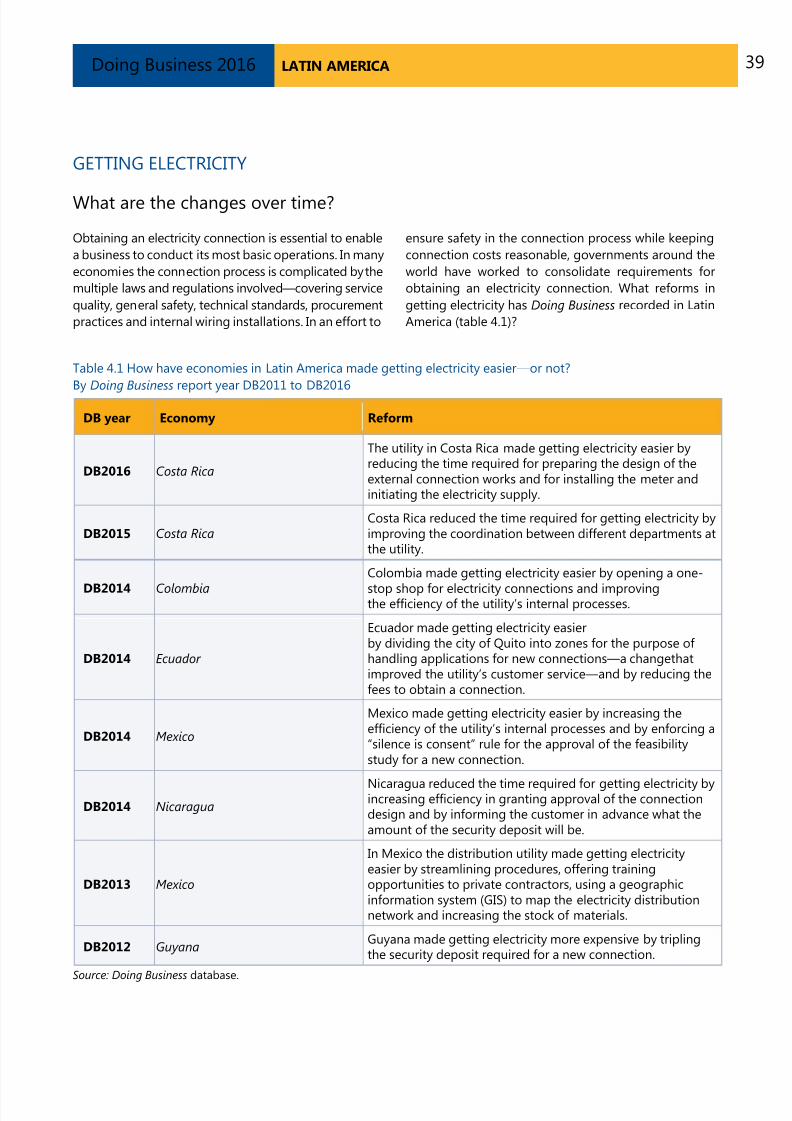
What are the changes over time?
Obtaining an electricity connection is essential to enable
a business to conduct its most basic operations. In many
economies the connection process is complicated by the
multiple laws and regulations involved—covering service
quality, general safety, technical standards, procurement
practices and internal wiring installations. In an effort to
ensure safety in the connection process while keeping
connection costs reasonable, governments around the
world have worked to consolidate requirements for
obtaining an electricity connection. What reforms in
getting electricity has Doing Business recorded in Latin
America (table 4.1)?
Table 4.1 How have economies in Latin America made getting electricity easier—or not?
By Doing Business report year DB2011 to DB2016
DB year Economy Reform
DB2016 Costa Rica
The utility in Costa Rica made getting electricity easier byreducing the time required for preparing the design of theexternal connection works and for installing the meter andinitiating the electricity supply.
DB2015 Costa RicaCosta Rica reduced the time required for getting electricity byimproving the coordination between different departments atthe utility.
DB2014 Colombia
Colombia made getting electricity easier by opening a one-
stop shop for electricity connections and improvingthe efficiency of the utility’s internal processes.
DB2014 Ecuador
Ecuador made getting electricity easierby dividing the city of Quito into zones for the purpose ofhandling applications for new connections—a changethatimproved the utility’s customer service—and by reducing thefees to obtain a connection.
DB2014 Mexico
Mexico made getting electricity easier by increasing theefficiency of the utility’s internal processes and by enforcing a“silence is consent” rule for the approval of the feasibilitystudy for a new connection.
DB2014 NicaraguaNicaragua reduced the time required for getting electricity byincreasing efficiency in granting approval of the connectiondesign and by informing the customer in advance what theamount of the security deposit will be.
DB2013 Mexico
In Mexico the distribution utility made getting electricityeasier by streamlining procedures, offering trainingopportunities to private contractors, using a geographicinformation system (GIS) to map the electricity distributionnetwork and increasing the stock of materials.
DB2012 GuyanaGuyana made getting electricity more expensive by triplingthe security deposit required for a new connection.
Source: Doing Business database.

7/24/2019 DB16 Latin America
http://slidepdf.com/reader/full/db16-latin-america 40/101
LATIN AMERICADoing Business 2016
REGISTERING PROPERTYEnsuring formal property rights is fundamental.
Effective administration of land is part of that. If
formal property transfer is too costly or
complicated, formal titles might go informal again.
And where property is informal or poorly
administered, it has little chance of being accepted
as collateral for loans—limiting access to finance.
What do the indicators cover?
Doing Business records the full sequence of
procedures necessary for a business to purchase
property from another business and transfer the
property title to the buyer’s name. The transaction isconsidered complete when it is opposable to third
parties and when the buyer can use the property,
use it as collateral for a bank loan or resell it. In
addition, this year Doing Business adds a new
measure to the set of registering property
indicators, an index of the quality of the land
administration system in each economy. The
ranking of economies on the ease of registering
property is determined by sorting their distance to
frontier scores for registering property. These scores
are the simple average of the distance to frontier
scores for each of the component indicators. Tomake the data comparable across economies,
several assumptions about the parties to the
transaction, the property and the procedures are
used.
The parties (buyer and seller):
Are limited liability companies, 100%
domestically and privately owned and
perform general commercial activities and
are located in the economy’s largest
business city2.
Have 50 employees each, all of whom are
nationals.
The property (fully owned by the seller):
Has a value of 50 times income per capita.
The sale price equals the value and entire
property will be transferred.
Is registered in the land registry or cada-
stre, or both, and is free of title disputes.
WHAT THE REGISTERING PROPERTY
INDICATORS MEASURE
Procedures to legally transfer title on
immovable property (number)
Preregistration (for example, checking for liens,notarizing sales agreement, paying propertytransfer taxes)
Registration in the economy’s largest businesscity2
Postregistration (for example, filing title with
the municipality)
Time required to complete each procedure
(calendar days)
Does not include time spent gatheringinformation
Each procedure starts on a separate day.Procedures that can be fully completed onlineare recorded as ½ day.
Procedure considered completed once finaldocument is received
No prior contact with officials
Cost required to complete each procedure
(% of property value)
Official costs only, no bribes
No value added or capital gains taxes included
Quality of land administration index (0-30)
Is located in a periurban commercial zone, and
no rezoning is required.
Has no mortgages attached, has been under
the same ownership for the past 10 years.
Consists of 557.4 square meters (6,000
square feet) of land and a 10-year-old, 2-story
warehouse of 929 square meters (10,000
square feet). The warehouse is in good
condition and complies with all safety
standards, building codes and legal
requirements. There is no heating system.
2
For the 11 economies with a population of more than 100 million, data for a second city have been added.

7/24/2019 DB16 Latin America
http://slidepdf.com/reader/full/db16-latin-america 41/101
LATIN AMERICADoing Business 2016
REGISTERING PROPERTY
Where do the region’s economies stand today?
How easy is it for entrepreneurs in economies in Latin
America to transfer property? The global rankings of
these economies on the ease of registering property
suggest an answer (figure 5.1). The average ranking of
the region and comparator regions provide a useful
benchmark.
Figure 5.1 How economies in Latin America rank on the ease of registering property
Source: Doing Business database.

7/24/2019 DB16 Latin America
http://slidepdf.com/reader/full/db16-latin-america 42/101
LATIN AMERICADoing Business 2016
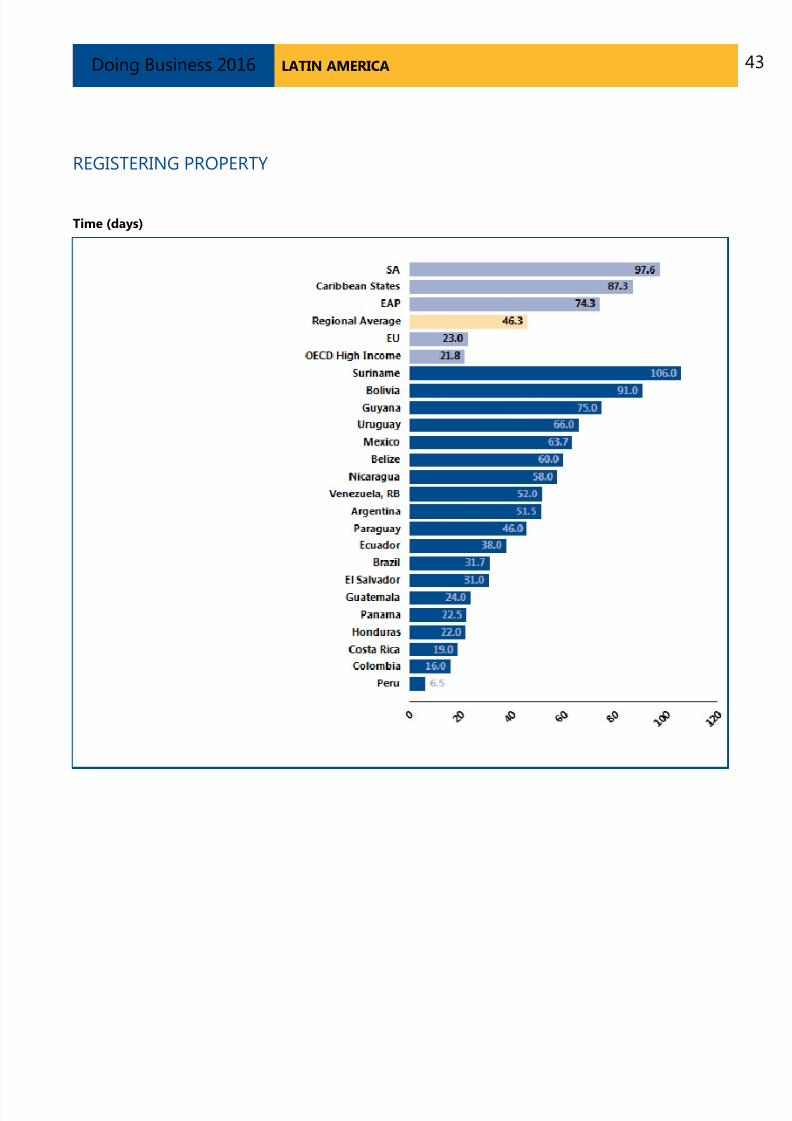
REGISTERING PROPERTY
The indicators underlying the rankings may be morerevealing. Data collected by Doing Business show what
it takes to complete a property transfer in each
economy in the region: the number of procedures, the
time and the cost (figure 5.2). Comparing theseindicators across the region and with averages both for
the region and for comparator regions can provide
useful insights.
Figure 5.2 What it takes to register property in economies in Latin America
Procedures (number)
7/24/2019 DB16 Latin America
http://slidepdf.com/reader/full/db16-latin-america 43/101
LATIN AMERICADoing Business 2016
REGISTERING PROPERTY
Time (days)

7/24/2019 DB16 Latin America
http://slidepdf.com/reader/full/db16-latin-america 44/101
LATIN AMERICADoing Business 2016
REGISTERING PROPERTY
Cost (% of property value)
* Indicates a “no practice” mark. If an economy has no laws or regulations covering a specific area—for example,insolvency—it receives a “no practice” mark. Similarly, an economy receives a “no practice” or “not possible” mark if
regulation exists but is never used in practice or if a competing regulation prohibits such practice. Either way, a “no
practice” mark puts the economy at the bottom of the ranking on the relevant indicator.
Source: Doing Business database.

7/24/2019 DB16 Latin America
http://slidepdf.com/reader/full/db16-latin-america 45/101
LATIN AMERICADoing Business 2016
REGISTERING PROPERTY
Quality of Land Administration Index (0-30)
* Indicates a “no practice” mark. If an economy has no laws or regulations covering a specific area—for example,
insolvency—it receives a “no practice” mark. Similarly, an economy receives a “no practice” or “not possible” mark if
regulation exists but is never used in practice or if a competing regulation prohibits such practice. Either way, a “no
practice” mark puts the economy at the bottom of the ranking on the relevant indicator.
Source: Doing Business database.
Note: The index ranges from 0 to 30, with higher values indicating better quality of the land administration system.

7/24/2019 DB16 Latin America
http://slidepdf.com/reader/full/db16-latin-america 46/101
LATIN AMERICADoing Business 2016
REGISTERING PROPERTY
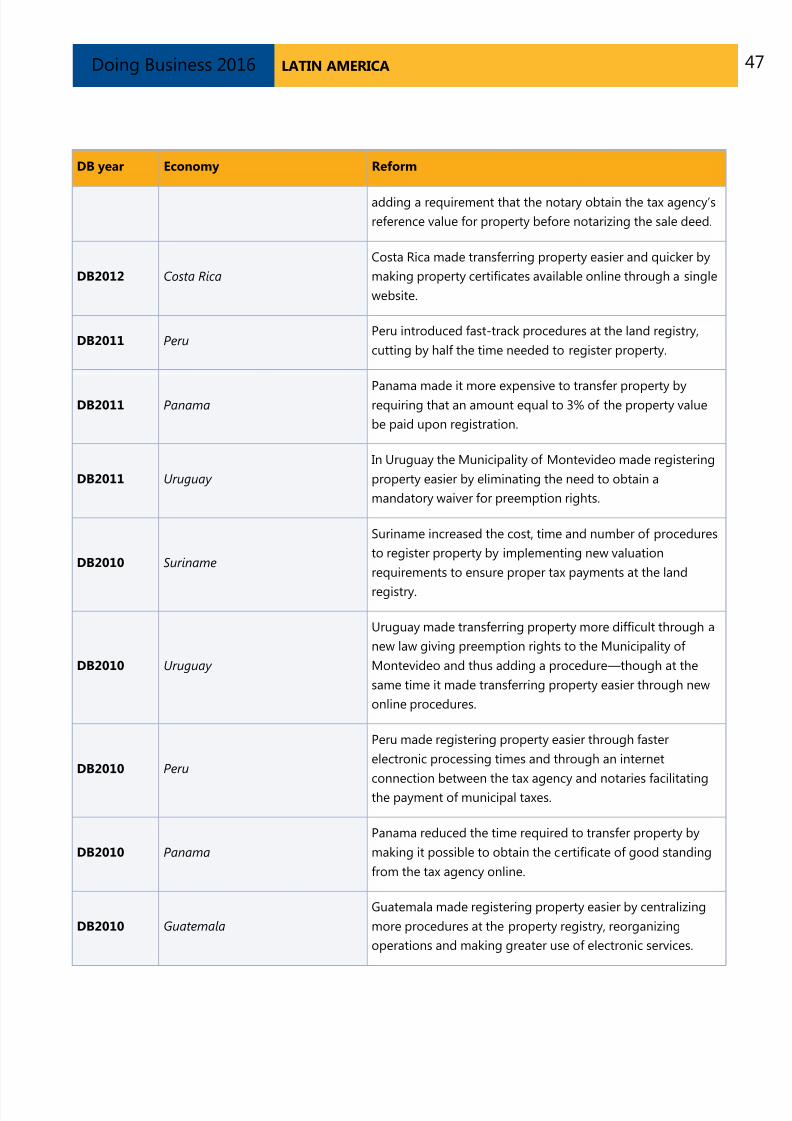
What are the changes over time?
Economies worldwide have been making it easier for
entrepreneurs to register and transfer property—such as
by computerizing land registries, introducing time limits
for procedures and setting low fixed fees. Many have cut
the time required substantially—enabling
buyers to use or mortgage their property earlier. What
property registration reforms has Doing Business
recorded in Latin America (table 5.1)?
Table 5.1 How have economies in Latin America made registering property easier—or not?
By Doing Business report year DB2011 to DB2016
DB year Economy Reform
DB2016 BrazilBrazil made transferring property in São Paulo more
expensive by increasing the property transfer tax.
DB2015 ColombiaColombia made transferring property easier by eliminating
the need for a provisional registration.
DB2014 PanamaPanama made transferring property easier by connecting the
land registry with the cadastre.
DB2014 Suriname Suriname made transferring property easier by increasingadministrative efficiency at the land registry.
DB2013 Brazil
Brazil made transferring property more difficult by
introducing a new certificate on good standing on labor
debts, adding to the number of due diligence procedures.
DB2013 Ecuador
In Ecuador property transfers became more time consuming
as a result of implementation problems in transferring
authority over property records to the municipality of Quito.
DB2013 PanamaPanama made property transfers faster by increasing working
hours at the registry and reorganizing the caseload of its staff.
DB2012 GuyanaIn Guyana transferring property became slower because of a
lack of personnel at the deed registry.
DB2012 NicaraguaNicaragua made transferring property more efficient by
introducing a fast-track procedure for registration.
DB2012 Argentina Argentina made transferring property more difficult by
7/24/2019 DB16 Latin America
http://slidepdf.com/reader/full/db16-latin-america 47/101
LATIN AMERICADoing Business 2016
DB year Economy Reform
adding a requirement that the notary obtain the tax agency’s
reference value for property before notarizing the sale deed.
DB2012 Costa Rica
Costa Rica made transferring property easier and quicker by
making property certificates available online through a single
website.
DB2011 PeruPeru introduced fast-track procedures at the land registry,
cutting by half the time needed to register property.
DB2011 PanamaPanama made it more expensive to transfer property byrequiring that an amount equal to 3% of the property value
be paid upon registration.
DB2011 Uruguay
In Uruguay the Municipality of Montevideo made registering
property easier by eliminating the need to obtain a
mandatory waiver for preemption rights.
DB2010 Suriname
Suriname increased the cost, time and number of procedures
to register property by implementing new valuation
requirements to ensure proper tax payments at the land
registry.
DB2010 Uruguay
Uruguay made transferring property more difficult through a
new law giving preemption rights to the Municipality of
Montevideo and thus adding a procedure—though at the
same time it made transferring property easier through new
online procedures.
DB2010 Peru
Peru made registering property easier through faster
electronic processing times and through an internet
connection between the tax agency and notaries facilitating
the payment of municipal taxes.
DB2010 Panama
Panama reduced the time required to transfer property by
making it possible to obtain the certificate of good standing
from the tax agency online.
DB2010 Guatemala
Guatemala made registering property easier by centralizing
more procedures at the property registry, reorganizing
operations and making greater use of electronic services.

7/24/2019 DB16 Latin America
http://slidepdf.com/reader/full/db16-latin-america 48/101
LATIN AMERICADoing Business 2016
DB year Economy Reform
DB2010 Colombia
Colombia made transferring property easier by making
certificates required for the process available online and
providing a standard preliminary sale agreement free of
charge, online and in notary offices.
DB2010 Argentina
Argentina made transferring property more difficult by
adding a new requirement to declare all transactions over
300,000 Argentine pesos.
Note: For information on reforms in earlier years (back to DB2005), see the Doing Business reports for these years, available at
http://www.doingbusiness.org.
Source: Doing Business database.

7/24/2019 DB16 Latin America
http://slidepdf.com/reader/full/db16-latin-america 49/101
LATIN AMERICADoing Business 2016
GETTING CREDIT
Two types of frameworks can facilitate access to
credit and improve its allocation: credit information
systems and borrowers and lenders in collateral and
bankruptcy laws. Credit information systems enable
lenders’ rights to view a potential borrower’s financial
history (positive or negative)—valuable information to
consider when assessing risk. And they permit
borrowers to establish a good credit history that will
allow easier access to credit. Sound collateral laws
enable businesses to use their assets, especially
movable property, as security to generate capital—
while strong creditors’ rights have been associatedwith higher ratios of private sector credit to GDP.
What do the indicators cover?
Doing Business assesses the sharing of credit
information and the legal rights of borrowers and
lenders with respect to secured transactions through
2 sets of indicators. The depth of credit information
index measures rules and practices affecting the
coverage, scope and accessibility of credit
information available through a credit registry or a
credit bureau. The strength of legal rights index
measures whether certain features that facilitatelending exist within the applicable collateral and
bankruptcy laws. Doing Business uses two case
scenarios, Case A and Case B, to determine the scope
of the secured transactions system, involving a
secured borrower and a secured lender and
examining legal restrictions on the use of movable
collateral (for more details on each case, see the Data
Notes section of the Doing Business 2016 report).
These scenarios assume that the borrower:
Is a private limited liability company.
Has its headquarters and only base of
operations in the largest business city. For the
11 economies with a population of more than
100 million, data for a second city have been
added.
WHAT THE GETTING CREDIT INDICATORS
MEASURE
Strength of legal rights index (0–12)
Rights of borrowers and lenders throughcollateral laws
Protection of secured creditors’ rights throughbankruptcy laws
Depth of credit information index (0–8)
Scope and accessibility of credit informationdistributed by credit bureaus and creditregistries
Credit bureau coverage (% of adults)
Number of individuals and firms listed inlargest credit bureau as percentage of adultpopulation
Credit registry coverage (% of adults)
Number of individuals and firms listed incredit registry as percentage of adultpopulation
Has up to 50 employees.
Is 100% domestically owned, as is the lender.
The ranking of economies on the ease of getting
credit is determined by sorting their distance to
frontier scores for getting credit. These scores are
the distance to frontier score for the strength of
legal rights index and the depth of credit
information index.
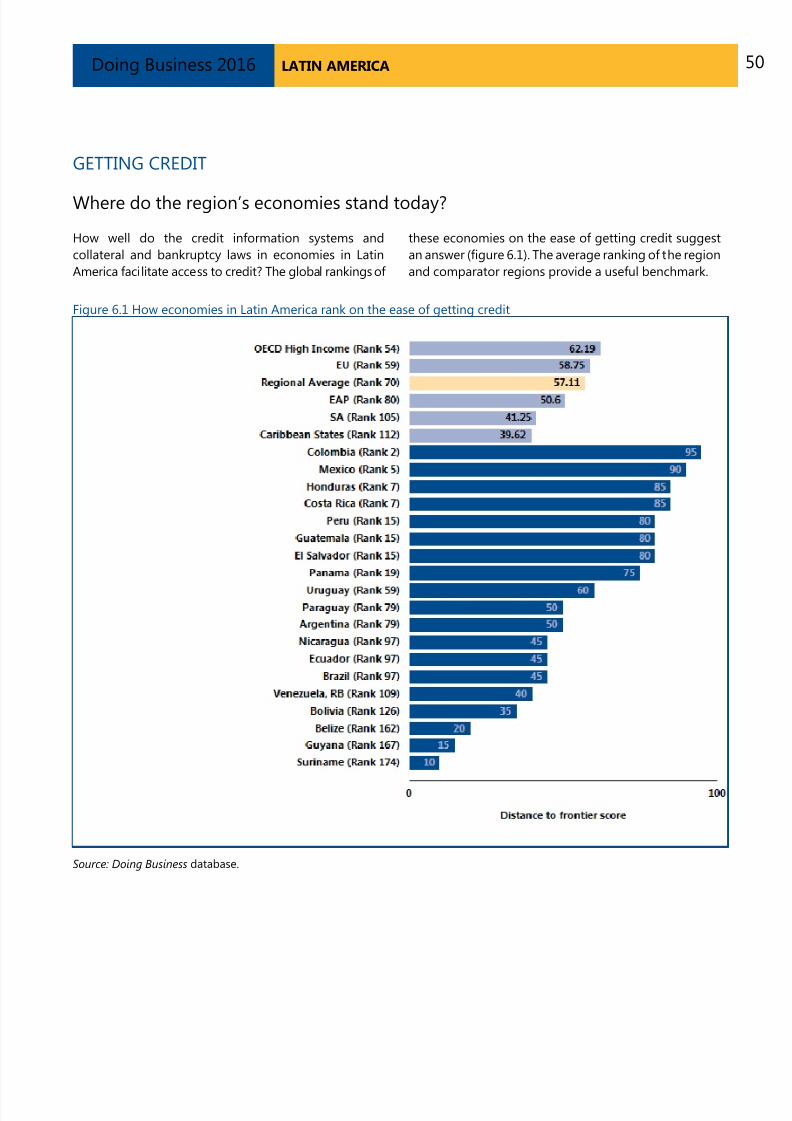
7/24/2019 DB16 Latin America
http://slidepdf.com/reader/full/db16-latin-america 50/101
LATIN AMERICADoing Business 2016
GETTING CREDIT
Where do the region’s economies stand today?
How well do the credit information systems and
collateral and bankruptcy laws in economies in Latin
America facilitate access to credit? The global rankings of
these economies on the ease of getting credit suggest
an answer (figure 6.1). The average ranking of the region
and comparator regions provide a useful benchmark.
Figure 6.1 How economies in Latin America rank on the ease of getting credit
Source: Doing Business database.

7/24/2019 DB16 Latin America
http://slidepdf.com/reader/full/db16-latin-america 51/101
LATIN AMERICADoing Business 2016
GETTING CREDIT
Another way to assess how well regulations andinstitutions support lending and borrowing in the region
is to see where the region stands in the distribution of
scores across regions. Figure 6.2 highlights the score on
the strength of legal rights index for Latin America andcomparators on the strength of legal rights index. Figure
6.3 shows the same thing for the depth of credit
information index.
Figure 6.2 How strong are legal rights for borrowers and lenders?Region scores on strength of legal rights index
Note: Higher scores indicate that collateral and bankruptcy laws are better designed to facilitate access to credit.
Source: Doing Business database.

7/24/2019 DB16 Latin America
http://slidepdf.com/reader/full/db16-latin-america 52/101
LATIN AMERICADoing Business 2016
Figure 6.3 How much credit information is shared—and how widely?
Region scores on depth of credit information index
Note: Higher scores indicate the availability of more credit information, from either a credit registry or a credit bureau, to
facilitate lending decisions. If the credit bureau or registry is not operational or covers less than 5% of the adult population,
the total score on the depth of credit information index is 0.
Source: Doing Business database.

7/24/2019 DB16 Latin America
http://slidepdf.com/reader/full/db16-latin-america 53/101
LATIN AMERICADoing Business 2016
GETTING CREDIT
What are the changes over time?
When economies strengthen the legal rights of lenders
and borrowers under collateral and bankruptcy laws, and
increase the scope, coverage and accessibility of credit
information, they can increase entrepreneurs’ access to
credit. What credit reforms has Doing Business recorded
in Latin America (table 6.1)?
Table 6.1 How have economies in Latin America made getting credit easier—or not?
By Doing Business report year DB2011 to DB2016
DB year Economy Reform
DB2016 Costa Rica
Costa Rica improved access to credit by adopting a new
secured transactions law that establishes a functional secured
transactions system and a modern, centralized, notice-based
collateral registry. The law broadens the range of assets that
can be used as collateral, allows a general description of
assets granted as collateral and allows out-of-court
enforcement of collateral.
DB2016 GuyanaGuyana improved access to credit information by establishing
a new credit bureau.
DB2016 Mexico
Mexico improved access to credit by implementing a decree
allowing a general description of assets granted as collateral.
This reform applies to both Mexico City and Monterrey.
DB2016 PeruPeru improved its credit information system by implementing
a new law on personal data protection.
DB2016 El Salvador
El Salvador improved access to credit by adopting the Law on
Movable Property, which established a modern, centralized,
notice-based collateral registry and allows a general
description of a single category of assets granted as
collateral.
DB2015 Colombia
Colombia improved access to credit by adopting a new
secured transactions law that establishes a functional secured
transactions system and a centralized, notice-based collateral
registry. The law broadens the range of assets that can be
used as collateral, allows a general description of assets
granted as collateral, establishes clear priority rules inside
bankruptcy for secured creditors, sets out grounds for relief
from a stay of enforcement actions by secured creditors
during reorganization procedures and allows out-of-court
enforcement of collateral.

7/24/2019 DB16 Latin America
http://slidepdf.com/reader/full/db16-latin-america 54/101
LATIN AMERICADoing Business 2016
DB year Economy Reform
DB2015 Mexico
Mexico improved access to credit by amending its insolvencyproceedings law and establishing clear grounds for relief from
a stay of enforcement actions by secured creditors during
reorganization procedures. This reform applies to both
Mexico City and Monterrey.
DB2015 NicaraguaNicaragua improved access to credit information by starting
to provide credit scores to banks and financial institutions.
DB2015 Panama
Panama improved access to credit through a new law
broadening the range of assets that can be used as collateral,
allowing a general description of assets granted as collateral
and allowing out-of-court enforcement of collateral.
DB2014 Venezuela, RB
República Bolivariana de Venezuela improved access to credit
information by starting to collect data on firms from financial
institutions.
DB2013 Costa RicaCosta Rica improved access to credit information by
guaranteeing borrowers’ right to inspect their personal data.
DB2013 El Salvador
El Salvador improved access to credit information through a
new law regulating the management of personal credit
information.
DB2012 Honduras
Honduras strengthened its secured transactions system
through a new decree establishing a centralized and
computerized collateral registry and providing for out-of-
court enforcement of collateral upon default.
DB2012 Mexico
Mexico strengthened its secured transactions system by
implementing a centralized collateral registry with an
electronic database that is accessible online.
DB2012 Paraguay
Paraguay improved its credit information system by
establishing an online platform for financial institutions toexchange information with the public credit registry.
DB2012 Uruguay
Uruguay improved its credit information system by
introducing a new online platform allowing access to credit
reports for financial institutions, public utilities and borrowers.
DB2012 Brazil
Brazil improved its credit information system by allowing
private credit bureaus to collect and share positive
information.

7/24/2019 DB16 Latin America
http://slidepdf.com/reader/full/db16-latin-america 55/101
LATIN AMERICADoing Business 2016
DB year Economy Reform
DB2011 Venezuela, RBRepública Bolivariana de Venezuela improved access to creditinformation by creating a private credit bureau.
DB2011 Guyana
Guyana enhanced access to credit by establishing a
regulatory framework that allows the licensing of private
credit bureaus and gives borrowers the right to inspect their
data.
DB2010 Honduras
Honduras improved its credit information system through a
resolution that enhances the operations of the public credit
bureau and introduces several categories for classifying
debtors on the basis of their credit history.
DB2010 Guatemala
Guatemala strengthened its secured transactions system by
creating a new movable asset registry that covers all types of
movable assets as well as creditors and debtors and improved
access to credit information by guaranteeing borrowers’ right
to inspect their own data.
DB2010 EcuadorEcuador’s credit bureau started to distribute historical data,
improving access to credit information.
DB2010 Colombia
Colombia improved access to credit information by
guaranteeing borrowers’ right to inspect their own data and
by making it mandatory for credit providers to consult and
share information with credit bureaus.
Note: For information on reforms in earlier years (back to DB2005), see the Doing Business reports for these years, available at
http://www.doingbusiness.org.
Source: Doing Business database.
7/24/2019 DB16 Latin America
http://slidepdf.com/reader/full/db16-latin-america 56/101
LATIN AMERICADoing Business 2016
PROTECTING MINORITY INVESTORSProtecting minority investors matters for the ability of
companies to raise the capital they need to grow,
innovate, diversify and compete. Effective regulations
define related-party transactions precisely, promote
clear and efficient disclosure requirements, require
shareholder participation in major decisions of the
company and set detailed standards of accountability
for company insiders.
What do the indicators cover?
Doing Business measures the protection of minority
investors from conflicts of interest through one set of
indicators and shareholders’ rights in corporategovernance through another. The ranking of economies
on the strength of minority investor protections is
determined by sorting their distance to frontier scores
for protecting minority investors. These scores are the
simple average of the distance to frontier scores for the
extent of conflict of interest regulation index and the
extent of shareholder governance index. To make the
data comparable across economies, a case study uses
several assumptions about the business and the
transaction.
The business (Buyer):
Is a publicly traded corporation listed on the
economy’s most important stock exchange
(or at least a large private company with
multiple shareholders).
Has a board of directors and a chief executive
officer (CEO) who may legally act on behalf of
Buyer where permitted, even if this is not
specifically required by law.
The transaction involves the following details:
Mr. James, a director and the majority
shareholder of the company, proposes that
the company purchase used trucks from
another company he owns.
The price is higher than the going price for
used trucks, but the transaction goes forward.
All required approvals are obtained, and all
required disclosures made, though the
transaction is prejudicial to Buyer.
Shareholders sue the interested parties and
the members of the board of directors.
WHAT THE PROTECTING MINORITY INVESTORS
INDICATORS MEASURE
Extent of disclosure index (0–10)
Review and approval requirements for related-party
transactions ; Disclosure requirements for related-party
transactions
Extent of director liability index (0–10)
Ability of minority shareholders to sue and hold interested
directors liable for prejudicial related-party transactions;
Available legal remedies (damages, disgorgement of profits,
fines, imprisonment, rescission of the transaction)
Ease of shareholder suits index (0–10)
Access to internal corporate documents; Evidence
obtainable during trial and allocation of legal expenses
Extent of conflict of interest regulation index
(0 – 10)
Simple average of the extent of disclosure, extent of director
liability and ease of shareholder indices
Extent of shareholder rights index (0-10)Shareholders’ rights and role in major corporate decisions
Extent of ownership and control index (0-10)
Governance safeguards protecting shareholders from undue
board control and entrenchment
Extent of corporate transparency index (0-10)
Corporate transparency on ownership stakes, compensation,
audits and financial prospects
Extent of shareholder governance index (0 –
10)
Simple average of the extent of shareholders rights, extent
of ownership and control and extent of corporate
transparency indices
Strength of investor protection index (0–10)
Simple average of the extent of conflict of interest
regulation and extent of shareholder governance indices
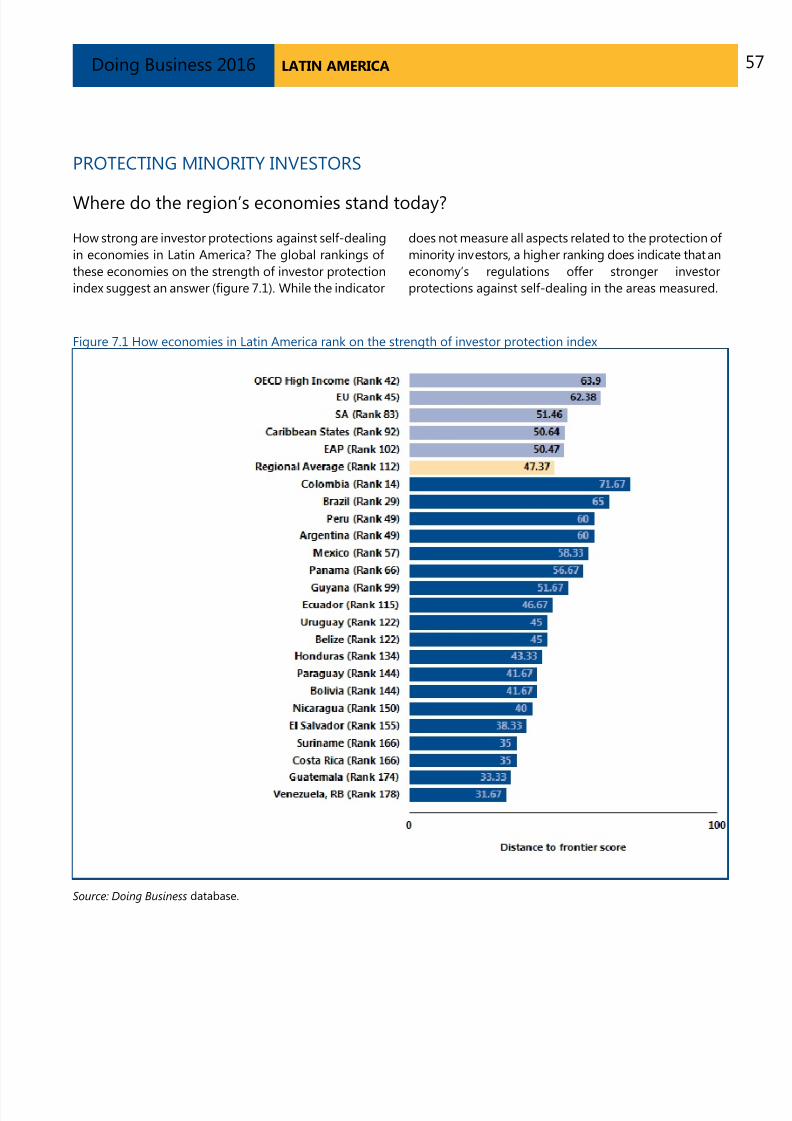
7/24/2019 DB16 Latin America
http://slidepdf.com/reader/full/db16-latin-america 57/101
LATIN AMERICADoing Business 2016
PROTECTING MINORITY INVESTORS
Where do the region’s economies stand today?
How strong are investor protections against self-dealing
in economies in Latin America? The global rankings of
these economies on the strength of investor protection
index suggest an answer (figure 7.1). While the indicator
does not measure all aspects related to the protection of
minority investors, a higher ranking does indicate that an
economy’s regulations offer stronger investor
protections against self-dealing in the areas measured.
Figure 7.1 How economies in Latin America rank on the strength of investor protection index
Source: Doing Business database.

7/24/2019 DB16 Latin America
http://slidepdf.com/reader/full/db16-latin-america 58/101
LATIN AMERICADoing Business 2016
PROTECTING MINORITY INVESTORS
The strength of minority investor protection index is theaverage of the extent of conflict of interest regulation
index and the extent of shareholder governance index.
The index ranges from 0 to 10, rounded to the nearest
decimal place, with higher values indicating stronger
minority investor protections. Figures 7.2 and 7.3
highlight the scores on the various minority investorprotection indices for Latin America. Comparing the
scores across the region and with averages both for the
region and for comparator regions can provide useful
insights.
Figure 7.2 How extensive are conflict of interest regulations?
Extent of conflict of interest regulation index (0-10)
Note: Higher values indicate stronger regulation of conflicts of interest.
Source: Doing Business database.

7/24/2019 DB16 Latin America
http://slidepdf.com/reader/full/db16-latin-america 59/101
LATIN AMERICADoing Business 2016
Figure 7.3 How extensive is shareholder governance?
Extent of shareholder governance index (0-10)
Note: Higher scores indicate stronger rights of shareholders in corporate governance.
Source: Doing Business database.

7/24/2019 DB16 Latin America
http://slidepdf.com/reader/full/db16-latin-america 60/101
LATIN AMERICADoing Business 2016
PROTECTING MINORITY INVESTORS
What are the changes over time?
Economies with the strongest protections of minority
investors from self-dealing require detailed disclosure
and define clear duties for directors. They also have well-
functioning courts and up-to-date procedural rules that
give minority shareholders the means to prove their case
and obtain a judgment within a reasonable time. So
reforms to strengthen minority investor protections may
move ahead on different fronts—such as through new or
amended company laws, securities regulations or
revisions to court procedures. What minority investor
protection reforms has Doing Business recorded in Latin
America (table 7.1)?
Table 7.1 How have economies in Latin America strengthened minority investor protections—or not? By Doing Business report year DB2011 to DB2016
DB year Economy Reform
DB2016 Honduras
Honduras strengthened minority investor protections by
introducing provisions requiring greater disclosure of related-
party transactions, prohibiting interested parties from voting
on a related-party transaction, allowing shareholders
representing at least 5% of a company’s share capital to bring
a direct action for damages against its directors and giving
any shareholder the right to inspect company documents.
DB2015 Ecuador
Ecuador strengthened minority investor protections by
introducing greater requirements for disclosure of related-
party transactions as well as a requirement that a potential
acquirer make a tender offer to all shareholders upon
acquiring voting shares.
DB2014 PanamaPanama strengthened investor protections by increasing the
disclosure requirements for publicly held companies.
DB2013 Peru
Peru strengthened investor protections through a new law
regulating the approval of related-party transactions and
making it easier to sue directors when such transactions are
prejudicial.
DB2012 El SalvadorEl Salvador strengthened investor protections by allowing
greater access to corporate information during the trial.
DB2012 Peru
Peru strengthened investor protections through a new law
allowing minority shareholders to request access to
nonconfidential corporate documents.

7/24/2019 DB16 Latin America
http://slidepdf.com/reader/full/db16-latin-america 61/101
LATIN AMERICADoing Business 2016
DB year Economy Reform
DB2010 Colombia
Colombia strengthened investor protections by making it
easier to sue directors when a related-party transaction harmsthe company.
Note: For information on reforms in earlier years (back to DB2005), see the Doing Business reports for these years, available at
http://www.doingbusiness.org.
Source: Doing Business database.

7/24/2019 DB16 Latin America
http://slidepdf.com/reader/full/db16-latin-america 62/101
LATIN AMERICADoing Business 2016
PAYING TAXESTaxes are essential. The level of tax rates needs to
be carefully chosen—and needless complexity intax rules avoided. Firms in economies that rank
better on the ease of paying taxes in the Doing
Business study tend to perceive both tax rates and
tax administration as less of an obstacle to
business according to the World Bank Enterprise
Survey research.
What do the indicators cover?
Using a case scenario, Doing Business records the
taxes and mandatory contributions that a medium-
size company must pay in a given year as well asmeasures of the administrative burden of paying
taxes and contributions. This case scenario uses a set
of financial statements and assumptions about
transactions made over the year. Information is also
compiled on the frequency of filing and payments as
well as time taken to comply with tax laws. The
ranking of economies on the ease of paying taxes is
determined by sorting their distance to frontier
scores on the ease of paying taxes. These scores are
the simple average of the distance to frontier scores
for each of the component indicators, with a
threshold and a nonlinear transformation applied toone of the component indicators, the total tax rate3.
The financial statement variables have been updated
to be proportional to 2012 income per capita;
previously they were proportional to 2005 income
per capita. To make the data comparable across
economies, several assumptions are used.
TaxpayerCo is a medium-size business that
started operations on January 1, 2013.
The business starts from the same financial
position in each economy. All the taxes
and mandatory contributions paid duringthe second year of operation are recorded.
Taxes and mandatory contributions are
measured at all levels of government.
Taxes and mandatory contributions include
corporate income tax, turnover tax and all
labor taxes and contributions paid by the
company.
A range of standard deductions and
exemptions are also recorded.
WHAT THE PAYING TAXES INDICATORS
MEASURE
Tax payments for a manufacturing company
in 2014 (number per year adjusted for
electronic and joint filing and payment)
Total number of taxes and contributions paid,including consumption taxes (value added tax,sales tax or goods and service tax)
Method and frequency of filing and payment
Time required to comply with 3 major taxes
(hours per year)
Collecting information and computing the taxpayable
Completing tax return forms, filing withproper agencies
Arranging payment or withholding
Preparing separate tax accounting books, ifrequired
Total tax rate (% of profit before all taxes)
Profit or corporate income tax
Social contributions and labor taxes paid by
the employer
Property and property transfer taxes
Dividend, capital gains and financialtransactions taxes
Waste collection, vehicle, road and other taxes
3 The nonlinear distance to frontier for the total tax rate is equal to the distance to frontier for the total tax rate to the power of 0.8.The threshold is defined as the total tax rate at the 15th percentile of the overall distribution for all years included in the analysis upto and including Doing Business 2015, which is 26.1%. All economies with a total tax rate below this threshold receive the same
score as the economy at the threshold.

7/24/2019 DB16 Latin America
http://slidepdf.com/reader/full/db16-latin-america 63/101
LATIN AMERICADoing Business 2016
PAYING TAXES
Where do the region’s economies stand today?
What is the administrative burden of complying withtaxes in economies in Latin America—and how much do
firms pay in taxes? The global rankings of these
economies on the ease of paying taxes offer useful
information for assessing the tax compliance burden forbusinesses (figure 8.1). The average ranking of the region
provides a useful benchmark.
Figure 8.1 How economies in Latin America rank on the ease of paying taxes
Note: All economies with a total tax rate below the threshold of 26.1% applied in DB2015, receive the same distance to frontier
score for the total tax rate (a distance to frontier score of 100 for the total tax rate) for the purpose of calculating the ranking on the
ease of paying taxes.
Source: Doing Business database.

7/24/2019 DB16 Latin America
http://slidepdf.com/reader/full/db16-latin-america 64/101
LATIN AMERICADoing Business 2016
PAYING TAXES
The indicators underlying the rankings may be morerevealing. Data collected by Doing Business show what it
takes to comply with tax regulations in each economy in
the region—the number of payments per year and the
time required to prepare, and file and pay taxes the 3
major taxes (corporate income tax, VAT or sales tax andlabor taxes and mandatory contributions)—as well as the
total tax rate (figure 8.2). Comparing these indicators
across the region and with averages both for the region
and for comparator regions can provide useful insights.
Figure 8.2 How easy is it to pay taxes in economies in Latin America—and what are the total tax rates?
Payments (number per year)
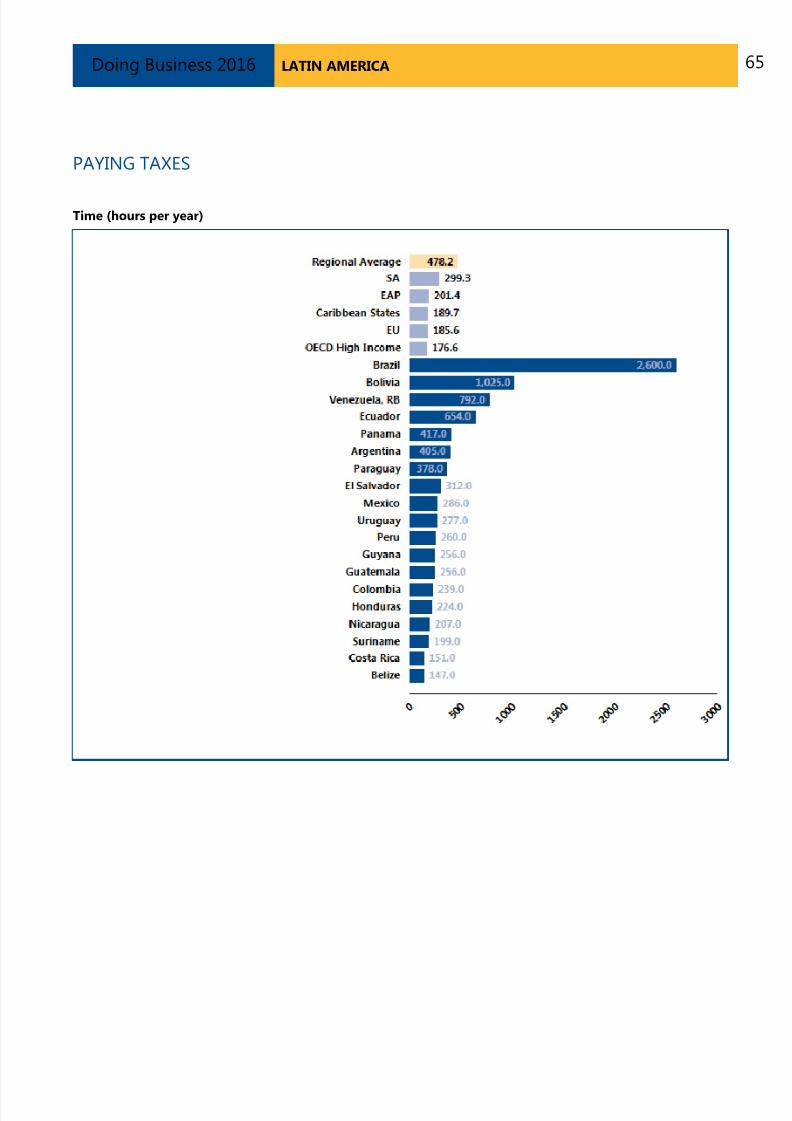
7/24/2019 DB16 Latin America
http://slidepdf.com/reader/full/db16-latin-america 65/101
LATIN AMERICADoing Business 2016
PAYING TAXES
Time (hours per year)

7/24/2019 DB16 Latin America
http://slidepdf.com/reader/full/db16-latin-america 66/101
LATIN AMERICADoing Business 2016
PAYING TAXES
Total tax rate (% of profit)
Source: Doing Business database.
7/24/2019 DB16 Latin America
http://slidepdf.com/reader/full/db16-latin-america 67/101
LATIN AMERICADoing Business 2016
PAYING TAXES
What are the changes over time?
Economies around the world have made paying taxes
faster and easier for businesses—such as by
consolidating filings, reducing the frequency of
payments or offering electronic filing and payment.
Many have lowered tax rates. Changes have brought
concrete results. Some economies simplifying
compliance with tax obligations and reducing rates have
seen tax revenue rise. What tax reforms has Doing
Business recorded in Latin America (table 8.1)?
Table 8.1 How have economies in Latin America made paying taxes easier—or not?
By Doing Business report year DB2011 to DB2016
DB year Economy Reform
DB2016 Colombia
Colombia made paying taxes less costly for companies by
reducing the payroll tax rate and introducing exemptions for
health care contributions paid by employers.
DB2016 Costa Rica
Costa Rica made paying taxes easier for companies by
promoting the use of its electronic filing and payment system
for corporate income tax and general sales tax.
DB2016 GuatemalaGuatemala made paying taxes less costly for companies by
reducing the corporate income tax rate.
DB2016 HondurasHonduras made paying taxes more costly for companies by
introducing an alternative minimum income tax.
DB2016 Mexico
Mexico made paying taxes easier for companies by abolishing
the business flat tax—though it also made paying taxes more
costly by allowing only a portion of salaries to be deductible.
These changes apply to both Mexico City and Monterrey. In
addition, the payroll tax rate paid by employers was increased
for Mexico City.
DB2016 Peru
Peru made paying taxes easier for companies by creating an
advanced online registry with up-to-date information on
employees.
DB2016 Uruguay
Uruguay made paying taxes easier for companies by
continually upgrading and improving the electronic system
for filing and paying the major taxes.
DB2015 Colombia Colombia made paying taxes more complicated for
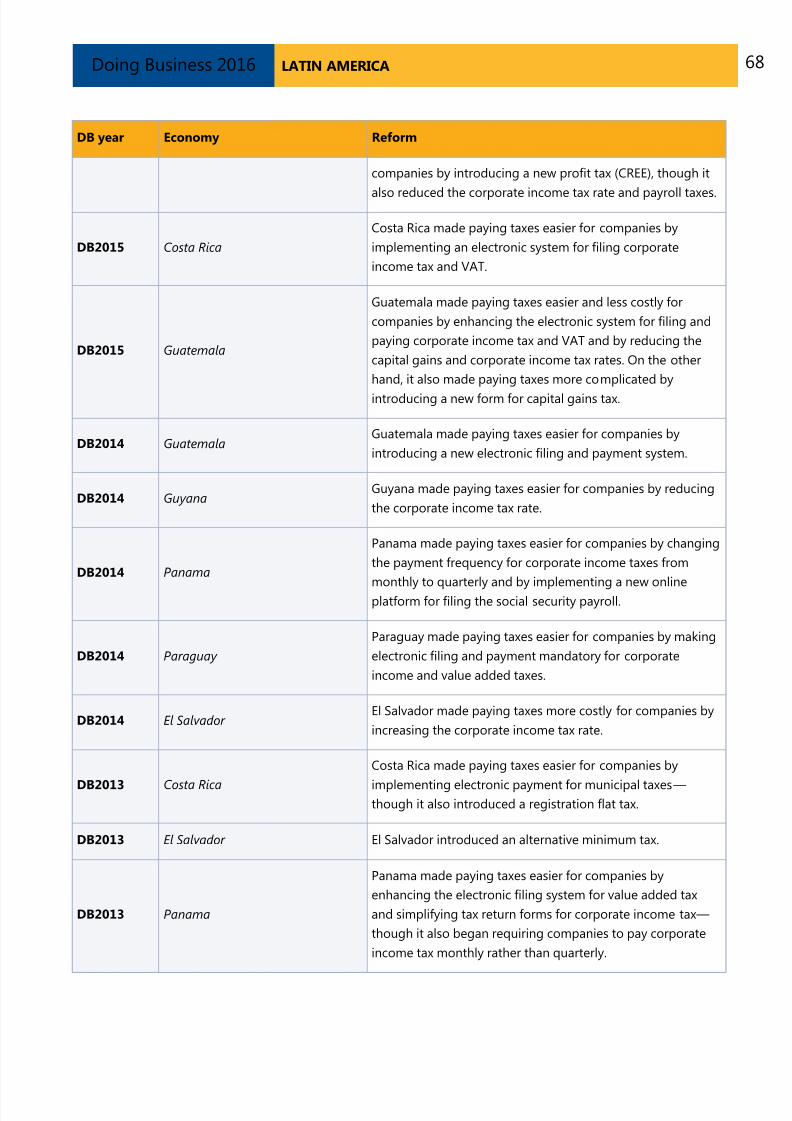
7/24/2019 DB16 Latin America
http://slidepdf.com/reader/full/db16-latin-america 68/101
LATIN AMERICADoing Business 2016
DB year Economy Reform
companies by introducing a new profit tax (CREE), though it
also reduced the corporate income tax rate and payroll taxes.
DB2015 Costa Rica
Costa Rica made paying taxes easier for companies by
implementing an electronic system for filing corporate
income tax and VAT.
DB2015 Guatemala
Guatemala made paying taxes easier and less costly for
companies by enhancing the electronic system for filing and
paying corporate income tax and VAT and by reducing the
capital gains and corporate income tax rates. On the other
hand, it also made paying taxes more complicated by
introducing a new form for capital gains tax.
DB2014 GuatemalaGuatemala made paying taxes easier for companies by
introducing a new electronic filing and payment system.
DB2014 GuyanaGuyana made paying taxes easier for companies by reducing
the corporate income tax rate.
DB2014 Panama
Panama made paying taxes easier for companies by changing
the payment frequency for corporate income taxes from
monthly to quarterly and by implementing a new online
platform for filing the social security payroll.
DB2014 Paraguay
Paraguay made paying taxes easier for companies by making
electronic filing and payment mandatory for corporate
income and value added taxes.
DB2014 El SalvadorEl Salvador made paying taxes more costly for companies by
increasing the corporate income tax rate.
DB2013 Costa Rica
Costa Rica made paying taxes easier for companies by
implementing electronic payment for municipal taxes—though it also introduced a registration flat tax.
DB2013 El Salvador El Salvador introduced an alternative minimum tax.
DB2013 Panama
Panama made paying taxes easier for companies by
enhancing the electronic filing system for value added tax
and simplifying tax return forms for corporate income tax—
though it also began requiring companies to pay corporate
income tax monthly rather than quarterly.
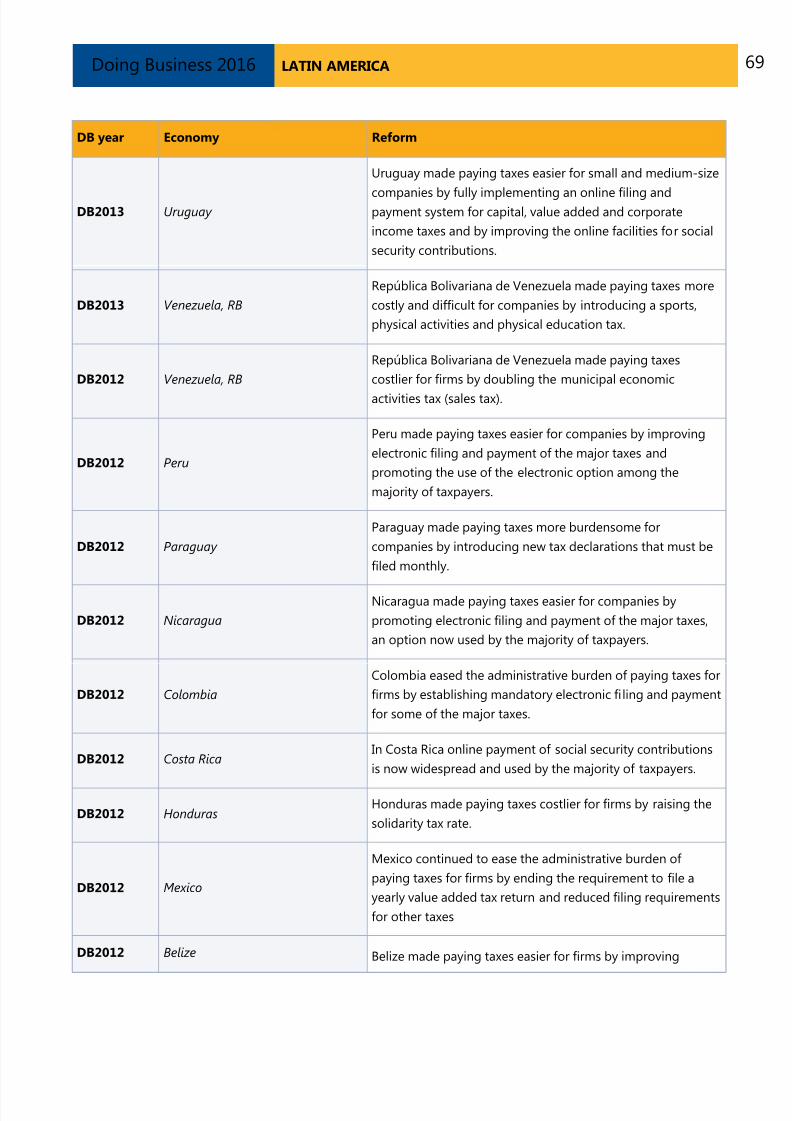
7/24/2019 DB16 Latin America
http://slidepdf.com/reader/full/db16-latin-america 69/101
LATIN AMERICADoing Business 2016
DB year Economy Reform
DB2013 Uruguay
Uruguay made paying taxes easier for small and medium-size
companies by fully implementing an online filing andpayment system for capital, value added and corporate
income taxes and by improving the online facilities for social
security contributions.
DB2013 Venezuela, RB
República Bolivariana de Venezuela made paying taxes more
costly and difficult for companies by introducing a sports,
physical activities and physical education tax.
DB2012 Venezuela, RB
República Bolivariana de Venezuela made paying taxes
costlier for firms by doubling the municipal economic
activities tax (sales tax).
DB2012 Peru
Peru made paying taxes easier for companies by improving
electronic filing and payment of the major taxes and
promoting the use of the electronic option among the
majority of taxpayers.
DB2012 Paraguay
Paraguay made paying taxes more burdensome for
companies by introducing new tax declarations that must be
filed monthly.
DB2012 Nicaragua
Nicaragua made paying taxes easier for companies by
promoting electronic filing and payment of the major taxes,
an option now used by the majority of taxpayers.
DB2012 Colombia
Colombia eased the administrative burden of paying taxes for
firms by establishing mandatory electronic fi ling and payment
for some of the major taxes.
DB2012 Costa RicaIn Costa Rica online payment of social security contributions
is now widespread and used by the majority of taxpayers.
DB2012 HondurasHonduras made paying taxes costlier for firms by raising the
solidarity tax rate.
DB2012 Mexico
Mexico continued to ease the administrative burden of
paying taxes for firms by ending the requirement to file a
yearly value added tax return and reduced filing requirements
for other taxes
DB2012 Belize Belize made paying taxes easier for firms by improving
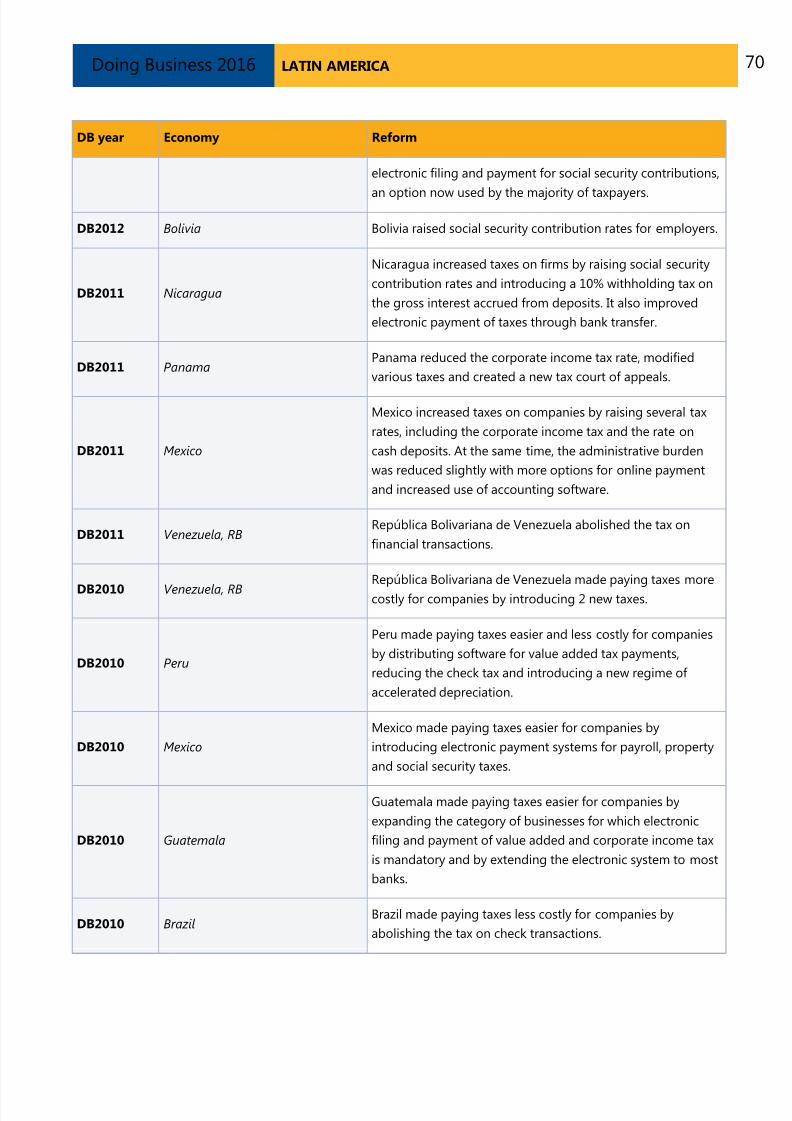
7/24/2019 DB16 Latin America
http://slidepdf.com/reader/full/db16-latin-america 70/101
LATIN AMERICADoing Business 2016
DB year Economy Reform
electronic filing and payment for social security contributions,
an option now used by the majority of taxpayers.
DB2012 Bolivia Bolivia raised social security contribution rates for employers.
DB2011 Nicaragua
Nicaragua increased taxes on firms by raising social security
contribution rates and introducing a 10% withholding tax on
the gross interest accrued from deposits. It also improved
electronic payment of taxes through bank transfer.
DB2011 PanamaPanama reduced the corporate income tax rate, modified
various taxes and created a new tax court of appeals.
DB2011 Mexico
Mexico increased taxes on companies by raising several tax
rates, including the corporate income tax and the rate on
cash deposits. At the same time, the administrative burden
was reduced slightly with more options for online payment
and increased use of accounting software.
DB2011 Venezuela, RBRepública Bolivariana de Venezuela abolished the tax on
financial transactions.
DB2010 Venezuela, RBRepública Bolivariana de Venezuela made paying taxes more
costly for companies by introducing 2 new taxes.
DB2010 Peru
Peru made paying taxes easier and less costly for companies
by distributing software for value added tax payments,
reducing the check tax and introducing a new regime of
accelerated depreciation.
DB2010 Mexico
Mexico made paying taxes easier for companies by
introducing electronic payment systems for payroll, property
and social security taxes.
DB2010 Guatemala
Guatemala made paying taxes easier for companies by
expanding the category of businesses for which electronic
filing and payment of value added and corporate income tax
is mandatory and by extending the electronic system to most
banks.
DB2010 BrazilBrazil made paying taxes less costly for companies by
abolishing the tax on check transactions.
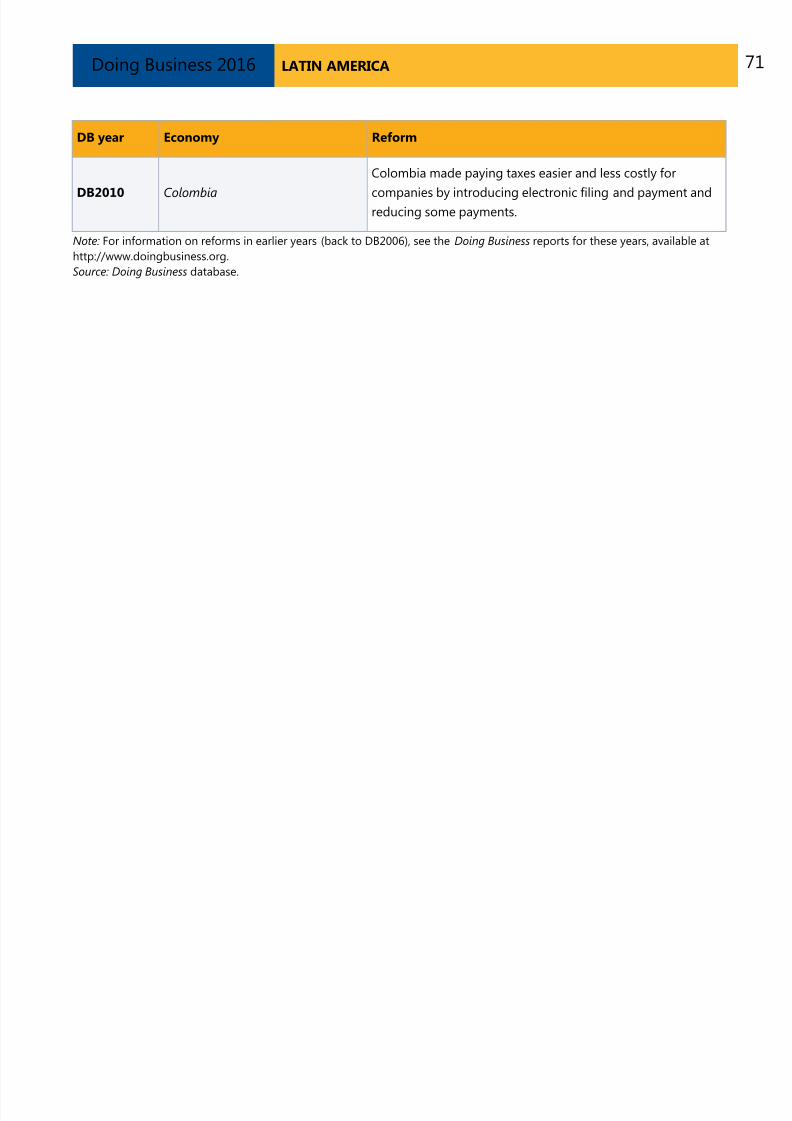
7/24/2019 DB16 Latin America
http://slidepdf.com/reader/full/db16-latin-america 71/101
LATIN AMERICADoing Business 2016
DB year Economy Reform
DB2010 Colombia
Colombia made paying taxes easier and less costly for
companies by introducing electronic filing and payment andreducing some payments.
Note: For information on reforms in earlier years (back to DB2006), see the Doing Business reports for these years, available at
http://www.doingbusiness.org.
Source: Doing Business database.
7/24/2019 DB16 Latin America
http://slidepdf.com/reader/full/db16-latin-america 72/101
LATIN AMERICADoing Business 2016
TRADING ACROSS BORDERSIn today’s globalized world, making trade between
economies easier is increasingly important forbusiness. Excessive document requirements,
burdensome customs procedures, inefficient port
operations and inadequate infrastructure all lead to
extra costs and delays for exporters and importers,
stifling trade potential.
What do the indicators cover?
Doing Business records the time and cost associated
with the logistical process of exporting and
importing goods. Under the new methodology
introduced this year, Doing Business measures the
time and cost (excluding tariffs) associated with threesets of procedures—documentary compliance,
border compliance and domestic transport—within
the overall process of exporting or importing a
shipment of goods. The ranking of economies on the
ease of trading across borders is determined by
sorting their distance to frontier scores for trading
across borders. These scores are the simple average
of the distance to frontier scores for the time and
cost for documentary compliance and border
compliance to export and import.
To make the data comparable across economies, a
few assumptions are made about the traded goods
and the transactions:
Time
Time is measured in hours, and 1 day is 24
hours (for example, 22 days are recorded
as 22 × 24 = 528 hours). If customs
clearance takes 7.5 hours, the data are
recorded as is. Alternatively, suppose that
documents are submitted to a customs
agency at 8:00 a.m., are processedovernight and can be picked up at 8:00
a.m. the next day. In this case the time for
customs clearance would be recorded as
24 hours because the actual procedure
took 24 hours.
WHAT THE TRADING ACROSS BORDERS
INDICATORS MEASURE FOR IMPORT & EXPORT
Documentary compliance – cost (US$) & time
(hours)
Obtain, prepare and submit documents:
-During transport, clearance, inspections andport or border handling in origin economy
-Required by origin, transit and destinationeconomies
Covers all documents by law and in practice
Border compliance – cost (US$) & time
(hours)
Customs clearance and inspections
Inspections by other agencies
Port or border handling
Obtaining, preparing and submittingdocuments during clearance, inspections andport or border handling
Domestic transport*
Loading and unloading of shipmentTransport between warehouse andterminal/port
Transport between terminal/port and border
Obtaining, preparing and submittingdocuments during domestic transport
Traffic delays and road police checks whileshipment is en route
* Although Doing Business collects and publishes data on
the time and cost for domestic transport, it does not use
these data in calculating the distance to frontier score fortrading across borders or the ranking on the ease of trading
across borders.
Cost
Insurance cost and informal payments for
which no receipt is issued are excluded from
the costs recorded. Costs are reported in U.S.
dollars. Contributors are asked to convert
local currency into U.S. dollars based on the
exchange rate prevailing on the day they
answer the questionnaire.

7/24/2019 DB16 Latin America
http://slidepdf.com/reader/full/db16-latin-america 73/101
LATIN AMERICADoing Business 2016
Assumptions of the case study
For each of the 189 economies covered by
Doing Business, it is assumed that a shipment
travels from a warehouse in the largest business
city of the exporting economy to a warehouse
in the largest business city of the importing
economy. For 11 economies the data are also
collected, under the same case study
assumptions, for the second largest business
city.
The import and export case studies assume
different traded products. It is assumed that
each economy imports a standardized shipment
of 15 metric tons of containerized auto parts
(HS 8708) from its natural import partner—the
economy from which it imports the largest value(price times quantity) of auto parts. It is
assumed that each economy exports the
product of its comparative advantage (defined
by the largest export value) to its natural export
partner—the economy that is the largest
purchaser of this product. Precious metal and
gems, live animals and pharmaceuticals are
excluded from the list of possible export
products, however, and the second largest
product category is considered as needed.
To identify the trading partners and exportproduct for each economy, Doing Business
collected data on trade flows for the most
recent four-year period from international
databases such as the United Nations
Commodity Trade Statistics Database (UN
Comtrade). For economies for which trade flow
data were not available, data from ancillary
government sources (various ministries and
departments) and World Bank Group country
offices were used to identify the export product
and natural trading partners.
A shipment is a unit of trade. Export shipments
do not necessarily need to be containerized,
while import shipments of auto parts are
assumed to be containerized.
Shipping cost based on weight is assumed to
be greater than shipping cost based on
volume.
If government fees are determined by the
value of the shipment, the value is assumed
to be $50,000.
The product is new, not secondhand or used
merchandise.
The exporting firm is responsible for hiring
and paying for a freight forwarder or customs
broker (or both) and pays for all costs related
to international shipping, domestic transport,
clearance and mandatory inspections by
customs and other government agencies, portor border handling, documentary compliance
fees and the like for exports. The importing
firm is responsible for the above costs for
imports.
The mode of transport is the one most widely
used for the chosen export or import product
and the trading partner, as is the seaport,
airport or land border crossing.
All electronic submissions of information
requested by any government agency in
connection with the shipment are consideredto be documents obtained, prepared and
submitted during the export or import
process.
A port or border is defined as a place
(seaport, airport or land border crossing)
where merchandise can enter or leave an
economy.
Government agencies considered relevant
are agencies such as customs, port
authorities, road police, border guards,
standardization agencies, ministries or
departments of agriculture or industry,
national security agencies and any other
government authorities.

7/24/2019 DB16 Latin America
http://slidepdf.com/reader/full/db16-latin-america 74/101
LATIN AMERICADoing Business 2016
TRADING ACROSS BORDERS
Where do the region’s economies stand today?
How easy it is for businesses in economies in Latin
America to export and import goods? The global
rankings of these economies on the ease of trading
across borders suggest an answer (figure 9.1). The
average ranking of the region and comparator regions
provide a useful benchmark.
Figure 9.1 How economies in Latin America rank on the ease of trading across borders
Source: Doing Business database.

7/24/2019 DB16 Latin America
http://slidepdf.com/reader/full/db16-latin-america 75/101
LATIN AMERICADoing Business 2016
TRADING ACROSS BORDERS
The indicators reported here are for trading a shipmentof goods by the most widely used mode of transport
(whether sea, land, air or some combination of these).
The information on the time and cost to complete export
and import is collected from local freight forwarders,customs brokers and traders. Comparing these indicators
across the region and with averages both for the region
and for comparator regions can provide useful insights.
Figure 9.2 What it takes to trade across borders in economies in Latin America
Time to export: Border compliance (hours)

7/24/2019 DB16 Latin America
http://slidepdf.com/reader/full/db16-latin-america 76/101
LATIN AMERICADoing Business 2016
TRADING ACROSS BORDERS
Cost to export: Border compliance (USD)
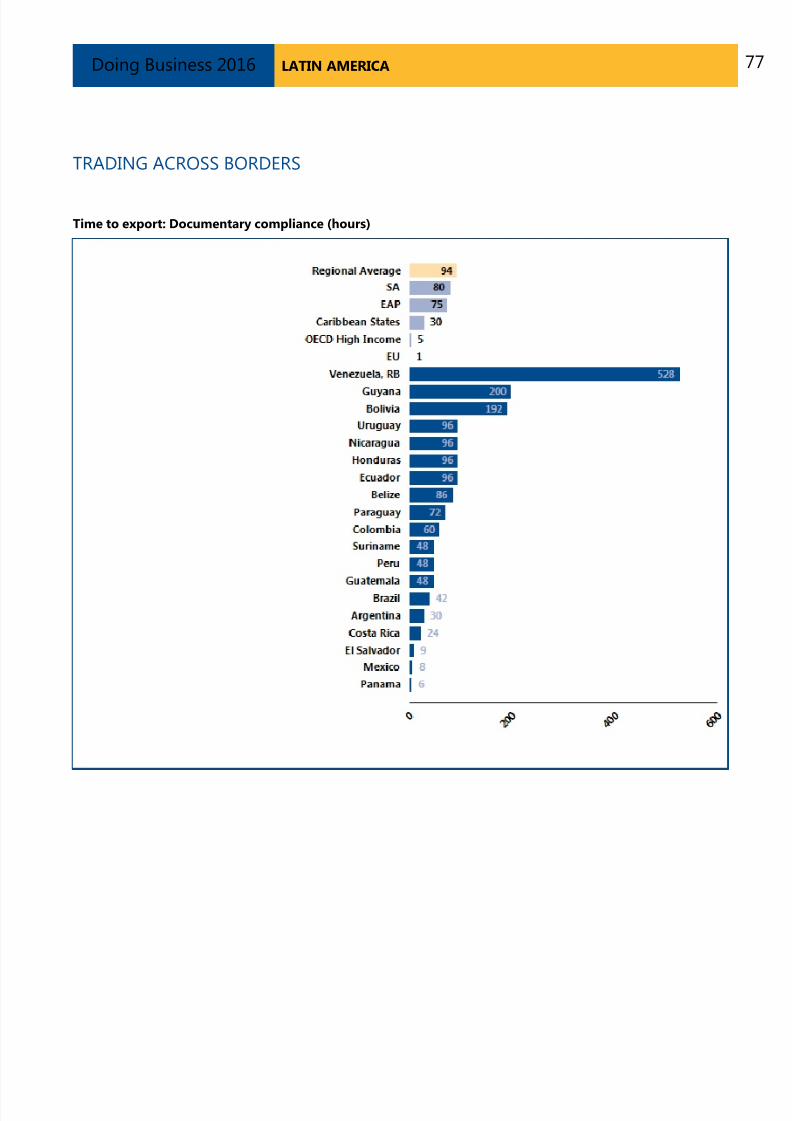
7/24/2019 DB16 Latin America
http://slidepdf.com/reader/full/db16-latin-america 77/101
LATIN AMERICADoing Business 2016
TRADING ACROSS BORDERS
Time to export: Documentary compliance (hours)

7/24/2019 DB16 Latin America
http://slidepdf.com/reader/full/db16-latin-america 78/101
LATIN AMERICADoing Business 2016
TRADING ACROSS BORDERS
Cost to export: Documentary compliance (USD)

7/24/2019 DB16 Latin America
http://slidepdf.com/reader/full/db16-latin-america 79/101
LATIN AMERICADoing Business 2016
TRADING ACROSS BORDERS
Time to import: Border compliance (hours)

7/24/2019 DB16 Latin America
http://slidepdf.com/reader/full/db16-latin-america 80/101
LATIN AMERICADoing Business 2016
TRADING ACROSS BORDERS
Cost to import: Border compliance (USD)

7/24/2019 DB16 Latin America
http://slidepdf.com/reader/full/db16-latin-america 81/101
LATIN AMERICADoing Business 2016
TRADING ACROSS BORDERS
Time to import: Documentary compliance (hours)

7/24/2019 DB16 Latin America
http://slidepdf.com/reader/full/db16-latin-america 82/101
LATIN AMERICADoing Business 2016
TRADING ACROSS BORDERS
Cost to import: Documentary compliance (USD)
Source: Doing Business database.

7/24/2019 DB16 Latin America
http://slidepdf.com/reader/full/db16-latin-america 83/101
LATIN AMERICADoing Business 2016
TRADING ACROSS BORDERS
What are the changes over time?
In economies around the world, trading across borders
as measured by Doing Business has become faster and
easier over the years. Governments have introduced
tools to facilitate trade—including single windows, risk-
based inspections and electronic data interchange
systems. These changes help improve their trading
environment and boost firms’ international
competitiveness. What trade reforms has Doing Business
recorded in Latin America (table 9.1)?
Table 9.1 How have economies in Latin America made trading across borders easier—or not?
By Doing Business report year DB2011 to DB2016
DB year Economy Reform
DB2016 Brazil
Brazil reduced the time for documentary and border
compliance for exporting by implementing the electronic
SISCOMEX Portal system. This reform applies to both Rio de
Janeiro and São Paulo.
DB2016 Guatemala
Guatemala reduced the documentary and border compliance
time for importing by making electronic submission of
documents compulsory and eliminating the need for many
hard-copy documents.
DB2016 El Salvador
El Salvador increased the border compliance time for
exporting and importing by adding an extra, nonintrusive
inspection at the Anguiatú border crossing with Guatemala.
DB2016 Suriname
Suriname reduced the time for documentary and border
compliance for exporting and importing by implementing anautomated customs data management system, ASYCUDA
(Automated System for Customs Data) World.
DB2015 BoliviaBolivia made trading across borders more difficult by
increasing customs clearance time.
DB2015 EcuadorEcuador made trading across borders easier by introducing a
new electronic data interchange system called ECUAPASS.

7/24/2019 DB16 Latin America
http://slidepdf.com/reader/full/db16-latin-america 84/101
LATIN AMERICADoing Business 2016
DB year Economy Reform
DB2015 Uruguay
Uruguay made trading across borders easier by implementing
a risk-based inspection system that reduced customs
clearance time for both exports and imports.
DB2014 ArgentinaArgentina reduced the number of documents necessary for
importing by eliminating nonautomatic license requirements.
DB2014 MexicoMexico made trading across borders easier by implementing
an electronic single-window system.
DB2014 El SalvadorEl Salvador made trading across borders easier by developinga one-stop shop for exporting and by implementing
electronic data interchange systems.
DB2014 UruguayUruguay made trading across borders easier by implementing
an electronic customs declaration system.
DB2013 Argentina
Argentina increased the time, cost and number of documents
needed to import by expanding the list of products requiring
nonautomatic licenses and introducing new preapproval
procedures for all imports.
DB2013 Belize
Belize reduced the time to export and import by
implementing the ASYCUDA World electronic data
interchange system.
DB2013 SurinameSuriname increased the time to export by involving more
customs departments in clearing exports.
DB2013 Uruguay
Uruguay reduced the time to import by improving port
efficiency and introducing electronic payment and
predeclaration systems for customs.
DB2012 Honduras
Honduras made trading across borders faster by
implementing a web-based electronic data interchange
system and X-ray machines at the port of Puerto Cortes.
DB2011 Nicaragua
Nicaragua expedited trade by migrating to a new electronic
data interchange system for customs, setting up a physical
one-stop shop for exports and investing in new equipment at
the port of Corinto.

7/24/2019 DB16 Latin America
http://slidepdf.com/reader/full/db16-latin-america 85/101
LATIN AMERICADoing Business 2016
DB year Economy Reform
DB2011 Guyana
Guyana improved its risk profiling system for customs
inspection, reducing physical inspections of shipments and
the time to trade.
DB2011 Peru
Peru made trading easier by implementing a new web-based
electronic data interchange system, risk-based inspections
and payment deferrals.
DB2010 Paraguay
Paraguay reduced the time required for trading across
borders by implementing an electronic single-window system
for exports and improving the risk-based inspection system.
DB2010 Peru
Peru made trading across borders easier by adding cranes at
the port of Callao and thereby speeding up port and terminal
handling activities.
DB2010 Colombia
Colombia speeded up the customs clearance process by
implementing the electronic data interchange system
MUISCA.
DB2010 Guyana
Guyana reduced the time for exporting and importing by
implementing a system allowing customs brokers to submitdocuments electronically.
Note: For information on reforms in earlier years (back to DB2005), see the Doing Business reports for these years, available at
http://www.doingbusiness.org.
Source: Doing Business database.

7/24/2019 DB16 Latin America
http://slidepdf.com/reader/full/db16-latin-america 86/101
LATIN AMERICADoing Business 2016
ENFORCING CONTRACTSEffective commercial dispute resolution has many
benefits. Courts are essential for entrepreneurs
because they interpret the rules of the market and
protect economic rights. Efficient and transparent
courts encourage new business relationships because
businesses know they can rely on the courts if a new
customer fails to pay. Speedy trials are essential for
small enterprises, which may lack the resources to
stay in business while awaiting the outcome of a long
court dispute.
What do the indicators cover?
Doing Business measures the time and cost for
resolving a standardized commercial dispute through
a local first-instance court. In addition, this year it
introduces a new measure, the quality of judicial
processes index, evaluating whether each economy
has adopted a series of good practices that promote
quality and efficiency in the court system. This new
index replaces the indicator on procedures, which
was eliminated this year. The ranking of economies
on the ease of enforcing contracts is determined by
sorting their distance to frontier scores. These scores
are the simple average of the distance to frontierscores for each of the component indicators
The dispute in the case study involves the breach of a
sales contract between 2 domestic businesses. The
case study assumes that the court hears an expert on
the quality of the goods in dispute. This distinguishes
the case from simple debt enforcement. To make the
data comparable across economies, Doing Business
uses several assumptions about the case:
The dispute concerns a lawful transaction
between two businesses (Seller and Buyer),
both located in the economy’s largestbusiness city. For 11 economies the data
are also collected for the second largest
business city.
The buyer orders custom-made goods,
then fails to pay.
WHAT THE ENFORCING CONTRACTS
INDICATORS MEASURE
Time required to enforce a contract through
the courts (calendar days)
Time to file and serve the case
Time for trial and to obtain the judgment
Time to enforce the judgment
Cost required to enforce a contract through
the courts (% of claim)Attorney fees
Court fees
Enforcement fees
Quality of judicial processes index (0-18)
Court structure and proceedings (0-5)
Case management (0-6)
Court automation (0-4)
Alternative dispute resolution (0-3)
The value of the dispute is 200% of the
income per capita or the equivalent in local
currency of USD 5,000, whichever is greater.
The seller sues the buyer before the court
with jurisdiction over commercial cases worth
200% of income per capita or $5,000.
The seller requests a pretrial attachment to
secure the claim.
The dispute on the quality of the goodsrequires an expert opinion.
The judge decides in favor of the seller; there
is no appeal.
The seller enforces the judgment through a
public sale of the buyer’s movable assets.

7/24/2019 DB16 Latin America
http://slidepdf.com/reader/full/db16-latin-america 87/101
LATIN AMERICADoing Business 2016
ENFORCING CONTRACTS
Where do the region’s economies stand today?
How efficient is the process of resolving a commercial
dispute through the courts in economies in Latin
America? The global rankings of these economies on the
ease of enforcing contracts suggest an answer (figure
10.1). The average ranking of the region and comparator
regions provide a useful benchmark.
Figure 10.1 How economies in Latin America rank on the ease of enforcing contracts
Source: Doing Business database.

7/24/2019 DB16 Latin America
http://slidepdf.com/reader/full/db16-latin-america 88/101
LATIN AMERICADoing Business 2016
ENFORCING CONTRACTS
The indicators underlying the rankings may also berevealing. Data collected by Doing Business show what it
takes to enforce a contract through the courts in each
economy in the region: the time, the cost and quality of
judicial processes index (figure 10.2). Comparing theseindicators across the region and with averages both for
the region and for comparator regions can provide
useful insights.
Figure 10.2 What it takes to enforce a contract through the courts in economies in Latin America
Time (days)

7/24/2019 DB16 Latin America
http://slidepdf.com/reader/full/db16-latin-america 89/101
LATIN AMERICADoing Business 2016
ENFORCING CONTRACTS
Cost (% of claim)
Source: Doing Business database.

7/24/2019 DB16 Latin America
http://slidepdf.com/reader/full/db16-latin-america 90/101
LATIN AMERICADoing Business 2016
ENFORCING CONTRACTS
Quality of Judicial Processes Index (0-18)
Source: Doing Business database.
Note: Higher values indicate more efficient judicial processes.

7/24/2019 DB16 Latin America
http://slidepdf.com/reader/full/db16-latin-america 91/101
LATIN AMERICADoing Business 2016
ENFORCING CONTRACTS
What are the changes over time?
Economies in all regions have improved contract
enforcement in recent years. A judiciary can be improved
in different ways. Higher-income economies tend to look
for ways to enhance efficiency by introducing new
technology. Lower-income economies often work on
reducing backlogs by introducing periodic reviews to
clear inactive cases from the docket and by making
procedures faster. What reforms making it easier (or
more difficult) to enforce contracts has Doing Business
recorded in Latin America (table 10.1)?
Table 10.1 How have economies in Latin America made enforcing contracts easier—or not?
By Doing Business report year DB2011 to DB2016
DB year Economy Reform
DB2015 UruguayUruguay made enforcing contracts easier by simplifying and
speeding up the proceedings for commercial disputes.
DB2014 ColombiaColombia made enforcing contracts easier by simplifying and
speeding up the proceedings for commercial disputes.
DB2014 Mexico
Mexico made enforcing contracts easier by creating small
claims courts, with oral proceedings, that can hear both civil
and commercial cases.
DB2013 Brazil
Brazil made enforcing contracts easier by implementing an
electronic system for filing initial complaints at the São Paulo
civil district court.
DB2012 HondurasHonduras adopted a new civil procedure code that modified
litigation procedures for enforcing a contract.
DB2012 Nicaragua
Nicaragua raised the monetary threshold for commercial
claims that can be brought to the Managua local civil court,
leaving lower-value claims in the local courts, where
proceedings are simpler and faster.
DB2010 Peru
Peru made enforcing contracts easier by introducing
deadlines for filing evidence and contesting enforcement
procedures and by permitting electronic judicial notices in
lieu of publication in the official gazette.
DB2010 Costa Rica
Costa Rica improved its contract enforcement system by
allowing new modes of delivery of service and by simplifying
auction procedures by authorizing the publication of a single
auction notice.
Note: For information on reforms in earlier years (back to DB2005), see the Doing Business reports for these years, available at
http://www.doingbusiness.org.
Source: Doing Business database.

7/24/2019 DB16 Latin America
http://slidepdf.com/reader/full/db16-latin-america 92/101
LATIN AMERICADoing Business 2016
RESOLVING INSOLVENCYA robust bankruptcy system functions as a filter,
ensuring the survival of economically efficient
companies and reallocating the resources of
inefficient ones. Fast and cheap insolvency
proceedings result in the speedy return of businesses
to normal operation and increase returns to
creditors. By clarifying the expectations of creditors
and debtors about the outcome of insolvency
proceedings, well-functioning insolvency systems can
facilitate access to finance, save more viable
businesses and sustainably grow the economy.
What do the indicators cover?Doing Business studies the time, cost and outcome of
insolvency proceedings involving domestic legal
entities. These variables are used to calculate the
recovery rate, which is recorded as cents on the
dollar recovered by secured creditors through
reorganization, liquidation or debt enforcement
(foreclosure or receivership) proceedings. To
determine the present value of the amount
recovered by creditors, Doing Business uses the
lending rates from the International Monetary Fund,
supplemented with data from central banks and theEconomist Intelligence Unit.
In addition, Doing Business evaluates the adequacy
and integrity of the existing legal framework
applicable to liquidation and reorganization
proceedings through the strength of insolvency
framework index. The index tests whether economies
adopted internationally accepted good practices in
four areas: commencement of proceedings,
management of debtor’s assets, reorganization
proceedings and creditor participation.
The ranking of economies on the ease of resolving
insolvency is determined by sorting their distance tofrontier scores for resolving insolvency. These scores
are the simple average of the distance to frontier
scores for the recovery rate and the strength of
insolvency framework index. The Resolving
Insolvency indicator does not measure insolvency
proceedings of individuals and financial institutions.
The data are derived from questionnaire responses
by local insolvency practitioners and verified through
a study of laws and regulations as well as public
information on bankruptcy systems.
WHAT THE RESOLVING INSOLVENCY
INDICATORS MEASURE
Time required to recover debt (years)
Measured in calendar years
Appeals and requests for extension areincluded
Cost required to recover debt (% of debtor’s
estate)
Measured as percentage of estate value
Court fees
Fees of insolvency administrators
Lawyers’ fees
Assessors’ and auctioneers’ fees
Other related fees
Outcome
Whether business continues operating as a
going concern or business assets are soldpiecemeal
Recovery rate for creditors
Measures the cents on the dollar recovered bysecured creditors
Outcome for the business (survival or not)determines the maximum value that can berecovered
Official costs of the insolvency proceedings arededucted
Depreciation of furniture is taken into accountPresent value of debt recovered
Strength of insolvency framework index (0-
16)
Sum of the scores of four component indices:
Commencement of proceedings index (0-3)
Management of debtor’s assets index (0-6)
Reorganization proceedings index (0-3)
Creditor participation index (0-4)
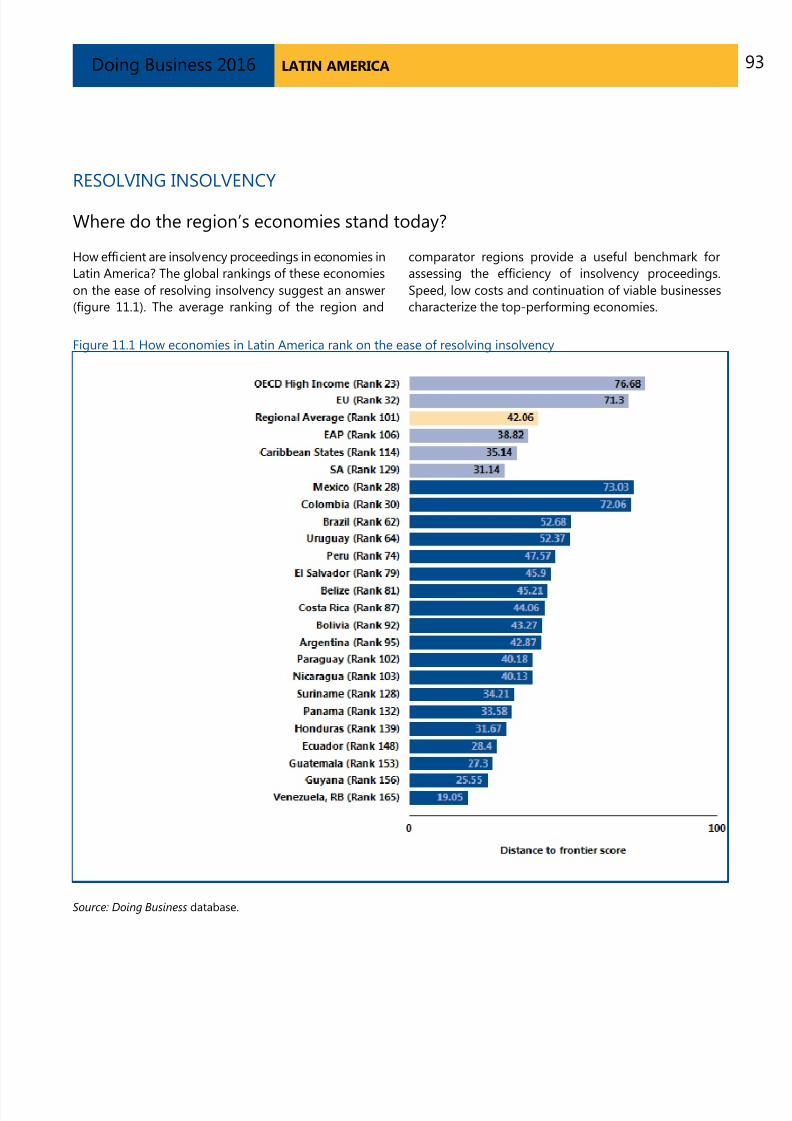
7/24/2019 DB16 Latin America
http://slidepdf.com/reader/full/db16-latin-america 93/101
LATIN AMERICADoing Business 2016
RESOLVING INSOLVENCY
Where do the region’s economies stand today?
How efficient are insolvency proceedings in economies in
Latin America? The global rankings of these economies
on the ease of resolving insolvency suggest an answer
(figure 11.1). The average ranking of the region and
comparator regions provide a useful benchmark for
assessing the efficiency of insolvency proceedings.
Speed, low costs and continuation of viable businesses
characterize the top-performing economies.
Figure 11.1 How economies in Latin America rank on the ease of resolving insolvency
Source: Doing Business database.

7/24/2019 DB16 Latin America
http://slidepdf.com/reader/full/db16-latin-america 94/101
LATIN AMERICADoing Business 2016
RESOLVING INSOLVENCY
The indicators underlying the rankings may be morerevealing. Data collected by Doing Business show the
average recovery rate and the average strength of
insolvency framework index (figure 11.2). Comparing
these indicators across the region and with averagesboth for the region and for comparator regions can
provide useful insights.
Figure 11.2 How efficient is the insolvency process in economies in Latin America
Recovery Rate (0–100)
Source: Doing Business database.

7/24/2019 DB16 Latin America
http://slidepdf.com/reader/full/db16-latin-america 95/101
LATIN AMERICADoing Business 2016
Total Strength of Insolvency Framework index (0-16)
Source: Doing Business database.
* Indicates a “no practice” mark. See the data notes for details. If an economy has no laws or regulations covering a specific
area—for example, insolvency—it receives a “no practice” mark. Similarly, an economy receives a “no practice” or “not possible”
mark if regulation exists but is never used in practice or if a competing regulation prohibits such practice. Either way, a “no
practice” mark puts the economy at the bottom of the ranking on the relevant indicator.Source: Doing Business database.
Note: Higher values indicate insolvency legislation that is better designed for rehabilitating viable firms and liquidating
nonviable ones.

7/24/2019 DB16 Latin America
http://slidepdf.com/reader/full/db16-latin-america 96/101
LATIN AMERICADoing Business 2016
RESOLVING INSOLVENCY
What are the changes over time?
A well-balanced bankruptcy system distinguishes
companies that are financially distressed but
economically viable from inefficient companies that
should be liquidated. But in some insolvency systems
even viable businesses are liquidated. This is starting to
change. Many recent reforms of bankruptcy laws have
been aimed at helping more of the viable businesses
survive. What insolvency reforms has Doing Business
recorded in Latin America (table 11.1)?
Table 11.1 How have economies in Latin America made resolving insolvency easier—or not?
By Doing Business report year DB2011 to DB2016
DB year Economy Reform
DB2015 Mexico
Mexico made resolving insolvency easier by clarifying several
rules, shortening the time extensions allowed during
reorganization, facilitating the electronic submission of
documents and improving the legal rights of creditors and
other parties involved in bankruptcy procedures. This reform
applies to both Mexico City and Monterrey.
DB2012 Colombia
Colombia amended regulations governing insolvency
proceedings to simplify the proceedings and reduce their
time and cost
DB2010 UruguayUruguay improved its insolvency process through a newinsolvency law aimed at keeping a larger number of
financially distressed companies operating as a going
concern.
DB2010 Colombia
Colombia enhanced its insolvency process through several
decrees regulating the profession of insolvency
administrators.
Note: For information on reforms in earlier years (back to DB2005), see the Doing Business reports for these years, available at
http://www.doingbusiness.org.
Source: Doing Business database.
7/24/2019 DB16 Latin America
http://slidepdf.com/reader/full/db16-latin-america 97/101
LATIN AMERICADoing Business 2016
DISTANCE TO FRONTIER AND EASE OF DOING BUSINESS RANKINGDoing Business presents results for two aggregate
measures: the distance to frontier score and the ease of
doing business ranking, which is based on the distance
to frontier score. The ease of doing business ranking
compares economies with one another; the distance to
frontier score benchmarks economies with respect to
regulatory best practice, showing the absolute distance
to the best performance on each Doing Business
indicator. When compared across years, the distance to
frontier score shows how much the regulatory
environment for local entrepreneurs in an economy has
changed over time in absolute terms, while the ease of
doing business ranking can show only how much theregulatory environment has changed relative to that in
other economies.
Distance to Frontier
The distance to frontier score captures the gap between
an economy’s performance and a measure of best
practice across the entire sample of 36 indicators for 10
Doing Business topics (the labor market regulation
indicators are excluded). For starting a business, for
example, the former Yugoslav Republic of Macedonia
and New Zealand have the smallest number of
procedures required (1), and New Zealand the shortesttime to fulfill them (0.5 days). Slovenia has the lowest
cost (0.0), and Australia, Colombia and 103 other
economies have no paid-in minimum capital
requirement (table 14.1 in the Doing Business 2016
report).
Calculation of the distance to frontier score
Calculating the distance to frontier score for each
economy involves two main steps. In the first step
individual component indicators are normalized to a
common unit where each of the 36 component
indicators y (except for the total tax rate) is rescaledusing the linear transformation (worst − y)/(worst −
frontier). In this formulation the frontier represents the
best performance on the indicator across all economies
since 2005 or the third year in which data for the
indicator were collected. Both the best performance and
the worst performance are established every five years
based on the Doing Business data for the year in which
they are established, and remain at that level for the five
years regardless of any changes in data in interim years.
Thus an economy may set the frontier for an indicator
even though it is no longer at the frontier in a
subsequent year.
For scores such as those on the strength of legal rights
index or the quality of land administration index, the
frontier is set at the highest possible value. For the total
tax rate, consistent with the use of a threshold in
calculating the rankings on this indicator, the frontier is
defined as the total tax rate at the 15th percentile of the
overall distribution for all years included in the analysis
up to and including Doing Business 2015. For the time to
pay taxes the frontier is defined as the lowest time
recorded among all economies that levy the three major
taxes: profit tax, labor taxes and mandatorycontributions, and value added tax (VAT) or sales tax. For
the different times to trade across borders, the frontier is
defined as 1 hour even though in many economies the
time is less than that.
In the same formulation, to mitigate the effects of
extreme outliers in the distributions of the rescaled data
for most component indicators (very few economies
need 700 days to complete the procedures to start a
business, but many need 9 days), the worst performance
is calculated after the removal of outliers. The definition
of outliers is based on the distribution for eachcomponent indicator. To simplify the process two rules
were defined: the 95th percentile is used for the
indicators with the most dispersed distributions
(including minimum capital, number of payments to pay
taxes, and the time and cost indicators), and the 99th
percentile is used for number of procedures. No outlier is
removed for component indicators bound by definition
or construction, including legal index scores (such as the
depth of credit information index, extent of conflict of
interest regulation index and strength of insolvency
framework index) and the recovery rate (figure 14.1).
In the second step for calculating the distance to frontier
score, the scores obtained for individual indicators for
each economy are aggregated through simple averaging
into one distance to frontier score, first for each topic
and then across all 10 topics: starting a business, dealing
with construction permits, getting electricity, registering
property, getting credit, protecting minority investors,
paying taxes, trading across borders, enforcing contracts
and resolving insolvency. More complex aggregation
methods—such as principal components and
unobserved components—yield a ranking nearly

7/24/2019 DB16 Latin America
http://slidepdf.com/reader/full/db16-latin-america 98/101
LATIN AMERICADoing Business 2016
identical to the simple average used by Doing Business4.
Thus Doing Business uses the simplest method:
weighting all topics equally and, within each topic, givingequal weight to each of the topic components5.
An economy’s distance to frontier score is indicated on a
scale from 0 to 100, where 0 represents the worst
performance and 100 the frontier. All distance to frontier
calculations are based on a maximum of five decimals.
However, indicator ranking calculations and the ease of
doing business ranking calculations are based on two
decimals.
The difference between an economy’s distance to
frontier score in any previous year and its score in 2015
illustrates the extent to which the economy has closedthe gap to the regulatory frontier over time. And in any
given year the score measures how far an economy is
from the best performance at that time.
Treatment of the total tax rate
The total tax rate component of the paying taxes
indicator set enters the distance to frontier calculation in
a different way than any other indicator. The distance to
frontier score obtained for the total tax rate is
transformed in a nonlinear fashion before it enters the
distance to frontier score for paying taxes. As a result of
the nonlinear transformation, an increase in the total taxrate has a smaller impact on the distance to frontier
score for the total tax rate—and therefore on the
distance to frontier score for paying taxes—for
economies with a below-average total tax rate than it
would have had before this approach was adopted in
Doing Business 2015 (line B is smaller than line A in
figure 14.2 of the Doing Business 2016 report). And for
economies with an extreme total tax rate (a rate that is
very high relative to the average), an increase has a
greater impact on both these distance to frontier scores
4 See Djankov, Manraj and others (2005). Principal components and
unobserved components methods yield a ranking nearly identical to
that from the simple average method because both these methods
assign roughly equal weights to the topics, since the pairwise
correlations among indicators do not differ much. An alternative to the
simple average method is to give different weights to the topics,
depending on which are considered of more or less importance in the
context of a specific economy.5 For getting credit, indicators are weighted proportionally, according
to their contribution to the total score, with a weight of 60% assigned
to the strength of legal rights index and 40% to the depth of credit
information index. Indicators for all other topics are assigned equal
weights
than it would have had before (line D is bigger than line
C in figure 14.2 of the Doing Business 2016 report).
The nonlinear transformation is not based on anyeconomic theory of an “optimal tax rate” that minimizes
distortions or maximizes efficiency in an economy’s
overall tax system. Instead, it is mainly empirical in
nature. The nonlinear transformation along with the
threshold reduces the bias in the indicator toward
economies that do not need to levy significant taxes on
companies like the Doing Business standardized case
study company because they raise public revenue in
other ways—for example, through taxes on foreign
companies, through taxes on sectors other than
manufacturing or from natural resources (all of which are
outside the scope of the methodology). In addition, it
acknowledges the need of economies to collect taxes
from firms.
Calculation of scores for economies with 2 cities
covered
For each of the 11 economies in which Doing Business
collects data for the second largest business city as well
as the largest one, the distance to frontier score is
calculated as the population-weighted average of the
distance to frontier scores for these two cities (table
13.1). This is done for the aggregate score, the scores foreach topic and the scores for all the component
indicators for each topic.

7/24/2019 DB16 Latin America
http://slidepdf.com/reader/full/db16-latin-america 99/101
LATIN AMERICADoing Business 2016
Table 13.1 Weights used in calculating the distance to
frontier scores for economies with 2 cities covered
Source: United Nations, Department of Economic and Social
Affairs, Population Division, World Urbanization Prospects,
2014 Revision. http://esa.un.org/unpd/wup/CD-ROM/Default.aspx.
Economies that improved the most across 3 or more
Doing Business topics in 2014/15
Doing Business 2016 uses a simple method to calculate
which economies improved the ease of doing business
the most. First, it selects the economies that in 2014/15
implemented regulatory reforms making it easier to do
business in 3 or more of the 10 topics included in this
year’s aggregate distance to frontier score. Changesmaking it more difficult to do business are subtracted
from the total number of those making it easier to do
business. Twenty-four economies meet this criterion:
Armenia; Azerbaijan; Benin; Costa Rica; Côte d’Ivoire;
Cyprus; Hong Kong SAR, China; Indonesia; Jamaica;
Kazakhstan; Kenya; Lithuania; Madagascar; Mauritania;
Morocco; Romania; the Russian Federation; Rwanda;
Senegal; Togo; Uganda; the United Arab Emirates;
Uzbekistan; and Vietnam. Second, Doing Business sorts
these economies on the increase in their distance to
frontier score from the previous year using comparable
data.
Selecting the economies that implemented regulatory
reforms in at least three topics and had the biggest
improvements in their distance to frontier scores is
intended to highlight economies with ongoing, broad-
based reform programs. The improvement in the
distance to frontier score is used to identify the top
improvers because this allows a focus on the absolute
improvement—in contrast with the relative improvement
shown by a change in rankings—that economies have
made in their regulatory environment for business.
Ease of Doing Business ranking
The ease of doing business ranking ranges from 1 to 189.
The ranking of economies is determined by sorting the
aggregate distance to frontier scores, rounded to 2
decimals.
Economy City Weight (%)
Dhaka 78
Chittagong 22
São Paulo 61
Rio de Janeiro 39
Shanghai 55
Beijing 45
Mumbai 47
Delhi 53
Jakarta 78
Surabaya 22
Tokyo 65
Osaka 35
Mexico City 83
Monterrey 17
Lagos 77
Kano 23
Karachi 65
Lahore 35
Moscow 70
St. Petersburg 30
New York 60
Los Angeles 40
Mexico
Nigeria
Pakistan
Russian Federation
United States
Japan
Bangladesh
Brazil
China
India
Indonesia

7/24/2019 DB16 Latin America
http://slidepdf.com/reader/full/db16-latin-america 100/101
LATIN AMERICADoing Business 2016
RESOURCES ON THE DOING BUSINESS WEBSITE
Current features
News on the Doing Business project
http://www.doingbusiness.org
Rankings
How economies rank—from 1 to 189
http://www.doingbusiness.org/rankings
Data
All the data for 189 economies—topic rankings,
indicator values, lists of regulatory procedures anddetails underlying indicators
http://www.doingbusiness.org/data
Reports
Access to Doing Business reports as well as
subnational and regional reports, case studies and
customized economy and regional profiles
http://www.doingbusiness.org/reports
MethodologyThe methodologies and research papers underlying
Doing Business
http://www.doingbusiness.org/methodology
Research
Abstracts of papers on Doing Business topics and
related policy issues
http://www.doingbusiness.org/research
Doing Business reforms
Short summaries of DB2016 business regulationreforms and lists of reforms since DB2008
http://www.doingbusiness.org/reforms
Historical data
Customized data sets since DB2004
http://www.doingbusiness.org/custom-query
Law library
Online collection of business laws and regulations
relating to business
http://www.doingbusiness.org/law-library
Contributors
More than 11,400 specialists in 189 economies who
participate in Doing Business
http://www.doingbusiness.org/contributors/doing-
business
Entrepreneurship data
Data on business density (number of newly
registered companies per 1,000 working-age
people) for 136 economies
http://www.doingbusiness.org/data/exploretopics/ent
repreneurship
Distance to frontier
Data benchmarking 189 economies to the frontier
in regulatory practice and a distance to frontiercalculator
http://www.doingbusiness.org/data/distance-to-
frontier
Information on good practices
Showing where the many good practices identified
by Doing Business have been adopted
http://www.doingbusiness.org/data/good-practice

7/24/2019 DB16 Latin America
http://slidepdf.com/reader/full/db16-latin-america 101/101
LATIN AMERICADoing Business 2016