db2 udb/websphere - ibm · pdf fileibm.com/redbooks db2 udb/websphere performance tuning guide...
TRANSCRIPT
ibm.com/redbooks
DB2 UDB/WebSpherePerformance Tuning Guide
Nagraj AlurAmy Falos
Ada LauSvante LindquistMonzy Varghese
Overview of DB2 UDB and WebSphere Application Server architectures
Best practices in tuning a DB2 UDB / WebSphere environment
Problem determination scenarios
Front cover


DB2 UDB/WebSphere Performance Tuning Guide
March 2003
International Technical Support Organization
SG24-6417-01

© Copyright International Business Machines Corporation 2002, 2003. All rights reserved.Note to U.S Government Users – Documentation related to restricted rights – Use, duplication or disclosure is subject torestrictions set forth in GSA ADP Schedule Contract with IBM Corp.
Second Edition (March 2003)
This edition applies to IBM WebSphere Application Server V4.0.5, and IBM DB2 Universal Database V8.1, for use with IBM AIX 4.3.3 and Windows 2000 operating systems.
Comments may be addressed to:IBM Corporation, International Technical Support OrganizationDept. QXXE Building 80-E2650 Harry RoadSan Jose, California 95120-6099
When you send information to IBM, you grant IBM a non-exclusive right to use or distribute the information in any way it believes appropriate without incurring any obligation to you.
Take Note! Before using this information and the product it supports, be sure to read the general information in “Notices” on page xv.

Contents
Figures . . . . . . . . . . . . . . . . . . . . . . . . . . . . . . . . . . . . . . . . . . . . . . . . . . . . . . vii
Tables . . . . . . . . . . . . . . . . . . . . . . . . . . . . . . . . . . . . . . . . . . . . . . . . . . . . . . . . xi
Examples. . . . . . . . . . . . . . . . . . . . . . . . . . . . . . . . . . . . . . . . . . . . . . . . . . . . . xiii
Notices . . . . . . . . . . . . . . . . . . . . . . . . . . . . . . . . . . . . . . . . . . . . . . . . . . . . . . xvTrademarks . . . . . . . . . . . . . . . . . . . . . . . . . . . . . . . . . . . . . . . . . . . . . . . . . . . xvi
Preface . . . . . . . . . . . . . . . . . . . . . . . . . . . . . . . . . . . . . . . . . . . . . . . . . . . . . xviiThe team that wrote this redbook. . . . . . . . . . . . . . . . . . . . . . . . . . . . . . . . . . xviiNotice . . . . . . . . . . . . . . . . . . . . . . . . . . . . . . . . . . . . . . . . . . . . . . . . . . . . . . . . xxiComments welcome. . . . . . . . . . . . . . . . . . . . . . . . . . . . . . . . . . . . . . . . . . . . . xxi
Summary of changes . . . . . . . . . . . . . . . . . . . . . . . . . . . . . . . . . . . . . . . . . . xxiiiMarch 2003, Second Edition . . . . . . . . . . . . . . . . . . . . . . . . . . . . . . . . . . . . . xxiii
Chapter 1. Introduction . . . . . . . . . . . . . . . . . . . . . . . . . . . . . . . . . . . . . . . . . . 11.1 e-business imperatives . . . . . . . . . . . . . . . . . . . . . . . . . . . . . . . . . . . . . . . . 21.2 e-business applications and their workload profiles . . . . . . . . . . . . . . . . . . 4
1.2.1 Publish and subscribe . . . . . . . . . . . . . . . . . . . . . . . . . . . . . . . . . . . . . 61.2.2 Online shopping . . . . . . . . . . . . . . . . . . . . . . . . . . . . . . . . . . . . . . . . . 61.2.3 Customer self-service . . . . . . . . . . . . . . . . . . . . . . . . . . . . . . . . . . . . . 71.2.4 Online trading . . . . . . . . . . . . . . . . . . . . . . . . . . . . . . . . . . . . . . . . . . . 71.2.5 Business-to-business . . . . . . . . . . . . . . . . . . . . . . . . . . . . . . . . . . . . . 7
1.3 e-business infrastructure . . . . . . . . . . . . . . . . . . . . . . . . . . . . . . . . . . . . . . . 81.4 IBM Application Framework for e-business. . . . . . . . . . . . . . . . . . . . . . . . . 91.5 Topology selection criteria. . . . . . . . . . . . . . . . . . . . . . . . . . . . . . . . . . . . . 11
Chapter 2. Overview of WebSphere Application Server V4.0 . . . . . . . . . . 132.1 Introduction . . . . . . . . . . . . . . . . . . . . . . . . . . . . . . . . . . . . . . . . . . . . . . . . 142.2 J2EE overview. . . . . . . . . . . . . . . . . . . . . . . . . . . . . . . . . . . . . . . . . . . . . . 142.3 WebSphere Application Server architecture overview . . . . . . . . . . . . . . . 16
2.3.1 Clients . . . . . . . . . . . . . . . . . . . . . . . . . . . . . . . . . . . . . . . . . . . . . . . . 182.3.2 Web Server(s) . . . . . . . . . . . . . . . . . . . . . . . . . . . . . . . . . . . . . . . . . . 182.3.3 WebSphere Application Server . . . . . . . . . . . . . . . . . . . . . . . . . . . . . 18
2.4 WebSphere application model . . . . . . . . . . . . . . . . . . . . . . . . . . . . . . . . . 282.5 Session management . . . . . . . . . . . . . . . . . . . . . . . . . . . . . . . . . . . . . . . . 29
2.5.1 Choosing a session tracking mechanism . . . . . . . . . . . . . . . . . . . . . 30
© Copyright IBM Corp. 2003 iii

2.5.2 Server affinity . . . . . . . . . . . . . . . . . . . . . . . . . . . . . . . . . . . . . . . . . . 322.5.3 WebSphere Session Manager . . . . . . . . . . . . . . . . . . . . . . . . . . . . . 33
2.6 Typical application flow . . . . . . . . . . . . . . . . . . . . . . . . . . . . . . . . . . . . . . . 342.7 WebSphere Queuing Network. . . . . . . . . . . . . . . . . . . . . . . . . . . . . . . . . . 362.8 Tuning WebSphere Application Server . . . . . . . . . . . . . . . . . . . . . . . . . . . 432.9 Application tuning considerations . . . . . . . . . . . . . . . . . . . . . . . . . . . . . . . 44
2.9.1 Do not store large object graphs in HttpSession . . . . . . . . . . . . . . . . 442.9.2 Release HttpSessions when finished . . . . . . . . . . . . . . . . . . . . . . . . 462.9.3 JSP considerations . . . . . . . . . . . . . . . . . . . . . . . . . . . . . . . . . . . . . . 472.9.4 Do not use SingleThreadModel. . . . . . . . . . . . . . . . . . . . . . . . . . . . . 472.9.5 Minimize synchronization in servlets . . . . . . . . . . . . . . . . . . . . . . . . . 482.9.6 Use the HttpServlet Init method judiciously. . . . . . . . . . . . . . . . . . . . 502.9.7 Avoid String concatenation “+=” . . . . . . . . . . . . . . . . . . . . . . . . . . . . 502.9.8 Minimize uses of System.out.println . . . . . . . . . . . . . . . . . . . . . . . . . 522.9.9 Access EJB entity beans from EJB session beans. . . . . . . . . . . . . . 532.9.10 Reuse EJB homes . . . . . . . . . . . . . . . . . . . . . . . . . . . . . . . . . . . . . 542.9.11 Use JDBC connection pooling . . . . . . . . . . . . . . . . . . . . . . . . . . . . 552.9.12 Reuse datasources for JDBC connections . . . . . . . . . . . . . . . . . . . 562.9.13 Release JDBC resources when done . . . . . . . . . . . . . . . . . . . . . . . 582.9.14 Use Read-Only methods where appropriate. . . . . . . . . . . . . . . . . . 592.9.15 Choose the minimal isolation level that is appropriate . . . . . . . . . . 592.9.16 EJBs and servlets — same JVM — “No Local Copies” . . . . . . . . . 592.9.17 Remove stateful session beans when finished . . . . . . . . . . . . . . . . 612.9.18 Avoid using Beans.instantiate() to create new bean instances. . . . 622.9.19 Ensure that session objects are serializable . . . . . . . . . . . . . . . . . . 63
2.10 System tuning considerations . . . . . . . . . . . . . . . . . . . . . . . . . . . . . . . . . 642.10.1 WebSphere Application Server queues considerations . . . . . . . . . 642.10.2 WebSphere Application Server JVM memory considerations. . . . . 742.10.3 Other considerations . . . . . . . . . . . . . . . . . . . . . . . . . . . . . . . . . . . . 78
2.11 Monitoring and tuning tools . . . . . . . . . . . . . . . . . . . . . . . . . . . . . . . . . . . 862.11.1 PMI . . . . . . . . . . . . . . . . . . . . . . . . . . . . . . . . . . . . . . . . . . . . . . . . . 862.11.2 Resource Analyzer . . . . . . . . . . . . . . . . . . . . . . . . . . . . . . . . . . . . . 872.11.3 Performance monitoring servlet . . . . . . . . . . . . . . . . . . . . . . . . . . . 912.11.4 Logs . . . . . . . . . . . . . . . . . . . . . . . . . . . . . . . . . . . . . . . . . . . . . . . . 912.11.5 Traces . . . . . . . . . . . . . . . . . . . . . . . . . . . . . . . . . . . . . . . . . . . . . . . 922.11.6 Log Analyzer . . . . . . . . . . . . . . . . . . . . . . . . . . . . . . . . . . . . . . . . . . 932.11.7 JVMPI . . . . . . . . . . . . . . . . . . . . . . . . . . . . . . . . . . . . . . . . . . . . . . . 942.11.8 Performance tuner wizard . . . . . . . . . . . . . . . . . . . . . . . . . . . . . . . . 95
Chapter 3. Overview of DB2 UDB 8 . . . . . . . . . . . . . . . . . . . . . . . . . . . . . . . 973.1 Introduction . . . . . . . . . . . . . . . . . . . . . . . . . . . . . . . . . . . . . . . . . . . . . . . . 983.2 DB2 architecture overview . . . . . . . . . . . . . . . . . . . . . . . . . . . . . . . . . . . . 99
3.2.1 DB2 agents . . . . . . . . . . . . . . . . . . . . . . . . . . . . . . . . . . . . . . . . . . . . 99
iv DB2 UDB/WebSphere Application Tuning Guide

3.2.2 Buffer pools . . . . . . . . . . . . . . . . . . . . . . . . . . . . . . . . . . . . . . . . . . . 1033.2.3 Block based buffer pools . . . . . . . . . . . . . . . . . . . . . . . . . . . . . . . . . 1033.2.4 Prefetchers . . . . . . . . . . . . . . . . . . . . . . . . . . . . . . . . . . . . . . . . . . . 1033.2.5 Page cleaners . . . . . . . . . . . . . . . . . . . . . . . . . . . . . . . . . . . . . . . . . 1043.2.6 Logs . . . . . . . . . . . . . . . . . . . . . . . . . . . . . . . . . . . . . . . . . . . . . . . . 1053.2.7 Deadlock detector . . . . . . . . . . . . . . . . . . . . . . . . . . . . . . . . . . . . . . 1053.2.8 Disks . . . . . . . . . . . . . . . . . . . . . . . . . . . . . . . . . . . . . . . . . . . . . . . . 1063.2.9 Threading of Java UDFs and stored procedures . . . . . . . . . . . . . . 106
3.3 Tuning DB2 . . . . . . . . . . . . . . . . . . . . . . . . . . . . . . . . . . . . . . . . . . . . . . . 1073.4 Application tuning considerations . . . . . . . . . . . . . . . . . . . . . . . . . . . . . . 108
3.4.1 Database design . . . . . . . . . . . . . . . . . . . . . . . . . . . . . . . . . . . . . . . 1083.4.2 Efficient SQL . . . . . . . . . . . . . . . . . . . . . . . . . . . . . . . . . . . . . . . . . . 1133.4.3 Concurrency . . . . . . . . . . . . . . . . . . . . . . . . . . . . . . . . . . . . . . . . . . 1153.4.4 Runstats . . . . . . . . . . . . . . . . . . . . . . . . . . . . . . . . . . . . . . . . . . . . . 123
3.5 System tuning considerations . . . . . . . . . . . . . . . . . . . . . . . . . . . . . . . . . 1243.5.1 DB2 memory utilization . . . . . . . . . . . . . . . . . . . . . . . . . . . . . . . . . . 1243.5.2 DB2 64-bit . . . . . . . . . . . . . . . . . . . . . . . . . . . . . . . . . . . . . . . . . . . . 1293.5.3 Configuration parameters . . . . . . . . . . . . . . . . . . . . . . . . . . . . . . . . 130
3.6 Monitoring and tuning tools . . . . . . . . . . . . . . . . . . . . . . . . . . . . . . . . . . . 1403.7 Problem diagnosis introduction . . . . . . . . . . . . . . . . . . . . . . . . . . . . . . . . 144
Chapter 4. WebSphere Application Server and DB2 UDB performance 1474.1 Introduction . . . . . . . . . . . . . . . . . . . . . . . . . . . . . . . . . . . . . . . . . . . . . . . 1484.2 Connection pool . . . . . . . . . . . . . . . . . . . . . . . . . . . . . . . . . . . . . . . . . . . 148
4.2.1 Detailed description. . . . . . . . . . . . . . . . . . . . . . . . . . . . . . . . . . . . . 1494.2.2 Best practices . . . . . . . . . . . . . . . . . . . . . . . . . . . . . . . . . . . . . . . . . 161
4.3 Prepared statement cache . . . . . . . . . . . . . . . . . . . . . . . . . . . . . . . . . . . 1694.3.1 Detailed description. . . . . . . . . . . . . . . . . . . . . . . . . . . . . . . . . . . . . 1724.3.2 Best practices . . . . . . . . . . . . . . . . . . . . . . . . . . . . . . . . . . . . . . . . . 178
4.4 Session database . . . . . . . . . . . . . . . . . . . . . . . . . . . . . . . . . . . . . . . . . . 1804.4.1 Detailed description. . . . . . . . . . . . . . . . . . . . . . . . . . . . . . . . . . . . . 1844.4.2 Best practices . . . . . . . . . . . . . . . . . . . . . . . . . . . . . . . . . . . . . . . . . 195
4.5 Enterprise Java Beans . . . . . . . . . . . . . . . . . . . . . . . . . . . . . . . . . . . . . . 2094.5.1 EJB overview . . . . . . . . . . . . . . . . . . . . . . . . . . . . . . . . . . . . . . . . . 2094.5.2 EJB performance considerations . . . . . . . . . . . . . . . . . . . . . . . . . . 216
Chapter 5. Problem determination scenarios . . . . . . . . . . . . . . . . . . . . . . 2175.1 Introduction . . . . . . . . . . . . . . . . . . . . . . . . . . . . . . . . . . . . . . . . . . . . . . . 2185.2 Exception events scenarios. . . . . . . . . . . . . . . . . . . . . . . . . . . . . . . . . . . 219
5.2.1 Connection pool size. . . . . . . . . . . . . . . . . . . . . . . . . . . . . . . . . . . . 2225.2.2 Concurrency issues. . . . . . . . . . . . . . . . . . . . . . . . . . . . . . . . . . . . . 2515.2.3 Non-serializable objects . . . . . . . . . . . . . . . . . . . . . . . . . . . . . . . . . 301
5.3 Routine monitoring scenarios . . . . . . . . . . . . . . . . . . . . . . . . . . . . . . . . . 312
Contents v

5.3.1 Determining average session object size . . . . . . . . . . . . . . . . . . . . 3145.3.2 100K session object size with persistence . . . . . . . . . . . . . . . . . . . 3155.3.3 100K session object size with local caching . . . . . . . . . . . . . . . . . . 3205.3.4 30K session object size. . . . . . . . . . . . . . . . . . . . . . . . . . . . . . . . . . 325
Appendix A. Sample applications . . . . . . . . . . . . . . . . . . . . . . . . . . . . . . . 331A.1 Trade 2 application . . . . . . . . . . . . . . . . . . . . . . . . . . . . . . . . . . . . . . . . . 332A.2 PiggyBank application. . . . . . . . . . . . . . . . . . . . . . . . . . . . . . . . . . . . . . . 333A.3 WebSphere Performance Tools (WPT) . . . . . . . . . . . . . . . . . . . . . . . . . 334
Appendix B. Sample scripts . . . . . . . . . . . . . . . . . . . . . . . . . . . . . . . . . . . . 335B.1 Connection close servlet. . . . . . . . . . . . . . . . . . . . . . . . . . . . . . . . . . . . . 336B.2 Large session object servlet . . . . . . . . . . . . . . . . . . . . . . . . . . . . . . . . . . 337B.3 SessionInspectServlet.jsp. . . . . . . . . . . . . . . . . . . . . . . . . . . . . . . . . . . . 339
Abbreviations and acronyms . . . . . . . . . . . . . . . . . . . . . . . . . . . . . . . . . . . 345
Related publications . . . . . . . . . . . . . . . . . . . . . . . . . . . . . . . . . . . . . . . . . . 347IBM Redbooks . . . . . . . . . . . . . . . . . . . . . . . . . . . . . . . . . . . . . . . . . . . . . . . . 347
Other resources . . . . . . . . . . . . . . . . . . . . . . . . . . . . . . . . . . . . . . . . . . . . 347Referenced Web sites. . . . . . . . . . . . . . . . . . . . . . . . . . . . . . . . . . . . . . . . 348
How to get IBM Redbooks . . . . . . . . . . . . . . . . . . . . . . . . . . . . . . . . . . . . . . . 349IBM Redbooks collections. . . . . . . . . . . . . . . . . . . . . . . . . . . . . . . . . . . . . 349
Index . . . . . . . . . . . . . . . . . . . . . . . . . . . . . . . . . . . . . . . . . . . . . . . . . . . . . . . 351
vi DB2 UDB/WebSphere Application Tuning Guide

Figures
1-1 Key business processes . . . . . . . . . . . . . . . . . . . . . . . . . . . . . . . . . . . . . 31-2 e-business infrastructure . . . . . . . . . . . . . . . . . . . . . . . . . . . . . . . . . . . . . 81-3 IBM Application Framework for e-business . . . . . . . . . . . . . . . . . . . . . . 102-1 J2EE components . . . . . . . . . . . . . . . . . . . . . . . . . . . . . . . . . . . . . . . . . 152-2 WebSphere Application Server 4.0 in a typical e-business application . 172-3 Server groups and clones . . . . . . . . . . . . . . . . . . . . . . . . . . . . . . . . . . . 222-4 Vertical clones . . . . . . . . . . . . . . . . . . . . . . . . . . . . . . . . . . . . . . . . . . . . 232-5 Horizontal clones . . . . . . . . . . . . . . . . . . . . . . . . . . . . . . . . . . . . . . . . . . 232-6 Types of requests that can be workload managed . . . . . . . . . . . . . . . . 242-7 WebSphere administrative model . . . . . . . . . . . . . . . . . . . . . . . . . . . . . 262-8 WebSphere administrative interfaces . . . . . . . . . . . . . . . . . . . . . . . . . . 282-9 A typical application flow . . . . . . . . . . . . . . . . . . . . . . . . . . . . . . . . . . . . 352-10 WebSphere Queuing Network . . . . . . . . . . . . . . . . . . . . . . . . . . . . . . . . 372-11 Web container queue settings . . . . . . . . . . . . . . . . . . . . . . . . . . . . . . . . 392-12 ORB thread pool size setting . . . . . . . . . . . . . . . . . . . . . . . . . . . . . . . . . 402-13 Resource Analyzer ORB monitoring . . . . . . . . . . . . . . . . . . . . . . . . . . . 412-14 Bounding ORB pool by setting system property . . . . . . . . . . . . . . . . . . 422-15 Datasource connection pooling settings . . . . . . . . . . . . . . . . . . . . . . . . 432-16 JDBC session data alternative . . . . . . . . . . . . . . . . . . . . . . . . . . . . . . . . 452-17 Explicit HttpSession invalidation . . . . . . . . . . . . . . . . . . . . . . . . . . . . . . 462-18 Servlet using single threaded model . . . . . . . . . . . . . . . . . . . . . . . . . . . 482-19 Servlet code using synchronization . . . . . . . . . . . . . . . . . . . . . . . . . . . . 492-20 Servlet code avoiding synchronization. . . . . . . . . . . . . . . . . . . . . . . . . . 492-21 Judicious use of init() method . . . . . . . . . . . . . . . . . . . . . . . . . . . . . . . . 502-22 Poor String concatenation technique . . . . . . . . . . . . . . . . . . . . . . . . . . . 512-23 Correct String concatenation technique. . . . . . . . . . . . . . . . . . . . . . . . . 512-24 Application level tracing . . . . . . . . . . . . . . . . . . . . . . . . . . . . . . . . . . . . . 522-25 Deactivating System.out and System.err . . . . . . . . . . . . . . . . . . . . . . . . 532-26 Accessing entity beans from session beans . . . . . . . . . . . . . . . . . . . . . 542-27 Wrong way to obtain JDBC connections . . . . . . . . . . . . . . . . . . . . . . . . 552-28 Correct way to obtain JDBC connections . . . . . . . . . . . . . . . . . . . . . . . 562-29 Wrong way to acquire a datasource . . . . . . . . . . . . . . . . . . . . . . . . . . . 572-30 Correct way to acquire a datasource . . . . . . . . . . . . . . . . . . . . . . . . . . . 572-31 Pass by reference side effects of “No Local Copies” . . . . . . . . . . . . . . . 602-32 Remove stateful session beans when finished . . . . . . . . . . . . . . . . . . . 612-33 Wrong way to create a new bean instance . . . . . . . . . . . . . . . . . . . . . . 622-34 Correct way to create a new bean instance . . . . . . . . . . . . . . . . . . . . . . 622-35 Minimizing queuing downstream, through upstream queuing . . . . . . . . 66
© Copyright IBM Corp. 2003 vii

2-36 Resource Analyzer summary report with varying number of clients . . . 682-37 Resource Analyzer Web container monitoring. . . . . . . . . . . . . . . . . . . . 692-38 EJB queuing. . . . . . . . . . . . . . . . . . . . . . . . . . . . . . . . . . . . . . . . . . . . . . 702-39 Short lived EJB calls . . . . . . . . . . . . . . . . . . . . . . . . . . . . . . . . . . . . . . . 712-40 Resource Analyzer EJB methods average response time. . . . . . . . . . . 722-41 Resource Analyzer datasource monitoring . . . . . . . . . . . . . . . . . . . . . . 732-42 Resource Analyzer JVM memory monitoring. . . . . . . . . . . . . . . . . . . . . 752-43 Setting isolation level attributes in the Application Assembly Tool . . . . 822-44 Performance monitoring infrastructure. . . . . . . . . . . . . . . . . . . . . . . . . . 872-45 Performance monitoring settings . . . . . . . . . . . . . . . . . . . . . . . . . . . . . . 892-46 Application Server Properties window . . . . . . . . . . . . . . . . . . . . . . . . . . 922-47 Trace window. . . . . . . . . . . . . . . . . . . . . . . . . . . . . . . . . . . . . . . . . . . . . 932-48 Log Analyzer . . . . . . . . . . . . . . . . . . . . . . . . . . . . . . . . . . . . . . . . . . . . . 943-1 DB2 architecture overview . . . . . . . . . . . . . . . . . . . . . . . . . . . . . . . . . . . 993-2 Connection concentrator concept . . . . . . . . . . . . . . . . . . . . . . . . . . . . 1023-3 Lock type compatibility . . . . . . . . . . . . . . . . . . . . . . . . . . . . . . . . . . . . . 1213-4 Illustration of a deadlock scenario . . . . . . . . . . . . . . . . . . . . . . . . . . . . 1223-5 DB2 memory model . . . . . . . . . . . . . . . . . . . . . . . . . . . . . . . . . . . . . . . 1253-6 Database Manager shared memory overview . . . . . . . . . . . . . . . . . . . 1273-7 Database agent/application private/shared memory overview . . . . . . 1283-8 DB2 Control Center . . . . . . . . . . . . . . . . . . . . . . . . . . . . . . . . . . . . . . . 1323-9 Design Advisor Wizard. . . . . . . . . . . . . . . . . . . . . . . . . . . . . . . . . . . . . 1413-10 Configure Performance Wizard . . . . . . . . . . . . . . . . . . . . . . . . . . . . . . 1424-1 A connection pool example . . . . . . . . . . . . . . . . . . . . . . . . . . . . . . . . . 1504-2 General configuration for TRADEDB datasource . . . . . . . . . . . . . . . . 1514-3 Configuring the connection pool for a datasource . . . . . . . . . . . . . . . . 1524-4 Connection object life cycle . . . . . . . . . . . . . . . . . . . . . . . . . . . . . . . . . 1554-5 Connection pool statistics with monitoring level at Maximum . . . . . . . 1664-6 The three options for JDBC statements. . . . . . . . . . . . . . . . . . . . . . . . 1704-7 Prepared Statement Cache: an example. . . . . . . . . . . . . . . . . . . . . . . 1734-8 Setting and changing PCKCACHESZ value . . . . . . . . . . . . . . . . . . . . 1784-9 Session Manager Service — Advanced properties . . . . . . . . . . . . . . . 1804-10 In-memory cache overflow algorithm . . . . . . . . . . . . . . . . . . . . . . . . . . 1814-11 Session manager service — persistence properties . . . . . . . . . . . . . . 1854-12 Configure persistence tuning . . . . . . . . . . . . . . . . . . . . . . . . . . . . . . . . 1864-13 Session manager service — database properties . . . . . . . . . . . . . . . . 1934-14 Use of invalidate() . . . . . . . . . . . . . . . . . . . . . . . . . . . . . . . . . . . . . . . . 1994-15 J2EE containers and components . . . . . . . . . . . . . . . . . . . . . . . . . . . . 2104-16 Types of EJBs . . . . . . . . . . . . . . . . . . . . . . . . . . . . . . . . . . . . . . . . . . . 2114-17 Setting the isolation level in the deployment descriptor . . . . . . . . . . . . 2134-18 Setting access intent of an EJB Method in Application Assembly Tool 2155-1 A typical problem determination methodology . . . . . . . . . . . . . . . . . . . 2205-2 Configuration parameter mismatch scenario environment . . . . . . . . . 223
viii DB2 UDB/WebSphere Application Tuning Guide

5-3 Changing DB2 DIAGLEVEL parameter . . . . . . . . . . . . . . . . . . . . . . . . 2245-4 Setting performance monitoring level on database connection pools . 2255-5 TRADEDB datasource connection pool configuration . . . . . . . . . . . . . 2265-6 Error 500 trying to login to the Trade application . . . . . . . . . . . . . . . . . 2275-7 Output from ps command looking for Java process Trade . . . . . . . . . 2295-8 Issuing a ping on application server Trade . . . . . . . . . . . . . . . . . . . . . 2305-9 Ping confirmation that Trade is running . . . . . . . . . . . . . . . . . . . . . . . . 2305-10 Invoking welcome.jsp to confirm Trade is running . . . . . . . . . . . . . . . . 2315-11 Ping from Application Server (persian) to Database Server (mansel) . 2325-12 Error report from the Application Server (persian) . . . . . . . . . . . . . . . . 2325-13 Errors: Tradestdout.txt file trying to connect to TRADEDB data source2335-14 List applications currently running on database manager . . . . . . . . . . 2345-15 Error SQL1040 in db2diag.log . . . . . . . . . . . . . . . . . . . . . . . . . . . . . . . 2355-16 SQL1040N explanation . . . . . . . . . . . . . . . . . . . . . . . . . . . . . . . . . . . . 2355-17 Error SQL1040 trying to connect to TRADEDB . . . . . . . . . . . . . . . . . . 2365-18 MAXAPPLS value in TRADEDB configuration . . . . . . . . . . . . . . . . . . 2365-19 Changing MAXAPPLS value for TRADEDB . . . . . . . . . . . . . . . . . . . . 2375-20 Monitoring connections and waiting time on data source TRADEDB . 2395-21 Monitoring connection pool after changing max pool size to 50 . . . . . 2415-22 Poor coding techniques – connection pooling scenario environment . 2425-23 Changing the maximum pool size for TRADEDB datasource . . . . . . . 2435-24 Error message about a timeout exception . . . . . . . . . . . . . . . . . . . . . . 2435-25 Pinging mansel from persian . . . . . . . . . . . . . . . . . . . . . . . . . . . . . . . . 2445-26 db2 list applications command. . . . . . . . . . . . . . . . . . . . . . . . . . . . . . . 2455-27 WebSphere Administrative Console Event Messages. . . . . . . . . . . . . 2465-28 WebSphere Administrative Console Event Details . . . . . . . . . . . . . . . 2475-29 Resource Analyzer monitor output. . . . . . . . . . . . . . . . . . . . . . . . . . . . 2485-30 WebSphere stdout log . . . . . . . . . . . . . . . . . . . . . . . . . . . . . . . . . . . . . 2495-31 Resource Analyzer monitor output with connections closed in program2505-32 The user logs in . . . . . . . . . . . . . . . . . . . . . . . . . . . . . . . . . . . . . . . . . . 2525-33 Main menu with the options . . . . . . . . . . . . . . . . . . . . . . . . . . . . . . . . . 2535-34 The user displays his accounts . . . . . . . . . . . . . . . . . . . . . . . . . . . . . . 2545-35 Transfer money between the users different accounts . . . . . . . . . . . . 2555-36 EJB isolation mismatch scenario environment . . . . . . . . . . . . . . . . . . 2565-37 Error message in Web Browser . . . . . . . . . . . . . . . . . . . . . . . . . . . . . . 2585-38 Looking for WebSphere restarting the Application Server . . . . . . . . . . 2595-39 SQL0911: Reason code 2 in WebSphere’s Admin Console . . . . . . . . 2605-40 SQL0911: Reason code 68 in WebSphere’s Admin Console . . . . . . . 2605-41 Corba Transaction_Rolledback error in WebSphere’s Admin Console 2615-42 Snapshot from database focusing on locks. . . . . . . . . . . . . . . . . . . . . 2635-43 List applications . . . . . . . . . . . . . . . . . . . . . . . . . . . . . . . . . . . . . . . . . . 2645-44 DB2 Control Center, list applications . . . . . . . . . . . . . . . . . . . . . . . . . . 2655-45 Current connected applications with status . . . . . . . . . . . . . . . . . . . . . 266
Figures ix

5-46 Application Assembly Tool . . . . . . . . . . . . . . . . . . . . . . . . . . . . . . . . . . 2675-47 Get snapshot for dynamic SQL . . . . . . . . . . . . . . . . . . . . . . . . . . . . . . 2685-48 DB2 Configuration concerning locks . . . . . . . . . . . . . . . . . . . . . . . . . . 2695-49 Explain SQL in DB2 Control Center . . . . . . . . . . . . . . . . . . . . . . . . . . . 2715-50 Explain the SQL statement . . . . . . . . . . . . . . . . . . . . . . . . . . . . . . . . . 2725-51 Result of the visual explain . . . . . . . . . . . . . . . . . . . . . . . . . . . . . . . . . 2735-52 DB2 Control Center, altering a table . . . . . . . . . . . . . . . . . . . . . . . . . . 2745-53 No unique index on table ACCOUNT . . . . . . . . . . . . . . . . . . . . . . . . . 2755-54 Application Assembly Tool . . . . . . . . . . . . . . . . . . . . . . . . . . . . . . . . . . 2765-55 Runstats in DB2 Control Center. . . . . . . . . . . . . . . . . . . . . . . . . . . . . . 2795-56 Visual Explain with the SQL explained again. . . . . . . . . . . . . . . . . . . . 2805-57 Getting stock quotes in Trade . . . . . . . . . . . . . . . . . . . . . . . . . . . . . . . 2825-58 EJB Access Intent scenario environment . . . . . . . . . . . . . . . . . . . . . . 2835-59 Turning on the snapshot monitor in DB2 . . . . . . . . . . . . . . . . . . . . . . . 2865-60 db2 get snapshot for database | grep -i lock . . . . . . . . . . . . . . . . . . . . 2875-61 Resource Analyzer. . . . . . . . . . . . . . . . . . . . . . . . . . . . . . . . . . . . . . . . 2885-62 Creating the event monitor and turning it on . . . . . . . . . . . . . . . . . . . . 2895-63 Flushing the event monitor and format it to a report using db2evmon. 2895-64 Application Assembly Tool — method extensions . . . . . . . . . . . . . . . . 2945-65 Application Assembly Tool, browsing individual EJB methods . . . . . . 2955-66 Setting the findByPrimaryKey method to read only . . . . . . . . . . . . . . . 2965-67 Tab of Generate code for the deployment . . . . . . . . . . . . . . . . . . . . . . 2975-68 Generate code for deployment . . . . . . . . . . . . . . . . . . . . . . . . . . . . . . 2985-69 DB2 snapshot for locks on the database . . . . . . . . . . . . . . . . . . . . . . . 3005-70 Initial screen of the shopping cart application . . . . . . . . . . . . . . . . . . . 3025-71 Saved shopping cart information . . . . . . . . . . . . . . . . . . . . . . . . . . . . . 3035-72 Non-serializable object scenario environment . . . . . . . . . . . . . . . . . . . 3045-73 Verifying Session Manager Service persistence setting . . . . . . . . . . . 3075-74 Invalidation timeout value . . . . . . . . . . . . . . . . . . . . . . . . . . . . . . . . . . 3085-75 Number of sessions created . . . . . . . . . . . . . . . . . . . . . . . . . . . . . . . . 3095-76 Stdout log contents showing non-serializable object . . . . . . . . . . . . . . 3105-77 SessionInspectServlet output . . . . . . . . . . . . . . . . . . . . . . . . . . . . . . . 3125-78 100K session object configuration . . . . . . . . . . . . . . . . . . . . . . . . . . . . 3165-79 100K session object with persistence . . . . . . . . . . . . . . . . . . . . . . . . . 3175-80 100K session object – no persistence – no overflow . . . . . . . . . . . . . . 3195-81 100K session object – no persistence – memory exceptions . . . . . . . 3195-82 100K session object – local caching with overflow . . . . . . . . . . . . . . . 3225-83 100K session object with persistence . . . . . . . . . . . . . . . . . . . . . . . . . 3245-84 30K session object with persistence – 4KDB2 row size . . . . . . . . . . . 3265-85 30K session object; persistence – 32K DB2 row size . . . . . . . . . . . . . 3295-86 Trade 2 application . . . . . . . . . . . . . . . . . . . . . . . . . . . . . . . . . . . . . . . 3325-87 PiggyBank high-level application architecture . . . . . . . . . . . . . . . . . . . 333
x DB2 UDB/WebSphere Application Tuning Guide

Tables
1-1 Web site classification and workload patterns . . . . . . . . . . . . . . . . . . . . 51-2 Topology selection criteria . . . . . . . . . . . . . . . . . . . . . . . . . . . . . . . . . . . 112-1 EJB and DB2 Isolation levels . . . . . . . . . . . . . . . . . . . . . . . . . . . . . . . . . 823-1 Lock modes shown in order of increasing control over resources . . . . 1163-2 Summary of different isolation levels . . . . . . . . . . . . . . . . . . . . . . . . . . 1203-3 Translation between Java and DB2 Isolation Levels . . . . . . . . . . . . . . 1203-4 Database Manager configuration parameter examples . . . . . . . . . . . . 1313-5 Database configuration parameter examples . . . . . . . . . . . . . . . . . . . 1334-1 Write contents vs. write frequency . . . . . . . . . . . . . . . . . . . . . . . . . . . . 1904-2 Choosing persistence options . . . . . . . . . . . . . . . . . . . . . . . . . . . . . . . 1994-3 Simplified multi-row session representation. . . . . . . . . . . . . . . . . . . . . 2044-4 Single versus multi-row schemas . . . . . . . . . . . . . . . . . . . . . . . . . . . . 2055-1 Configuration parameter mismatch scenario monitor level settings. . . 2235-2 EJB isolation mismatch scenario monitor settings. . . . . . . . . . . . . . . . 2575-3 EJB Access Intent scenario monitor settings . . . . . . . . . . . . . . . . . . . . 2845-4 Non-serializable objects scenario monitor level settings . . . . . . . . . . . 304
© Copyright IBM Corp. 2003 xi

xii DB2 UDB/WebSphere Application Tuning Guide
Examples
2-1 Releasing JDBC resources . . . . . . . . . . . . . . . . . . . . . . . . . . . . . . . . . . 582-2 java.io.Serializable for persistent sessions — wrong way . . . . . . . . . . . 632-3 java.io.Serializable for persistent sessions — right way . . . . . . . . . . . . 632-4 Storing session references in an attribute — wrong way. . . . . . . . . . . . 632-5 Storing session references in an attribute — right way . . . . . . . . . . . . . 643-1 Snapshot for buffer pools . . . . . . . . . . . . . . . . . . . . . . . . . . . . . . . . . . . 1384-1 Test sample . . . . . . . . . . . . . . . . . . . . . . . . . . . . . . . . . . . . . . . . . . . . . 1764-2 Query IBMSession . . . . . . . . . . . . . . . . . . . . . . . . . . . . . . . . . . . . . . . . 1824-3 Directive to stop a JSP updating the session last accessed time . . . . 2034-4 Number and average size of persistent session objects . . . . . . . . . . . 2085-1 The startstress.bat script . . . . . . . . . . . . . . . . . . . . . . . . . . . . . . . . . . . 2265-2 Error message SQL0911N, Reason code “2” . . . . . . . . . . . . . . . . . . . 2615-3 Explanation of the SQL0911N error message . . . . . . . . . . . . . . . . . . . 2615-4 Using db2diag.log – lock escalation. . . . . . . . . . . . . . . . . . . . . . . . . . . 2705-5 Using db2diag.log – deadlock . . . . . . . . . . . . . . . . . . . . . . . . . . . . . . . 2705-6 Using upd-monswitch.db2 - script to turn on snapshot monitoring . . . 2865-7 Create event monitor . . . . . . . . . . . . . . . . . . . . . . . . . . . . . . . . . . . . . . 2895-8 First statement event entry . . . . . . . . . . . . . . . . . . . . . . . . . . . . . . . . . 2905-9 Second statement event . . . . . . . . . . . . . . . . . . . . . . . . . . . . . . . . . . . 2915-10 Third statement event . . . . . . . . . . . . . . . . . . . . . . . . . . . . . . . . . . . . . 2925-11 Transaction event . . . . . . . . . . . . . . . . . . . . . . . . . . . . . . . . . . . . . . . . 2935-12 First statement event . . . . . . . . . . . . . . . . . . . . . . . . . . . . . . . . . . . . . . 2995-13 The transaction event . . . . . . . . . . . . . . . . . . . . . . . . . . . . . . . . . . . . . 3005-14 Number and average size of persistent session objects . . . . . . . . . . . 3145-15 Results of 100K session object with persistence . . . . . . . . . . . . . . . . . 3175-16 100K session object with no persistence . . . . . . . . . . . . . . . . . . . . . . . 3185-17 100K session object – local caching with overflow . . . . . . . . . . . . . . . 3215-18 100K session object – local caching with overflow – response times . 3215-19 100K session object – with persistence . . . . . . . . . . . . . . . . . . . . . . . . 3235-20 100K session object – with persistence – response times. . . . . . . . . . 3245-21 30K session object with persistence – 4KDB2 row size . . . . . . . . . . . 3265-22 30K session object; persistence – 4K DB2 row size – buffer pool stats3275-23 30K session object; persistence – 32K DB2 row size . . . . . . . . . . . . . 3295-24 30K session object; persistence – 32 DB2 row size – buffer pool stats3305-25 TestServlet – connection close problem . . . . . . . . . . . . . . . . . . . . . . . 3365-26 SessionTestServlet.java – for creating large session objects . . . . . . . 3375-27 SessionInspectServlet.jsp . . . . . . . . . . . . . . . . . . . . . . . . . . . . . . . . . . 340
© Copyright IBM Corp. 2003 xiii

xiv DB2 UDB/WebSphere Application Tuning Guide

Notices
This information was developed for products and services offered in the U.S.A.
IBM may not offer the products, services, or features discussed in this document in other countries. Consult your local IBM representative for information on the products and services currently available in your area. Any reference to an IBM product, program, or service is not intended to state or imply that only that IBM product, program, or service may be used. Any functionally equivalent product, program, or service that does not infringe any IBM intellectual property right may be used instead. However, it is the user's responsibility to evaluate and verify the operation of any non-IBM product, program, or service.
IBM may have patents or pending patent applications covering subject matter described in this document. The furnishing of this document does not give you any license to these patents. You can send license inquiries, in writing, to: IBM Director of Licensing, IBM Corporation, North Castle Drive Armonk, NY 10504-1785 U.S.A.
The following paragraph does not apply to the United Kingdom or any other country where such provisions are inconsistent with local law: INTERNATIONAL BUSINESS MACHINES CORPORATION PROVIDES THIS PUBLICATION "AS IS" WITHOUT WARRANTY OF ANY KIND, EITHER EXPRESS OR IMPLIED, INCLUDING, BUT NOT LIMITED TO, THE IMPLIED WARRANTIES OF NON-INFRINGEMENT, MERCHANTABILITY OR FITNESS FOR A PARTICULAR PURPOSE. Some states do not allow disclaimer of express or implied warranties in certain transactions, therefore, this statement may not apply to you.
This information could include technical inaccuracies or typographical errors. Changes are periodically made to the information herein; these changes will be incorporated in new editions of the publication. IBM may make improvements and/or changes in the product(s) and/or the program(s) described in this publication at any time without notice.
Any references in this information to non-IBM Web sites are provided for convenience only and do not in any manner serve as an endorsement of those Web sites. The materials at those Web sites are not part of the materials for this IBM product and use of those Web sites is at your own risk.
IBM may use or distribute any of the information you supply in any way it believes appropriate without incurring any obligation to you.
Information concerning non-IBM products was obtained from the suppliers of those products, their published announcements or other publicly available sources. IBM has not tested those products and cannot confirm the accuracy of performance, compatibility or any other claims related to non-IBM products. Questions on the capabilities of non-IBM products should be addressed to the suppliers of those products.
This information contains examples of data and reports used in daily business operations. To illustrate them as completely as possible, the examples include the names of individuals, companies, brands, and products. All of these names are fictitious and any similarity to the names and addresses used by an actual business enterprise is entirely coincidental.
COPYRIGHT LICENSE: This information contains sample application programs in source language, which illustrates programming techniques on various operating platforms. You may copy, modify, and distribute these sample programs in any form without payment to IBM, for the purposes of developing, using, marketing or distributing application programs conforming to the application programming interface for the operating platform for which the sample programs are written. These examples have not been thoroughly tested under all conditions. IBM, therefore, cannot guarantee or imply reliability, serviceability, or function of these programs. You may copy, modify, and distribute these sample programs in any form without payment to IBM for the purposes of developing, using, marketing, or distributing application programs conforming to IBM's application programming interfaces.
© Copyright IBM Corp. 2003 xv

TrademarksThe following terms are trademarks of the International Business Machines Corporation in the United States, other countries, or both:
AFP™AFS®AIX®AlphaWorks®CICS®Database 2™DB2®DB2 Universal Database™Domino™EtherJet™Everyplace™Home Director™
Hummingbird®IBM®IBM eServer™IMS™Informix™iSeries™Lotus®MQSeries®OS/390®OS/400®PC 300®Redbooks™
Redbooks(logo)™RS/6000®S/390®SecureWay®SP™TXSeries™VisualAge®WebSphere®Word Pro®z/OS™zSeries™
The following terms are trademarks of other companies:
ActionMedia, LANDesk, MMX, Pentium and ProShare are trademarks of Intel Corporation in the United States, other countries, or both.
Microsoft, Windows, Windows NT, and the Windows logo are trademarks of Microsoft Corporation in the United States, other countries, or both.
Java and all Java-based trademarks and logos are trademarks or registered trademarks of Sun Microsystems, Inc. in the United States, other countries, or both.
C-bus is a trademark of Corollary, Inc. in the United States, other countries, or both.
UNIX is a registered trademark of The Open Group in the United States and other countries.
SET, SET Secure Electronic Transaction, and the SET Logo are trademarks owned by SET Secure Electronic Transaction LLC.
Other company, product, and service names may be trademarks or service marks of others.
xvi DB2 UDB/WebSphere Application Tuning Guide

Preface
This IBM Redbook will help you develop, monitor, and tune DB2 UDB/ WebSphere Application Server (WAS) based applications in the UNIX and Windows environments.
This book is organized as follows:
� Chapter 1 describes the architecture of the e-business environment, the IBM e-business framework and its components, the topologies involved, and the workload profile of different types of e-business applications. It discusses a taxonomy for e-business applications, and provides guidelines for the selection of a particular topology.
� Chapter 2 describes the key components of WAS, their key performance indicators, tuning parameters, monitoring tools, and suggests best practices for optimal performance. Both application and system considerations are discussed.
� Chapter 3 describes the key components of DB2 UDB, their key performance indicators, tuning parameters, and monitoring tools, and suggests best practices for optimal performance. Both application and system considerations are discussed.
� Chapter 4 describes the key components that will impact the performance of WAS/DB2 UDB applications such as connection pooling, session management, and locking. As before, both application and system considerations are discussed.
� Chapter 5 discusses some commonly encountered performance problems in a WAS/DB2 UDB environment, and describes scenarios for identifying and resolving such problems.
� Appendix A describes the applications used in the problem scenarios.
� Appendix B includes scripts and sample code used in the various problem determination scenarios.
The team that wrote this redbookThis redbook was produced by a team of specialists from around the world working at the International Technical Support Organization, San Jose Center.
© Copyright IBM Corp. 2003 xvii

From left to right: Nagraj Alur, Svante Lindquist, Ada Lau, Monzy Varghese
Nagraj Alur is a Project Leader with the IBM International Technical Support Organization, San Jose Center. He has more than 28 years of experience in DBMSs, and has been a programmer, systems analyst, project leader, consultant, and researcher. His areas of expertise include DBMSs, data warehousing, distributed systems management, and database performance, as well as client/server and Internet computing. He has written extensively on these subjects and has taught classes and presented at conferences all around the world. Before joining the ITSO in November 2001, he was on a 2-year assignment from the Software Group to the IBM Almaden Research Center, where he worked on Data Links solutions and an eSourcing prototype.
Amy Falos is a Senior Software Engineer for Solutions Development in IBM US. She has more than 10 years experience in RDBMS and has been a programmer, systems analyst, technical project leader, consultant and software engineer. Her areas of expertise include RDBMS, database performance, AIX/UNIX performance, and application performance benchmarking in multi-tier environments and WebSphere.
xviii DB2 UDB/WebSphere Application Tuning Guide

Ada Lau is a Systems Software Specialist for ITS in IBM Peru. She has 6 years of experience in DB2 family products, and has been working on WebSphere and DB2 projects in the field for the past 2 years. She holds a degree in Industrial Engineering from Universidad de Lima. Her areas of expertise include DBMSs, data warehousing, database performance, and WebSphere implementation and tuning. She has participated in the implementation of a number of WebSphere and DB2 sites at customer locations in Peru.
Svante Lindquist is an Advisory Software Specialist, working for the Data Management division of IBM Software Sweden as a technical sales specialist. He has been working with DB2 for 4 years. His areas of expertise include DB2 performance on the UNIX platform, and WebSphere.
Monzy Varghese is an e-business Analyst with Ontrack Solutions Pvt Ltd, Mumbai, India. He has 8 years of experience in Information Technology, and has worked as a programmer, analyst, and ERP consultant. He holds a Bachelor of Commerce degree from Bombay University, and an Advanced Diploma in Systems Management. He is a Sun Certified Java Programmer, and an IBM Certified Specialist for WebSphere Application Server. His areas of expertise include Java, WebSphere application development, and client/server applications using DB2. He has been working on WebSphere and DB2 for the past 2 years. His major focus is on DB2/WebSphere integration.
We would like to thank the following people for their significant contributions to this project:
Christof BornhoevdC. MohanRamani Ranjan RoutrayIBM Almaden Research Center
Harold HallIBM Silicon Valley Laboratory
Yongli AnAdrian ChanGeorge BaklarzPeter HeGrant HutchisonTsz Kin Tony LauIBM Toronto Laboratory
Preface xix

Tom AlcottGennaro CuomoHarvey GuntherSrinivas HastiAlbert LeeMelissa ModjeskiMatthew Weaver
Kenichiroh UenoIBM WebSphere development and support
Richard NesbittIBM Raleigh
Torsten SteinbachtIBM Germany
Tetsuya ShiraiIBM Japan
Emma JacobsYvonne LyonDeanna PolmUeli WahliIBM International Technical Support Center, San Jose
We borrowed heavily for the material in this redbook from a number of redbooks, whitepapers, and presentations on DB2 UDB and WebSphere. Most of these sources are identified in “Related publications” on page 347, and we acknowledge the authors of these documents for their contribution.
In particular, we would like to acknowledge the very significant contributions of the following:
� Harvey W. Gunther, for his white paper WebSphere Application Server Development Best Practices for Performance and Scalability that can be found at http://www.ibm.com/software/webservers/appserv/ws_bestpractices.pdf
� Gennaro Cuomo, for his white paper IBM WebSphere Application Server 4.0 Performance Tuning Methodology that can be found at http://www.ibm.com/software/webservers/appserv/doc/v40/ws_40_tuning.pdf
� Deb Ericson, Shawn Lauzon, and Melissa Modjeski, for their white paper on WebSphere Connection Pooling that can be found at http://www.ibm.com/software/webservers/appserv/whitepapers/connection_pool.pdf
xx DB2 UDB/WebSphere Application Tuning Guide

� Authors of the IBM WebSphere V4.0 Advanced Edition Handbook, SG24-6176, and WebSphere Version 4 Application Development Handbook, SG24-6134.
NoticeThis publication is intended to help DB2 UDB application developers and database administrators (DBA) responsible for applications involving WebSphere Application Server and DB2 UDB.
� Application developers will be advised on best practices for achieving optimal performance in such environments.
� DBAs will be advised on best practices for configuring such environments for optimal performance, and will be guided on monitoring and problem determination considerations involving commonly occurring problems.
The information in this publication is not intended as the specification of any programming interfaces that are provided by DB2 UDB Version 8, and WebSphere Application Server Version 4. See the PUBLICATIONS section of the IBM Programming Announcement for DB2 UDB Version 8, and WebSphere Application Server Version 4 for more information about what publications are considered to be product documentation.
Comments welcomeYour comments are important to us!
We want our Redbooks to be as helpful as possible. Send us your comments about this or other Redbooks in one of the following ways:
� Use the online Contact us review redbook form found at:
ibm.com/redbooks
� Send your comments in an Internet note to:
� Mail your comments to the address on page ii.
Preface xxi

xxii DB2 UDB/WebSphere Application Tuning Guide
Summary of changes
This section describes the technical changes made in this edition of the book and in previous editions. This edition may also include minor corrections and editorial changes that are not identified.
Summary of Changesfor SG24-6417-00for DB2 UDB/WebSphere Performance Tuning Guideas created or updated on August 2000.
March 2003, Second EditionThis revision reflects the addition, deletion, or modification of new and changed information described below.
New information� One new problem determination scenario has been added to reflect a
java.io.Serializable problem. This scenario was generated in a WebSphere Application Serve 4.0.5 and DB2 UDB Version 8.1 environment.
� Appendix B, “Sample scripts” on page 335 includes a section describing the SessionInspectServlet used in one of the new scenarios.
Changed information� Updated Chapter 3, “Overview of DB2 UDB 8” on page 97 to reflect DB2 UDB
Version 8 features.
� Clarified and rectified descriptions of connection pooling and session database in Chapter 4, “WebSphere Application Server and DB2 UDB performance” on page 147.
Note: We reran the earlier scenarios described in the book under DB2 UDB Version 8 and WebSphere Application Server 4.0.5, but found no discernible differences in the results. Therefore, we left the write-up of the earlier scenarios untouched.
© Copyright IBM Corp. 2003 xxiii

xxiv DB2 UDB/WebSphere Application Tuning Guide
Chapter 1. Introduction
In this chapter, we describe e-business imperatives that are driving demand for an architecture and framework that can deliver advanced scalability and performance. We briefly describe IBM’s Application Framework for e-business, and identify IBM WebSphere Application Server (WAS) and IBM DB2 UDB as key products for laying a solid foundation for e-business solutions. We also discuss selection criteria for choosing a particular topology based on workload profiles of different e-business applications.
The topics covered include:� e-business imperatives� e-business applications and their workload profiles� e-business infrastructure � IBM Application Framework for e-business� Topology selection criteria
1
© Copyright IBM Corp. 2003 1

1.1 e-business imperativesWe are all aware of the rapidly changing business environment in which we work and live, and the impact it has on business and information technology (IT). We recognize that an organization can no longer dictate systems or clients, that the Internet cannot be controlled, and that downtime will impact more than employee productivity.
To survive and thrive in such an environment, organizations must adapt and innovate — business as usual could be a recipe for disaster. The cycle of product conception to market and return on investment (ROI) time frames are getting shorter and shorter. More so than ever before, the following issues are imperative for businesses. They must:
� Become more responsive to customers needs, since abundant, loyal and profitable customers form the core of successful businesses.
� Reduce costs by streamlining and transforming business processes, and improving the productivity and efficiency of its employees, business partners, and customers. While reducing costs is a perennial favorite that is generally characterized by stops and starts — it now takes on a new urgency.
� Pursue every possible channel (such as the Internet), to exploit emerging opportunities. This is critical in a world of stiff competition, and very short product cycles from conception to implementation to ROI.
Businesses have to transform key processes to address the business imperative, and IT organizations must play a key role in assisting and leading the effort in every way possible, while coping with the impact of the changing business environment including:
� Added heterogeneity of hardware/software/skills� Added geographic distribution of resources and site autonomy� Severe skills shortages� A diverse and growing user community
Key business processes that can be transformed are shown in Figure 1-1, and include these areas:
� Customer Relationship Management: This has to do with identifying, understanding, anticipating, and satisfying customer needs — building loyalty through improved customer satisfaction.
� e-commerce: This is a new channel for an organization's goods and services to a whole wider global market.
� Supply chain: This has to do with inter-company business processes — improving the efficiency (and reducing costs) of interactions with suppliers, partners, distributors, customers, etc.
2 DB2 UDB/WebSphere Application Tuning Guide

� Enterprise Resource Planning (ERP): This involves managing the bread-and-butter processes of an organization including planning, manufacturing, inventory, shipping/distribution, accounting and human resources.
� Workgroup collaboration: This relates to the sharing of resources and information amongst an organization’s employees — such as E-mail, meetings, document sharing, etc. Field Force Automation improves the productivity of employees in the field (salesman, technical support/maintenance persons, and delivery personnel) and improves customer satisfaction and responsiveness.
� Business Intelligence: This has to do with gaining a competitive advantage through the collection and analysis of business information from a multitude of internal and external sources.
� Knowledge management: This implies combining and matching information and personnel skills to great effect.
Figure 1-1 Key business processes
Chapter 1. Introduction 3

When an organization connects its business critical systems directly to key constituencies such as customers, employees, and supplier/distributors, it transforms the organization, and becomes an e-business.
1.2 e-business applications and their workload profilesThe foundation of a high performance e-business solution is knowledge of the application workload, since it has a significant impact on the choice of the technical infrastructure for availability, scalability, and performance. This includes knowledge of user behavior against the Web site — whether they are performing online shopping, banking, trading or just browsing.
You can find the investigations of IBM’s High Volume Web Site Team at:
http://ibm.com/websphere/developer/zones/hvws
This team has identified sites with similar patterns, and classified them into five site types, each with distinct workload patterns and corresponding Web site classifications as follows:
� Publish and subscribe� Customer self-service� Online trading� Online shopping� Business-to-business
Table 1-1 summarizes the characteristics of these categories, and supplies a brief description of each category.
Important: The infrastructure required to support these requirements must address the mission critical requirements of business applications, such as scalability, availability, performance and security.
4 DB2 UDB/WebSphere Application Tuning Guide

Table 1-1 Web site classification and workload patterns
Categories/ Examples
Publish & Subscribe
Online Shopping Customer Self-Service
Online Trading B2B
Search engines
MediaEvents
Exact inventory
Inexact inventory
Home banking
Package tracking
Travel arrangements
Online stock trading
Auctions
eProcurement
Content Dynamic change of the layout of a page, based on changes in content, or need.
Many page authors and page layout changes frequently.
High volume, non-user specific access.
Fairly static information sources
Catalog either flat (parts catalog) or dynamic (items change frequently near real time).
Few page authors and page layout changes less frequently.
User specific information: user profiles with data mining.
Data is in legacy applications
Multiple data sources, requirement for consistency
Extremely time sensitive
High volatility
Multiple suppliers, multiple consumers
Transactions are complex and interact with back end
Data is in legacy applications
Multiple data sources, requirement for consistency
Transactions are complex
Security Low Privacy, non-repudiation, integrity, authentication, regulations
Privacy, non-repudiation, integrity, authentication, regulations (Banking); Low for others
Privacy, non-repudiation, integrity, authentication, regulations
Privacy, non-repudiation, integrity, authentication, regulations
Percent secure pages
Low Medium Medium High Medium
Cross-section Info No High Yes Yes Yes
Searches Structured by category
Totally dynamic
Low volume
Structured by category
Totally dynamic
High volume
Structured by category
Low volume
Structured by category
Low volume
Structured by category
Low to moderate volume
Unique Items High Low to medium Low Low to Medium Moderate
Data Volatility Low Low Low High Moderate
Volume of transactions
Low Moderate to High Moderate and growing
High to very High (Very large swings in volume)
Moderate to Low
Legacy / Integration/ Complexity
Low Medium High High High
Page Views High to Very High Moderate to High Moderate to Low Moderate to High Moderate
Chapter 1. Introduction 5

1.2.1 Publish and subscribeSuch sites provide users with information. Sample publish/subscribe Web sites include search engines, media sites (such as weather.com and numerous newspapers and magazines), as well as event sites such as those for the Olympics and the Wimbledon championships.
Characteristics of such applications are that site content changes frequently, driving changes to page layouts. While search traffic is low in volume, the number of unique items sought is high, resulting in the largest number of page views of all site types.
As an example, using IBM’s WebSphere Edge Server, the Sydney Olympics site successfully handled a peak volume of 1.2 million hits per minute, while the Wimbledon 2000 site successfully handled a peak volume of 430,000 hits per minute. The Wimbledon 2001 site handled 208.5 million page views, three times the number of the 2001 site, as well as almost twice the number of unique users.
Security considerations are minor compared to other site types. Data volatility is low. This type of Web site processes the fewest transactions, and has little or no connection to legacy systems.
1.2.2 Online shopping Such sites let users browse and buy. Sample Web sites include typical retail sites where users buy books, clothes, and even cars.
Characteristics of such applications are that site content can be relatively static, such as a parts catalog, or dynamic where items are frequently added and deleted (for example, promotions and special discounts that come and go). Search traffic is heavier than the publish/subscribe site, though the number of unique items sought is not as large. Data volatility is low. Transaction traffic is moderate to high, and almost always grows.
The typical daily volumes for many large retail customers running on IBM’s WebSphere Commerce Suite range from less than one million hits per day to over 50 million hits per day. Transactions range from 100,000 transactions per day to three million transactions per day for the higher-volume sites. Typically, 1% and 5% are buy transactions.
Security concerns are significant and include privacy, non-repudiation, integrity, authentication, and regulations. Shopping sites have more connections to legacy systems (such as fulfillment systems), than the publish/subscribe sites, but generally less than the other site types.
6 DB2 UDB/WebSphere Application Tuning Guide

1.2.3 Customer self-service Such sites let users help themselves. Sample sites include banking from home, tracking packages, and making travel arrangements. Home banking customers typically review their balances, transfer funds, and pay bills. Data comes largely from legacy applications, and often comes from multiple sources, thereby exposing data consistency.
Security considerations are significant for home banking and purchasing travel services, less so for other uses. Search traffic is low volume; transaction traffic is moderate, but growing rapidly.
1.2.4 Online trading Such sites let users buy and sell. Of all site types, trading sites have the most volatile content, the highest transaction volumes (with significant swing), the most complex transactions, and are extremely time sensitive. Auction sites are characterized by highly dynamic bidding against items with predictable life times. Products like IBM’s WebSphere Application Server have the performance features that enable these sites to meet customer demand. Trading sites are tightly connected to the legacy systems. Nearly all transactions interact with the back end servers.
Security considerations are high, equivalent to online shopping, with an even larger number of secure pages. Search traffic is low volume.
1.2.5 Business-to-businessSuch sites let businesses buy from and sell to each other. These sites include dynamic programmatic links between arms-length businesses, where a trading partner agreement might be appropriate. One business is able to discover another business with which it may want to initiate transactions such as supply chain management (SCM).
Data comes largely from legacy applications and often comes from multiple sources, thereby exposing data consistency. Security requirements are equivalent to online shopping. Transaction volume is moderate, but growing; transactions are typically complex, connecting multiple suppliers and distributors. Such e-business solutions tend to be high volume and growing, serving dynamic data, and processing transactions.
Other considerations in the business-to-business area include transaction complexity, data volatility, and security.
Chapter 1. Introduction 7

1.3 e-business infrastructureFigure 1-2 shows a typical e-business infrastructure that includes billions of pervasive devices connecting to content or data or transactions through potential intermediate layers of edge servers, Web servers, application servers, messaging servers, directory and security servers, and database servers.
Figure 1-2 e-business infrastructure
Several requirements can be considered critical to supporting such an e-business infrastructure. They include:
� Standards-base: To ensure portability of e-business applications across multiple client and server platforms and to improve flexibility and time to market.
� Server-centric: To allow e-business applications to be developed and deployed quickly, to expand access to a broad range of client types, and to offer improved management and deployment capabilities that are characteristic of modern e-business applications.
� Scalable: To allow e-business applications to handle highly variable and unpredictable loads in today's Web environment.
Directory
& Security
Services
Web
Services
Asynchronous
Messging
EDGE
SERVERS
Web
Application
Servers
Web
Application
Servers
DataServersData
Servers
DataServers
Partners&
Supplies
Customers&
PervasiveDevices
ConnectedBrokers
*e-Markets
DataServers
TransactionServers
8 DB2 UDB/WebSphere Application Tuning Guide

� Available: To address the global nature of the Web, which requires e-business applications to run 24-hours a day, seven-days a week, with guaranteed quality of service.
� Secure: To address customers', suppliers', and other constituents' demands for secure Web interactions, in recognition of the potential risks of doing business on the Web.
� Easy to develop and deploy: To achieve lower costs and faster time to market.
� Manageable: To achieve lower maintenance costs and contribute to higher availability.
� Able to leverage and extend existing assets: To improve time to market and reduce cost of development and deployment, while improving security, reliability, and scalability.
1.4 IBM Application Framework for e-businessIBM Framework for e-business is at the core of the IBM e-business software strategy, and is designed to help customers build, run, and manage successful e-business applications. It is a set of recommendations and products to develop an e-business application.
The IBM Application Framework for e-business consists of:
� A standards-based foundation that enables multi-platform and multi-vendor solutions. The IBM deliverable here is commitment to embrace and advance industry standards.
� An easy-to-understand approach in developing applications that are specially tuned to run in this environment. IBM offers a design, development, and deployment model based on industry-specific patterns that guide you through the process.
� State-of-the-art software and scalable servers that allow you to build and run e-business applications.
Chapter 1. Introduction 9

The IBM Application Framework products are divided into three pillars, as shown in Figure 1-3.
Figure 1-3 IBM Application Framework for e-business
The Development Tools and Components pillar includes products such as:
� WebSphere Studio family� The Visual Age family� Lotus Domino Designer� WebSphere Business Components
The Application Servers and Integration Software pillar includes products such as:
� DB2 Universal Database (DB2 UDB)� WebSphere Application Server (WAS)� WebSphere MQ-Series� Lotus Domino
The Secure Network and Management Software pillar includes products such as:
� Tivoli Security products� Tivoli Systems Management portfolio
Attention: This redbook will only focus on WebSphere Application Server and DB2 UDB.
DevelopmentTools and
Components
Application Servers and Integration
Software
Secure Networkand Management
Software
10 DB2 UDB/WebSphere Application Tuning Guide
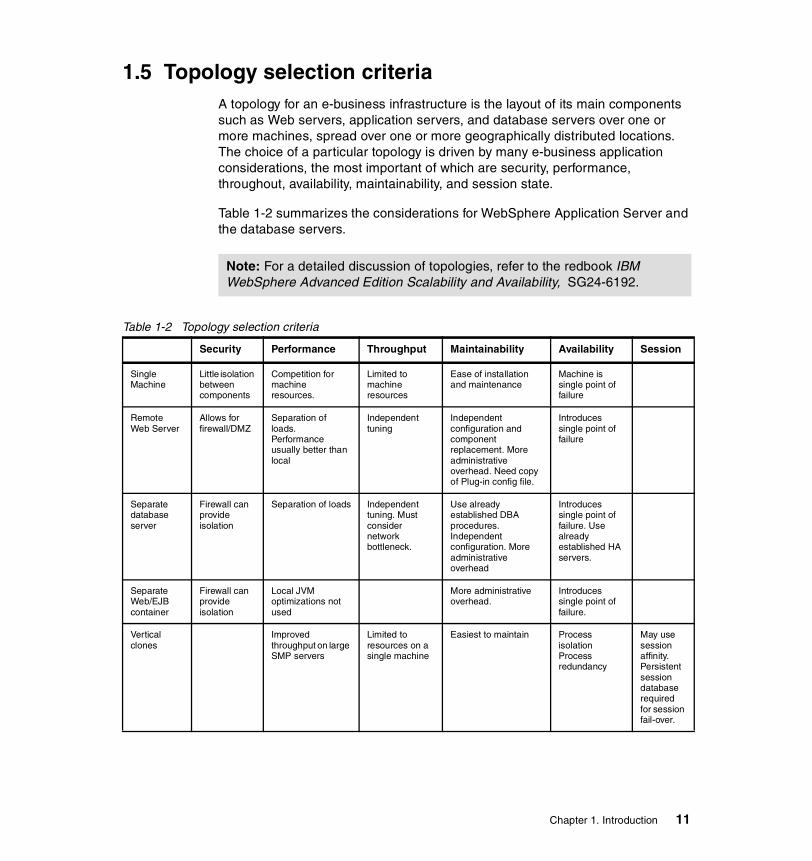
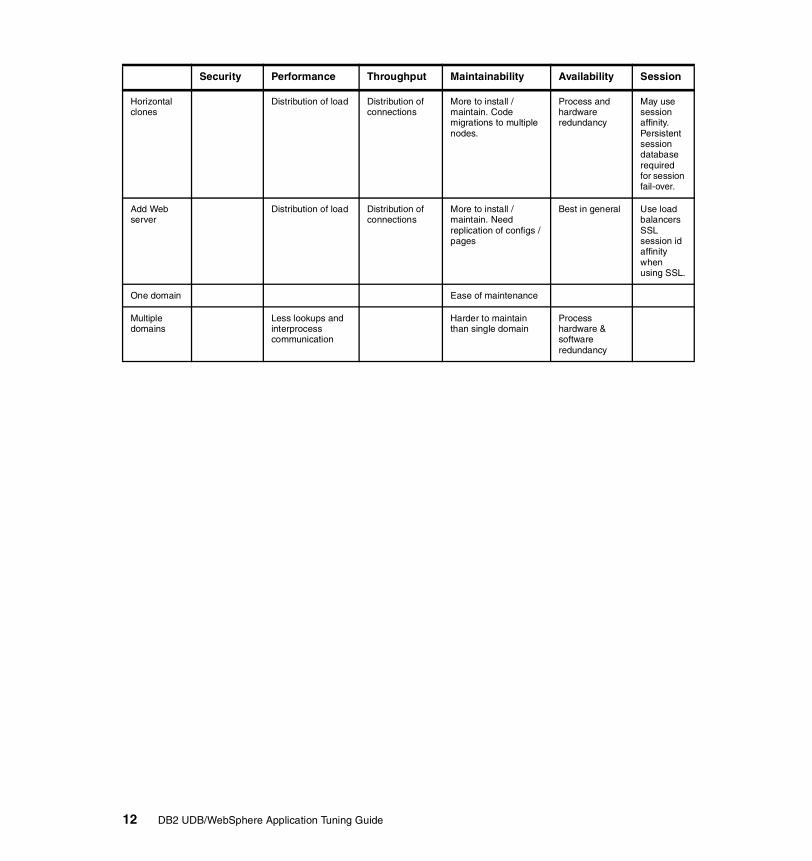
1.5 Topology selection criteriaA topology for an e-business infrastructure is the layout of its main components such as Web servers, application servers, and database servers over one or more machines, spread over one or more geographically distributed locations. The choice of a particular topology is driven by many e-business application considerations, the most important of which are security, performance, throughout, availability, maintainability, and session state.
Table 1-2 summarizes the considerations for WebSphere Application Server and the database servers.
Table 1-2 Topology selection criteria
Note: For a detailed discussion of topologies, refer to the redbook IBM WebSphere Advanced Edition Scalability and Availability, SG24-6192.
Security Performance Throughput Maintainability Availability Session
Single Machine
Little isolation between components
Competition for machine resources.
Limited to machine resources
Ease of installation and maintenance
Machine is single point of failure
Remote Web Server
Allows for firewall/DMZ
Separation of loads.Performance usually better than local
Independent tuning
Independent configuration and component replacement. More administrative overhead. Need copy of Plug-in config file.
Introduces single point of failure
Separate database server
Firewall can provide isolation
Separation of loads Independent tuning. Must consider network bottleneck.
Use already established DBA procedures. Independent configuration. More administrative overhead
Introduces single point of failure. Use already established HA servers.
Separate Web/EJB container
Firewall can provide isolation
Local JVM optimizations not used
More administrative overhead.
Introduces single point of failure.
Vertical clones
Improved throughput on large SMP servers
Limited to resources on a single machine
Easiest to maintain Process isolationProcess redundancy
May use session affinity. Persistent session database required for session fail-over.
Chapter 1. Introduction 11
Horizontal clones
Distribution of load Distribution of connections
More to install / maintain. Code migrations to multiple nodes.
Process and hardware redundancy
May use session affinity.Persistent session database required for session fail-over.
Add Web server
Distribution of load Distribution of connections
More to install / maintain. Need replication of configs / pages
Best in general Use load balancers SSL session id affinity when using SSL.
One domain Ease of maintenance
Multiple domains
Less lookups and interprocess communication
Harder to maintain than single domain
Process hardware & software redundancy
Security Performance Throughput Maintainability Availability Session
12 DB2 UDB/WebSphere Application Tuning Guide
Chapter 2. Overview of WebSphere Application Server V4.0
In this chapter, we provide an overview of the architecture of WebSphere Application Server (WAS) and its main components, and introduce some of its key application tuning, and system tuning parameters. We also describe some of the monitoring tools available. Readers are strongly urged to consult other documentation identified in “Related publications” on page 347 for specific details on tuning a WebSphere Application Server environment.
The topics covered include:
� Introduction� J2EE overview� WebSphere Application Server architecture overview� WebSphere Application Server application model� Session management� Typical application flow� WebSphere Application Server Queueing Network� Tuning WebSphere Application Server� Application tuning considerations� System tuning considerations� Monitoring and tuning tools
2
© Copyright IBM Corp. 2003 13

2.1 IntroductionWebSphere Application Server is a fully compatible implementation of the Java 2 Platform Enterprise Edition (J2EE) platform described in the J2EE overview.
WebSphere Application Server is leading the way in its support of industry open standards. Besides its full J2EE compliance with a rich set of enterprise Java open standards implementations, it also provides built in support for key Web services open standards, making it production ready for the deployment of enterprise Web services solutions.
2.2 J2EE overviewJ2EE defines the standard for architecting, developing, and deploying multi-tier, server-based applications. The J2EE architecture comprises the following elements:
� Standard application model is used for developing multi-tier applications.
� Standard platform is used for hosting applications.
� Compatibility test suite is used for verifying that J2EE platform products comply with the J2EE platform standard.
� Reference Implementation software is a J2EE software development kit (SDK) that is a non-commercial operational definition of the J2EE platform and specification that is made freely available by Sun Microsystems for demonstrations, prototyping, and educational use. It comes with the J2EE application server, Web server, relational database, J2EE APIs, and a complete set of development and deployment tools.
Attention: This chapter is aimed at database professionals who are either totally unfamiliar, or only mildly familiar, with WebSphere Application Server architecture. The objective here is to provide a level set for the WebSphere Application Server/DB2 UDB tuning and problem determination scenarios that are discussed in Chapter 4, “WebSphere Application Server and DB2 UDB performance” on page 147, and Chapter 5, “Problem determination scenarios” on page 217.
14 DB2 UDB/WebSphere Application Tuning Guide
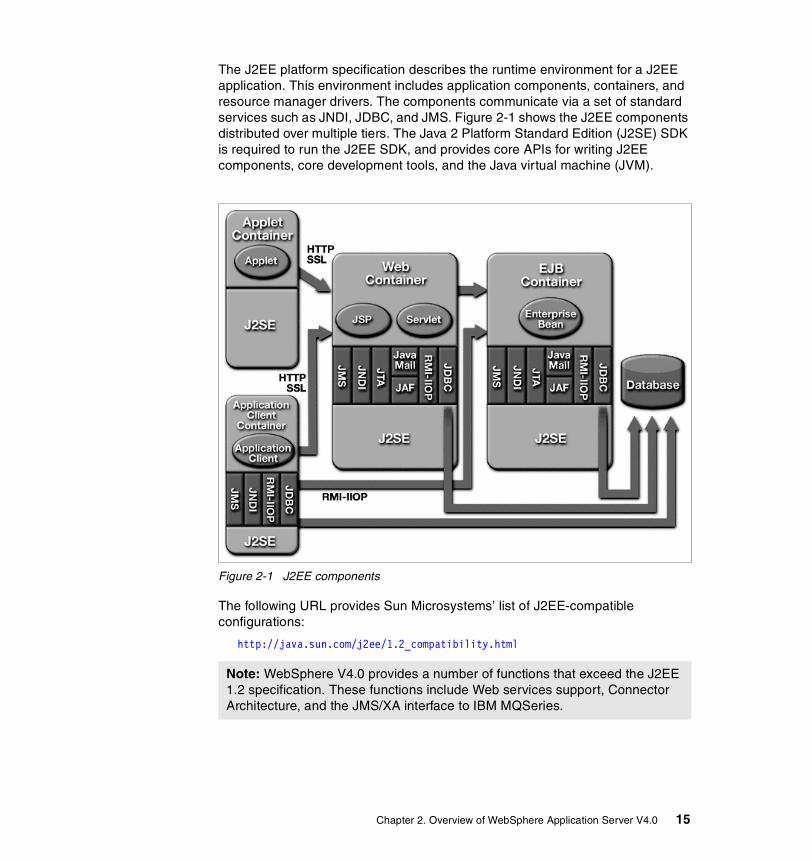
The J2EE platform specification describes the runtime environment for a J2EE application. This environment includes application components, containers, and resource manager drivers. The components communicate via a set of standard services such as JNDI, JDBC, and JMS. Figure 2-1 shows the J2EE components distributed over multiple tiers. The Java 2 Platform Standard Edition (J2SE) SDK is required to run the J2EE SDK, and provides core APIs for writing J2EE components, core development tools, and the Java virtual machine (JVM).
Figure 2-1 J2EE components
The following URL provides Sun Microsystems’ list of J2EE-compatible configurations:
http://java.sun.com/j2ee/1.2_compatibility.html
Note: WebSphere V4.0 provides a number of functions that exceed the J2EE 1.2 specification. These functions include Web services support, Connector Architecture, and the JMS/XA interface to IBM MQSeries.
Chapter 2. Overview of WebSphere Application Server V4.0 15

2.3 WebSphere Application Server architecture overviewAs mentioned, WebSphere Application Server is a comprehensive, Java technology based Web application server that provides integrated support for key Web services open standards, and full J2EE compatibility.
WebSphere Application Server provides the core software to deploy, integrate, and manage e-business applications. WebSphere Application Server supports custom-built applications based on integrated WebSphere platform products1, or on other third party products. Such applications can range from dynamic Web content presentation to sophisticated transaction processing systems.
WebSphere Application Server V4.0 represents a move to a single code base that is supported on virtually all major platforms. The flexible and scalable configurations available with this version allow you to respond to the changing marketplace, without migrating to a different technology base.
With WebSphere Application Server V4.0, Advanced Edition (AE), three different configurations are available:
� The full configuration (AE) provides application server functionality with strong integration to databases, message-oriented middleware, and legacy systems and applications, along with clustering support. This configuration appeals to businesses that need to build highly transactional, manageable, available, and scalable applications that offer distributed security and remote administration.
� The Single Server configuration (AEs) provides application server functionality within a single runtime process. This configuration appeals to businesses that need to build stand-alone, or departmental applications that are transaction or message-oriented, and that don't require failure bypass, workload management, or remote administration.
� The Developer license (AEd) provides application server functionality to developers who need an easy-to-use environment for building and testing e-business applications. It appeals to developers who are looking for a friendly and powerful unit testing environment, especially one that is seamlessly integrated with IBM's tooling.
WebSphere Application Server V4.0, Enterprise Extensions (EE) extends WebSphere Application Server V4.0, Advanced Edition. It includes IBM TXSeries technology to meet the most sophisticated needs of rapidly evolving, highly distributed e-business infrastructures. WebSphere Application Server V4.0 EE extends the Java programming model and provides additional qualities of service.
1 You can visit http://www.ibm.com/websphere for information about these products and solutions.
16 DB2 UDB/WebSphere Application Tuning Guide

Figure 2-2 positions WebSphere Application Server in a typical e-business application environment that includes the following components:
� Clients� Web server(s)� WebSphere Application Server� Application databases
Figure 2-2 WebSphere Application Server 4.0 in a typical e-business application
Attention: Our focus here is on the WebSphere Application Server runtime environment only. Readers interested in WebSphere Application Server application development may want to look at WebSphere Version 4 Application Development Handbook, SG24-6134.
Attention: Visit the following Web site for the latest information on WebSphere Application Server:
http://www.ibm.com/software/webservers/appserv/
WebSphere Application Server
Application Server (JVM)
EJB Container
EnterpriseBean
DrAdmin
XMLConfig
WebSphere Control Program(WSCP)
Java Admin Console
Java client application
plug-in
plugin-cfg.xml
Web browser
client
Web Server
HTTP(s)
HTTP(s)
IIOP
IIOP Admin Server (JVM)
Administrativerepository
Applicationdatabase
Web Container
Servlet
JSP
Embedded HTTP Server
Chapter 2. Overview of WebSphere Application Server V4.0 17

A brief description of these components follows.
2.3.1 ClientsThere are two broad categories of clients:
� Browser-based clients: Clients of applications that run on the WebSphere V4.0 generally run in Java-enabled browsers. They send and receive information from a Web server by using HTTP. Browser-based clients or Web clients, can include applets and JavaServer Pages (JSP). Such clients constitute the majority of WebSphere users today.
� Java clients: These are stand-alone Java programs (GUI-based or not), that use Java RMI/IIOP facilities to make direct method invocations on various EJB objects within an application server, without going through an intervening Web server and servlet.
2.3.2 Web Server(s) Except for stand-alone Java applets, which are restricted by built-in Java security, browser-based client applications require that a Web server be installed on at least one machine in the WebSphere Application Server environment. The Web server provides the communications link between browser-based applications and the other components of WebSphere Application Server.
WebSphere Application Server supports many of the most widely used Web servers such as Apache Server, Microsoft Internet Information Server, iPlanet Web Server and Lotus Domino Enterprise Server. The IBM HTTP Server, which is a modified version of the Apache server, comes with the WebSphere Application Server V4.0, Advanced Edition.
2.3.3 WebSphere Application ServerWebSphere Application Server consists of a number of components, as follows:
� Web server plug-in� Embedded HTTP server� Application server(s)� WebSphere administrative model
A brief description of these components follows.
18 DB2 UDB/WebSphere Application Tuning Guide

Web server plug-inThe Web server or HTTP server plug-in is the component that enables communication between the HTTP server and application server. The plug-in uses an easy-to-read XML configuration file plugin-cfg.xml to determine whether a request should be handled by the Web server or the application server. It communicates with the application server via HTTP transport protocol for non-secure transports, and it can be configured to use HTTPS for secure transports.
The WebSphere plug-in can be configured via the administrative console. The WebSphere plug-in can also be configured in three additional ways:
� Automatically during the WebSphere installation process� Set up as a custom service each time the application server is started� Using the GenPluginCfg command
Embedded HTTP serverThere is now an embedded HTTP server within WebSphere Application Server. This Web server is very useful for testing purposes, but should not be used in production environments.
Application serversApplication servers extend a Web server's capability to handle Web application requests. The application server makes it possible for a server to generate a dynamic, customized response to a client request.
Application code such as servlets, JSPs, EJBs and their supporting classes run in an application server. In keeping with the J2EE component architecture, servlets and JSPs run in a Web container, and EJBs run in an EJB container.
In WebSphere Application Server Advanced Edition, you can define multiple application servers, each running in its own Java Virtual Machine (JVM2). The administrative server runs in its own JVM.
Important: The transport protocols used in previous versions of WebSphere, Servlet Redirector and OSE Remote, have been removed in WebSphere Application Server V4.0.
Note: For performance and security reasons, use a Web server and Web server plug-in for a production environment.
2 A JVM is an interpretive computing engine responsible for executing the byte codes in a compiled Java program. The JVM translates the Java byte codes into the native instructions of the host machine. The application server, being a Java process, requires a JVM in order to run, and to support the Java applications running on it.
Chapter 2. Overview of WebSphere Application Server V4.0 19

A default application server named “Default Server” is automatically configured during the default WebSphere Application Server installation.
The “Default Server”, like any other application server, contains a Web container and an EJB container.
� Web containers:
A Web container handles requests for servlets and JSP files. It creates servlet instances, loads and unloads servlets, creates and manages request and response objects, and performs other tasks for managing servlets effectively.
The Web server plug-in provided by the WebSphere Application Server product helps supported Web servers pass servlet requests to Web containers.
A Web module represents a Web application. It is used to assemble servlets and JSP files, as well as static content such as HTML pages, into a single deployable unit. Web modules are stored in Web archive (WAR) files (.war) which are standard Java archive files.
A Web module contains one or more servlets, JSP files and other files. It also contains a deployment descriptor that declares the content of the module, stored in an XML file named web.xml. The deployment descriptor contains information about the structure and external dependencies of Web components in the module, and describes how the components are to be used at runtime.
A Web module can be used as a standalone application, or it can be combined with other modules (other Web modules, EJB modules, or both) to create a J2EE application. A Web module is installed and run in a Web container.
Note: This application server provides servlets that enable you to check whether all the components of a WebSphere Application Server environment (application servers, datasources, servlets, EJBs, and so on) are working correctly. After verifying that your environment is working correctly, you can choose to keep the Default Server application server, or remove it to create a new one.
Note: Servlet engine is an older (Version 3.x) name for a Web container, and represents the same functionality
20 DB2 UDB/WebSphere Application Tuning Guide

� EJB containers:
WebSphere Application Server provides full support for enterprise beans3. An EJB container provides an interface between the enterprise beans and the server. Together, the EJB container and the application server provide the bean runtime environment. The EJB container provides many low-level services, including threading and transaction support. Perhaps most important from an administrative point of view is that the EJB container manages data storage and retrieval for the beans within it.
An EJB module is used to package one or more enterprise beans into a single deployable unit. An EJB module is represented by a JAR file that contains the enterprise bean classes/interfaces and the bean deployment descriptors. An EJB module can be used as a stand-alone application, or it can be combined with other EJB modules, or with Web modules, to create a J2EE application. An EJB module is installed and run in an enterprise bean container.
WebSphere Application Server implements multiple application servers through the concept of server groups and clones, and uses workload management to spread requests over these application servers. These concepts are explained in the following sections.
Server groups and clonesA server group is a template for creating additional, nearly identical copies of an application server and its contents. It is a logical representation of the application server, and it has the same structure and attributes as the real application server.
The server group lets you view and modify any property associated with these logical objects. But the server group is not associated with any particular physical node, nor does a server group correspond to any real server process running on any node.
Once you have created a server group, you can then create clones of that server. Server groups also help in the management of clones.
A clone is a copy of the application server that has been created from a server group. The act of creating the clones is called cloning.
3 An enterprise bean is a Java component that can be combined with other enterprise beans and other Java components to create a distributed, three-tiered application.
Important: Multiple application servers can be configured to achieve higher degrees of availability and scalability. WebSphere Application Server supports such configurations and provides workload management (WLM) capabilities to achieve load balancing among the various application servers.
Chapter 2. Overview of WebSphere Application Server V4.0 21
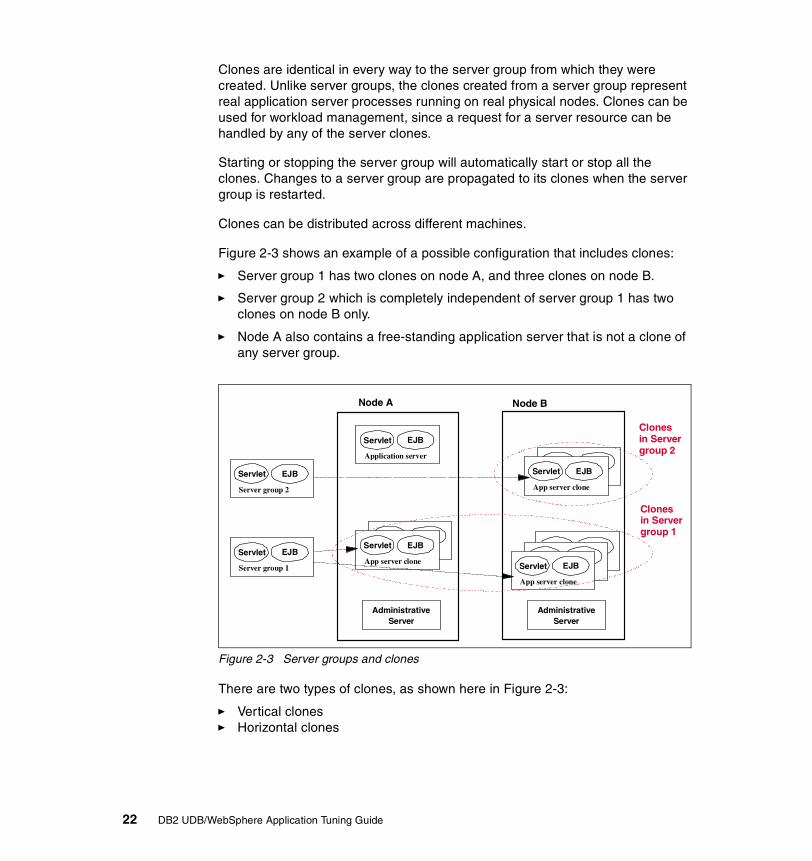
Clones are identical in every way to the server group from which they were created. Unlike server groups, the clones created from a server group represent real application server processes running on real physical nodes. Clones can be used for workload management, since a request for a server resource can be handled by any of the server clones.
Starting or stopping the server group will automatically start or stop all the clones. Changes to a server group are propagated to its clones when the server group is restarted.
Clones can be distributed across different machines.
Figure 2-3 shows an example of a possible configuration that includes clones:
� Server group 1 has two clones on node A, and three clones on node B.
� Server group 2 which is completely independent of server group 1 has two clones on node B only.
� Node A also contains a free-standing application server that is not a clone of any server group.
Figure 2-3 Server groups and clones
There are two types of clones, as shown here in Figure 2-3:
� Vertical clones� Horizontal clones
Node A Node B
Clones in Server group 2
Clones in Server group 1
AdministrativeServer
AdministrativeServer
Application server
EJBServlet
Application server
EJBServlet
App server clone
EJBServlet
Application server
EJBServlet
App server clone
EJBServlet
Application server
EJBServlet
Application server
EJBServlet
App server clone
EJBServletServer group 1
EJBServlet
Server group 2
EJBServlet
22 DB2 UDB/WebSphere Application Tuning Guide

� Vertical clones:
These correspond to clones created from a single server group on the same node. Also called vertical scaling, such scaling provides a straightforward mechanism for creating multiple instances of an application server on the same node, and hence multiple JVM processes, as shown in Figure 2-4. This may improve throughput on large SMP machines.
In the simplest case, you can configure many application server clones on a single machine, and this single machine also runs the HTTP server process.
Figure 2-4 Vertical clones
� Horizontal clones:
These correspond to clones created from a single server group on different nodes. Also called horizontal scaling, clones of an application server are created on multiple physical machines, as shown in Figure 2-5. This enables a single WebSphere application to span several machines yet still presenting a single system image.
Horizontal scaling can provide both increased throughput and failover support when compared to vertical scaling topologies.
Figure 2-5 Horizontal clones
Note: If all the CPUs can be fully utilized using a single JVM, there is no need to add vertical clones.
Chapter 2. Overview of WebSphere Application Server V4.0 23

Workload managementAs mentioned earlier, WLM is the process of spreading multiple requests for work over the resources that can do the work. It optimizes the distribution of processing tasks in the WebSphere Application Server environment. Incoming work requests are distributed to the application servers and other objects that can most effectively process the requests.
WLM is also a procedure for improving performance, scalability and reliability of an application. It provides failover when servers are not available.
Figure 2-6 shows the two types of requests that can be workload managed in WebSphere Application Server V4.0, Advanced Edition:
Servlet requests Can be distributed across multiple Web containers.
EJB requests Can be distributed across multiple EJB containers.
Figure 2-6 Types of requests that can be workload managed
Note: Server groups and clones can only be created for application servers. Therefore, cloning a server group automatically enables WLM for the servlets and EJBs that it contains.
App Server
EJB Container
App Server
EJB Container
App Server
Web Container
App Server
Web Container
ServletRequest
EJBRequest
Plugin
HTTPServer
App Server
Web Container
EJBRequests
JavaClient
EJBRequests
ServletRequests
24 DB2 UDB/WebSphere Application Tuning Guide

More details on WLM and scalability are presented in IBM WebSphere V4.0 Advanced Edition Scalability, SG24-6192.
Virtual hostsA virtual host is a configuration enabling a single host machine to resemble multiple host machines. It allows a single physical machine to support several independently configured and administered applications. It is not associated with a particular node (machine). It is a configuration, rather than a “live object”, which is why it can only be created, but not started or stopped.
Each virtual host has a logical name and a list of one or more DNS aliases by which it is known. A DNS alias is the TCP/IP host name and port number used to request the servlet, for example yourHostName:80. These are the default ports and aliases:
� The default alias is *:80, using an external HTTP port that is not secure� Aliases of the form *:9080 use the embedded HTTP port that is not secure� Aliases of the form *:443 use the secure external HTTPS port� Aliases of the form *:9443 use the secure embedded HTTPS port
When a servlet request is made, the server name and port number entered into the browser are compared to a list of all known aliases in an effort to locate the correct virtual host and serve the servlet. If no match is found, an error (404) is returned to the browser.
WebSphere Application Server provides a default virtual host, aptly named “default_host”, with some common aliases, such as the machine's IP address, short host name, and fully qualified host name. The alias comprises the first part of the path for accessing a resource such as a servlet. For example, it is localhost:80 in the request http://localhost:80/servlet/snoop.
Virtual hosts allow the administrator to isolate, and independently manage, multiple sets of resources on the same physical machine.
Note: All resources that participate in WLM must be running under the same version of WebSphere Application Server.
Chapter 2. Overview of WebSphere Application Server V4.0 25
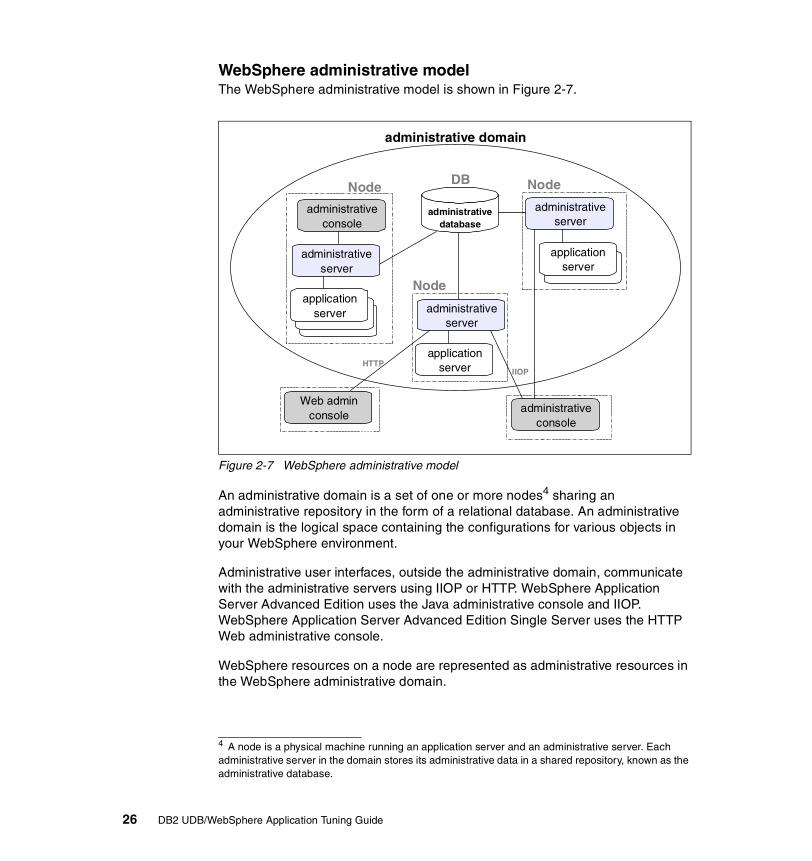
WebSphere administrative modelThe WebSphere administrative model is shown in Figure 2-7.
Figure 2-7 WebSphere administrative model
An administrative domain is a set of one or more nodes4 sharing an administrative repository in the form of a relational database. An administrative domain is the logical space containing the configurations for various objects in your WebSphere environment.
Administrative user interfaces, outside the administrative domain, communicate with the administrative servers using IIOP or HTTP. WebSphere Application Server Advanced Edition uses the Java administrative console and IIOP. WebSphere Application Server Advanced Edition Single Server uses the HTTP Web administrative console.
WebSphere resources on a node are represented as administrative resources in the WebSphere administrative domain.
4 A node is a physical machine running an application server and an administrative server. Each administrative server in the domain stores its administrative data in a shared repository, known as the administrative database.
administrativedatabase
administrativeconsole
applicationserver
applicationserver
applicationserver
administrativeserver
Node Node
Node
DB
administrative domain
administrativeserver
administrativeconsole
administrativeserver
Web adminconsole
HTTPIIOP
26 DB2 UDB/WebSphere Application Tuning Guide

These are the three main elements of the WebSphere administrative model:
1. Administrative server:
The administrative server is the systems management runtime component of WebSphere. The administrative server is responsible for runtime management, security, transaction coordination, and workload management. In most cases, the administrative server runs on all nodes in a WebSphere administrative domain and controls the interaction between each node and application server process in the domain.
The WebSphere administrative server provides administrators with a single system view of applications and resources, such as JSPs, servlets, and EJBs, that could be deployed across multiple platforms in a distributed environment. Administering resources on a remote machine is just as easy as administering them on the local machine.
2. Administrative repository:
WebSphere stores all runtime configuration information for a domain in a single persistent repository. That database by default is named WAS40. All administration takes place through the manipulation of objects in the administrative repository.
A single node running all processes is common in small production environments, but it is entirely reasonable to configure the database on a remote server for production environments.
3. Administrative interfaces:
The WebSphere administrative server provides the services that are used to control resources and perform tasks on the administrative database. Monitoring and configuring of administrative resources as well as stopping and starting of servers are facilitated by four interfaces, as shown in Figure 2-8.
The two graphical interfaces and two command-line interfaces nicely complement each other. You can use the graphical interfaces to interactively administer your WebSphere environment, and the command-line tools to automate configuration tasks.
Note: In the single server edition, this repository is stored in an XML configuration file.
Chapter 2. Overview of WebSphere Application Server V4.0 27

Figure 2-8 WebSphere administrative interfaces
2.4 WebSphere application modelWebSphere applications consist of object-oriented business logic that use relational database systems for data storage. While applications are usually integrated with thick or thin Web clients, they can also be integrated with existing procedural applications running in application servers.
An application consists of the following components, each performing a different function:
� HTML and JSP pages provide the user interface and program flow.
� Enterprise beans contain the application’s business logic and handle transactional operations and access to databases.
� Servlets coordinate work between the other components of the application. They also can dynamically generate Web page contents.
� JavaBeans components enable the other types of components to work together.
Graphical interfaces
WebAdministrativeConsole (AEs)
JavaAdministrativeConsole (AE)
XML ConfigTool (AE)
WebSphereControl
Program (AE)
Command line interfaces
WebSphere Administrative Services
WS AdminServer
WebSphereAppServer
WebSphereAppServer
AdministrativeDatabase
28 DB2 UDB/WebSphere Application Tuning Guide

� Relational databases implement persistence and query functions for enterprise beans. Either new or existing databases can be used in an application.
2.5 Session managementIn many usage scenarios, a client makes a request, waits for the result, then makes one or more subsequent requests that depend upon the results received from the earlier requests.
Such a sequence of operations on behalf of one client falls into two categories:
� Stateless: In this case, the server that processes each request does so based solely on information provided with that request itself, and not based on information that it “remembers” from earlier requests. In other words, the server does not need to maintain state information between requests.
� Stateful: In this case, the server that processes a request needs to access and maintain state information generated during the processing of an earlier request. For example, when the user keeps adding to a shopping cart over multiple interactions, this information must be stored, and when the user clicks the checkout button, the contents of the shopping cart must be displayed along with appropriate charge information.
A number of techniques are available to maintain state between multiple HTTP client requests. The following techniques are not mutually exclusive:
� Cookies� URL encoding/rewriting� SSL5 session identifiers
5 SSL stands for Secure Sockets Layer and it is a public-key network security protocol that can perform message encryption, client authentication, and server authentication.
Attention: When multiple application servers are involved, server affinity becomes an additional consideration.
Important: A key concept associated with session management is that of a session identifier. A session identifier (session ID) correlates an incoming user request with a session object maintained on the server. These session identifiers are passed with each client request using cookies, URL rewriting or SSL ID techniques.
Chapter 2. Overview of WebSphere Application Server V4.0 29
We discuss the following topics in this section:
� Session tracking mechanisms� Server affinity� WebSphere session manager
2.5.1 Choosing a session tracking mechanismWebSphere Application Server supports all three of the aforementioned session tracking techniques.
It is possible to select all three options for a Web application. If you do this, then:
� SSL session identifiers are used in preference to cookie and URL rewriting.� Cookies are used in preference to URL rewriting.
CookiesMany sites choose cookie support to pass the user’s identifier between WebSphere Application Server and the user. WebSphere Application Server session support generates a unique session ID for each user, and returns this session ID to the user’s browser via a cookie.
A cookie consists of information embedded as part of the headers in the HTML stream passed between the server and the browser. The browser holds the cookie, and returns it to the server whenever the user makes a subsequent request. By default, WebSphere Application Server defines its cookies to be destroyed when the browser is closed.
The main disadvantage of cookies is that some users, either by choice or mandate, disable them from within their browser.
URL encoding/rewritingWhile session management using SSL IDs or cookies is transparent to the Web application, URL encoding requires the developer to use special encoding APIs, and to set up the site page flow to avoid losing the encoded information.
URL encoding works by actually storing the session identifier in the page returned to the user. WebSphere Application Server encodes the session identifier as a parameter on URLs that have been encoded programmatically by the Web application developer.
The disadvantages of this technique include these limitations:
� The Servlet or JSP developer has to write extra code as compared to cookies or SSL session identifiers.
30 DB2 UDB/WebSphere Application Tuning Guide

� The flow of site pages is limited exclusively to dynamically generated pages such as pages generated by servlets or JSPs. WebSphere Application Server inserts the session ID into dynamic pages, but can not insert the user’s session ID into static pages (.htm or .html pages).
Therefore, after the application creates the user’s session data, the user must visit dynamically generated pages exclusively until they finish with the portion of the site requiring sessions. URL encoding forces the site designer to plan the user’s flow in the same site to avoid losing their session id.
SSL session identifiersWhen SSL ID tracking is enabled for requests over SSL, then SSL session information is used to track the HTTP session ID.
SSL tracking is supported only for the IBM HTTP Server and iPlanet Web servers. The lifetime of an SSL session ID can be controlled by configuration options in the Web server. For example, in the IBM HTTP Server, the configuration variable SSLV3TIMEOUT must be set, to allow for an adequate lifetime for the SSL session ID. Too short an interval could result in premature termination of a session.
The main disadvantage of using this technique is the performance hit of using SSL. If you have a business requirement to use SSL, then this would be a good choice, otherwise, consider using cookies instead.
Attention: Because the SSL session ID is negotiated between the Web browser and HTTP server, it cannot survive an HTTP server failure. However, the failure of an application server does not affect the SSL session ID.
Important: When the SSL session ID is used as the session tracking mechanism in a cloned environment, either cookies or URL rewriting must be used to maintain session affinity (see next section for a discussion of this topic). The cookie or rewritten URL contains session affinity information that enables the Web server to properly route requests back to the same server, once the HTTP session has been created on a server. The SSL ID is not sent in the cookie or rewritten URL, but is derived from the SSL information.
Chapter 2. Overview of WebSphere Application Server V4.0 31

2.5.2 Server affinity In a load balancing environment, the choice of a target server for directing a request is dependent on many factors, including server load and capacity.
WebSphere Application Server WLM will always directs a client's access to a stateful session bean to the single server instance containing the bean (no possibility of choosing the wrong server here). If the request is directed to the wrong server, it will either fail, or that server itself will be forced to forward the request to the correct server at great performance cost.
In the case of HTTP sessions or entity beans in-between transactions, in a clustered environment, the underlying shared database ensures that any server can correctly process each request. However, accesses to that underlying database may be expensive, and it may be possible to improve performance by caching the database data at the server level. In such a case, if multiple consecutive requests are directed to the same server, they may find the required data still in the cache, and thereby reduce the overhead of access to the underlying database.
Server affinity refers to the capability of a load distribution facility to take such constraints into account. In effect, the load-distribution facility not only recognizes that multiple servers may be acceptable targets for a given request, but also that each request may have a particular affinity for being directed to a particular server, on which it will be handled better or faster.
Session clusteringSession clustering requires an affinity mechanism so that all requests for a particular session are directed to the same JVM in the cluster. One such solution provided by WebSphere Application Server is Session Affinity in a server group, and is the default. This solution is available as part of the WebSphere plug-ins for Web servers. While session affinity can be turned off, it is not recommended.
Important: In the case of stateful session beans or entity beans within the context of a transaction, there is only one valid server.
32 DB2 UDB/WebSphere Application Tuning Guide

In WebSphere Application Server, each WebSphere Application Server ID is appended to the session ID. When an HTTP session is created, its session ID is passed back to the browser as part of a cookie or URL encoding. When the browser makes further requests, the cookie or URL encoding will be sent back to the Web server. The WebSphere plug-in examines the HTTP session ID, in the cookie or URL encoding, extracts the unique ID of the WebSphere Application Server clone handling the session, and forwards the request.
2.5.3 WebSphere Session ManagerThe session manager is part of each Web container, and is responsible for managing HTTP sessions, providing storage for session data, allocating session IDs, and tracking the session ID associated with each client request through the use cookies, URL rewriting, or SSL session identifier techniques. The session manager allows the WebSphere Application Server administrator to dynamically configure and tune the behavior of all HTTP sessions created by servlets within its application server.
Attention: The Servlet 2.2 specification requires that an HTTP session be:
� Accessible only to the Web application that created the session. The session ID can be shared across Web applications, but not the session data. For example, data created by Web module A is not accessible to Web module B, and vice versa. In the upcoming PTF 4 for WebSphere Application Server (V4.04) as well as V5, WebSphere Application Server will provide for optional sharing of the session object between Web applications inside a single Enterprise Application (EAR). This option should be used with great care since the capability to share a session object can lead to increased session size as each application tends to add attributes to the session object, which may lead to degraded performance as described in 1 on page 201.
� Handled by a single JVM for that application at any one time.
This means that in a cloned environment, any HTTP requests that are associated with an HTTP session must be routed to the same Web application in the same JVM. This ensures that all of the HTTP requests are processed with a consistent view of the user’s HTTP session. The exception to this rule is when the clone fails or has been shut down.
Important: In WebSphere Application Server the recommended method for sharing of sessions between multiple application server processes is to persist the session in a database.
Chapter 2. Overview of WebSphere Application Server V4.0 33
From an application development perspective, servlet and JSP code do not interact directly with the session manager object. Rather, the session manager supports the HTTPSession interface, which developers use for session functionality.
All the servlet or JSP developer has to do is create the session and put and get data. This allows the application developer to focus on business logic, and ensures consistent behavior across all of the servlets called by its servlet engine.
HttpSession interfaceThe Java servlet specification contains the interface javax.servlet.http.HttpSession that the WebSphere Application Server servlet engine (Web container) supports. HttpSession provides Application Program Interfaces (APIs) that handle many of the details of session access and management.
An HttpSession gets created by calling the javax.servlet.http.HttpServletRequest.getSession() method on the servlet’s request object. If a session does not yet exist, this call creates one.
Some of these APIs have been deprecated with the Java Servlet Specification 2.2. The putValue() and getValue() methods, for example, have been replaced by putAttribute() and getAttribute() respectively, although the Java Servlet Specification 2.1 methods are still supported.
2.6 Typical application flowFigure 2-9 shows the typical application flow for Web browser clients using either JDBC (from a servlet) or EJB to access application databases.
34 DB2 UDB/WebSphere Application Tuning Guide

Figure 2-9 A typical application flow
1. A Web client requests a URL in the browser (input page).
2. The request is routed to the Web server over the Internet.
3. The Web server immediately passes the request to the WebSphere plug-in. All requests go to the WebSphere plug-in first.
4. WebSphere plug-in examines the URL, verifies the list of hostname aliases from which it will accept traffic based on the virtual host information, and chooses a server to handle the request.
5. A stream is created. A stream is a connection to the Web container. It is possible to maintain a connection (stream) over a number of requests. The Web container receives the request and based on the URL, dispatches it to the proper servlet.
6. If the servlet class is not loaded, the dynamic class loader loads the servlet. Servlet init(), then doGet() or doPost().
7. JNDI is now used for lookup of either datasources or EJBs required by the servlet.
DB2application database
Browser Client
output page
input page
HTML HTML
1
2
Web Server
3 plug-in 4
13
14
5
Application Server
Web Container
Servlet
JSP
EJB Container
JNDI
Data Sources
EJB
WebSphere Application Server
Connection Pool
7 8a
8b 9 10a 12
6
10b 11
Embedded HTTP Server
EnterpriseBean
Chapter 2. Overview of WebSphere Application Server V4.0 35

8. Depending upon whether a datasource is specified or an EJB is requested, the JNDI will direct the servlet:
a. To the corresponding database, and get a connection from its connection pool in the case of a datasource
b. To the corresponding EJB container, which then instantiates the EJB, when an EJB is requested
9. If the EJB requested involves an SQL transaction, it will go back to the JNDI to lookup the datasource.
10.The SQL statement will be executed and the data retrieved will be sent back:
a. To the servletb. To the EJB
11.Data beans are created and handed off to JSPs in the case of EJBs.
12.Servlet sends data to JSPs.
13.The JSP generates the HTML that is sent back through the WebSphere plug-in to the Web server.
14.The Web server sends the output page (output html) to the browser.
2.7 WebSphere Queuing NetworkIn a typical J2EE application, a client request flows through a Web server, application server and a database. With WebSphere Application Server, the request flows through a network of queues6.
These queues represent WebSphere Application Server system resources and should be tuned to achieve optimal performance. These queues include the network, Web server, Web container, EJB container (ORB), datasource, and possibly a connection manager to a custom backend system, as shown in Figure 2-10.
6 We call them queues from a queueing theory perspective, but in reality, they are thread pools.
36 DB2 UDB/WebSphere Application Tuning Guide

Figure 2-10 WebSphere Queuing Network
Each of these WebSphere Application Server resources represents a queue of requests waiting to use that resource. WebSphere Application Server queues are load-dependent resources, and therefore the average service time of a request depends on the number of concurrent clients.
Queues may either be closed or open:
� A closed queue allows the administrator to limit the maximum number of requests active in that queue.
A closed queue allows system resources to be tightly managed. For example, the Web container's Max Connections setting controls the size of the Web container thread pool. If the average servlet running in the Web container creates 10 MB of objects during each request, then setting Max Connections to 100 would limit the memory consumed by the Web container to approximately 1 GB. Hence, closed queues typically allow the system administrators to manage their applications more effectively and robustly.
In a closed queue, a request can be in one of the two following states:
a. Active: In this state, a request is doing work, or is waiting for a response from a downstream queue. For example, an active request in the Web server is either doing work such as retrieving static HTML, or waiting for a request to complete in the Web container.
b. Waiting: In this state, the request is waiting to become active. The request will remain in waiting state until one of the active requests finishes processing and vacates the queue.
� An open queue does not allow the administrator to restrict the maximum number of requests active in that queue.
DB2
UpStream Queuing Network
Network
Clients
ServletEngine
Data
Source
Web Server
EJB
Container
Chapter 2. Overview of WebSphere Application Server V4.0 37

All the closed queues provide settings to limit the maximum number of requests flowing through them. These are as follows:
� Web Server:
All Web servers supported by WebSphere Application Server maintain a thread pool to process the incoming HTTP request. Their size can be controlled by the following parameters in conf/httpd.conf:
– IBM HTTP Server
• MaxClients for UNIX• ThreadsPerChild for Windows NT/2000
– Microsoft IIS
• MaxPoolThreads• PoolThreadLimit
� Web container:
This is a pool of threads to process servlet/JSP requests and Web services. and can be set in the WebSphere Application Server Admin Console for 4.0 Advanced Edition, as shown in Figure 2-11.
Note: Most of the WebSphere Application Server queues are closed queues.
38 DB2 UDB/WebSphere Application Tuning Guide

Figure 2-11 Web container queue settings
� EJB container:
The EJB container inherits its queueing behavior from its built-in Object Request Broker (ORB), which manages the interaction between clients and servers, using the Internet Inter ORB Protocol (IIOP). It enables clients to make requests and receive responses from servers in a network-distributed environment.
The ORB thread pool acts as a queue for incoming requests. However, if a remote method request is issued and there are no more available threads in the thread pool, a new thread is created. After the method request completes the thread is destroyed. Hence, the EJB component container, like the ORB, is an open queue. Given this fact, it is important for the application calling enterprise beans to place limits on the number of concurrent callers into the EJB container.
Chapter 2. Overview of WebSphere Application Server V4.0 39

If EJBs are being called by servlets, the Web container will limit the number of total concurrent requests into an EJB container, by virtue of the limits in the Web container itself. However, this applies only to EJBs being called from the servlet thread of execution. It would be possible for a servlet to create its own threads and bombard the EJB container with requests. This is one of the reasons why it is not a good idea for servlets to create their own work threads.
The ORB Thread pool size can be configured using the WebSphere Admin Console, as shown in Figure 2-12. As explained above, this pool can grow beyond the specified size depending on the incoming traffic.
Figure 2-12 ORB thread pool size setting
40 DB2 UDB/WebSphere Application Tuning Guide

Resource Analyzer shows a metric called Percent Maxed to determine how much of the time all of the configured ORB threads are in use a shown in Figure 2-13. If this value is consistently in the double-digits, then the ORB could be a bottleneck and the number of threads should be increased. The degree to which the ORB thread pool value needs to be increased, is a function of the number of simultaneous servlets (that is, clients) calling enterprise beans, and the duration of each method call.
Figure 2-13 Resource Analyzer ORB monitoring
Important: In WebSphere Application Server 4.0.2, the ORB thread pool can be bounded (made to behave like a closed queue), by setting the Java system property -Dcom.ibm.ws.OrbThreadPoolGrowable=false in the WebSphere Application Server Admin Console JVM Settings, as shown in Figure 2-14.
Chapter 2. Overview of WebSphere Application Server V4.0 41
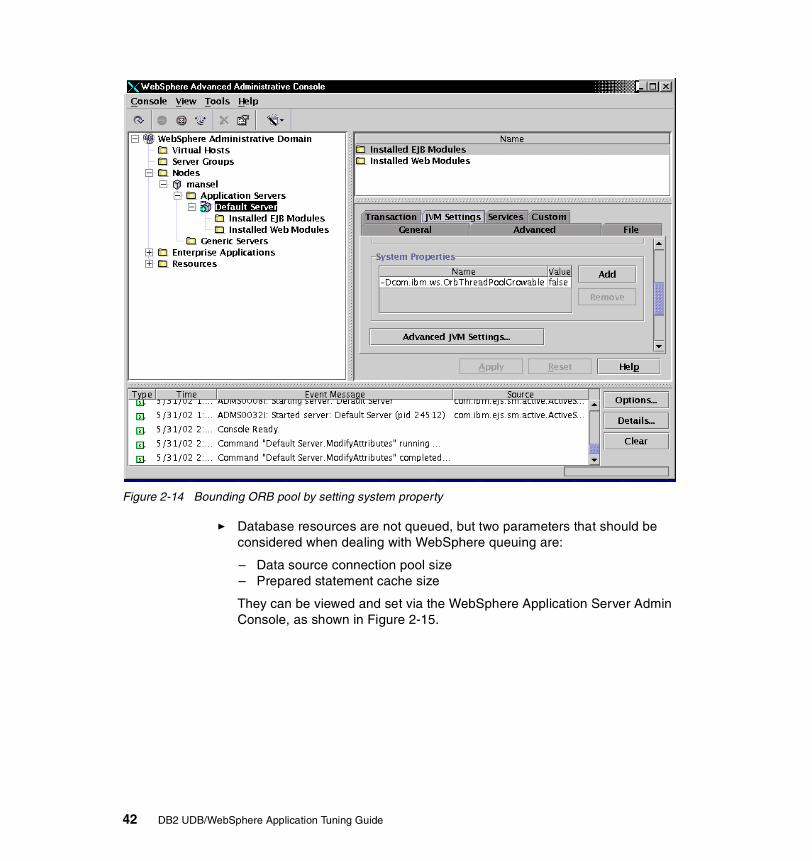
Figure 2-14 Bounding ORB pool by setting system property
� Database resources are not queued, but two parameters that should be considered when dealing with WebSphere queuing are:
– Data source connection pool size– Prepared statement cache size
They can be viewed and set via the WebSphere Application Server Admin Console, as shown in Figure 2-15.
42 DB2 UDB/WebSphere Application Tuning Guide

Figure 2-15 Datasource connection pooling settings
Both these parameters are explained in detail in “Connection pool” on page 148, and “Prepared statement cache” on page 169.
2.8 Tuning WebSphere Application ServerIn this section we provide a high level view of WebSphere Application Server application and system tuning considerations.
The performance of a WebSphere Application Server enterprise application depends on various factors, including network, database, memory, application design, and application server configuration. Since these factors vary from installation to installation, each recommendation should be evaluated for applicability in one’s own unique situation.
Chapter 2. Overview of WebSphere Application Server V4.0 43

2.9 Application tuning considerations In this section we recommend the following best practices when writing a WebSphere Application Server application that includes servlets, JSPs, JDBC connections, and EJBs.
2.9.1 Do not store large object graphs in HttpSessionApplications sometimes require the use of persistent HttpSessions. There is a cost associated with this, since an HttpSession must be read by the servlet whenever it is used, and rewritten whenever it is updated. This involves serializing the data, and reading it from and writing it to a database.
In most applications, each servlet requires only a fraction of the total session data. Therefore, by storing the data in the HttpSession as one large object graph, an application forces WebSphere Application Server to process the entire HttpSession object each time. The added cost involves not only serialization, but also memory consumption in the session cache.
WebSphere Application Server provides a number of options to optimize session management costs. These are described in IBM WebSphere V4.0 Advanced Edition Handbook, SG24-6176.
Also, consider alternatives to storing the entire servlet state data object graph in the HttpSession. For example, maintain the state data needed by each servlet as a separate row in an application maintained JDBC datasource, as shown in Figure 2-16. The primary keys for each row (the data for each servlet) can then be stored as separate attributes in the HttpSession. This limits the HttpSession to just a few strings that are used to locate the actual session data.
Important: It should be noted that in many cases, the effects of bad application design and development cannot be easily overcome with system tuning, or by making additional computing resources available to the application. Therefore, adopting application related best practices from the start will go a long way towards a superior performance system.
44 DB2 UDB/WebSphere Application Tuning Guide

Figure 2-16 JDBC session data alternative
Note that this session data will eventually need to be cleaned up from the datasource when the session had ended. Two potential alternatives are:
� Using a periodic offline non-WebSphere Application Server process such as CRON in UNIX that would delete these rows at intervals depending on the application. In this example, the database is keyed on servlet data time of creation.
� HttpSessionBindingListener. When the HttpSession is about to be destroyed, the javax.servlet.http.HttpSessionBindingEvent for valueUnbound could direct a delete of the servlet state data.
If the lifetime of servlet state data is longer than that of the HttpSession, use the first alternative.
Chapter 2. Overview of WebSphere Application Server V4.0 45

2.9.2 Release HttpSessions when finishedHttpSession objects live inside WebSphere Application Server until one of the following occurs:
� The application explicitly and programmatically releases it using the API, javax.servlet.http.HttpSession.invalidate(). Quite often, programmatic invalidation is part of an application logout function.
� WebSphere Application Server destroys the allocated HttpSession when it expires based on session management configuration parameters — the default is 30 minutes.
WebSphere Application Server maintains a certain number of HttpSessions in memory based on configuration parameters.
Therefore, release each HttpSession programmatically, or with lower HttpSession expiry thresholds, depending upon the application.
Figure 2-17 shows an example of explicit HttpSession invalidation.
Figure 2-17 Explicit HttpSession invalidation
46 DB2 UDB/WebSphere Application Tuning Guide
2.9.3 JSP considerationsTwo considerations apply here:
� Do not create HttpSessions by default:
JSPs create HttpSessions by default per J2EE, to facilitate the use of JSP implicit objects, which can be referenced in JSP source and tags without explicit declaration. HttpSession is one of those objects.
If you do not use HttpSession in your JSPs, then performance can be enhanced by avoiding this default HttpSession creation by involving the following JSP page directive:
<%@ page session=”false”%>
� Minimize the use of jsp:include:
These are used to build composite JSPs dynamically, but they can result in poor performance since each include JSP is a separate servlet.
2.9.4 Do not use SingleThreadModelSingleThreadModel is a tag interface that a servlet can implement to transfer its re-entrancy problem to the servlet engine. As such, javax.servlet.SingleThreadModel is part of the J2EE specification. WebSphere Application Server’s servlet engine handles a servlet’s re-entrancy problem by creating separate servlet instances for each user. Because this causes a great amount of system overhead, SingleThreadModel should be avoided.
Developers typically use javax.servlet.SingleThreadModel to protect updatable servlet instances in a multi threaded environment. The better approach is to avoid using servlet instance variables that are updated from the servlet’s service. Figure 2-18 shows an example of using the SingleThreadModel.
Chapter 2. Overview of WebSphere Application Server V4.0 47

Figure 2-18 Servlet using single threaded model
2.9.5 Minimize synchronization in servletsSynchronization has to do with serializing the execution of code, that is, locking of the code.
Servlets are multi-threaded, and applications have to recognize and handle this. However, if large sections of code are synchronized, an application effectively becomes single threaded, and throughput decreases.
The code in Figure 2-19 synchronizes the major code path of the servlet’s processing to protect a servlet instance variable numberOfRows. The code in Figure 2-20 moves the lock to a servlet instance variable, and out of the critical code path. Using javax.servlet.SingleThreadModel, is yet another way to protect updatable servlet instance variables, but should be avoided.
48 DB2 UDB/WebSphere Application Tuning Guide

Figure 2-19 Servlet code using synchronization
Figure 2-20 Servlet code avoiding synchronization
Chapter 2. Overview of WebSphere Application Server V4.0 49

2.9.6 Use the HttpServlet Init method judiciously The servlet init() method is invoked only when servlet instance is loaded, and is therefore the ideal location to carry out expensive operations that need only be performed during initialization. By definition, the init() method is thread-safe. The results of operations in the HttpServlet.init() method can be cached safely in servlet instance variables, which become read-only in the servlet service() method. Figure 2-21 shows a good example of using init () method to acquire the JDBC DataSource in the HttpServlet.init() method.
Figure 2-21 Judicious use of init() method
2.9.7 Avoid String concatenation “+=”Poor String concatenation techniques lead to adverse performance since it can lead to the creation of large numbers of temporary Java objects, and consume valuable memory. Because Strings are immutable objects, String concatenation results in temporary object creation, and this leads to increased Java garbage collection and consequently CPU utilization as well.
50 DB2 UDB/WebSphere Application Tuning Guide

Recommendation is to use java.lang.StringBuffer instead of String concatenation. Figure 2-22 and Figure 2-23 show the wrong and correct way to concatenate Strings.
Figure 2-22 Poor String concatenation technique
Figure 2-23 Correct String concatenation technique
Chapter 2. Overview of WebSphere Application Server V4.0 51

2.9.8 Minimize uses of System.out.printlnAvoid indiscriminate used of System.out.println statements and similar constructs, since they synchronize processing for the duration of disk I/O, and can significantly slow throughput.
Developers should use state of the art enterprise application development facilities, such as WebSphere Studio Application Developer for debugging during unit testing. WebSphere Application Server Distributed Debugger can be used to diagnose code on a running system.
However, even with these tools, there remains a legitimate need for application tracing both in test and production environments for error and debugging situations. Such application level tracing like most system level traces should be configurable to be activated in error and debugging situations only. One good design implementation is to tie tracing to a “final boolean” value, which when configured to false will optimize out both the check and execution of the tracing at compile time. Figure 2-24 shows an example.
Figure 2-24 Application level tracing
Also since WebSphere Application Server allows the complete deactivation of System.out and System.err at runtime, consider doing so on the classpath for stdout and stderr, as shown in Figure 2-25.
52 DB2 UDB/WebSphere Application Tuning Guide
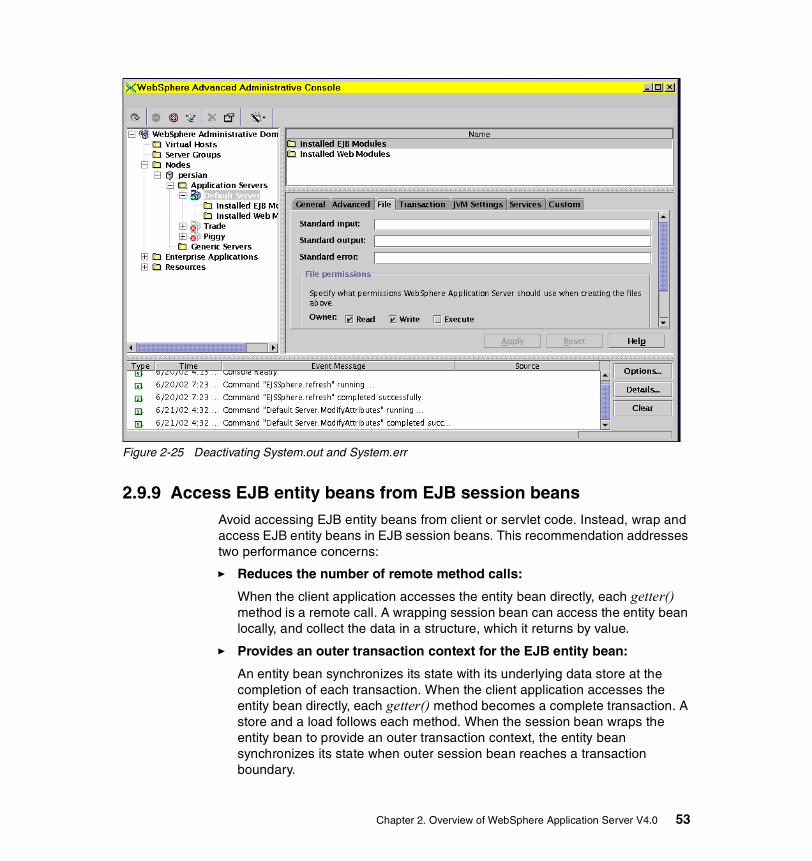
Figure 2-25 Deactivating System.out and System.err
2.9.9 Access EJB entity beans from EJB session beansAvoid accessing EJB entity beans from client or servlet code. Instead, wrap and access EJB entity beans in EJB session beans. This recommendation addresses two performance concerns:
� Reduces the number of remote method calls:
When the client application accesses the entity bean directly, each getter() method is a remote call. A wrapping session bean can access the entity bean locally, and collect the data in a structure, which it returns by value.
� Provides an outer transaction context for the EJB entity bean:
An entity bean synchronizes its state with its underlying data store at the completion of each transaction. When the client application accesses the entity bean directly, each getter() method becomes a complete transaction. A store and a load follows each method. When the session bean wraps the entity bean to provide an outer transaction context, the entity bean synchronizes its state when outer session bean reaches a transaction boundary.
Chapter 2. Overview of WebSphere Application Server V4.0 53
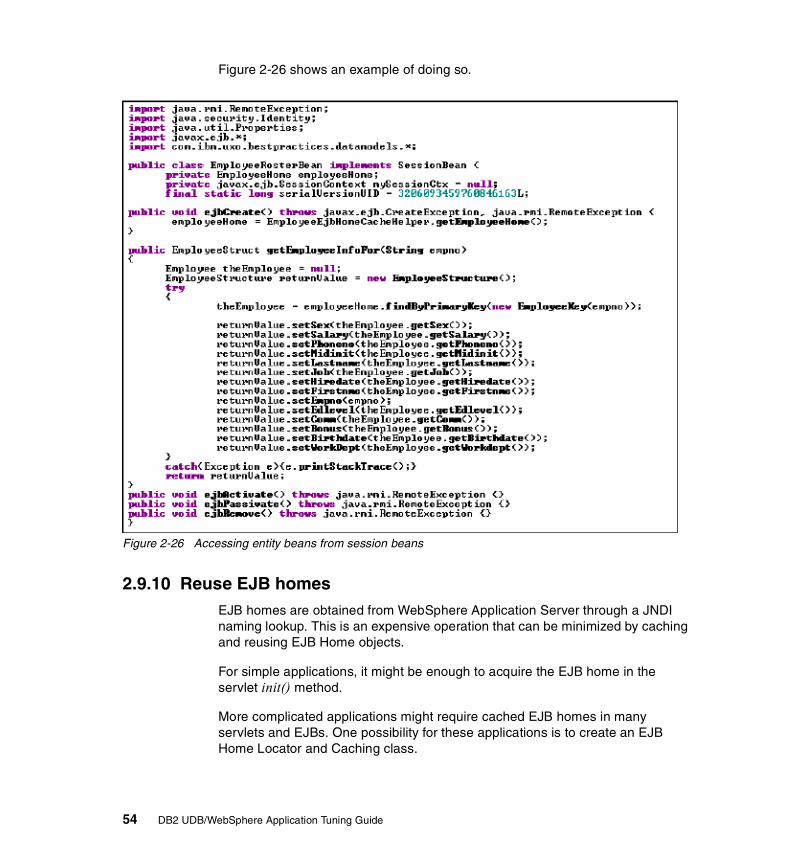
Figure 2-26 shows an example of doing so.
Figure 2-26 Accessing entity beans from session beans
2.9.10 Reuse EJB homesEJB homes are obtained from WebSphere Application Server through a JNDI naming lookup. This is an expensive operation that can be minimized by caching and reusing EJB Home objects.
For simple applications, it might be enough to acquire the EJB home in the servlet init() method.
More complicated applications might require cached EJB homes in many servlets and EJBs. One possibility for these applications is to create an EJB Home Locator and Caching class.
54 DB2 UDB/WebSphere Application Tuning Guide

2.9.11 Use JDBC connection poolingFor applications that require access from a database, the overhead of connecting and disconnecting to it can be significant. To avoid the overhead of acquiring and closing JDBC connections, WebSphere Application Server provides JDBC connection pooling based on JDBC 2.0. Servlets should use WebSphere Application Server JDBC connection pooling instead of acquiring these connections directly from the JDBC driver. WebSphere Application Server JDBC connection pooling involves the use of javax.sql.DataSources.
Figure 2-27 shows the wrong way to invoke a JDBC connection, while Figure 2-28 shows the correct way to do so.
Figure 2-27 Wrong way to obtain JDBC connections
Attention: One problem with caching and reusing EJB homes is the issue of handling stale cached homes. If a client caches an EJB home, and then the container shuts down and then returns, the client’s cached value is stale and will not work. Accessing a cached stale home will result in an exception being thrown.
Chapter 2. Overview of WebSphere Application Server V4.0 55

Figure 2-28 Correct way to obtain JDBC connections
2.9.12 Reuse datasources for JDBC connectionsServlets acquire JDBC connections from a javax.sql.DataSource defined for the database. A javax.sql.DataSource is obtained from WebSphere Application Server through a JNDI naming lookup. The overhead of acquiring a javax.sql.DataSource for each SQL access should be avoided, since this is an expensive operation that can severely impact the performance and scalability of the application.
To avoid this overhead, servlets should acquire the javax.sql.DataSource in the Servlet.init() method (or some other thread-safe method) and maintain it in a common location for reuse.
Figure 2-29 shows the wrong way of reusing datasources, while Figure 2-30 shows the correct way to do so.
56 DB2 UDB/WebSphere Application Tuning Guide

Figure 2-29 Wrong way to acquire a datasource
Figure 2-30 Correct way to acquire a datasource
Chapter 2. Overview of WebSphere Application Server V4.0 57
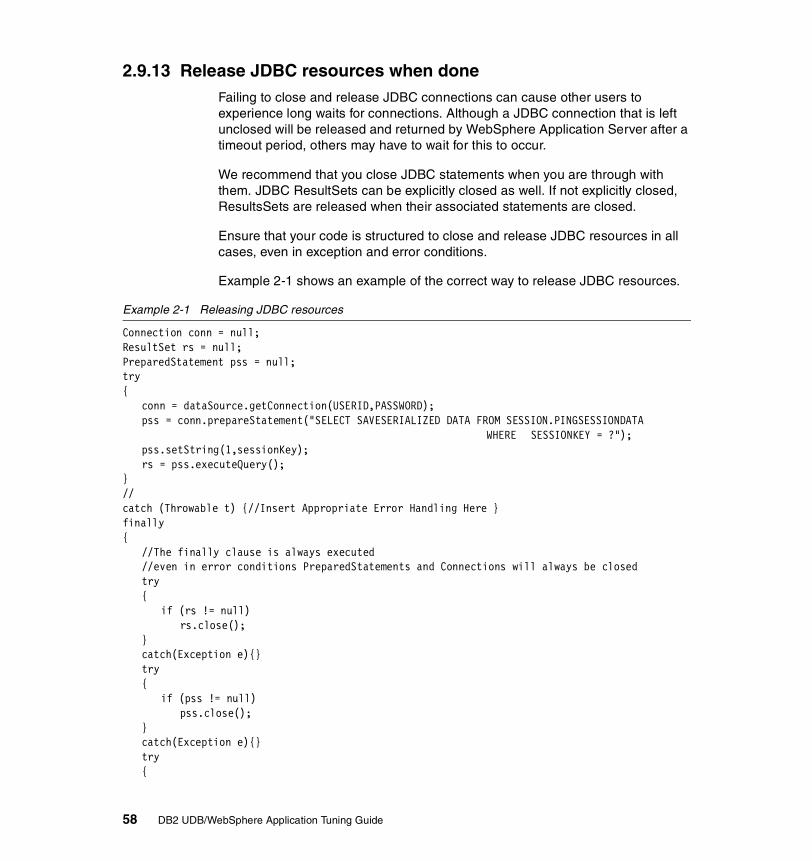
2.9.13 Release JDBC resources when doneFailing to close and release JDBC connections can cause other users to experience long waits for connections. Although a JDBC connection that is left unclosed will be released and returned by WebSphere Application Server after a timeout period, others may have to wait for this to occur.
We recommend that you close JDBC statements when you are through with them. JDBC ResultSets can be explicitly closed as well. If not explicitly closed, ResultsSets are released when their associated statements are closed.
Ensure that your code is structured to close and release JDBC resources in all cases, even in exception and error conditions.
Example 2-1 shows an example of the correct way to release JDBC resources.
Example 2-1 Releasing JDBC resources
Connection conn = null;ResultSet rs = null;PreparedStatement pss = null;try{
conn = dataSource.getConnection(USERID,PASSWORD);pss = conn.prepareStatement("SELECT SAVESERIALIZED DATA FROM SESSION.PINGSESSIONDATA
WHERE SESSIONKEY = ?");pss.setString(1,sessionKey);rs = pss.executeQuery();
}//catch (Throwable t) {//Insert Appropriate Error Handling Here }finally{
//The finally clause is always executed//even in error conditions PreparedStatements and Connections will always be closedtry{
if (rs != null)rs.close();
}catch(Exception e){}try{
if (pss != null)pss.close();
}catch(Exception e){}try{
58 DB2 UDB/WebSphere Application Tuning Guide

if (conn != null)conn.close();
}catch(Exception e){}
}
2.9.14 Use Read-Only methods where appropriateWhen setting the deployment descriptor for an EJB entity bean, you can mark Access Intent as Read-Only. If a transaction unit of work includes no methods other than “Read-Only” designated methods, then the Entity Bean state synchronization will not invoke store.
2.9.15 Choose the minimal isolation level that is appropriateBy default, most developers deploy EJBs with the transaction isolation level set to TRANSACTION_SERIALIZABLE. This is the default in IBM VisualAge Java Enterprise Edition, and other EJB deployment tools. It is also the most restrictive and protected transaction isolation level, and incurs significant overhead.
Many workloads do not require this level of isolation protection. A given application might never update the underlying data, or be run with other concurrent updaters. In that case, the application would not have to be concerned with dirty, non-repeatable, or phantom reads problems (Refer to the DB2 product documentation for details). TRANSACTION_READ_UNCOMMITTED would probably suffice in such cases. Because the EJB’s transaction isolation level is set in its deployment descriptor, the same EJB could be reused in different applications with different transaction isolation levels.
Review your isolation level requirements and adjust them appropriately to increase performance.
2.9.16 EJBs and servlets — same JVM — “No Local Copies”Because EJBs are inherently location independent, they use a remote programming model. Method parameters and return values are serialized over RMI-IIOP and returned by value. This is the intrinsic RMI Call By Value model.
Chapter 2. Overview of WebSphere Application Server V4.0 59

WebSphere provides the No Local Copies performance optimization for running EJBs and clients (typically servlets) in the same application server JVM. The No Local Copies option uses Call By Reference, and does not create local proxies for called objects when both the client and the remote object are in the same process. Depending upon the workload, this can significantly reduce overhead.
No Local Copies can be configured in WebSphere Application Server by adding the following two command line parameters to the application server JVM:
� Djavax.rmi.CORBA.UtilClass=com.ibm.CORBA.iiop.Util
� Dcom.ibm.CORBA.iiop.noLocalCopies=true
Figure 2-31 Pass by reference side effects of “No Local Copies”
Attention: The No Local Copies configuration option improves performance by changing Call By Value to Call By Reference for clients and EJBs in the same JVM.
One side effect of this is that the Java object derived (non-primitive) method parameters can actually be changed by the called enterprise bean, as shown in Figure 2-31.
60 DB2 UDB/WebSphere Application Tuning Guide

2.9.17 Remove stateful session beans when finishedInstances of stateful session beans have an affinity to specific clients. They will remain in the container until they are explicitly removed by the client, or removed by the container when they timeout.
The container may require writing out inactive stateful session beans to disk. This involves container overhead, and may also adversely impact application performance if the session needs to be read back from disk.
By explicitly removing stateful session beans when they have finished with it, applications will decrease the need for the container to write the session out to disk and thereby minimize container overhead.
Figure 2-32 shows an example of how to do so.
Figure 2-32 Remove stateful session beans when finished
Chapter 2. Overview of WebSphere Application Server V4.0 61

2.9.18 Avoid using Beans.instantiate() to create new bean instancesThe method java.beans.Beans.instantiate() creates a new bean instance by either retrieving a serialized version of the bean from disk, or creating a new bean if a serialized form does not exist. From a performance perspective, there is a cost associated with checking the file system to see whether a serialized version of the bean exists.
This overhead can be avoided by using new to create the instance.
Figure 2-33 shows the incorrect and worse performing way to create an instance of a class, while Figure 2-34 shows the correct and better performing way to create an instance of a class.
Figure 2-33 Wrong way to create a new bean instance
Figure 2-34 Correct way to create a new bean instance
62 DB2 UDB/WebSphere Application Tuning Guide

2.9.19 Ensure that session objects are serializableIn order to exploit WebSphere Application Server’ persistence management capabilities, applications should ensure that session objects are java.io.Serializable. Any instance variables of that object must also be java.io. Serializable, or defined as transient based on application design. Example 2-2 shows code that will not work with persistent sessions, while Example 2-3 shows the right way to enable persistent sessions.
Example 2-2 java.io.Serializable for persistent sessions — wrong way
Class MyAttribute implements java.io.Serializable{TypeA type;........}//Class TypeA{......}
Example 2-3 java.io.Serializable for persistent sessions — right way
option 1: Class TypeA implements java.io.Serializable{......}//option 2:Class MyAttribute implements java.io.Serializable{transient TypeA type;........
Another recommendation is to avoid storing a reference to a session in the attribute that is being put into session, or make it as transient7 and initialize on a request basis. Example 2-4 shows the wrong way to store session references, while Example 2-5 shows the right way.
Example 2-4 Storing session references in an attribute — wrong way
7 When an instance variable is defined as transient, then its value need not persist when an object is stored. Therefore, when the object is stored, the transient variable is not stored.
Chapter 2. Overview of WebSphere Application Server V4.0 63

Class MyAttribute implements java.io.Serializable
{HttpSession sess;........}
Example 2-5 Storing session references in an attribute — right way
option 1: Remove session variable definition from the class//option 2:Class MyAttribute implements java.io.Serializable{transient HttpSession sess;........
Another option is to consider using the Externalizable interface. With java.io.Serializable, the work of serialization and de-serialization is handled automatically for you when you store and restore an object. The Externalizable interface reduces serialization overhead, but the user is responsible for methods readExternal() and writeExternal() with “..implements java.io.Externalizable”
2.10 System tuning considerationsSystem related parameters can be considered WebSphere Application Server parameters that need to be adjusted on a general basis to support certain types of workloads, almost independently of the methods used during application development. In reality, application and system tuning tend to be synergistic in achieving optimal performance.
System tuning activity in WebSphere Application Server is divided into the following 3 broad categories:
� WebSphere Application Server queues considerations� WebSphere Application Server JVM memory considerations� Other considerations
These topics are covered briefly in the following sections.
2.10.1 WebSphere Application Server queues considerationsAn important rule of WebSphere Application Server tuning is to minimize the number of requests in WebSphere Application Server queues.
64 DB2 UDB/WebSphere Application Tuning Guide

In general, it is better for requests to wait in the network (in front of the Web server), than it is for them to wait in WebSphere Application Server. Such an approach results in only allowing requests into the WebSphere Application Server queuing network when they are ready to be processed. To ensure such a strategy, the WebSphere Application Server queues furthest upstream (closest to the client) should have settings slightly larger than the settings of queues downstream which should be progressively smaller.
Another consideration is that in many cases, only a fraction of the requests passing through one queue will enter the next queue downstream. For example, in a site with many static pages, many requests will be turned around at the Web server and will not pass to the Web container. The Web server queue can then be significantly larger than Web container queue.
Again, consider an application that spends 90 percent of its time in a complex servlet, and only 10 percent making a short JDBC query. This means that on average, only 10 percent of the servlets will be using database connections at any given time; the database connection queue can thus be made significantly smaller than the Web container queue. Conversely, if much of a servlet's execution time is spent making a complex query to a database, then consider increasing the thread pool size at both the Web container and the datasource. As always, monitor the CPU and memory utilization for both the WebSphere Application Server and database servers to ensure that CPU or memory is not being saturated.
Figure 2-35 shows a sample configuration setting with this strategy, where the settings for queues in this WebSphere Application Server Queuing Network are progressively smaller as work flows downstream.
Chapter 2. Overview of WebSphere Application Server V4.0 65

Figure 2-35 Minimizing queuing downstream, through upstream queuing
The example shows 200 clients arriving at the Web server. Because the Web server is set to handle 75 concurrent clients, 125 requests will remain queued in the network. As the 75 requests pass from the Web server to the Web container, 25 remain queued in the Web server, and the remaining 50 are handled by the Web container. This process progresses through the data source, until finally 25 users arrive at the final destination which is the database server. No component in this system will have to wait for work to arrive because, at each point upstream, there is some work waiting to enter that component. The bulk of the requests will be waiting outside WebSphere Application Server — in the network.
This adds to WebSphere Application Server stability since no component is overloaded. Waiting users can also be routed to other servers in a WebSphere Application Server cluster using routing software like the IBM Network Dispatcher.
DB2
UpStream Queuing
Network
Clients
ServletEngine(N = 50)
Data Source
(N = 25)
200
Arriving Requests
75
Arriving Requests
50
Arriving Requests
25
Arriving Requests
Waiting Requests
Waiting Requests
125
Waiting Requests
Web Server(N = 75)
25 25
Waiting Requests
Attention: Like any other tuning methodology, the settings of the values for these queues is determined through an iterative process that involves monitoring, analyzing and modifying the environment to meet previously defined performance objectives. The initial queue settings for a given and anticipated application workload may be derived using rules of thumb, generic benchmark results, or a regression test system that is a fairly close approximation of the anticipated production environment.
66 DB2 UDB/WebSphere Application Tuning Guide

WebSphere Application Server provides a Resource Analyzer tool to monitor the performance of the Web container, EJB container and the data source. It provides detailed performance data about the runtime and application resources, in tabular and graphical format.
Web container queuingFigure 2-11 on page 39 shows that Web container thread pool has three key settings of minimum size, maximum size and “Allow thread allocation beyond maximum” (Growable) flag. These three values determine the pool capacity. As mentioned earlier, the maximum thread size parameter specifies the maximum number of threads that can be pooled to handle requests sent to the Web container. Requests are sent to the Web container through any of the HTTP transports.
WebSphere Application Server creates this pool with the minimum size during start-up. Then based on the load, the pool grows till the specified maximum size. The Growable flag specifies whether the pool can grow beyond the maximum size. As the load falls, the excess threads beyond the minimum size are destroyed.
Resource Analyzer provides Web container thread pool performance data under the Thread Pool module. The Active Threads counter indicates the number of concurrent requests that are being processed by the Web Container. Web container pool usage and throughput graphs are available under each application server. The pool usage graph provides the number of active threads and pool size over time. The throughput graph provides Average Response Time and Throughput of the Web Container.
Figure 2-36 shows Resource Analyzer Web container pool usage and throughput graph when WebSphere Application Server was stressed with a particular application with 10, 20, 40, 80 and 160 concurrent clients. The Web container pool was configured with a minimum size of 10, maximum size of 50, and Growable flag set to false. The graph (pool size and active threads) shows how the pool grows to accommodate the increasing traffic, and the corresponding increase in average response time. The bottom graph (throughput and average response time) shows the Response time is increasing while the system maintains a steady throughput.
Chapter 2. Overview of WebSphere Application Server V4.0 67
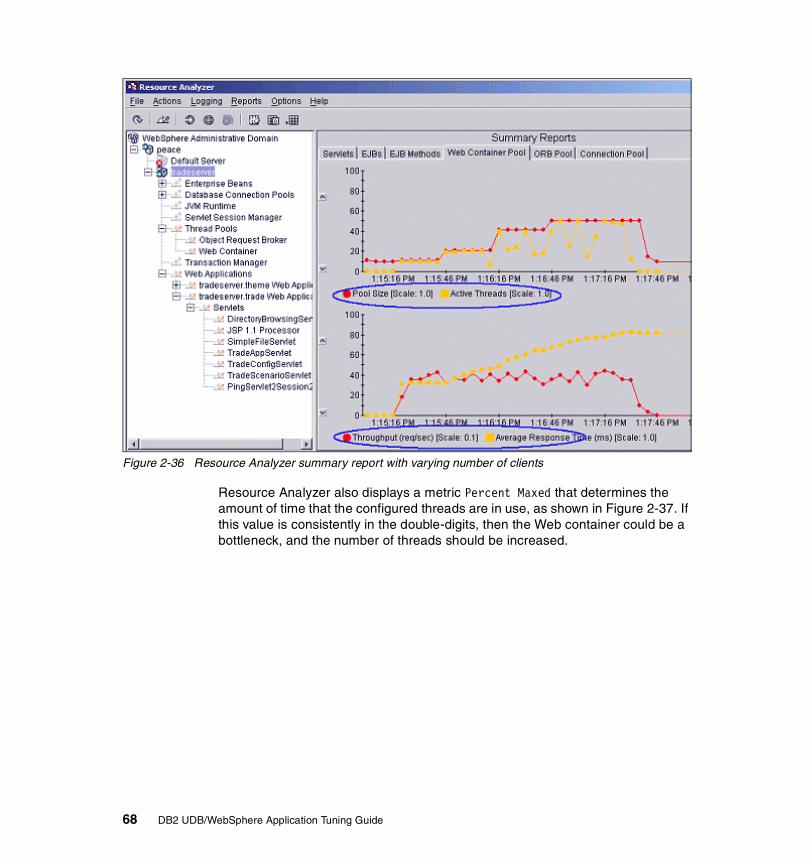
Figure 2-36 Resource Analyzer summary report with varying number of clients
Resource Analyzer also displays a metric Percent Maxed that determines the amount of time that the configured threads are in use, as shown in Figure 2-37. If this value is consistently in the double-digits, then the Web container could be a bottleneck, and the number of threads should be increased.
68 DB2 UDB/WebSphere Application Tuning Guide

Figure 2-37 Resource Analyzer Web container monitoring
EJB container queuingMethod invocations to EJBs are queued only if the client making the method call is remote, that is, if the EJB component client is running in a separate JVM from the enterprise bean. However, if the EJB component client (either a servlet or another enterprise bean) is installed in the same JVM, the EJB component method will run on the same thread of execution as the EJB client, and there will be no queuing.
Remote EJBs communicate uses the Remote Method Invocation/Internet Inter-ORB (RMI/IIOP) protocol. Method invocations initiated over RMI/IIOP will be processed by a server side ORB. The EJB container's thread pool will act as a queue for incoming requests. However, in the default case, if a remote method request is issued and there are no more available threads in the thread pool, then a new thread is created. After the method request completes the thread is destroyed. Therefore, when the ORB is used to process remote method requests, the EJB container is an open queue, because its use of threads is unbounded. Figure 2-38 depicts the two queuing options of EJB components.
Chapter 2. Overview of WebSphere Application Server V4.0 69

Figure 2-38 EJB queuing
When configuring the thread pool, it is important to understand the calling patterns of the EJB client. For example, if a servlet makes a small number of calls to remote enterprise beans and each method call is relatively quick, consider setting the number of threads in the ORB thread pool to a smaller value than the Web container's Max Concurrency settings.
The degree to which one should increase the ORB thread pool value is a function of the number of simultaneous servlets (clients) calling EJBs, and the duration of each method call. Hence, if the method calls are longer, one might consider making the ORB thread pool size equal to the Web container's Max Concurrency size because there will be little interleaving of remote methods calls.
Figure 2-39 illustrates two servlet-to-EJB component calling patterns that might occur in a WebSphere Application Server.
� Short-lived EJB calls: In this case, the servlet makes a few short-lived (quick) calls. In this model there will be interleaving of requests to the ORB. Servlets can potentially be reusing the same ORB thread. In this case, the ORB Thread pool can be small, perhaps even one half of the Max Concurrency setting of the Web container.
� Longer-lived EJB calls: In this case, the longer-lived EJB calls hold a connection to the remote ORB longer, and therefore, tie-up threads to the remote ORB. Therefore, one would need to configure more of a one-to-one relationship between the Web container and the remote ORB thread pools.
WebSphere Application ServerWebSphere Application Server
ORB Thread PoolORB Thread Pool
Web ContainerWeb Container
EJB ContainerEJB Container
REMOTE WebSphere REMOTE WebSphere Application ServerApplication Server
EJB ClientEJB Client
ServletServlet
Local requests queuedin the Web containerthreads
Remote requests queuedin the ORB Thread Pool
70 DB2 UDB/WebSphere Application Tuning Guide

Figure 2-39 Short lived EJB calls
Resource Analyzer can be used in finding the EJB methods that are most called and their average response time. Figure 2-40 shows all the EJB methods in the application sorted by their average response time.
Servlet service()BEGIN
Servlet service()ENDexecution timeline
Servlet service()BEGIN
Servlet service()ENDexecution timeline
Remote Call Remote Call
Remote Call Remote Call
ShortShort-lived-livedEJB callsEJB calls
LongerLonger-lived-livedEJB callsEJB calls
Chapter 2. Overview of WebSphere Application Server V4.0 71
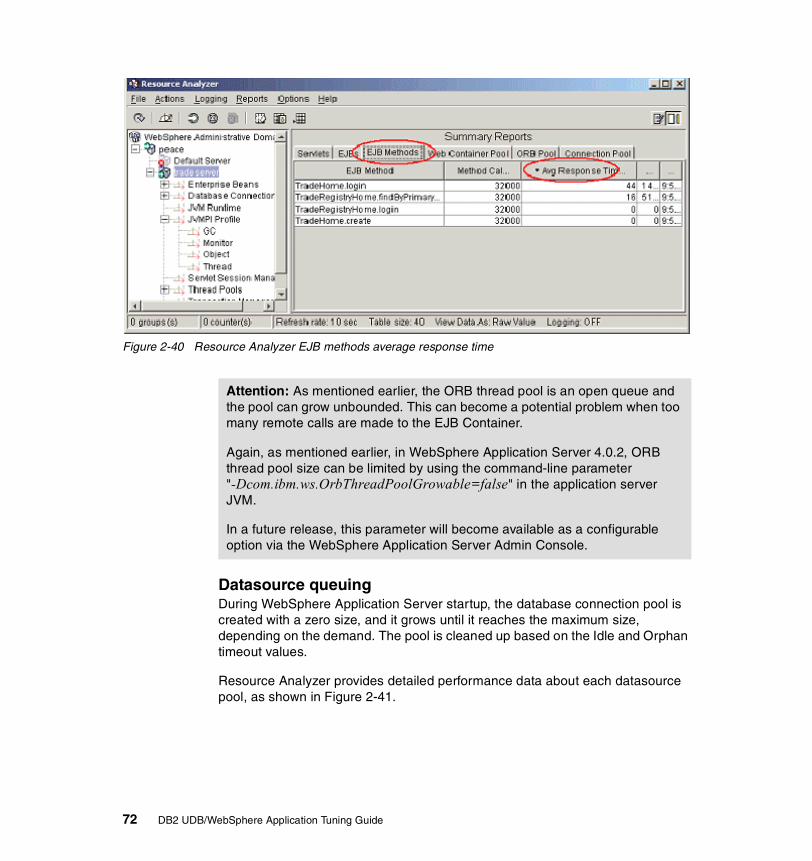
Figure 2-40 Resource Analyzer EJB methods average response time
Datasource queuingDuring WebSphere Application Server startup, the database connection pool is created with a zero size, and it grows until it reaches the maximum size, depending on the demand. The pool is cleaned up based on the Idle and Orphan timeout values.
Resource Analyzer provides detailed performance data about each datasource pool, as shown in Figure 2-41.
Attention: As mentioned earlier, the ORB thread pool is an open queue and the pool can grow unbounded. This can become a potential problem when too many remote calls are made to the EJB Container.
Again, as mentioned earlier, in WebSphere Application Server 4.0.2, ORB thread pool size can be limited by using the command-line parameter "-Dcom.ibm.ws.OrbThreadPoolGrowable=false" in the application server JVM.
In a future release, this parameter will become available as a configurable option via the WebSphere Application Server Admin Console.
72 DB2 UDB/WebSphere Application Tuning Guide
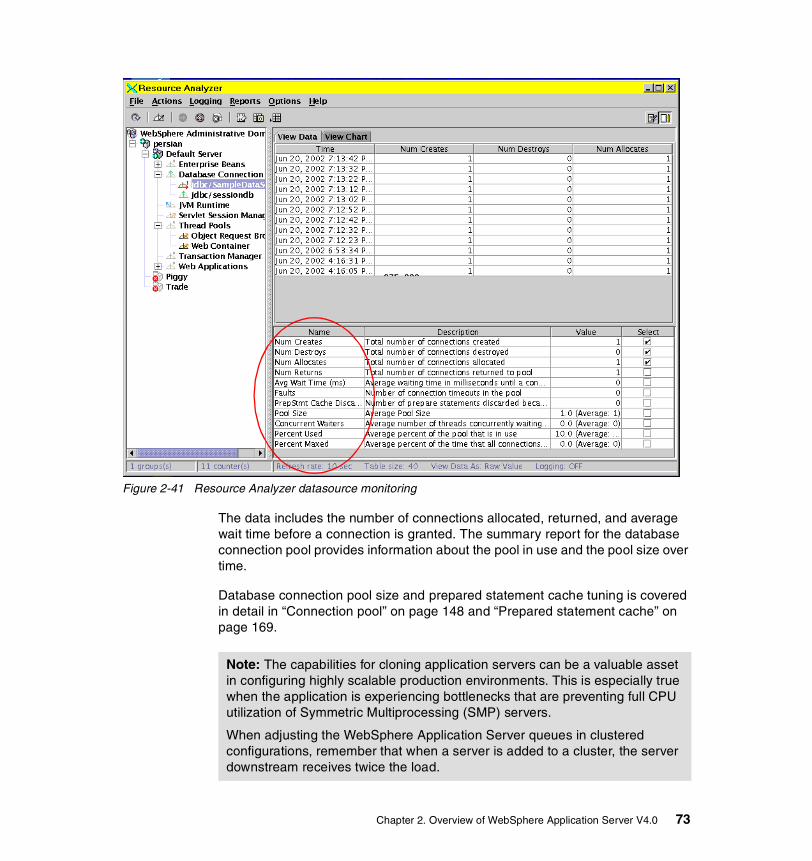
Figure 2-41 Resource Analyzer datasource monitoring
The data includes the number of connections allocated, returned, and average wait time before a connection is granted. The summary report for the database connection pool provides information about the pool in use and the pool size over time.
Database connection pool size and prepared statement cache tuning is covered in detail in “Connection pool” on page 148 and “Prepared statement cache” on page 169.
Note: The capabilities for cloning application servers can be a valuable asset in configuring highly scalable production environments. This is especially true when the application is experiencing bottlenecks that are preventing full CPU utilization of Symmetric Multiprocessing (SMP) servers.
When adjusting the WebSphere Application Server queues in clustered configurations, remember that when a server is added to a cluster, the server downstream receives twice the load.
Chapter 2. Overview of WebSphere Application Server V4.0 73

2.10.2 WebSphere Application Server JVM memory considerationsEnterprise applications written in the Java programming language often involve complex object relationships, and utilize large numbers of objects. Although Java automatically manages memory associated with an object’s life cycle, it is important to understand the object usage patterns of the application.
In particular, ensure that:
� The application is not over utilizing objects.� The application is not leaking objects, that is, memory.� Java heap parameters are set to handle object utilization.
Before discussing these topics, it is important to briefly understand the importance of Java garbage collection, and how to use it to as a way to gauge the health of the WebSphere Application Server application.
Garbage collectionJava garbage collection (GC) is one of the strengths of Java. By taking the burden of memory management away from the application writer, Java applications tend to be much more robust than applications written in non-garbage collected languages. This robustness applies as long as the application does not abuse objects.
Examining GC gives insights into how the application is utilizing memory. It is normal for GC to consume anywhere from 5% to 20% of the total execution time of a well-behaved WebSphere Application Server application. However, if GC is not kept under control, it can become the application's biggest bottleneck — this is especially true when running on SMP server machines.
By default, the JVM is configured to run GC asynchronously. Instead, GC can be run by an explicit request, or when JVM runs out of memory by using the -noasyncgc command-line option. An extremely time-sensitive application can deactivate asynchronous GC, and schedule its own cleanup periods. Note that this then becomes an implementation issue, as GC implementations are platform-dependent.
Attention: The potential problem with GC is that during the heap compaction phase of GC, all application work stops, because modern JVMs support a single-threaded compaction algorithm. During GC, not only are freed objects collected, but memory is also compacted to avoid fragmentation. Compaction activity is what forces Java technology to stop all other activity in the JVM.
74 DB2 UDB/WebSphere Application Tuning Guide

Use -verbosegc to analyze JVM memory usageThe -verbosegc parameter allows administrators to determine memory usage in order to improve reliability of the WebSphere Application Server. The frequency of GC and the time spent performing GC impacts the reliability of the JVM (the Java process).
Resource Analyzer provides GC and heap statistics to help evaluate application performance health. By monitoring GC, memory leaks and over utilization of objects can be detected. Figure 2-42 shows the GC related information collected by Resource Analyzer.
Figure 2-42 Resource Analyzer JVM memory monitoring
Detecting over utilization of objectsTo see if the application is overusing objects, look in Resource Analyzer at the counters for the JVMPI profiler.
The average time between GC calls should be 5 to 6 times the average duration of a single garbage collection. If not, the application is spending more than 15% of its time in garbage collection. Also, look at the numbers of freed, allocated and moved objects.
Chapter 2. Overview of WebSphere Application Server V4.0 75

If these numbers lead you to believe that over utilizing objects is leading to a GC bottleneck, there are two possible actions:
� The most cost effective remedy is to optimize your application by implementing object caches and pools. Use a Java profiler to determine which objects to target.
� If for some reason you can’t optimize your application, a potential solution is to add memory, processors and clones. Additional memory allows each clone to maintain a reasonable heap size. Additional processors allow the clones to run in parallel.
Detecting memory leaksMemory leaks in Java are a dangerous contributor to GC bottlenecks. They are worse than memory over utilization, because a memory leak will ultimately lead to system instability. Over time, GC will occur more and more frequently, until finally the heap gets exhausted, and Java fails with a fatal Out of Memory Exception.
Memory leaks occur when an object that is no longer needed continues to have references which are never deleted. This most commonly occurs in collection classes, such as Hashtable, because the table itself will always have a reference to the object, even when all “real” references have been deleted
Memory leaks must be fixed. The best way to fix a memory leak is to use a Java profiler that allows you to count the number of object instances. Object counts that exhibit unbounded growth over time indicate a memory leak.
The following considerations apply to memory leaks:
� Long-running test: Memory leak problems manifest only after a period of time; therefore, recognizing memory leaks is related to long-running tests.
� System test: Some memory leak problems occur only when different components of a big project are combined and executed.
� Repetitive test: In many cases, memory leak problems occur by successive repetitions of the same test case. Repetitive tests can be used at the system level or module level.
� Concurrency test: Some memory leak problems can occur only when there are several threads running in the application.
76 DB2 UDB/WebSphere Application Tuning Guide

Heap fragmentationIf heap consumption indicates a possible leak during a heavy workload (the application server is consistently near 100% CPU utilization), yet the heap appears to recover during a subsequent lighter or near-idle workload, this is an indication of heap fragmentation.
Heap fragmentation can occur when the JVM is able to free sufficient objects to satisfy memory allocation requests during garbage collection cycles, but does not have the time to compact small free memory areas in the heap into larger contiguous spaces. Another form of heap fragmentation occurs when small objects (less than 512 bytes) are freed. The objects are freed, but the storage is not recovered, resulting in memory fragmentation.
Heap fragmentation can be avoided by turning on the -Xcompactgc flag in the JVM advanced settings command line arguments. The -Xcompactgc ensures that each garbage collection cycle eliminates fragmentation, but with a small performance penalty.
Java Heap parametersIn general, increasing the size of the Java heap improves throughput until the heap no longer resides in physical memory. After the heap begins swapping to disk, Java performance deteriorates drastically. Therefore, the maximum heap size needs to be low enough to contain the heap within physical memory.
Physical memory usage must be shared between the JVM, and the other applications such as the database.
� Use a smaller heap (for example 64MB) on machines with less memory.
� Try a maximum heap of 128MB on a smaller machine (that is, less than 1GB of physical memory), 256MB for systems with 2GB memory, and 512MB for larger systems. The starting point depends on the application.
For production systems where the working set size of the Java applications is not well understood, an initial setting of one-fourth the maximum setting is a good starting value. The JVM will then try to adapt the size of the heap to the working set of the Java application.
There are two Java heap parameter settings:
� Initial Java heap size � Maximum Java heap size
Increasing these parameters creates more space for objects to be created. Because this space takes longer for your application to fill, the application will run longer before a GC occurs. However, a larger heap will also take longer to sweep for freed objects and compact. Hence garbage collection will also take longer.
Chapter 2. Overview of WebSphere Application Server V4.0 77

2.10.3 Other considerationsA number of other system related factors can impact performance. These are briefly described here.
Using Internal HTTP transportWebSphere Application Server 4.0 has an internal HTTP transport available at port 8080 that can be configured via the WebSphere Application Server Admin Console. By using the internal HTTP transport, Servlet/JSP requests can directly go to the Web container, and by-pass the WebSphere plug-in and IBM HTTP Server. However, the static content needs to be served by the Web Server.
The advantages of using an external HTTP server include:
� WLM support in the HTTP server plug-in which provides failover support, load distribution, and better scalability, as well as server affinity when HTTP sessions are used in the application.
� Security via the HTTP server plug-in, and the ability to add a physical layer machine as well as a firewall between the HTTP server machine and the machines running the application server.
Relax auto reloadsAn important rule of WebSphere Application Server tuning is to turn off, or greatly relax, all dynamic reload parameters. When an application's resources such as servlets and enterprise beans are fully deployed, it is not necessary to aggressively reload these resources as one would during application development.
For a production system, it is common to reload resources only a few times a day. In WebSphere Application Server, there are two types of auto reloading:
Note: The internal HTTP Transport does not have the full power of the IBM HTTP Server, and its performance will not be as good as that of the IBM HTTP Server.
Note: It would be possible for an application going directly to the Web container internal HTTP server to perform better than an application going through an external HTTP server and plug-in, with the caveats mentioned above.
78 DB2 UDB/WebSphere Application Tuning Guide
� Web application module:
Each Web application has the ability to dynamically reload servlets and JSPs. This is useful when upgrading to a new version of a given servlet or JSP. The reload interval of a Web application module is specified in the application EAR file. It can be configured easily using WebSphere Application Assembly Tool (AAT). The reload setting are available under the IBM Extensions tab of the Web module.
Either set the Reload Interval to a very large value or set the Reloading Enabled field to False.
� Web server configuration:
WebSphere Application Server administration tracks a variety of configuration information about WebSphere Application Server resources. Some of this information needs to be understood by the Web server as well, such as uniform resource identifiers (URIs) pointing to WebSphere Application Server resources. This configuration data is pushed to the Web server via the WebSphere plug-in. This allows new servlet definitions to be added without having to restart any of the WebSphere Application Server servers. But this dynamic regeneration of this configuration information is an expensive operation.
A refresh interval setting in websphere_root/config/plugin-cfg.xml defines the interval between these updates.
Entity EJB — bean cacheWebSphere Application Server provides significant flexibility in the management of database data with Entity EJBs. The Entity EJBs Activate At and Load At configuration settings specify how and when to load and cache row data from the corresponding database of an enterprise bean.
These configuration settings provide the capability to specify enterprise bean commit options A, B or C, as specified in the EJB 1.1 specification.
Commit option A This provides maximum enterprise bean performance by caching database data outside of the transaction scope. Generally, commit option A is only applicable where the EJB container has exclusive access to the given database. Otherwise, data integrity is compromised.
Commit option B This provides more aggressive caching of Entity EJB object instances, which can result in improved performance over commit option C, but also results in greater memory usage.
Commit option C This is the most common real-world configuration for Entity EJBs.
Chapter 2. Overview of WebSphere Application Server V4.0 79

The Bean cache - Activate At setting specifies the point at which an enterprise bean is activated, and placed in the cache. Removal from the cache and passivation is also governed by this setting. Valid values are Once and Transaction. The default value is Transaction.
� Once indicates that the bean is activated when it is first accessed in the server process, and passivated (removed from the cache) at the discretion of the container, for example, when the cache becomes full.
� Transaction indicates that the bean is activated at the start of a transaction and passivated (removed from the cache) at the end of the transaction.
The Bean cache - Load At setting specifies when the bean loads its state from the database. The value of this property implies whether the container has exclusive or shared access to the database. Valid values are Activation and Transaction. The default is Transaction.
� Activation indicates the bean is loaded when it is activated (Once or Transaction) and implies that the container has exclusive access to the database.
� Transaction indicates that the bean is loaded at the start of a transaction and implies that the container has shared access to the database. The settings of the Activate At and Load At properties govern which commit options are used.
The following recommendations apply for the various commit options:
� Commit option A (implies exclusive database access):
Use Activate At = Once and Load At = Activation.
This option reduces database input/output (avoids calls to the ejbLoad function) but serializes all transactions accessing the bean instance. Option A can increase memory usage by maintaining more objects in the cache, but can provide better response time if bean instances are not generally accessed concurrently by multiple transactions.
� Commit option B (implies shared database access):
Use Activate At = Once and Load At = Transaction.
Option B can increase memory usage by maintaining more objects in the cache. However, because each transaction creates its own copy of an object, there can be multiple copies of an instance in memory at any given time (one per transaction), requiring the database be accessed at each transaction. If an enterprise bean contains a significant number of calls to the ejbActivate function, using option B can be beneficial because the required object is already in the cache. Otherwise, this option does not provide significant benefit over option A.
80 DB2 UDB/WebSphere Application Tuning Guide

� Commit option C (implies shared database access):
Use Activate At = Transaction and Load At = Transaction.
This option can reduce memory usage by maintaining fewer objects in the cache, however, there can be multiple copies of an instance in memory at any given time (one per transaction). This option can reduce transaction contention for enterprise bean instances that are accessed concurrently but not updated.
EJB isolation levelsIsolation level settings specify various degrees of runtime data integrity provided by the corresponding database.
Isolation level plays an important role in performance. Higher isolation levels reduce performance by increasing row locking and database overhead resulting in reduced concurrency. Different vendor databases provide different behavior with respect to the isolation settings.
Isolation level can be specified at the bean or method level. Therefore, it is possible to configure different isolation settings for various methods. This is an advantage when some methods require higher isolation than others, and can be used to achieve maximum performance while maintaining integrity requirements.
Figure 2-43 shows how the isolation level and access intent attributes may be set in the Application Assembly Tool.
Restriction: Isolation cannot change between method calls within a single enterprise bean transaction. A runtime exception will be thrown in this case.
Chapter 2. Overview of WebSphere Application Server V4.0 81

Figure 2-43 Setting isolation level attributes in the Application Assembly Tool
Table 2-1 shows the correspondence between EJB and DB2 isolation levels:
Table 2-1 EJB and DB2 Isolation levels
EJB isolation level DB2 isolation level Description
Serializable Repeatable Read Prohibits dirty reads, nonrepeatable reads and phantom reads.
Repeatable read Read Stability Prohibits dirty reads and nonrepeatable reads, but it allows phantom reads.
Read committed Cursor Stability Prohibits dirty reads, but allows nonrepeatable reads and phantom reads.
82 DB2 UDB/WebSphere Application Tuning Guide

In general, Repeatable Read or Read Committed is an appropriate setting for DB2 databases.
The container uses the transaction isolation level attribute as follows:
� Session beans and entity beans with BMP: For each database connection used by the bean, the container sets the transaction isolation level at the start of each transaction, unless the bean explicitly sets the isolation level on the connection.
� Entity beans with CMP: The container generates database access code that implements the specified isolation level.
EJB access intentWhen deploying CMP beans it is possible to specify the access intent for every remote method in the bean. This field may have a value of read or update. This access intent setting is used to denote whether the method can update entity attribute data (or invoke other methods that can update data in the same transaction). The EJBStore operation will only be performed for methods that are marked as update. Figure 2-43 shows how this value may be set in the Application Assembly Tool. The default value for this setting is update.
Letting the access intent default to update for EJB methods that are read only can result in unnecessary locking, as well as negatively impact concurrency and throughput of the application. It is therefore important to let the EJB Server know which EJB methods are read only, and which ones are update.
Read uncommitted Uncommitted Read Allows dirty reads, nonrepeatable reads, and phantom reads.
Dirty reads: A transaction reads a database row containing uncommitted changes from a second transaction.Nonrepeatable reads: One transaction reads a row, a second transaction changes the same row and commits, and the first transaction rereads the row and gets a different value.Phantom reads: One transaction reads all rows that satisfy an SQL WHERE condition, a second transaction inserts a row that also satisfies the WHERE condition and commits, and the first transaction applies the same WHERE condition and gets the row inserted by the second transaction
Note: Choosing a high isolation level (like SERIALIZABLE) can lead to deadlocks.
EJB isolation level DB2 isolation level Description
Chapter 2. Overview of WebSphere Application Server V4.0 83

A more detailed discussion about the impact of access intent settings on database concurrency is provided in “Enterprise Java Beans” on page 209.
Remote method call-by-value vs call-by-referenceThe EJB specification states that method calls are to be call-by-value. That is, in the process of making a remote method call, a copy of the parameters in question are made before a remote method call is made. This copying action in the call-by-value semantic can be expensive.
In WebSphere Application Server, it is possible to specify call-by-reference, which passes the original object reference without making a copy of the object. This can be particularly beneficial in cases where the EJB client and EJB server are installed in the same WebSphere Application Server instance. Specifying call-by-reference can improve performance up to 50 percent or higher depending on the complexity of the objects.
The ORB call by reference settings can be found under Services Tab-Object Request Broker for each application server in WebSphere Application Server Advanced Edition 4.0 Admin Client.
Attention: IBM developed a utility, CmpOPT, that analyzes the Java bytecode for remote methods defined for CMP beans. CmpOPT loads CMP beans and any classes they reference and detects object mutability of all fields defined as container-managed for the entity. Then it updates the deployment descriptor with the appropriate access intent. CmpOPT is available as part of WebSphere Application Server 4.0.3.
Note: Call-by-reference only helps performance in the case where non-primitive object types are being passed as parameters.
Call-by-reference can be dangerous and sometimes lead to unexpected results if not handled properly. A case in point is when an object reference is modified by the remote method resulting in unexpected side effects
84 DB2 UDB/WebSphere Application Tuning Guide

Dynamic fragment cachingDynamic fragment caching is the ability to cache the output of dynamic servlets and JSP files, a technology that can significantly improve application performance. This cache, working within the JVM of an application server, intercepts calls to a servlet service() method, checking whether it can serve the invocation from the cache rather than re-execute the servlet.
Because J2EE applications have high read-write ratios and can tolerate a small degree of latency in the freshness of their data, fragment caching can help achieve significant gains in server response time, throughput and scalability.
Once a servlet has been executed (generating the output that will be cached), a cache entry is generated containing that output. Also generated are side effects of the execution (that is, invoking other servlets or JSP files), as well as metadata about the entry, including time out and entry priority information.
Unique entries are distinguished by an ID string generated from the HttpServletRequest object for each invocation of the servlet. This results in a servlet being cached depending on request parameters that the URI used to invoke the servlet or session information.
Because JSP files are compiled by WebSphere Application Server into servlets, JSPs and servlets are used interchangeably (except when declaring elements within an XML file).
Hardware considerationsHardware configurations used by WebSphere Application Server will obviously have significant impact on performance.
� Processor speed: Ideally, other bottlenecks have been removed where the processor is waiting on events like input/output and application concurrency. In this case, increasing the processor speed often helps throughput and response times.
� System memory: In general, increasing memory to prevent the system from paging memory to disk is likely to improve performance. Allow at least 512MB memory for each processor. Try adjusting the parameter when the system is paging (and processor utilization is low because of the paging).
Network considerationsRun network cards and network switches at full duplex. Running at half duplex decreases performance. Verify the network speed can accommodate the required throughput. Make sure that 100MB is in use on 10/100 Ethernet networks.
Note: The default for dynamic fragment caching is “disabled”.
Chapter 2. Overview of WebSphere Application Server V4.0 85

2.11 Monitoring and tuning toolsWebSphere Application Server provides an infrastructure, tools, logs and traces to help monitor and tune its environment. These are briefly described here as follows:
� Performance Monitoring Infrastructure (PMI)� Resource Analyzer� Performance monitoring servlet� Logs� Traces� Log Analyzer� JVM Profiling Interface (JVMPI)� Performance wizard
2.11.1 PMIPMI is a set of packages and libraries designed to assist with gathering, delivering, processing and displaying performance data in WebSphere Application Server domains.
PMI uses a client/server architecture. In PMI terms, a server is any application that uses the PMI API to collect performance data. Servers can include application servers, Web servers, and Java applications. WebSphere Application Server provides a service named PmiService that is responsible for retrieving performance data from other servers in the domain and making the data available to interested clients.
A client is an application that receives performance data from a server or servers and processes the data. Clients can include graphical user interfaces (GUIs) that display performance data in real time, applications that monitor performance data and trigger different events according to the current values of the data, or any other application that needs to receive and process performance data. The role of PmiService in collecting and distributing performance data is shown in Figure 2-44.
86 DB2 UDB/WebSphere Application Tuning Guide

Figure 2-44 Performance monitoring infrastructure
Each piece of performance data has two components, a static component and a dynamic component. The static component consists of a name and an ID to identify the data, as well as other descriptive attributes that assist the client in processing and displaying the data. The dynamic component consists of information that changes over time, such as the current value of a counter and the time stamp associated with that value.
2.11.2 Resource AnalyzerResource Analyzer is a stand-alone runtime performance monitor for WebSphere Application Server. It provides a Graphical User Interface (GUI) console that is available on Windows and UNIX platforms. Resource Analyzer can also be used remotely and across platforms. Another ability of this tool is to record the collected information and replay it without connecting to WebSphere Application Server.
Resource Analyzer retrieves performance data by periodically polling the PmiService inside the WebSphere Application Server. The performance data requested by Resource Analyzer is provided by the PmiService (session bean inside administrative server). PmiService fetches the performance data directly from the application servers without storing it.
Java Client
Web Client
Provider (Application
server)
Provider(Application
server)
servlet
Collector (AE)
Admin server
Java classes
RMI/IIOP
HTTP
list node entity bean
Perf data
Perf data
PMI session bean
list server entity bean
PMI Client
Resource Analyzer
Chapter 2. Overview of WebSphere Application Server V4.0 87

You can regulate the impact incurred from data collection by using the Resource Analyzer or the WebSphere Administrative Console. The resources in a WebSphere administrative domain are instrumented so that statistical data can be collected. Instrumentation refers to the mechanism by which some aspect of the running system is measured (analogous to a meter attached to a resource).
Each resource category has an instrumentation level. The instrumentation level determines which counters/information is available to be collected for that category. For example:
� If a resource category has an instrumentation level setting of low, only counters/information having a low impact rating are available for selection.
� If the instrumentation level is set to medium, then counters having low impact and medium impact ratings are available for selection.
� If the instrumentation level is set to high, all counters with low, medium, and high impact ratings are available for selection.
� An instrumentation level also can be set to maximum, which enables the availability of all counters and, in addition, increases the level of granularity when reporting on enterprise methods. This setting has a higher impact on a system's performance.
� The instrumentation level can be set to none, which disables performance reporting and eliminates any impact of monitoring on system performance.
Figure 2-45 shows an example of setting the performance monitoring levels for the JVM runtime.
Attention: Initially, the instrumentation levels are set to none.
88 DB2 UDB/WebSphere Application Tuning Guide

Figure 2-45 Performance monitoring settings
The Resource Analyzer’s GUI provides controls that enable you to choose the particular resources and counters to include in the view. There are table and chart views available. You can also store retrieved data in a log file while viewing the data. This log file can later be used for replaying the scenario.
The Resource Analyzer provides access to a wide range of performance data for two kinds of resources:
� Application resources (for example, enterprise beans and servlets).
� WebSphere runtime resources (for example, Java Virtual Machine (JVM) memory, application server thread pools, and database connection pools).
Performance data includes simple counters, statistical data (such as the response time for each method invocation of an enterprise bean), and load data (such as the average size of a database connection pool during a specified time interval). This data is reported for individual resources and aggregated for multiple resources.
Chapter 2. Overview of WebSphere Application Server V4.0 89

Each resource category (module) has his own set of performance data counters. Those counters have particular properties, for example the rating impact and data type. A complete list of all performance data counters for each resource category is included in the InfoCenter article, “Performance data reported with the Resource Analyzer“.
Depending on which aspects of performance are being measured, you can use the Resource Analyzer to accomplish the following tasks:
� View data in real time or view historical data from log files.
� View data in chart form, allowing comparisons of one or more statistical values for a given resource on the same chart. In addition, different units of measurement can be scaled to enable meaningful graphic displays.
� Record current performance data in a log and replay performance data from previous sessions.
� Compare data for a single resource to an aggregate (group) of resources on a single node.
Given all this data, the Resource Analyzer can be used to do the following types of analysis:
� Monitor real-time performance, such as response times for servlet requests or enterprise bean methods.
� Detect trends by analyzing logs of data over time.
� Determine the efficiency of a configuration of resources (such as the amount of allocated memory, the size of database connection pools, and the size of a cache for enterprise bean objects).
� Gauge the load on application servers and the average wait time for clients.
Attention: Collecting data from WebSphere Application Server and runtime resources always affects the performance in some way and the impact itself varies depending on the counter. Resource Analyzer represents the overhead cost associated with each counter as a rating of low, medium, or high:
� If a counter has a low cost rating, its performance cost is minor and usually involves a single addition or subtraction.
� A counter with a high cost rating has a higher performance impact.
� A high cost rating usually indicates that several calculations, including multiplication, division, or both, are involved in gathering the data for the counter.
90 DB2 UDB/WebSphere Application Tuning Guide

2.11.3 Performance monitoring servletThe performance servlet provides a way to use an HTTP request to query the performance metrics for an entire WebSphere Application Server administrative domain.
The performance servlet is used for simple end-to-end retrieval of performance data that can be consumed by any tool, provided by either IBM or a third-party vendor. Because the servlet provides the performance data via HTTP, it can be used with firewalls.
The performance servlet uses the PMI infrastructure to retrieve the performance information from WebSphere Application Server. PMI is used by the Resource Analyzer as well. Therefore, it is subject to the same restrictions on the availability of data as the Resource Analyzer.
The performance monitoring servlet is bundled as an EAR file that can be found at <WAS_HOME>/installableApps/perfServletApp.ear.
In order to use the performance monitoring servlet, install that EAR file into an existing application server. After starting the enterprise application containing the performance monitoring servlet, you can retrieve performance data from the entire domain.
2.11.4 Logs WebSphere logs provide information about WebSphere Application Server components, including the administrative server and clients, application servers and other processes in the environment, as they initialize and run. They cause low-to-medium performance impact and can be reviewed after an error or problem condition occurs. Logs are always enabled.
The following lists some of the logs available:
� Administrative server logs: These are included in the <WAS_HOME>/logs directory by default:
– tracefile– nanny.trace– adminserver_stderr.log
� Application server logs: WebSphere Application Server creates standard output and standard error logs for each application server. They contain application server communication. The location and name of the standard output and standard error files are defined by the WebSphere Application Server administrator.
Chapter 2. Overview of WebSphere Application Server V4.0 91

� Activity log: This captures events that show a history of WebSphere Application Server’ activities. When you encounter WebSphere Application Server runtime errors, it is useful to use Log Analyzer to read the activity log and try to diagnose the problem,.
� WebSphere plug-in trace log: It is created by the WebSphere plug-in running in the Web server process, and it contains error and informational messages such as Web server startup and server status change requests. The default WebSphere plug-in log file is <WAS_HOME>/logs/native.log.
2.11.5 TracesTraces provide more detailed information about WebSphere components to determine what is wrong with your environment but may impact performance rather severely. It is useful when the log files do not provide sufficient information to diagnose the problem.
Tracing can be invoked from the WebSphere Application Server Admin Console for a particular application server, as shown in Figure 2-46 and Figure 2-47.
Figure 2-46 Application Server Properties window
92 DB2 UDB/WebSphere Application Tuning Guide
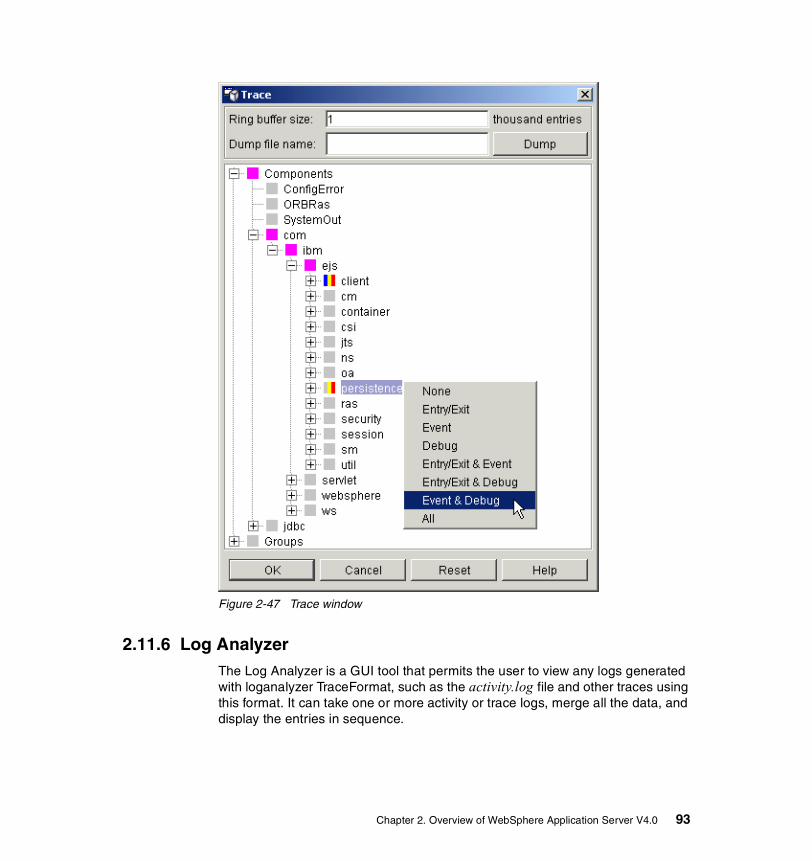
Figure 2-47 Trace window
2.11.6 Log AnalyzerThe Log Analyzer is a GUI tool that permits the user to view any logs generated with loganalyzer TraceFormat, such as the activity.log file and other traces using this format. It can take one or more activity or trace logs, merge all the data, and display the entries in sequence.
Chapter 2. Overview of WebSphere Application Server V4.0 93

More importantly, this tool is shipped with an XML database, the symptom database, which contains strings for some common problems, reasons for the errors, and recovery steps. The Log Analyzer compares every error record in the log file to the internal set of known problems in the symptom database and displays all the matches. This allows the user to get error message explanations and information such as why the error occurred and how to recover from it, as shown in Figure 2-48.
Figure 2-48 Log Analyzer
2.11.7 JVMPIAll the performance monitoring tools that use PMI, such as Resource Analyzer and performance monitoring servlet, are able to use the Java Virtual Machine Profiler Interface (JVMPI) to enable a more comprehensive performance analysis. This profiling tool enables the collection of information, such as garbage collection data, about the JVM that runs the application server.
SymptomDatabaseXML File
IBMSupport
ProblemDiagnosis
LogAnalyzer
ActivityLog
94 DB2 UDB/WebSphere Application Tuning Guide

JVMPI is a two-way function call interface between the JVM and an in-process profiler agent. The JVM notifies the profiler agent of various events, such as heap allocations and thread starts. The profiler agent can activate or inactivate specific event notifications, based on the needs of the profiler.
The JVM Profiler Interface provides internal runtime performance data about the following resources:
� Garbage collector:
– Number of garbage collection calls– Average time in milliseconds between garbage collection calls– Average duration in milliseconds of a garbage collection call
� Monitor:
– Number of times that a thread waits for a lock– Average time that a thread waits for a lock
� Object:
– Number of objects allocated– Number of objects freed from heap– Number of objects moved in heap
� Thread:
– Number of threads started– Number of threads died
JVMPI reporting can be enabled for each individual application server from the WebSphere Application Server Admin Console via the Properties —> JVM Settings —>Advanced JVM Settings.
2.11.8 Performance tuner wizardThe Performance tuner wizard is a tool included in WebSphere Application Server Advanced Edition that includes the most common performance related settings associated with the application server.
Use Performance Tuner Wizard to optimize the settings for applications, servlets, enterprise beans, data sources and expected load.
Parameters that can be set include:
� Web container: Maximum thread size
� ORB properties: Pass-by-reference, ORB thread pool size
� Data source: Connection pool size, statement cache size
Chapter 2. Overview of WebSphere Application Server V4.0 95
� Database (DB2 only): This calls the DB2SmartGuide, which, in turn, tunes the DB2 database associated with the data source
� Java Virtual Machine (JVM): Initial and maximum heap size
Performance wizard can be invoked from the WebSphere Application Server Admin Console as Console —> Wizards —> Performance Tuner.
96 DB2 UDB/WebSphere Application Tuning Guide
Chapter 3. Overview of DB2 UDB 8
In this chapter, we provide an overview of the architecture of DB2 UDB, and introduce some of DB2’s key application tuning, and system tuning related parameters. We also describe some of the monitoring tools available. However, readers are strongly urged to consult other documentation identified in 3.4, “Application tuning considerations” on page 108, and 3.5, “System tuning considerations” on page 124 for specific details on tuning a DB2 UDB environment.
The topics covered include:
� Introduction� DB2 architecture overview� Tuning DB2� Application tuning considerations� System tuning considerations� Monitoring and tuning tools� Problem diagnosis introduction
3
© Copyright IBM Corp. 2003 97
3.1 IntroductionDB2 is IBM’s flagship multimedia Web ready relational database management system (RDBMS), that is available on a range of platforms including the zSeries (formerly S/390), pSeries (UNIX), xSeries (Intel) and iSeries (AS/400). With a 96% share of the mainframe market, and rapid growth on distributed platforms, DB2 UDB is the market leader. Approximately 400 Web integrators work with DB2 UDB and a full 70% of the world’s corporate data resides on DB2. DB2 powers 7.7 billion transactions daily for 40 million users in more than 300,000 companies world wide — a testament to its outstanding performance.
Besides platform independence and performance, DB2 has considerable strengths in support of Internet architecture, scalability and availability.
� Internet architecture:
DB2 UDB was the first relational database to ship built-in support for Java (for writing user-defined functions and stored procedures), and for JDBC. DB2 was also the first RDBMS to have built-in support for SQLJ for static SQL via Java programs.
DB2’s integration with WebSphere and its enterprise Java support extends this capability even further. Enterprise JavaBeans (EJB) and Java servlets are supported in this integrated environment, as are distributed Java-based transactions via JDBC Version 2, and the Java Transaction APIs. XML support is provided via a no-charge XML Extender to DB2, that includes an XML-aware text search, an XML datatype, and complete integrated XML management capabilities. The DB2 Text Extender has been enhanced to perform XML-aware searches as well.
� Scalability/availability:
DB2 has vastly different approaches to high-end scalability. DB2 favors a shared nothing approach on UNIX, OS/2 and Windows, and a shared memory (with integrated hardware assistance). A shared memory or shared cache architecture creates the need to solve complex high-volume transaction traffic management problems,
For high availability, IBM’s zSeries is widely recognized as the ultimate in reliability. On UNIX and Windows platforms, DB2 integrates with IBM AIX HACMP to provide failover support.
In addition to the above capabilities, DB2 is easy to manage, and its product quality helps lower maintenance and total cost of ownership.
DB2 is therefore very well positioned to support the most demanding requirements of mission critical e-business applications of large and small companies alike.
98 DB2 UDB/WebSphere Application Tuning Guide

3.2 DB2 architecture overviewFigure 3-1 provides an overview of the architecture and processes of DB2 UDB. Each client application is linked with the DB2 client library, and communicates with the DB2 Server using shared memory, or a communication protocol such as TCP/IP (remote clients). The key components are briefly described here.
Figure 3-1 DB2 architecture overview
3.2.1 DB2 agentsDB2 agents include coordinator agents and subagents, and are the most common type of DB2 processes which carry out the bulk of SQL processing on behalf of applications. DB2 assigns a coordinator agent with an application, and this agent coordinates the communication and processing for this application.
Disks
Clients
DB2 UDB Server
Prefetchers
Page Cleaners
Log
Logger
Coordinator Agent
Subagents
Shared Memory+Semaphore, TCP/ IP, APPC, IPX/ SPX, Named Pipe, NetBIOS
Buffer Pool(s)
Write Log Requests
Async IO Prefetch Requests
Scatter/Gather I/Os
DB2 UDB Client Library
Client Application
Log Buffer
Parallel, Page write requests
Parallel,Big-Block, read requests
Common prefetch request queueSubagents
Coordinator Agent
Deadlock Detector
Victim notifications
Chapter 3. Overview of DB2 UDB 8 99

If intra-partition parallelism is disabled (this is the default), then the coordinator agent performs all the application’s requests. If intra-partition parallelism is enabled, then DB2 assigns a set of subagents to the application to work on processing the application requests.
The following database manager configuration parameters determine how many database agents are created and how they are managed.
The MAXAGENTS parameter is the maximum number of database manager agents that can be working at any one time, including coordinator agents, subagents, inactive agents, and idle agents.
The MAXCAGENTS parameter is the maximum number of database manager agents that can be concurrently executing a database manager transaction. This parameter is used to control the load on the system during periods of high simultaneous application activity. This can be useful in an environment where you have a large number of connections but with a limited amount of memory to serve those connections. Adjusting this parameter can limit the number of database manager agents that can be processed concurrently at any one time, thereby limiting the usage of system resources during times of peak processing.
The MAXAPPLS parameter is the maximum number of applications that may simultaneously connect to a single database. It affects the amount of memory that might be allocated for agent private memory and application global memory for that database. It can be set to AUTOMATIC in DB2 Version 8, which allows you to create any number of databases, and memory usage will grow accordingly.
The MAX_CONNECTIONS (MAX_LOGICAGENTS in previous versions of DB2) is the maximum number of client connections to a database. When the connection concentrator is enabled, this parameter works a little differently. See “Connection concentrator” on page 101.
Note: For DSS types of workloads, we recommend enabling intra-partition parallelism for multi-processor DB2 servers, since parallel processing of multiple subagents has the potential to significantly improve the performance of complex queries.
However, we strongly suggest disabling intra-partition parallelism for OLTP type workloads, since it has the potential to negatively impact performance.
Note: The default setting for MAXAPPLS in DB2 Version 8 is AUTOMATIC.
100 DB2 UDB/WebSphere Application Tuning Guide

The MAX_COORDAGENTS parameter is the maximum number of database manager coordinator agents or application requests that can be processed at any one time. One coordinating agent is acquired for each local or remote application that connects to a database or attaches to an instance.
The NUM_POOLAGENTS parameter is the total number of agents, including active agents and agents in the agent pool, that are kept available in the system. The default value for this parameter is half the number specified for MAXAGENTS.
The NUM_INITAGENTS parameter is the total number of worker agents that are created when the database manager is started. This speeds up performance for initial queries. The worker agents all begin as idle agents.
Connection concentratorFor internet applications with many simultaneous user connections, the connection concentrator may improve performance by allowing many more client connections to be processed efficiently. It also reduces memory use for each connection, and decreases the number of context switches.
Note: The value of MAXCAGENTS should be at least the sum of the values for MAXAPPLS in each database allowed to be accessed concurrently.
Remember, each additional agent requires some resource overhead that is allocated at the time the database manager is started.
Note: On UNIX, the ps command identifies coordinator agent processes as db2agent, while subagent processes are identified as db2agntp.
Tip: For DSS type of workloads, we recommend that you set NUM_POOLAGENTS to a small value to avoid having an agent pool that is full of idle agents.
However, if you run an OLTP environment in which many applications are concurrently connected, increase the value of NUM_POOLAGENTS to avoid the costs associated with the frequent creation and termination of agents.
Note: The connection concentrator feature is new in DB2 Version 8 and is OFF by default. In order to use this feature, you must be using a partitioned database, or have enabled the INTRA_PARALLEL database manager parameter.
Chapter 3. Overview of DB2 UDB 8 101

The MAX_CONNECTIONS parameter determines the maximum size of the idle agent pool. If more agents are created than is indicated by the value of this parameter, they will be terminated when they finish executing their current requests, rather than be returned to the pool.
Connection concentrator is enabled when MAX_CONNECTIONS is greater than MAX_COORDAGENTS. In this case, there may be more connections than coordinator agents to service them. An application is in an active state only if there is a coordinator agent servicing it. Otherwise, the application is in an inactive state. Requests from an inactive application will be queued until a database coordinator agent is assigned to service the application.
With connection concentrator enabled, the MAX_CONNECTIONS parameter will be used as a guideline for how large the agent pool will be when the system work load is low. A database agent will always be returned to the pool, no matter what the value of MAX_CONNECTIONS parameter is. Based on the system load and the time agents remain idle in the pool, the logical agent scheduler may terminate as many of them as necessary to reduce the size of the idle pool to this parameter value. As a result, both of these parameters can be used to control the load on the system. Figure 3-2 describes the connection concentrator concept.
Figure 3-2 Connection concentrator concept
For usage examples, see Chapter 8 of the IBM DB2 UDB Administration Guide: Performance, SC09-4821.
N Client Connections
Page Cleaners and Prefetchers
Tablespaces
Bufferpool(s)
N Coordinator Agents
N Client Connections
f(N) Subagents
Page Cleaners and Prefetchers
Bufferpool(s)
K Coordinator Agents
f(K) Subagents
Tablespaces
Enable by setting MAX_CONNECTIONS > MAX_COORDAGENTS, e.g.:
UPDATE DBM CFG USING MAX_CONNECTIONS 5000 MAX_COORDAGENTS 500
102 DB2 UDB/WebSphere Application Tuning Guide

3.2.2 Buffer poolsA buffer pool is an area of memory into which database pages of user table data, index data and catalog data are temporarily moved from disk storage. DB2 agents read and modify data pages in the buffer pool. The buffer pool is a key influencer of overall database performance, because data can be accessed much faster from memory than from a disk. If more of the data needed by applications is present in the buffer pool, then less time would be needed to access this data, thereby improving performance.
Buffer pools can be defined with varying page sizes including 4k, 8K, 16K and 32K.
3.2.3 Block based buffer poolsIn Version 8, prefetching can be improved by creating block based buffer pools.
By default, the buffer pools are page-based, which means that contiguous pages on disk are prefetched into non-contiguous pages in memory. Sequential prefetching can be enhanced if contiguous pages can be read from disk into contiguous pages within a buffer pool.
When a block based buffer pool is available, the prefetching code recognizes this and will use block I/Os to read multiple pages into the buffer pool in a single I/O, significantly improving the performance of prefetching. A block based buffer pool consists of both a page area and a block area. The page area is required for non-sequential prefetching workloads. The block area consists of blocks where each block contains a specified number of contiguous pages, which is referred to as the block size.
3.2.4 PrefetchersPrefetchers are present to retrieve data from disk and move it into the buffer pool before applications need the data. For example, applications needing to scan through large volumes of data would have to wait for data to be moved from disk into the buffer pool if there were no data prefetchers.
With prefetch, DB2 agents of the application send asynchronous read-ahead requests to a common prefetch queue. As prefetchers become available, they implement those requests by using big-block or scatter read input operations to bring the requested pages from disk to the buffer pool.
Note: On UNIX, the ps command identifies prefetcher processes as db2pfchr.
Chapter 3. Overview of DB2 UDB 8 103

Having multiple disks for storage of the database data means that the data can be striped across the disks. This striping of data enables the prefetchers to use multiple disks at the same time to retrieve data.
Prefetchers are designed to improve the read performance of applications as well as utilities such as backup and restore, since they prefetch index and move data pages into the buffer pool, thereby reducing the time spent waiting for I/O to complete.
The number of prefetchers may be controlled by the database configuration parameter NUM_IOSERVERS.
3.2.5 Page cleanersPage cleaners are present to make room in the buffer pool, before agents and prefetchers read pages from disk storage and move them into the buffer pool. For example, if an application has updated a large amount of data in a table, many of the updated data pages in the buffer pool may be not yet have been written on to disk storage — such pages are called dirty pages. Since prefetchers cannot place fetched data pages on to the dirty pages in the buffer pool, these dirty pages must first be flushed to disk storage and become “clean” pages, so that prefetchers can find room to place fetched data pages from disk storage.
Page cleaners are independent of the application agents that read and write to pages in the buffer pool.
Without the availability of independent prefetchers and page cleaners, DB2 agents would have to do all of the reading and writing of data between the buffer pool and disk storage.
The configuration of the buffer pool, along with prefetchers and page cleaners, control the availability of the data needed by the applications.
Page cleaners will write changed pages from the buffer pool (or the buffer pools) to disk before a database agent requires the space in the buffer pool. This process eliminates the need for the database agent to write modified pages to disk, thereby improving performance.
Note: When a page cleaner flushes a dirty page to disk storage, the page cleaner removes the dirty flag but leaves the page in the buffer pool. This page will remain in the buffer pool until a prefetcher or a DB2 agent steals it.
Note: On UNIX, the ps command identifies page cleaner processes as db2pclnr..
104 DB2 UDB/WebSphere Application Tuning Guide
The number of page cleaners may be controlled by the database configuration parameter NUM_IOCLEANERS.
3.2.6 LogsChanges to data pages in the buffer pool are logged. Agent processes updating a data record in the database also update the associated page in the buffer pool, and write a log record into a log buffer.
To optimize performance, neither the updated data pages in the buffer pool, nor the log records in the log buffer are written to disk immediately. They are asynchronously written to disk by page cleaners, and the logger respectively. The logger and the buffer pool manager cooperate and ensure that an updated data page is not written to disk storage before its associated log record is written to the log. This ensures database recovery to a consistent state from the log in the event of a crash such as a power failure.
Log buffers are flushed to disk under the following conditions:
� Before the corresponding data pages are written to disk. This is called write-ahead logging.
� On a COMMIT, or after the value of the number of COMMITS to group MINCOMMIT database configuration parameter is reached.
� When the log buffer is full. Double buffering is used to prevent I/O waits.
3.2.7 Deadlock detectorA deadlock occurs when one or more applications require access to a resource that is currently locked by the other application(s). This can result in interminable waits by all the applications involved in the deadlock.
In order to avoid such a situation, DB2 uses a background process called the deadlock detector to identify and resolve these deadlocks. The deadlock detector becomes active periodically as determined by the DLCHKTIME configuration parameter. When the deadlock detector encounters a deadlock situation, one of
Note: Version 8 exploits asynchronous I/O facilities to improve I/O performance. On AIX, asynchronous I/O is not always enabled; it must be enabled before DB2 Version 8 can be successfully installed.
To enable asynchronous I/O, use smitty -> Devices -> Asynchronous I/O.
Note: On UNIX, the ps command identifies a logger process as db2loggr.
Chapter 3. Overview of DB2 UDB 8 105

the deadlocked applications will receive an error code and the current unit of work for that application will be rolled back automatically by DB2. When the rollback is complete, the locks held by this chosen application are released, thereby allowing other applications to continue.
Selecting the proper interval for the deadlock detector ensures good performance. Too short an interval causes unnecessary overhead, and too long an interval allows a deadlock to delay processes unnecessarily.
Enhancements to the Version 8 deadlock event monitor now help system and database administrators determine the cause of deadlocks. The deadlock event monitor now provides more information than it did in previous releases. For example, the monitor now identifies the specific statements involved in a deadlock, and pinpoints the specific locks held by each application involved in the deadlock.
3.2.8 DisksData placement, and the types of disks, can play a significant role in the performance and availability of a database application. The overall objective is to spread the database effectively across as many disks as possible to try and minimize IO wait. DB2 supports a variety of data placement strategies including mirroring, striping, and RAID devices, and the administrator needs to understand the advantages and disadvantages of disk capabilities to arrive at the most appropriate strategy for his environment.
Consider the following recommendations to improve performance:
� Balance the workload across disk resources by spreading the work for DB2 partitions and containers across as many disk arrays as possible.
� Match the physical capabilities and attributes of the disk with DB2 block sizes.
� Exploit DB2’s inherent striping capability by placing containers for a tablespace on separate logical disks which reside on separate RAID arrays or disk controllers. This will eliminate the need for operating system or logical volume manager striping.
3.2.9 Threading of Java UDFs and stored proceduresRoutines (stored procedures, UDFs, and methods) in DB2 Version 8 are implemented using a thread-based model that can significantly improve the performance of database servers. Routines that are defined as thread-safe will run in a single fenced-mode process. There is one process for Java routines, and
106 DB2 UDB/WebSphere Application Tuning Guide

another process for non-Java routines — this will reduce the amount of context switching for users that run large numbers of fenced code routines. Java routines from previous releases will be migrated, assuming that they are thread-safe, which will also allow resource sharing of the JVM.
It is assumed that existing non-Java routines that are migrated to DB2 Version 8 are not thread-safe.
3.3 Tuning DB2DB2 UDB environments range from stand-alone systems to complex combinations of database servers and clients running on multiple platforms. Critical to all these environments is the achievement of adequate performance to meet business requirements. Performance is typically measured in terms of response time, throughput, and availability.
The performance of any system is dependent upon many factors including system hardware and software configuration, number of concurrent users, and the application workload. and type of users, and the application workload.
Performance management is a complex issue, and can be defined as modifying the system and application environment in order to satisfy previously defined performance objectives. These objectives must be quantitative, measurable and realistic. Units of measurement include response time for a given workload, transactions per second, I/O operations, CPU use, or a combination of the above. Without well defined performance objectives, performance is a hit or miss exercise, with no way of delivering on any service level agreements that may be negotiated with users.
Performance management is an iterative process, that involves constant monitoring to determine whether performance objectives are being met even as environments and workloads change over time. When performance objectives are not being met, then appropriate changes must be made to the hardware and/or software environment, as well as the performance objectives themselves, in order to ensure that they will be met.
From a database perspective, performance problems can arise out of a combination of poor application and system design, inadequate CPU, memory disk, and network resources, and suboptimal tuning of these resources.
Note: Users who want to modify preexisting routines need to drop and re-create them, or use the appropriate ALTER SQL command. New routines are created with the aforementioned defaults if no thread-safe or non-thread-safe value is specified at creation.
Chapter 3. Overview of DB2 UDB 8 107

In the following sections, we will introduce some of the key database application and system performance considerations for achieving optimal performance.
3.4 Application tuning considerationsThe main considerations here are the design of the database, the writing of efficient SQL statements, concurrency, and ensuring that statistics about the DB2 objects are up-to-date.
3.4.1 Database designDatabase design involves designing tables and indexes.
Table designFactors that affect the performance of tables are normalization, data type of columns, type of tablespace, and locking considerations.
NormalizationThe objective of normalization is to minimize redundancies in the data stored in different tables. Normalization improves the efficiency of SQL update statements since they would affect only one table, while potentially deteriorating the performance of SQL read statements that might require a join to access data stored in different tables.
The recommendation for online transaction processing (OLTP) applications is to use the Third Normal Form.
Important: This section does not cover all the application tuning options at the disposal of the application designer, nor are the ones mentioned here covered in the detail they deserve.
Please consult the following documents for detailed information about DB2 application tuning:
� DB2 UDB Administration Guide: Planning, SC09-4822� DB2 UDB Administration Guide: Implementation, SC09-4820� DB2 UDB Administration Guide: Performance, SC09-4821� DB2 UDB Call Level Interface Guide and Reference Volume 1, SC09-4849� DB2 UDB Call Level Interface Guide and Reference Volume 2, SC09-4850� DB2 UDB SQL Reference Volume 1, SC09-4844� DB2 UDB SQL Reference Volume 2, SC09-4845� DB2 UDB V7.1 Performance Tuning Guide, SG24-6012
108 DB2 UDB/WebSphere Application Tuning Guide

For data warehousing types of applications, where the predominant access is read only, the recommendation is to denormalize the tables. Denormalization is the process of duplicating data in one or more tables, so that retrieval performance is improved through the minimization or elimination of joins between tables. However, this can negatively impact SQL update statements, and lead to data integrity problems if the duplicate data is not consistently updated.
Column data typesDB2 supports a wide range of data types for the columns in a table. Data types can be categorized as:
� DB2-Supplied Data Types — these can be Numeric, String (Binary, Single Byte, Double Byte), or Date and Time
� User Defined Data Types — these can be User Defined distinct Types (UDTs), User Defined Structured Types, or User Defined Reference Types
Data types should be defined to minimize disk storage consumption, and any unnecessary processing such as data type transformations. The following are some of the main recommendations as they apply to the choice of data types within the domain constraints required by the application:
� Use SMALLINT rather than INTEGER where appropriate
� Use the DATE and TIME data types rather than CHAR
� Use NOT NULL for columns wherever possible
� Choose data types that can be processed most efficiently
� Use CHAR rather than VARCHAR for any narrow columns (for example, those that are less than 50 characters wide)
� Choose VARCHAR instead of LONG VARCHAR when the row size is less than 32K
� Use FLOAT rather than DECIMAL for columns if exact precision is not required
� Use IDENTITY columns where appropriate
TablespacesTwo main performance considerations apply to the choice of tablespaces — one is size and the other is access. Table spaces in DB2 can be defined as being System Managed Space (SMS) or Database Managed Space (DMS).
Attention: From a performance perspective, the use of User Defined Data Types will not impact response times. For example, User Defined distinct Types share the same code that is used by built-in data types to access built-in functions, indexes and other database objects.
Chapter 3. Overview of DB2 UDB 8 109
� SMS table spaces: In an SMS table space, the operating system's file system manager allocates and manages the space where the table is stored. The storage model typically consists of many files, representing table objects, stored in the file system space. The user decides on the location of the files, while DB2 controls their names, and the file system manages them. By controlling the amount of data written to each file, the database manager distributes the data evenly across the table space containers.
An SMS table space is the default table space.
Two key factors must be considered when designing SMS tablespaces:
– Containers for the table space: When specifying the number of containers for the tablespace, it is very important to identify all the containers required up front, since containers can not be added or deleted after the SMS tablespace has been created. Each container used for an SMS table space identifies an absolute or relative directory name. Each of these directories can be located on a different file system (or physical disk).
– Extent size for the table space: The extent size can only be specified when the table space is created. Because it can not be changed later, it is important to select an appropriate value for the extent size.
� DMS table spaces: In DMS tablespaces, containers are either operating system files or raw devices. We recommend that you associate where possible, each container with a different disk or set of disks, to enable parallel I/O, and permit larger tablespace capacity.
DMS tablespace permit increasing capacity using:
ALTER TABLESPACE ADD CONTAINER
Or by the use of RESIZE and EXTEND clauses.
DMS advantages include these:
– Containers can be added (without invoking the rebalancer), extended, reduced and dropped.
– Large tables can be split up by data type (LOBs, indexes, data) across multiple table spaces.
– DMS device placements on disk can be controlled using the logical volume manager (outer edge, middle)
– DMS, in most situations, will give better performance than SMS.
Attention: We strongly recommend that, where possible, you use DMS table spaces with device (raw logical volume) containers if performance is your main priority. The database can do a much better job than the file system when it comes to managing its own disk blocks.
110 DB2 UDB/WebSphere Application Tuning Guide
While DMS tablespaces offer better performance, they are more difficult to manage, and SMS tablespaces may be appropriate in most application environments excepting the most stringent ones.
Table locksTables are one of the database objects that can be explicitly locked, others being a database or table space. All other objects are implicitly locked, like rows.
LOCKSIZE is a table parameter that specifies the granularity of locking which can be either row level (default) locking or table level locking. This value can be changed by using the following statement:
ALTER TABLE db2inst1.table1 LOCKSIZE TABLE
Table level locking can cause significant contention and thereby performance problems, if concurrent readers and updaters try to access the content of the table.
Table level locks should be considered for reducing locking costs, when read only access is expected against the table as in the case of data warehousing applications.
In most cases, the default value of row level locking is appropriate.
Index designIndexes are used to enforce uniqueness in the values of a column, and to improve retrieval performance. The following are some of the main recommendations as they apply to the creation of indexes:
� Define primary keys and unique indexes wherever they apply.
� Create an index on any column that the query uses to join tables (join predicates).
Note: We recommend use of SMS tablespaces for temp tablespaces, unless your workload always creates large temps that are flushed to disk, and prefetched back in such a way as to benefit from DMS’s ‘no cache’/‘no-OS’ attribute. This may still not be of significant benefit in very large machines with more memory than DB2 can effectively use as in the case of 64 bit implementations.
Note: A predicate is an element of a search condition that expresses or implies a comparison operation. Predicates are included in clauses beginning with WHERE or HAVING.
Chapter 3. Overview of DB2 UDB 8 111

� Create an index on any column from which you search for particular values on a regular basis.
� Create an index on columns that are commonly used in ORDER BY clauses.
� When creating a multi-column index, the first columns of the index should be the ones that are used most often by the predicates in your query.
� Consider creating a clustering index to optimize queries that retrieve multiple rows in index order. Note that only one index on a table can be defined as clustering via the CLUSTER option.
� In DB2 Version 8, multidimensional clustering (MDC) has been added which enables a table to be physically clustered on more than one key (or dimension) simultaneously.
� Consider separating the indexes from the data by placing them in a separate tablespace. This enables them to be placed on fast devices, as well as allocate them to their own buffer pool for better performance.
While indexes improve retrieval performance, they consume disk storage and degrade update activity due to the maintenance required on them.
Type-2 indexesDB2 Version 8 adds support for type-2 indexes. Here are the main advantages of type-2 indexes:
� They improve concurrency because the use of next_key locking is reduced to a minimum. Most next-key locking is eliminated because a key is marked as having been deleted, instead of being physically removed from the index page.
� An index can be created on columns that have a length greater than 255 bytes.
� Online table reorg and online table load can be used against a table that has only type-2 indexes defined on it.
� They are required for the new multidimensional clustering facility (MDC).
Attention: DB2 provides a Design Advisor Wizard to help the user determine the best set of indexes for a given workload. A workload contains a set of weighted SQL statements that can include queries and updates. The wizard will recommend which new indexes to create, which ones to keep, and which existing indexes to drop.
112 DB2 UDB/WebSphere Application Tuning Guide
All indexes created before DB2 Version 8 are type-1 indexes. Use the REORG INDEXES command to convert type-1 indexes to type-2 indexes. Use the INSPECT command to ascertain the type of index defined on a table. After this conversion, runstats should be performed.
3.4.2 Efficient SQLSQL is a high-level language that provides considerable flexibility in writing queries to deliver the same answer set. However, not all forms of the SQL statement deliver the same performance for a given query. It is therefore vital to ensure that the SQL statement is written in a fashion to provide optimal performance.
DB2 UDB provides the SQL compiler which creates the compiled form of SQL statements. When the SQL compiler compiles SQL statements, it rewrites them into a form that can be optimized more easily. This is known as query rewrite. The SQL compiler then generates many alternative execution plans for satisfying the user’s request. It estimates the execution cost of each alternative plan using the statistics for tables, indexes, columns, and functions, and chooses the plan with the smallest execution cost. This is known as query optimization.
It is important to note that the SQL compiler must choose an access plan that will produce the result set for a given query. We recommend the following guidelines to ensure that the SQL compiler chooses the optimal access plan for a given query:
� Write Stage 11 predicates as far as possible.� Specify only needed columns.� Limit the number of rows.� Specify the FOR UPDATE clause if applicable.� Specify the OPTIMIZED FOR n ROWS clause if applicable.� Specify the FETCH FIRST n ROWS ONLY clause if applicable.� Specify the FOR FETCH ONLY clause if applicable.� Avoid numeric data type conversion.� Avoid LOCK TABLE statement with EXCLUSIVE mode if applicable.
Attention: All new indexes are created as type-2 indexes, except when you add an index on a table that already has type-1 indexes. In this case the new index will also be a type-1 index, because you cannot mix type-1 and type-2 indexes on the same table.
1 A Stage 1 predicate enables the DB2 optimizer to consider the use of an index on the columns used in a query’s predicates. Refer to the DB2 product documentation for details on Stage 1 predicates.
Chapter 3. Overview of DB2 UDB 8 113
When SQL statements are embedded in a program, they are called embedded SQL programs. SQL can be embedded in C/C++, COBOL, FORTRAN, Java (SQLJ), and REXX programming languages.
There are two types of embedded SQL statements:
� Static SQL:
Static SQL statements are ones where the SQL statement type and the database objects accessed by the statement, such as column names, are known prior to running the application. The only unknowns are the data values the statement is searching for or modifying.
You must pre-compile and bind such applications to the database, so that the database manager analyzes all of static SQL statements in a program, determines its access plan to the data, and stores the ready-to-execute application package before executing the program. Because all logic required to execute SQL statements is determined before executing the program, static SQL programs have the least run-time overhead of all the DB2 programming methods, and execute faster.
� Dynamic SQL:
Dynamic SQL statements are ones where the application builds and executes the SQL at run time. An interactive application that prompts the end user for key parts of an SQL statement, such as the names of the tables and columns to be searched, is a common example of dynamic SQL. The application builds the SQL statement at runtime, and then submits the statement for processing.
Dynamic SQL statements are generally well-suited for applications that run against a rapidly changing database, where transactions need to be specified at run time. An embedded dynamic SQL programming module will have its data access method determined during the statement preparation, and will utilize database statistics available at query execution time.
Choosing an access plan at program execution time offers greater flexibility than static SQL statements, and has the following advantages:
– Current database statistics are used for each SQL statement.
– Database objects do not have to exist before run time.
One drawback is that dynamic SQL statements can take more time to execute, since queries are optimized at runtime. Performance of dynamic SQL statement can be improved by minimizing preparation time through dynamic statement caching and tuning the query optimization level.
114 DB2 UDB/WebSphere Application Tuning Guide

3.4.3 ConcurrencyIn any shared data access environment involving queries and updates, a rigorous locking mechanism is required to guarantee the integrity of data as well as some form of locking is required to ensure the integrity of data.
Lack of a locking protocol can result in the following undesirable effects:
� Lost updates: Two applications, A and B, might both read the same row from the database and both calculate new values for one of its columns based on the data these applications read. If A updates the row with its new value and B then also updates the row, the update performed by A is lost.
� Access to uncommitted data: Application A might update a value in the database, and application B might read that value before it was committed. Then, if the value of A is not later committed, but backed out, the calculations performed by B are based on uncommitted (and presumably invalid) data.
� Non-repeatable reads: Some applications involve the following sequence of events:
a. Application A reads a row from the database, then goes on to process other SQL requests.
b. In the meantime, application B either modifies or deletes the row and commits the change.
c. Later, when application A attempts to read the original row again, it receives the modified row or discovers that the original row has been deleted.
� Phantom reads: The phantom read phenomenon occurs when:
a. Your application executes a query that reads a set of rows based on some search criterion.
b. Another application inserts new data or updates existing data that would satisfy your application's query.
c. Your application repeats the query from the first step (within the same unit of work).
When the query is repeated in the third step, some additional (“phantom”) rows are returned as part of the result set that were not returned when the query was initially executed in the first step.
Note: Keeping table and index statistics up-to-date helps the DB2 optimizer choose the best access plan. Unlike the case with static SQL, packages with dynamic SQL do not require to be rebound after new indexes have been added and/or new statistics have been gathered.
Chapter 3. Overview of DB2 UDB 8 115

DB2 provides concurrency control and prevents uncontrolled access by means of locks. A lock is a means of associating a database manager resource with an application to control how other applications can access the same resource. The application with which the resource is associated is said to hold or own the lock. DB2 can either hold a lock on a row, a table or a table space.
While locking provides data integrity, poor application choices can have a significant negative impact on response times and application throughput.
We will provide a very high level overview of the various kinds of locks taken by DB2, and propose broad guidelines for achieving optimal performance.
DB2 locks have the following basic attributes:
� Mode: The type of access allowed for the lock owner as well as the type of access permitted for concurrent users of the locked object. Table 3-1 lists the various modes supported by DB2. The mode of the lock is sometimes referred to as the state of the lock.
� Object: The resource being locked, which can be a tablespace, table, page, or row.
� Duration: The length of time a lock is held. Lock durations are affected by isolation levels, which are discussed later in this section.
Table 3-1 Lock modes shown in order of increasing control over resources
Important: A detailed discussion of DB2 locking is beyond the scope of this document, and the reader should consult the DB2 UDB Administration Guide: Performance, SC09-4821 for a complete understanding of this subject.
Lock mode Applicable object type Description
IN (Intent None) Table spaces, tables The lock owner can read any data in the table, including uncommitted data, but cannot update any of it. No row locks are acquired by the lock owner. Other concurrent applications can read or update the table.
116 DB2 UDB/WebSphere Application Tuning Guide
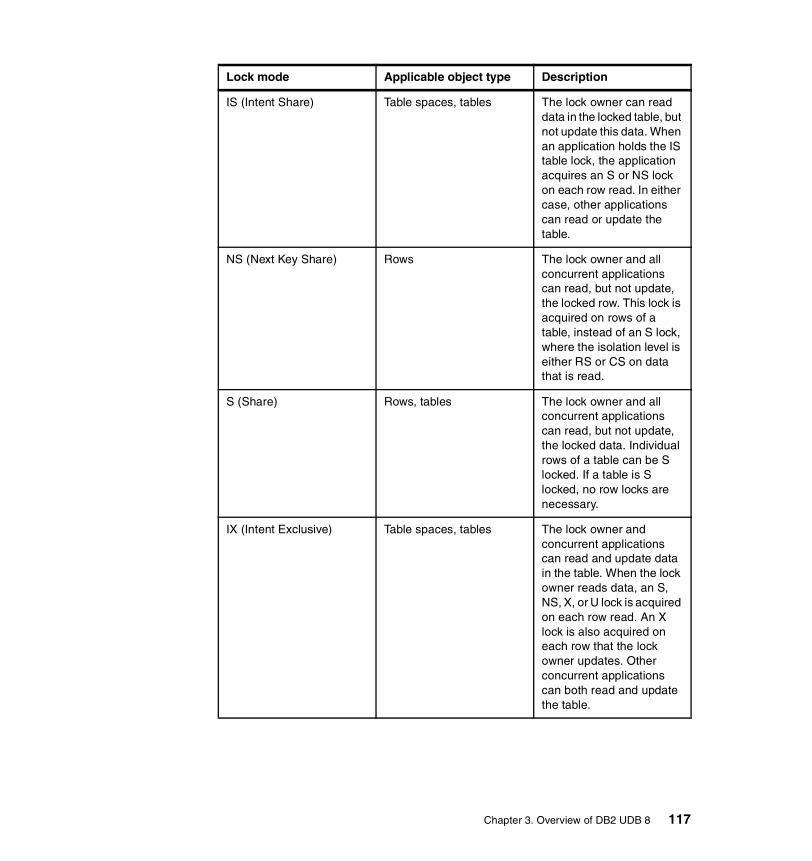
IS (Intent Share) Table spaces, tables The lock owner can read data in the locked table, but not update this data. When an application holds the IS table lock, the application acquires an S or NS lock on each row read. In either case, other applications can read or update the table.
NS (Next Key Share) Rows The lock owner and all concurrent applications can read, but not update, the locked row. This lock is acquired on rows of a table, instead of an S lock, where the isolation level is either RS or CS on data that is read.
S (Share) Rows, tables The lock owner and all concurrent applications can read, but not update, the locked data. Individual rows of a table can be S locked. If a table is S locked, no row locks are necessary.
IX (Intent Exclusive) Table spaces, tables The lock owner and concurrent applications can read and update data in the table. When the lock owner reads data, an S, NS, X, or U lock is acquired on each row read. An X lock is also acquired on each row that the lock owner updates. Other concurrent applications can both read and update the table.
Lock mode Applicable object type Description
Chapter 3. Overview of DB2 UDB 8 117

SIX (Share with Intent Exclusive)
Tables The lock owner can read and update data in the table. The lock owner acquires X locks on the rows it updates, but acquires no locks on rows that it reads. Other concurrent applications can read the table.
U (Update) Rows, Tables The lock owner can update data in the locked row or table. The lock owner acquires X locks on the rows before it updates the rows. Other units of work can read the data in the locked row or table; but cannot attempt to update it.
NX (Next Key Exclusive) Rows The lock owner can read but not update the locked row. This mode is similar to an X lock except that it is compatible with the NS lock.
NW (Next Key Weak Exclusive)
Rows This lock is acquired on the next row when a row is inserted into the index of a non-catalog table. The lock owner can read but not update the locked row. This mode is similar to X and NX locks except that it is compatible with the W and NS locks.
Lock mode Applicable object type Description
118 DB2 UDB/WebSphere Application Tuning Guide
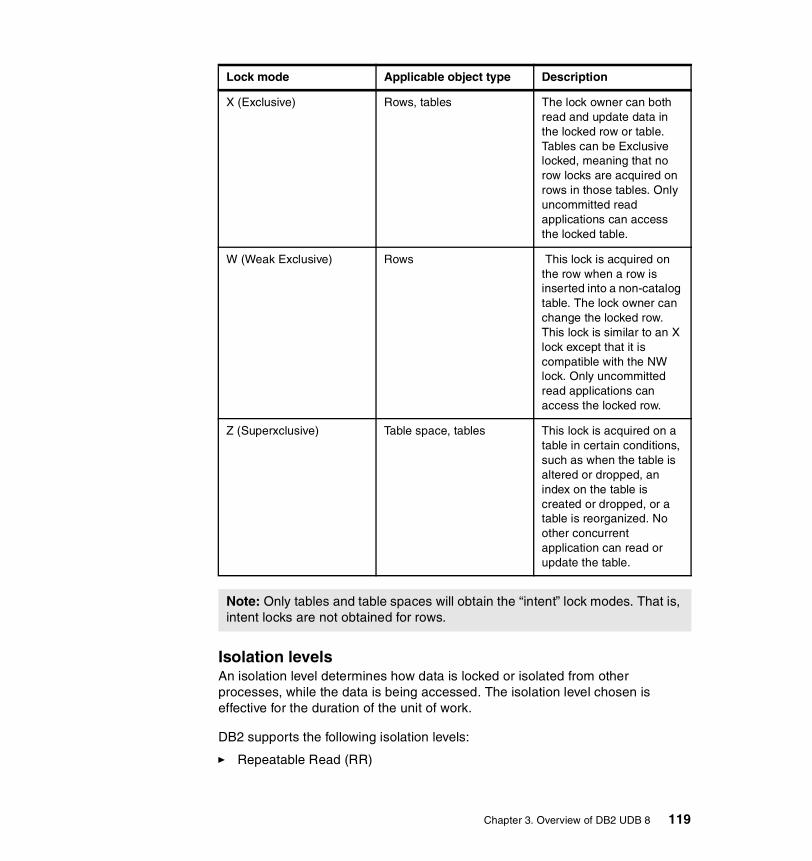
Isolation levelsAn isolation level determines how data is locked or isolated from other processes, while the data is being accessed. The isolation level chosen is effective for the duration of the unit of work.
DB2 supports the following isolation levels:
� Repeatable Read (RR)
X (Exclusive) Rows, tables The lock owner can both read and update data in the locked row or table. Tables can be Exclusive locked, meaning that no row locks are acquired on rows in those tables. Only uncommitted read applications can access the locked table.
W (Weak Exclusive) Rows This lock is acquired on the row when a row is inserted into a non-catalog table. The lock owner can change the locked row. This lock is similar to an X lock except that it is compatible with the NW lock. Only uncommitted read applications can access the locked row.
Z (Superxclusive) Table space, tables This lock is acquired on a table in certain conditions, such as when the table is altered or dropped, an index on the table is created or dropped, or a table is reorganized. No other concurrent application can read or update the table.
Note: Only tables and table spaces will obtain the “intent” lock modes. That is, intent locks are not obtained for rows.
Lock mode Applicable object type Description
Chapter 3. Overview of DB2 UDB 8 119
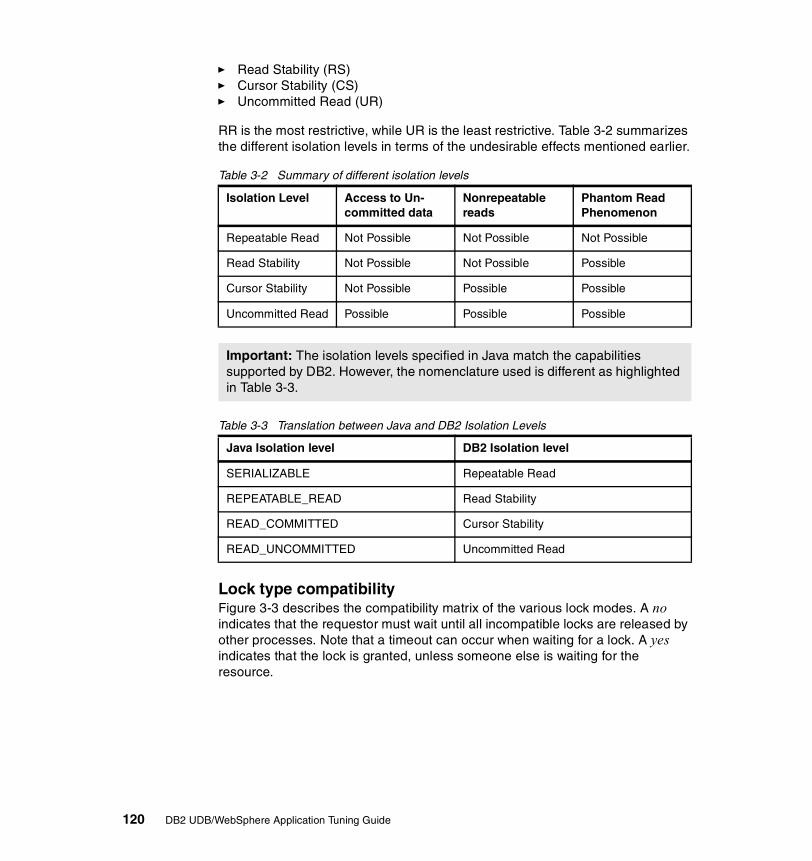
� Read Stability (RS)� Cursor Stability (CS)� Uncommitted Read (UR)
RR is the most restrictive, while UR is the least restrictive. Table 3-2 summarizes the different isolation levels in terms of the undesirable effects mentioned earlier.
Table 3-2 Summary of different isolation levels
Table 3-3 Translation between Java and DB2 Isolation Levels
Lock type compatibilityFigure 3-3 describes the compatibility matrix of the various lock modes. A no indicates that the requestor must wait until all incompatible locks are released by other processes. Note that a timeout can occur when waiting for a lock. A yes indicates that the lock is granted, unless someone else is waiting for the resource.
Isolation Level Access to Un-committed data
Nonrepeatable reads
Phantom ReadPhenomenon
Repeatable Read Not Possible Not Possible Not Possible
Read Stability Not Possible Not Possible Possible
Cursor Stability Not Possible Possible Possible
Uncommitted Read Possible Possible Possible
Important: The isolation levels specified in Java match the capabilities supported by DB2. However, the nomenclature used is different as highlighted in Table 3-3.
Java Isolation level DB2 Isolation level
SERIALIZABLE Repeatable Read
REPEATABLE_READ Read Stability
READ_COMMITTED Cursor Stability
READ_UNCOMMITTED Uncommitted Read
120 DB2 UDB/WebSphere Application Tuning Guide
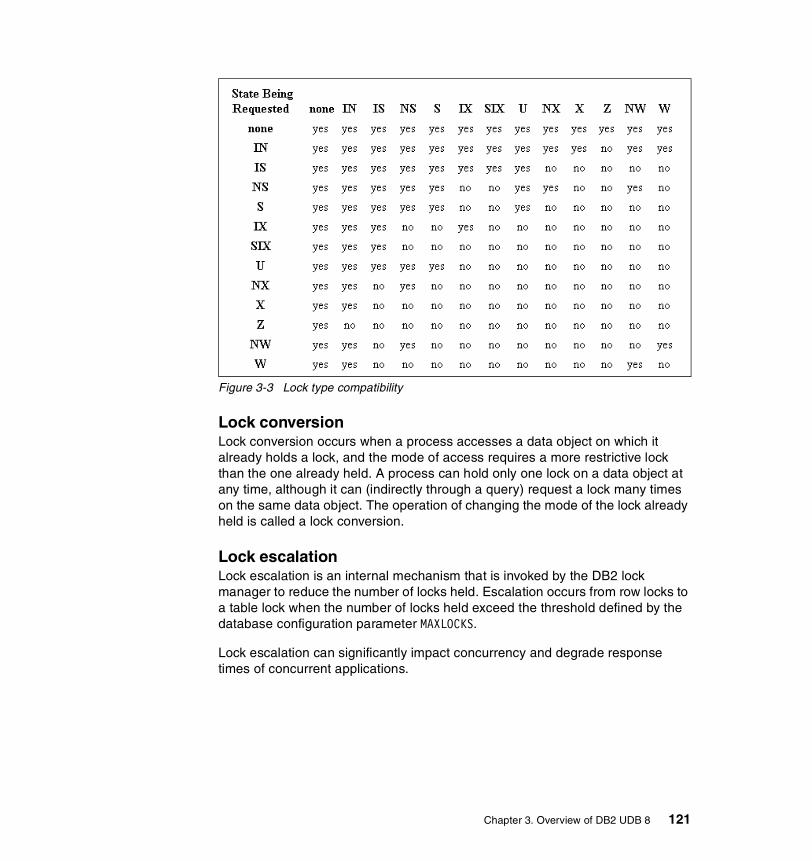
Figure 3-3 Lock type compatibility
Lock conversionLock conversion occurs when a process accesses a data object on which it already holds a lock, and the mode of access requires a more restrictive lock than the one already held. A process can hold only one lock on a data object at any time, although it can (indirectly through a query) request a lock many times on the same data object. The operation of changing the mode of the lock already held is called a lock conversion.
Lock escalationLock escalation is an internal mechanism that is invoked by the DB2 lock manager to reduce the number of locks held. Escalation occurs from row locks to a table lock when the number of locks held exceed the threshold defined by the database configuration parameter MAXLOCKS.
Lock escalation can significantly impact concurrency and degrade response times of concurrent applications.
Chapter 3. Overview of DB2 UDB 8 121

DeadlocksDeadlocks occur when more than two or more applications wait on one another for resources that are held by the other. None of the applications can proceed until at least one of the waiting applications is forced to relinquish its lock. A process is required to break these deadlock situations. Figure 3-4 describes the deadlock concept.
Figure 3-4 Illustration of a deadlock scenario
The objective from an application point of view is to maximize concurrency, while minimizing locking costs, timeouts, and deadlocks.
Important: Locks are usually taken implicitly on behalf of an application during the execution of a query. Understanding the kinds of locks obtained DB2 objects is critical to effective tuning for maximum concurrency.
Attention: Concurrency is maximized by taking the smallest possible lock on a DB2 object, and holding it for the shortest possible duration.
122 DB2 UDB/WebSphere Application Tuning Guide

Following these guidelines will minimize lock contention:
� Issue COMMIT statements at the appropriate frequency. This tends to reduce the number of locks held at a given point in time.
� Specify the FOR FETCH ONLY clause in the SELECT statement.
� Perform SQL INSERT, UPDATE and DELETE at the end of a unit of work if possible.
� For read only tables, choose a LOCKSIZE of table. A possible example is with data warehouses where data is read only, and only updated during “batch” windows.
� Choose the minimally restrictive isolation level required.
� Release read locks using the WITH RELEASE option of the CLOSE CURSOR statement if acceptable.
� Avoid lock escalations by tuning the database configuration parameters LOCKLIST and MAXLOCKS — more on this in the next section.
3.4.4 RunstatsCritical to the performance of SQL statements is the optimal selection of the access path by the DB2 optimizer. It is therefore essential to provide the DB2 optimizer with accurate information about the size and characteristics of the DB2 objects referenced in the query. The runstats utility gathers information about DB2 objects and records them in the DB2 catalog for the DB2 optimizer to avail of in its optimal access path selection process.
Note: We strongly recommend that you keep the statistics about DB2 objects current by running runstats whenever significant changes have occurred in the DB2 object size or composition. Static SQL programs should be rebound after running runstats in order for the DB2 optimizer to compute more optimal access paths.
Chapter 3. Overview of DB2 UDB 8 123
3.5 System tuning considerationsThe main considerations we cover here include DB2 memory utilization, and some of the key DB2 configuration parameters that can impact performance.
3.5.1 DB2 memory utilizationBefore discussing the various DB2 configuration parameters, we introduce the memory model of DB2, since many of the DB2 configuration parameters affect memory utilization on the system.
Different applications running in the DB2 environment use available memory in different ways. For example, some applications may use the file system cache, while DB2 uses its own buffer pool for data caching.
Figure 3-5 shows the different types of memory used by DB2.
Important: This section does not cover all the application tuning options at the disposal of the application designer, nor are the ones mentioned here covered in the detail they deserve.
Please consult the following documents for detailed information about DB2 application tuning:
� DB2 UDB Administration Guide: Implementation, SC09-4820� DB2 UDB Administration Guide: Performance, SC09-4821� DB2 UDB SQL Reference Volume 1, SC09-4844� DB2 UDB SQL Reference Volume 2, SC09-4845� DB2 UDB V7.1 Performance Tuning Guide, SG24-6012
124 DB2 UDB/WebSphere Application Tuning Guide

Figure 3-5 DB2 memory model
Memory is allocated for each instance of the Database Manager at the following times:
� When the Database Manager is started via the db2start command, Database Manager Shared Memory is allocated, and it remains allocated until the Database Manager is stopped via the db2stop command. This memory allocation contains information needed by the Database Manager to manage activity across all database connections. From this memory, all other memory is allocated/attached.
� When a database is activated via the ACTIVATE DATABASE command, or connected to for the first time, Database Global Memory (also called Database Shared Memory) is allocated. This memory is used across all applications that might connect to the database, and contains memory areas such as the buffer pools, lock list, database heap and utility heap. The database manager configuration parameter NUMDB defines the maximum number of concurrent active databases. If the value of this parameter increases, the number of Database Global Memory segments may grow depending upon the number of active databases.
Database ManagerShared Memory
Agent Private Memory
Application Global
Memory
DatabaseGlobal Memory
DatabaseGlobal Memory
Application Global
Memory
(1)(1) (numdb)
(1) (maxappls)
(1) (maxagents)
Agent Private Memory
Agent Private Memory
Agent Private Memory
Agent Private Memory
Application Global
Memory
Chapter 3. Overview of DB2 UDB 8 125

� The Application Global Memory is allocated for each connection when the connection is established to a database, and remains allocated until the connection is terminated. This memory is used by DB2 agents, including coordinator agents, and subagents working on behalf of the application, to share data and coordinate activities among themselves. The database configuration parameter MAXAPPLS defines the maximum number of applications that can simultaneously connect to the database.
� The Agent Private Memory is allocated for each DB2 agent, when the DB2 agent is assigned to work for an application. The Agent Private Memory contains memory areas which will be used only by this specific agent, such as sort heaps and application heaps. The Agent Private Memory remains allocated even after the DB2 agent completes tasks for the application, and gets into idle state.
However, if you set the DB2 registry variable DB2MEMDISCLAIM to YES, then DB2 disclaims some or all memory, depending on the value given with the DB2 registry variable DB2MEMMAXFREE, which defines the amount of the memory to be retained by each DB2 agent. The database manager configuration parameter MAXAGENTS defines the maximum number of DB2 agents, including coordinator agents, and subagents in the instance. If the value of this parameter increases, the number of the Application Global Memory segments, and the Agent Private Memory segments may grow, depending on the number of connected applications and DB2 agents, respectively.
Note: Application Global Memory is allocated if you enable intra-partition parallelism, or if the database manager is in a partitioned database environment using DB2 UDB Enterprise-Extended Edition.
126 DB2 UDB/WebSphere Application Tuning Guide

Figure 3-6 and Figure 3-7 show the various parameters used to control memory used to support applications.
Figure 3-6 Database Manager shared memory overview
The size of the Database Manager Shared Memory is affected by the following configuration parameters:
� Database System Monitor Heap size (MON_HEAP_SZ)� Audit Buffer Size (AUDIT_BUF_SZ)� FCM Buffers (FCM_NUM_BUFFERS)� FCM Message Anchors (FCM_NUM_ANCHORS)� FCM Connection Entries (FCM_NUM_CONNECT)� FCM Request Blocks (FCM_NUM_RQB)
The Database Manager uses the fast communication manager (FCM) component to transfer data between DB2 agents when intra-partition parallelism is enabled. Therefore, disabling intra-partition parallelism, causes memory areas required for FCM buffers, message anchors, connection entries and request blocks not to be allocated.
Database Manager Shared Memory (including FCM)
Application Global Memory
(app_ctl_heap_sz)
Database Global MemoryUtility Heap(util_heap_sz)
Restore Buffer(restbufsz)
Package Cache(pckcachesz)
Backup Buffer(backbufsz)
Database Heap(dbheap)
Buffer Pools(buffpage)
Extended Memory Cache
Lock List (locklist)
Catalog Cache(catalogcache_sz)
Log Buffer(logbufsz)
Sort Heap for Shared Sort(sortheap)
Monitor heap(mon_heap_sz)
Audit buffer(audit_buf_sz)
Chapter 3. Overview of DB2 UDB 8 127

The maximum size of the Database Global Memory segment is determined by the following configuration parameters:
� Buffer Pool Size that were explicitly specified when the buffer pools were created or altered (the value of BUFFPAGE database configuration parameter is taken if -1 is specified)
� Maximum Storage for Lock List (LOCKLIST)
� Database Heap (DBHEAP)
� Utility Heap Size (UTIL_HEAP_SZ)
� Extended Storage Memory Segment Size (ESTORE_SEG_SZ)
� Number of Extended Storage Memory Segments (NUM_ESTORE_SEGS)
� Package Cache Size (PCKCACHESZ)
Application Global Memory size is determined by the following configuration parameter:
� Application Control Heap Size (APP_CTL_HEAP_SZ)
Figure 3-7 Database agent/application private/shared memory overview
Agent Private Memory
Agent Stack(agent_stack_sz)
Statistics Heap(stat_heap_sz)
Sort Heap for Private Sort
(sortheap)
Application Heap(applheapsz)
DRDA Heap(drda_heap_sz)
UDF Memory(udf_mem_sz)
Statement Heap(stmtheap)
Query Heap (query_heap_sz) Client I/O Block (rqrioblk)
User or Application Process(Local Client)
User or Application Process(Remote Client)
For Remote Clients
Agent/Application Shared Memory
Application Support Layer Heap (aslheapsz)
Client I/O Block (rqrioblk) For Local Clients
128 DB2 UDB/WebSphere Application Tuning Guide

The maximum size of Agent Private Memory segments is determined by the following parameters:
� Application Heap Size (APPLHEAPSZ)� Sort Heap Size (SORTHEAP)� Statement Heap Size (STMTHEAP)� Statistics Heap Size (STAT_HEAP_SZ)� Query Heap Size (QUERY_HEAP_SZ)� DRDA Heap Size (DRDA_HEAP_SZ)� UDF Shared Memory Set Size (UDF_MEM_SZ)� Agent Stack Size (AGENT_STACK_SZ)� Client I/O Block Size (RQRIOBLK) (for remote clients)
The size of Agent/Application Shared Memory is affected by the following:
� Application Support Layer Heap Size (ASLHEAPSZ)� Client I/O Block Size (RQRIOBLK) (for local clients)
3.5.2 DB2 64-bit The increased addressable memory of 64-bit computing can be leveraged to improve the performance for database operations that benefit from memory in excess of 4 GB, such as hash join, sort, and larger buffer pools. With ample memory, this enables one to make key tables or even entire databases entirely buffer pool resident — this can be very beneficial for large databases.
While DB2 V7.2 provided 64-bit addressing, it had certain restrictions that prevented it from being fully exploited in a production environment, for example, restricted connectivity, no management tools, and restricted subsystems on AIX, Solaris, and HP-UX.
DB2 Version 8 builds upon DB2 V7.2's 64-bit support with a fully exploitable 64-bit engine with full support for clients, management tools, and associated subsystems like the Spatial Extender.
For UNIX platforms (excluding Linux), the installation is the same for both 32-bit and 64-bit environments. When DB2 Version 8 is installed on a UNIX box, both the 32-bit and 64-bit files are laid down. Once can choose either the 32-bit or 64-bit option at instance creation time, at which point instance links will be set up to point to the appropriate libraries and executables.
For Windows and Linux, there is a separate install image for 32-bit and 64-bit environments, since coexistence is not supported for these platforms.
Chapter 3. Overview of DB2 UDB 8 129

In a DB2 64-bit environment, there are no changes to data on disk — existing data's cardinality characteristics are the same whether it is used by a 32-bit or 64-bit instance. Databases in the UNIX versions of DB2 (not including Linux) that are created and operate in 64-bit mode can be moved back to a 32-bit instance by dropping the 64-bit instance, creating a new 32-bit instance, and then re-cataloging the database in the new instance.
3.5.3 Configuration parametersDB2 has more than one hundred configurable parameters, and while we do not need to tune all of them, we intend to focus on a few key parameters that can have a significant impact on the performance of the database.
This section focuses on considerations in adjusting the recommendations made by the Configuration Advisor Wizard.
DB2’s tuning and configuration parameters fall into two general categories:
� Database manager configuration parameters� Database configuration parameters
Database manager configuration parametersDatabase manager parameters are stored in a file named db2system. This file is created when an instance of the Database Manager is created. Table 3-4 lists some of the parameters in the database manager configuration file for database servers.
Attention: This is not supported in a Windows or Linux environment, since they require different hardware architectures.
Attention: Use the DB2 Configuration Advisor Wizard initially to obtain recommended values for performance related configuration parameters. The wizard should also be used to obtain new recommendations when the database environment has changed significantly.
130 DB2 UDB/WebSphere Application Tuning Guide
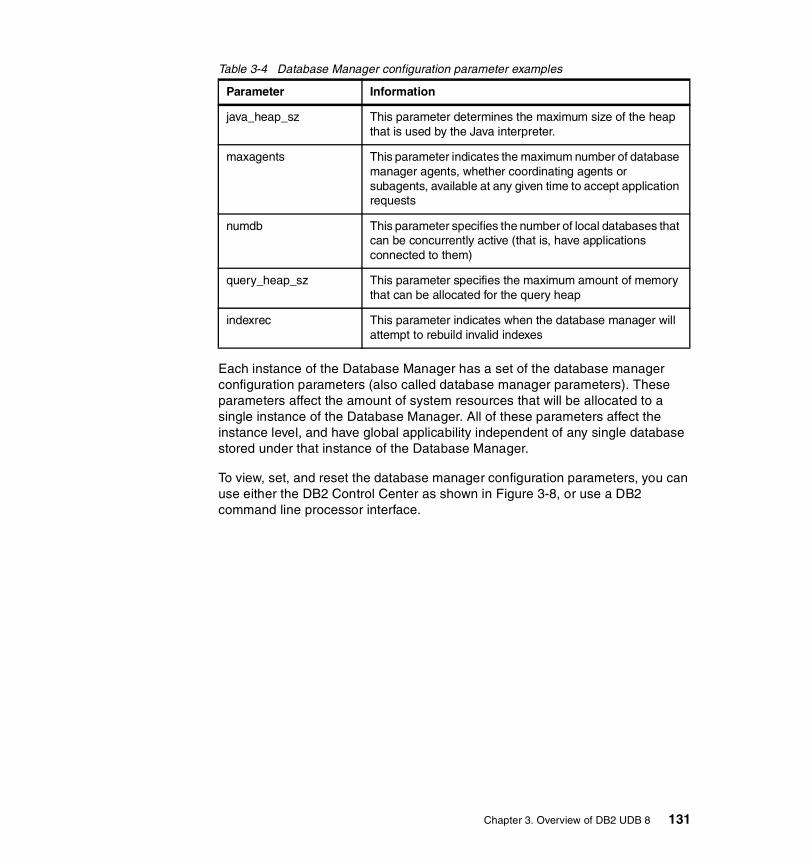
Table 3-4 Database Manager configuration parameter examples
Each instance of the Database Manager has a set of the database manager configuration parameters (also called database manager parameters). These parameters affect the amount of system resources that will be allocated to a single instance of the Database Manager. All of these parameters affect the instance level, and have global applicability independent of any single database stored under that instance of the Database Manager.
To view, set, and reset the database manager configuration parameters, you can use either the DB2 Control Center as shown in Figure 3-8, or use a DB2 command line processor interface.
Parameter Information
java_heap_sz This parameter determines the maximum size of the heap that is used by the Java interpreter.
maxagents This parameter indicates the maximum number of database manager agents, whether coordinating agents or subagents, available at any given time to accept application requests
numdb This parameter specifies the number of local databases that can be concurrently active (that is, have applications connected to them)
query_heap_sz This parameter specifies the maximum amount of memory that can be allocated for the query heap
indexrec This parameter indicates when the database manager will attempt to rebuild invalid indexes
Chapter 3. Overview of DB2 UDB 8 131

Figure 3-8 DB2 Control Center
132 DB2 UDB/WebSphere Application Tuning Guide
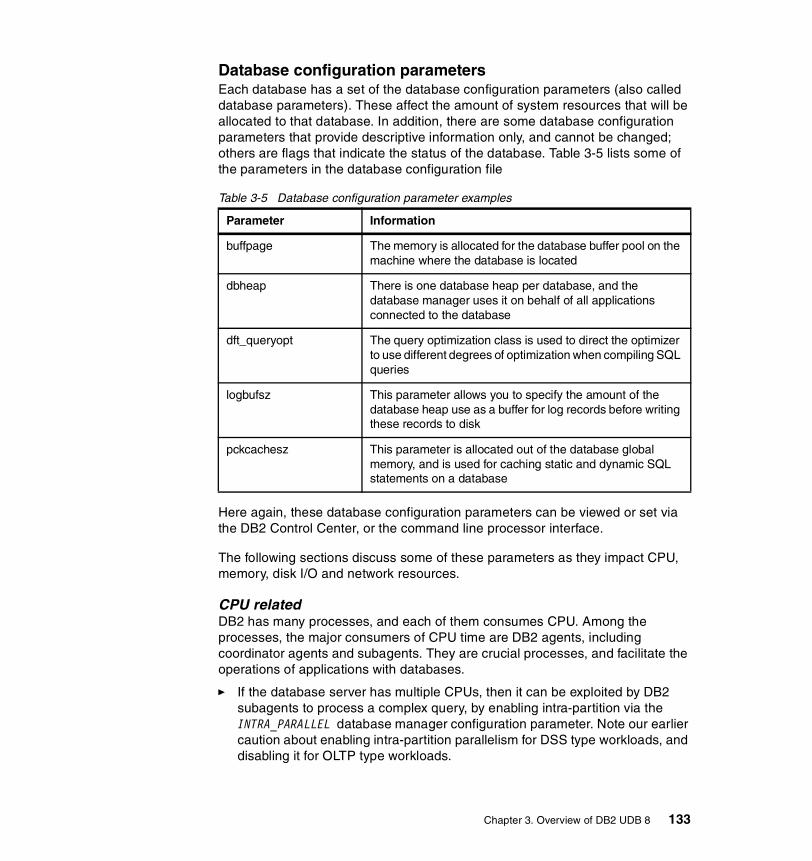
Database configuration parametersEach database has a set of the database configuration parameters (also called database parameters). These affect the amount of system resources that will be allocated to that database. In addition, there are some database configuration parameters that provide descriptive information only, and cannot be changed; others are flags that indicate the status of the database. Table 3-5 lists some of the parameters in the database configuration file
Table 3-5 Database configuration parameter examples
Here again, these database configuration parameters can be viewed or set via the DB2 Control Center, or the command line processor interface.
The following sections discuss some of these parameters as they impact CPU, memory, disk I/O and network resources.
CPU related DB2 has many processes, and each of them consumes CPU. Among the processes, the major consumers of CPU time are DB2 agents, including coordinator agents and subagents. They are crucial processes, and facilitate the operations of applications with databases.
� If the database server has multiple CPUs, then it can be exploited by DB2 subagents to process a complex query, by enabling intra-partition via the INTRA_PARALLEL database manager configuration parameter. Note our earlier caution about enabling intra-partition parallelism for DSS type workloads, and disabling it for OLTP type workloads.
Parameter Information
buffpage The memory is allocated for the database buffer pool on the machine where the database is located
dbheap There is one database heap per database, and the database manager uses it on behalf of all applications connected to the database
dft_queryopt The query optimization class is used to direct the optimizer to use different degrees of optimization when compiling SQL queries
logbufsz This parameter allows you to specify the amount of the database heap use as a buffer for log records before writing these records to disk
pckcachesz This parameter is allocated out of the database global memory, and is used for caching static and dynamic SQL statements on a database
Chapter 3. Overview of DB2 UDB 8 133
� Having a huge number of DB2 agent processes may cause CPU constraints due to context switching, as well as memory constraints. The number of DB2 agents can be controlled via the following configuration parameters:
– The database manager configuration parameter MAXAGENTS defines the maximum number of database manager agents, whether it is coordinator agents or subagents, available at any given time to accept application requests.
– The database manager configuration parameter MAX_COORDAGENTS defines the maximum number of coordinator agents.
Memory related While many of the configuration parameters available affect memory usage on the system, we will focus on some of them which have a significant impact on database performance.
� Lock escalation:
Each database allocates a memory area called a lock list, which contains all locks held by all applications concurrently connected to the database. As discussed earlier, lock escalation occurs from row level to a table level, when the number of locks held by an application exceeds a given threshold.
Two database configuration parameters have a direct effect on lock escalation as follows:
– LOCKIST — defines the amount of memory allocated for the locks.
– MAXLOCKS — defines the percentage of the total lock list permitted to be allocated to a single application.
Lock escalations occur under either of the following circumstances:
– One application exceeds the percentage of the lock list as defined by the MAXLOCKS configuration parameter. The database manager will attempt to free memory by obtaining a table lock and releasing row locks for this application.
– Many applications connected to the database fill the lock list by acquiring a large number of locks. DB2 will attempt to free memory by obtaining a table lock and releasing row locks.
The isolation level used by an application also has an effect on lock escalation, since it controls the duration a lock is held within a unit-of-work.
If a lock escalation is performed, from row to table, the escalation process itself does not take much time; however, locking entire tables decreases concurrency, and overall database performance may decrease for subsequent accesses against the affected tables.
134 DB2 UDB/WebSphere Application Tuning Guide

Once the lock list is full, performance can degrade, since lock escalation will generate more table locks and fewer row locks, thus reducing concurrency on shared objects in the database. Your application will receive an SQLCODE of -912 when the maximum number of lock requests has been reached for the database.
To avoid decreasing concurrency due to lock escalations or errors due to a lock list full condition, you should set appropriate values for both the LOCKLIST and MAXLOCKS database configuration parameters. The default values of these parameters may not be big enough (LOCKLIST: 10 pages, MAXLOCKS: 10%) and cause excessive lock escalations.
� Sorting methods:
When an SQL query requires the data to be returned in a defined sequence or order, the result may or may not require sorting. DB2 will attempt to perform the ordering through index usage. If an index cannot be used, the sort will occur. If the information being sorted cannot fit entirely into the sort heap (SORTHEAP — a block of memory that is allocated each time a sort is performed), it overflows into temporary database tables. Sorts that do not overflow (non-overflowed) always perform better than those that do.
� Agent pool size:
The database manager configuration parameter NUM_POOLAGENTS defines the size of the agent pool which contains idle DB2 agents. When DB2 agents finish executing their current request, they will be in idle state unless the number of idle agents exceed the value of NUM_POOLAGENTS; otherwise, they will be terminated.Setting the appropriate value for this parameter can reduce the cost to create and terminate DB2 agent processes. Too high a value for this parameter may waste the memory due to many idle agents.
� Disclaim memory areas for DB2 agents:
When DB2 agents finish executing their current request, and are returned to the agent pool, they do not release their agent private memory which includes the allocated sort heap. This behavior usually results in good performance, as the memory is kept for fast re-use. However, if you want to increase the agent pool size on a memory constrained system, this behavior may cause excessive activity to the paging space because many idle agents may keep large amounts of memory. To avoid this condition, set the DB2 registry variable DB2MEMEDISCLAIM to YES by executing the following command:
db2set DB2MEMDISCLAIM = yes
Chapter 3. Overview of DB2 UDB 8 135
� Package cache size:
The PCKCACHESZ database configuration parameter defines the package cache size. The database manager uses this memory to cache packages, which have been loaded from the system catalog, for static SQL or (dynamically generated) for dynamic SQL. If applications connecting to a database execute the same query multiple times, the database manager can reduce its internal overhead by eliminating the need to reload sections of package for static SQL, and also can reduce overhead to generate the package for dynamic SQL.
Disk I/O relatedData placement and buffer pool caching are a couple of the main considerations relating to database performance.
� Data placement:
Optimal placement of DB2 data on disk can have a significant impact on the performance of high I/O applications. Identifying the nature of the workload is an important consideration in making data placement decisions. In general, high I/O data must be separated on to different disks to avoid disk contention, and disk striping must be considered to speed up I/Os.
� Buffer pools:
A buffer pool is an area of storage in memory into which database pages are temporarily read and changed. The purpose of the buffer pool is to improve database system performance by buffering the data in memory. Here data can be accessed from memory rather than from disk, so the database manager needs to read or write less to the disk. Not all data in DB2 is buffered; LONG VARCHAR and LOBs are only accessed through direct I/O and are never stored in the buffer pool.
Buffer pools can be created with page sizes of 4K, 8K, 16K or 32K. All buffer pools are allocated when the first application connects to the database, or when the database is explicitly activated using the ACTIVATE DATABASE command. Use this ACTIVATE DATABASE command to keep buffer pool primed even if all the connections terminate. This will be very useful when connection load is highly dynamic (for example, Web servers).
Note: For dynamic SQL, even though your application does not execute exactly the same queries, it may benefit by the package cache using parameter markers.
136 DB2 UDB/WebSphere Application Tuning Guide

The BUFFPAGE database configuration parameter controls the size of a buffer pool when the CREATE BUFFERPOOL or ALTER BUFFERPOOL statement is executed with NPAGES -1; otherwise, the BUFFPAGE parameter is ignored, and the buffer pool will be created with the number of pages specified by the NPAGES parameter. Thus, each buffer pool that has a NPAGES value of -1 uses BUFFPAGE.
Buffer pools consume valuable memory that can potentially be utilized more effectively by other DB2 components. It is therefore vital to have an adequate number of buffers specified in each buffer pool.
The key measure of the efficacy of a buffer pool is the buffer pool hit ratio. The buffer pool hit ratio indicates the percentage of time that the database manager did not need to load a page from disk in order to service a page request. That is, the page was already in the buffer pool. The greater the buffer pool hit ratio, the lower the frequency of disk I/O.
The overall buffer pool hit ratio can be calculated as the difference between the number of all (data + index) logical reads and number of all (data + index) physical reads divided by the total number of read requests.
Similarly, an index pool hit ratio is calculated as the difference between the number of the index logical reads and the number of index physical reads divided by the total number of index read requests.
Increasing buffer pool size will generally improve the hit ratio, but you will reach a point of diminishing returns. Ideally, if you could allocate a buffer pool large enough to store your entire database, then once the system is up and running, you would get a hit ratio of 100%. However, this is unrealistic in most cases. The significance of the hit ratio depends on the size of your data, and the way it is accessed.
The DB2 Snapshot Monitor for buffer pools can be used to capture information on the number of reads and writes and the amount of time taken.
GET SNAPSHOT FOR ALL BUFFERPOOLS
BufferPoolHitRatioΣLogicalReads ΣPhysicalReads–
ΣLogicalReads-------------------------------------------------------------------------------------------------- 100×=
IndexPoolHitRatio Σ IndexLogicalReads ΣIndexPhysicalReads–ΣIndexLogicalReads
----------------------------------------------------------------------------------------------------------------------------------- 100×=
Chapter 3. Overview of DB2 UDB 8 137

Example 3-1 shows a snapshot for buffer pools.
Example 3-1 Snapshot for buffer pools
Bufferpool Snapshot
Bufferpool name = TPCDDATABPDatabase name = TPCDatabase path = /database/db2inst1/NODE0000/SQL00001/Input database alias =Buffer pool data logical reads = 4473Buffer pool data physical reads = 207Buffer pool data writes = 20Buffer pool index logical reads = 0Buffer pool index physical reads = 0Total buffer pool read time (ms) = 218Total buffer pool write time (ms) = 0Asynchronous pool data page reads = 200Asynchronous pool data page writes = 20Buffer pool index writes = 0Asynchronous pool index page reads = 0Asynchronous pool index page writes = 0Total elapsed asynchronous read time = 131Total elapsed asynchronous write time = 0Asynchronous read requests = 7Direct reads = 0Direct writes = 0Direct read requests = 0Direct write requests = 0Direct reads elapsed time (ms) = 0Direct write elapsed time (ms) = 0Database files closed = 0Data pages copied to extended storage = 0Index pages copied to extended storage = 0Data pages copied from extended storage = 0Index pages copied from extended storage = 0
For a large database, increasing the buffer pool size may have minimal effect on the buffer pool hit ratio. Its number of data pages may be so large, that the statistical chances of a hit are not improved increasing its size. But you might find that tuning the index buffer hit ratio achieves the desired result. This can be achieved using two methods:
a. Split data and indexes into two different buffer pools and tune separately.
b. Use one buffer pool, but increase its size until the index hit ratio stops increasing.
138 DB2 UDB/WebSphere Application Tuning Guide

The first method is often more effective, but because it requires indexes and data to reside in different table spaces, it may not be an option for existing databases. It also requires you to tune two buffer pools instead of one, which can be a more difficult task, particularly when memory is constrained.
The index pool hit ratio and the buffer pool hit ratio are influenced by data reorganization. It is always advisable to perform a REORGCHK command on the database before checking these hit ratios.
The issue of single or multiple buffer pools is dependent upon many factors.
– Single buffer pool:
In most situations, having one large buffer pool is the recommendation. Apart from its size, a single buffer pool needs no tuning. A single large buffer pool will also allow DB2 to efficiently utilize memory that has been allocated for buffer pool use.
If you decide to opt for table spaces using multiple page sizes, then you should create only one buffer pool for each page size. If you want to create table spaces using a page size other than the default 4 KB, then you will need a buffer pool which uses the same page size.
– Multiple buffer pools:
Multiple buffer pools, if badly configured, can have a huge negative impact on performance. When created for the right reasons, multiple buffer pools can improve performance; however, not all workloads will benefit.
You should consider defining multiple buffer pools when:
• You want to create tables which reside in table spaces using a page size other than the 4 KB default. This is required.
• You have tables which are accessed frequently and quickly by many short update transaction applications. Dedicated buffer pool(s) for these tables may improve response times.
• You have tables larger than main memory which are always fully scanned. These could have their own dedicated buffer pool. However, it needs to be large enough for prefetching requirements of such a large table (256 KB up to # MB). If these tables are scanned frequently then you could swamp the other buffer pools. (Tables this large will most likely always generate disk I/O irrespective of buffer pool size.)
Important: Other disk I/O considerations such as log placement, prefetching, page cleaners, extended storage, and logging also need to be tuned for optimal performance.
Chapter 3. Overview of DB2 UDB 8 139

3.6 Monitoring and tuning toolsDB2 UDB provides several tools that can be used for monitoring or analyzing database performance. This section describes them briefly, and provides guidelines for their use.
� Snapshot Monitor: Captures performance information at periodic points of time.
� Event Monitor: Provides a summary of activity at the completion of events such as statement execution, transaction completion, or when an application disconnects. In DB2 Version 8, event monitors can write data to DB2 tables instead of files or pipes, thus enabling the information to be processed more easily using SQL.
� Explain Facility: Provides information about how DB2 will access the data in order to resolve the SQL statements.
� db2batch tool: Provides performance information (benchmarking tool).
� CLI/ODBC/JDBC Trace Facility: Traces all the function calls of DB2 CLI Driver, for problem determination and tuning applications using CLI, ODBC, or SQLJ, or just to better understand what a third-party application is doing.
� db2diag.log: Prior to DB2 Version 8, this log had various degrees of diagnostic information recorded, depending upon the DIAGLEVEL database manager configuration parameter. There are five valid values for this parameter, ranging from zero to four. The default value is three, which captures all errors and warnings. A value of four captures informational messages as well. This file can be found in the SQLLIB/db2instance directory.
In DB2 Version 8, this log has been split into two — db2 diag.log and db2admin.log.
The db2admin.log will be used on all platforms for administration notification messages, while the db2diag.log will be targeted for use by troubleshooting personnel. The db2admin.log will contain user-friendly messages that should enable the DBA to resolve minor issues. An API is available (db2AdminMsgWrite) that can be invoked to write messages to the db2admin.log file — messages written by the API are distinguished from messages written by DB2. A new NOTIFYLEVEL dbm cfg parameter has been introduced that behaves like the DIAGLEVEL parameter, and provides granularity with respect to the severity of messages that are written to the db2admin.log.
140 DB2 UDB/WebSphere Application Tuning Guide

� Design Advisor Wizard: Helps the administrator determine the best set of indexes for a given workload. A workload contains a set of weighted SQL statements that can include queries as well as updates. The wizard recommends which new indexes should be created, which existing indexes to keep, and which existing indexes to drop. The Design Advisor Wizard can be invoked from the DB2 Control Center, or using the db2advis utility. Figure 3-9 shows the recommendation screen.
Figure 3-9 Design Advisor Wizard
� Configuration Advisor Wizard: Helps he administrator tune the performance of the database, by updating configuration parameters to match business requirements. The administrator specifies available memory, and workload details and the wizard recommends appropriate values for the database configuration parameters. The Configuration Advisor Wizard can be invoked from the DB2 Control Center. Figure 3-10 shows the recommendation screen.
Chapter 3. Overview of DB2 UDB 8 141

Figure 3-10 Configure Performance Wizard
� The Health Monitor and the Health Center
DB2 Version 8 introduces two new features to help you monitor the health of DB2 systems — the Health Monitor and the Health Center. These tools add a management by exception capability to DB2 UDB by alerting the DBA to potential system health issues. This enables the DBA to address health issues before they become real problems that affect your system’s performance.
142 DB2 UDB/WebSphere Application Tuning Guide

The Health Monitor is a server-side tool that constantly monitors the health of the instance, even without user interaction. If the Health Monitor finds that a defined threshold has been exceeded (for example, the available log space is not sufficient), or if it detects an abnormal state for an object (for example, an instance is down), the Health Monitor will raise an alert. When an alert is raised, two things can occur:
– Alert notifications can be sent by e-mail or to a pager address, allowing you to contact whoever is responsible for a system.
– Preconfigured actions can be taken. For example, a script or a task can be run.
The Health Center provides the graphical interface to the Health Monitor. The DBA can use it to configure the Health Monitor, and to view the rolled up alert state of DB2 instances and database objects. The DBA can use the Health Monitor’s drill-down capability to access details about current alerts, and obtain a list of recommended actions on resolving the alert.
The following guidelines apply to the use of some of these tools:
� Choose the Snapshot Monitor or Event Monitor to gather data about DB2’s operation, performance, and the applications using it. This data is maintained as DB2 runs, and can provide important performance and troubleshooting information.
� Choose the Explain Facility to analyze the access plan of an SQL statement, or a group of SQL statements.
� Choose the db2batch tool to measure and analyze the performance of a set of SQL statements. Performance times can be returned along with Snapshot Monitor data for analysis. Explain information can be gathered for use by the Explain Facility.
� Choose the CLI/ODBC/JDBC Trace Facility to track activity between a CLI client and DB2. This facility can help pinpoint long running statements, and analyze the time spent in the client application, DB2, or the network.
� The Design Advisor Wizard and the Configuration Advisor Wizard should be run after significant changes to the workload have occurred, or are anticipated. Given the potential for significant resource consumption by these wizards, these executions should be relegated to offpeak hours.
� Use the Health Monitor and Health Center to take a proactive approach to manage the DB2 environment by exploiting its management by exception capabilities.
Some of the monitoring tools include information collected by one or more of the other monitoring tools. For example, db2batch and the Event Monitor also display information collected by the Snapshot Monitor.
Chapter 3. Overview of DB2 UDB 8 143

3.7 Problem diagnosis introductionProblem diagnosis is triggered by user complaints as well as routine monitoring to identify problem situations that may lead to performance problems in future.
This section briefly discusses various conditions that may cause performance problems, and discuss how they may be resolved.
As with any other problem-determination technique, the first step is to try and reproduce or identify the problem. Some symptoms may be sporadic while others are recurring.
While routine monitoring of the system may assist the administrator in identifying the problem, it is more likely that exception monitoring may be required to hone in on the problem. Exception monitoring requires detailed monitoring traces to be activated during the problem window to obtained further information for proper diagnosis. Since such exception monitoring traces can add significant processing overhead, it needs to be focused and targeted. Sometimes, the administrator may need to try and reproduce the problem on a regression test system in order to avoid impacting the production environment.
Routine monitoring involves gathering information for capacity planning purposes, with both low overhead monitoring throughout, and detailed monitoring in shorts bursts at peak periods.
After the problem is reproduced or identified, it will fall into one of two groups:
� Problems affecting one application or a group of applications:
Problems that affect a single application or a group of applications can be further subdivided into two categories:
– Applications that have had a good performance history in a development or testing environment, but do not perform as expected when working against production databases. Working against low volumes of data may hide problems. Some of the non-detected problems may be those associated with casting, lack of indexes, joins, sorts, access plans, isolation levels, or size of the answer set.
Attention: MON_HEAP_SZ indicates the amount of memory (in 4K pages) which is allocated for database monitor data (at db2start). The amount of memory needed will depend on the number of snapshot switches which are turned on and active Event Monitors. If the memory heap is insufficient, an error will be returned when trying to activate a monitor and it will be logged to the db2diag.log file.
144 DB2 UDB/WebSphere Application Tuning Guide

– Applications whose behavior is erratic. These applications may usually have good response times, but under certain conditions, their response times are very degraded. These applications may have concurrence-related problems: deadlocks, waits, and so on.
� Problems affecting all applications:
Problems that affect all applications usually appear when changes are made to data loads, the number of users, the operating system, or the database configuration parameters. The cause of these types of problems is usually found in the following areas:
– Configuration parameters (sorts, buffer pool, logs, lock list). Sometimes, this is not caused by a modification in the parameter, but by the environment itself. Bigger tables that require a larger sort heap or the updating of more rows in a table may require a larger log buffer. Also, more users exhausting the lock list and provoking concurrence problems can cause problems that affect all database applications.
– Operating system problems, such as I/O contention or excessive paging.
– Network problems, if the clients or applications are remote.
– Data access problems, where access plans may be dated, statistics may not have been updated, or packages may not be rebound.
Attention: Details on how to gather, analyze, pinpoint and resolve DB2 problems are beyond the scope of this document. Please refer to the documents listed earlier for such information.
Chapter 3. Overview of DB2 UDB 8 145

146 DB2 UDB/WebSphere Application Tuning Guide
Chapter 4. WebSphere Application Server and DB2 UDB performance
In this chapter, we provide a detailed description of the key components that impact performance in a WebSphere Application Server and DB2 UDB environment, and offer some best-practices guidelines for their usage.
The topics covered include:
� Connection pool� Prepared statement cache� Session database� Enterprise Java Beans
4
© Copyright IBM Corp. 2003 147

4.1 IntroductionIn Chapter 2, “Overview of WebSphere Application Server V4.0” on page 13 and Chapter 3, “Overview of DB2 UDB 8” on page 97 we provided an overview of WebSphere Application Server and DB2 UDB, and described their key performance components, indicators, best practices, and tools for achieving optimal performance. In this chapter, we focus on those key components specific to the interface between WebSphere Application Server and DB2 that can impact the performance of WebSphere Application Server and DB2 UDB environment.
In 2.6, “Typical application flow” on page 34 we describe a typical flow of a Web browser application using WebSphere Application Server and DB2, and provided a high level overview of the key components that impact the performance of a WebSphere Application Server and DB2 UDB environment such as the connection pool, prepared statement cache, session database, and EJBs. We shall now describe each of these components in greater detail, using the following format for each component:
� Detailed description � Best practices
4.2 Connection poolEach time an application attempts to access a database, it must first connect to that database, before it can issue queries against it. A database connection incurs overhead as it requires resources to create the connection, maintain it, and then release it when it is no longer required.
Database connection overhead can be particularly high for Web based applications for the following reasons:
� Web users connect and disconnect more frequently.
� User interactions are typically shorter, with more effort often spent connecting to the database, and disconnecting from it, than performing the actual user requests.
� Web requests tend to be unpredictable both in terms of volume and frequency, which can place severe demands on database connections.
To address this problem, WebSphere has implemented a connection pooling feature based on the JDBC 2.0 Optional Package API specification. For a basic understanding of the JDBC 2.0 Core API and the JDBC 2.0 Optional Package API, refer to http://java.sun.com/products/jdbc/download.html.
148 DB2 UDB/WebSphere Application Tuning Guide

Connection pooling is a mechanism whereby a system administrator can define a pool of connections for a single datasource that may be reused by multiple users, without each one of them incurring the overhead of connecting and disconnecting from the database. Connection pooling can improve the response time of any application that requires connections, especially Web-based applications.
When a user makes a request over the Web to a resource, the resource accesses a datasource. Most user requests do not incur the overhead of creating a new connection, because the datasource might locate and use an existing connection from the pool of connections. When the request is satisfied and the response is returned to the user, the resource returns the connection to the connection pool for reuse.
Here again, the overhead of a disconnect is avoided. Each user request incurs a fraction of the cost of connection or disconnection. After the initial resources are used to produce the connections in the pool, additional overhead is insignificant because the existing connections are reused. Such reuse can have significant performance benefits since the cost of database connect and disconnect is amortized over multiple users.
4.2.1 Detailed descriptionConnection pooling is the maintenance of a group of database connections for potential reuse by applications on an application server. Figure 4-1 shows represents the state of a connection pool for a given datasource. It describes a connection pool of five connections, two of which are currently in use by users USER_A and USER_C, while three connections that had previously been used by users USER_A, USER_C and USER_D are free and available for reuse.
Chapter 4. WebSphere Application Server and DB2 UDB performance 149
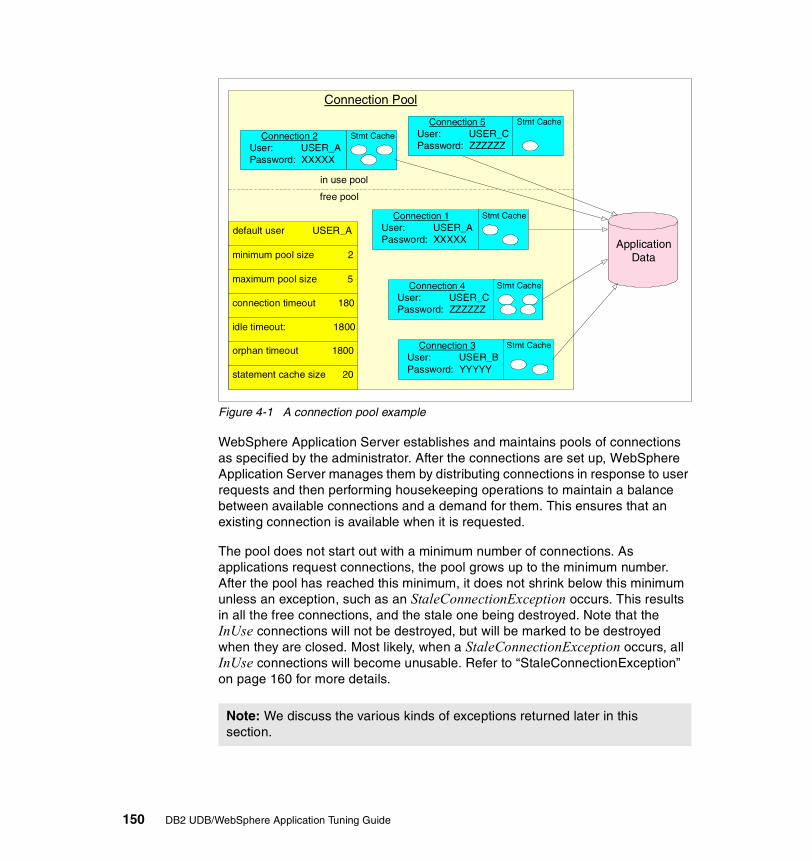
Figure 4-1 A connection pool example
WebSphere Application Server establishes and maintains pools of connections as specified by the administrator. After the connections are set up, WebSphere Application Server manages them by distributing connections in response to user requests and then performing housekeeping operations to maintain a balance between available connections and a demand for them. This ensures that an existing connection is available when it is requested.
The pool does not start out with a minimum number of connections. As applications request connections, the pool grows up to the minimum number. After the pool has reached this minimum, it does not shrink below this minimum unless an exception, such as an StaleConnectionException occurs. This results in all the free connections, and the stale one being destroyed. Note that the InUse connections will not be destroyed, but will be marked to be destroyed when they are closed. Most likely, when a StaleConnectionException occurs, all InUse connections will become unusable. Refer to “StaleConnectionException” on page 160 for more details.
Note: We discuss the various kinds of exceptions returned later in this section.
Connection Pool
Connection 1 User: USER_A Password: XXXXX Application
Data
Connection 2 User: USER_A Password: XXXXX
Connection 3 User: USER_B Password: YYYYY
Connection 4 User: USER_C Password: ZZZZZZ
minimum pool size 2
maximum pool size 5
connection timeout 180
idle timeout: 1800
orphan timeout 1800
statement cache size 20
Stmt Cache
Connection 5 User: USER_C Password: ZZZZZZ
Stmt Cache
Stmt Cache
Stmt Cache
Stmt Cache
default user USER_A
free pool
in use pool
150 DB2 UDB/WebSphere Application Tuning Guide

Figure 4-2 shows how the association between the datasource and the database is defined. The General tab from the Datasource configuration panel in the WebSphere Advanced Administrative Console shows the database name, and the default user and password to be used by all connections in the pool. If a different user and password is specified in the getConnection() method, it will override this default, and obtain a new connection for this user in the pool.
Figure 4-2 General configuration for TRADEDB datasource
Figure 4-3 shows the Connection Pooling tab from the Datasource configuration panel in the WebSphere Advanced Administrative Console, and explains the semantics of the various connection pool parameters that can be set.
Chapter 4. WebSphere Application Server and DB2 UDB performance 151

Figure 4-3 Configuring the connection pool for a datasource
Minimum pool size: The minimum number of connections that the connection pool may hold. By default, this value is 1. Any non-negative integer is a valid value. If the property is set to 0, the pool can shrink to zero connections, which is a valid configuration. The minimum pool size can affect the performance of an application. Smaller pools require less overhead when the demand is low because fewer connections are being held open to the database. On the other hand, when the demand is high, the first applications experience a slow response, because new connections have to be created if all others in the pool are in use. After the pool has reached the minimum number of connections, it does not shrink beyond this minimum unless an exception occurs that requires the pool to be destroyed.
Once allocated, the number of existing database connections never goes below this number.
The number of existing database connections never exceeds this maximum value.
If a request for a connection cannot be fulfilled because the maximum is reached, it will wait for a connection to become free at most this amount of time.
If there are more existing connections than the defined
minimum, the surplus connections are closed if they are idle this amount of time.
If the application has not returned a connection to the pool and there was no activity on this connection within this amount of time, it will be "taken away" from the application and returned to the connection pool.
Up to this number of statements are cached in total for all connections. However each connection maintains its own cache.
If not checked (default), connections are automatically returned to the pool at the end of a transaction.
Note: Various exceptions covered in the following explanations will be discussed later.
152 DB2 UDB/WebSphere Application Tuning Guide

Maximum pool size: The maximum number of connections that the connection pool can hold. By default, this value is 10. Any positive integer is a valid value. If this value is set to 0 or less, a connection cannot be obtained from the database and the application is thrown a ConnectionWaitTimeoutException. The maximum pool size can affect the performance of an application. Larger pools require more overhead when demand is high, because more connections are open to the database at peak demand. These connections persist until they are idled out of the pool (see Idle timeout for more information). On the other hand, if the maximum is smaller, there might be longer wait times or possible connection timeout errors during peak times. The database must be able to support the maximum number of connections used by WebSphere Application Server in addition to any load it may have from other sources.
Connection timeout: Maximum number of seconds an application waits for a connection from the pool before timing out and throwing com.ibm.ejs.cm.pool.ConnectionWaitTimeoutException to the application. The default value is 180 seconds. Any non-negative integer is a valid value. Setting this value to 0 disables the connection timeout. This value can also be changed by calling setLoginTimeout() on the datasource. (ConnectionWaitTimeoutException is discussed in later in this paper.) If setLoginTimeout() is called on the datasource, this sets the timeout for all applications that are using that datasource. For this reason, it is recommended that setLoginTimeout not be used. Instead, the connection timeout property should be set on the datasource during configuration.
Idle timeout: The number of seconds that a connection can remain free in the pool before the connection is removed from the pool and closed. The default value is 1800 seconds. Any non-negative integer is a valid value. Connections need to be idled out of the pool, because keeping connections open to the database can cause memory problems with the database in some cases. Not all connections are idled out of the pool, even if they are older than the idle timeout number of seconds. A connection is not idled, if removing this connection would cause the pool to shrink below its minimum value. Setting this value to 0 disables the idle timeout.
Orphan timeout: The number of seconds that an application is allowed to hold an inactive connection. The default is 1800 seconds (30 minutes). Any non-negative integer is a valid value. If there is no activity on an allocated connection for longer than the orphan timeout number of seconds, the connection is marked for orphaning. After another orphan timeout number of seconds, if the connection still has no activity, the connection is returned to the pool. If the application tries to use the connection again, it is thrown a StaleConnectionException. Connections that are enlisted in a transaction are not orphaned. Setting this value to 0 disables orphan timeout.
Chapter 4. WebSphere Application Server and DB2 UDB performance 153

Statement cache size: The number of cached prepared statements to keep for the entire connection pool, and not per connection. The default value is 100. Any non-negative integer is a valid value. Statement cache size is covered in further detail in“Prepared statement cache” on page 169.
Disable AutoConnection cleanup: Specifies whether or not the connection is closed at the end of a transaction. The default is false, which indicates that when a transaction is completed, WebSphere Application Server connection pooling closes the connection, and all associated resources and returns the connection to the pool. This means that any attempt to use of the connection after the transaction has ended, results in a StaleConnectionException, because the connection has been closed and returned to the pool. This mechanism ensures that connections are not held indefinitely by the application. If the value is set to true, the connection is not returned to the pool at the end of a transaction.
In this case, the application must return the connection to the pool by explicitly calling close(). If the application does not close the connection, the pool will run out of connections for other applications to use. This is different from orphaning connections, because connections in a transaction cannot be orphaned. However, if the application needs to hold a connection outside of the scope of the transaction, the administrator can configure a datasource to not automatically clean up connections obtained from that datasource by setting this value to true. This option should be set only if the application always closes its own connection. When this property is set to true, the pool quickly runs out of connections, if the application does not close all connections as soon as they are finished using it.
A connection object exists in one of three states:
� DoesNotExist� InFreePool� InUse
Every connection begins its lifecycle in the DoesNotExist state. When an application server starts up, the connection pool does not exist, and therefore there are no connections. The first connection is not created until an application requests its first connection. Additional connections are created as needed, according to the guarding condition. After a connection has been created, it can be either in the InUse state, or the InFreePool state, depending on whether it has been allocated to an application or not.
154 DB2 UDB/WebSphere Application Tuning Guide

Figure 4-4 shows the three valid states of a connection object, and the conditions under which state change occurs.
Figure 4-4 Connection object life cycle
When the application requests a connection from the WebSphere Application Server connection pool, one of the following events occurs:
� A new connection is created to the database.
� An existing connection might be retrieved from the connection pool, or shared with another request for a connection.
� A connection time-out exception is returned.
� A stale connection exception is returned.
These various events are covered in the following sections.
Connection LifecycleCondition:getConnection ANDNOT(freeConnectionAvailable) ANDpoolSizeLTMax ANDNOT(ConnectionInUseWithSameProperties)
In FreePool
In UseProperties
UsernamePasswordTransaction id
DoesNot Exist
Condition:(close()AND noOtherReferences) OR(connectionOrphanedANDnoTX) OR(txEnds)
Condition:getConnection NDfreeConnectionAvailable ANDNOT(connectioninUserWithSameProperties)
Condition:(caughtStateConnection)OR (connectionidled ANDpoolSizeGTMin)
Condition:getConnection ANDconnectionInUseWithSameProperties
Condition:close() ANDmarkedState
Chapter 4. WebSphere Application Server and DB2 UDB performance 155

New connectionA connection object is created when the all following conditions are satisfied:
� The application calls getConnection() on the datasource (getConnection).
� No connections are available for use in the free pool (NOT(freeConnectionAvailable)).
� The pool size is less than the maximum pool size (poolSizeLTMax).
� There are no free connections currently in the pool that have the same user name, password, and transaction ID as a connection that is currently in use (NOT(connectionInUseWithSameProperties)).
The transition from DoesNotExist to InUse is as follows:
DoesNotExist -> InUse:getConnection ANDNOT(freeConnectionAvailable) ANDpoolSizeLTMax ANDNOT(conectionInUseWithSameProperties)
This transition implies the following about how connection pooling works:
� All connections being in the DoesNotExist state and are only created when the application requests a connection. This means that the pool is grown from zero to the minimum number of connections as the application requests new connections. The pool is not created with the minimum number of connections when the server starts up.
� If a connection is already in use by the application with the same user name, password and transaction id (that is, it is in the same transaction), the connection is shared by two or more requests for a connection. In this case a new connection is not created.
Existing connection reusedThe concept of connection sharing is seen in the transition on the InUse state as follows:
InUse -> InUse:getConnection ANDconnectionInUseWithSameProperties
This transition states that if an application requests a connection (getConnection) with the same user name, password, and transaction ID as a connection that is already in use (connectionInUseWithSameProperties), the existing connection is shared.
156 DB2 UDB/WebSphere Application Tuning Guide

Connections can be shared by the same user (user name and password), but only within the same transaction. Because a transaction is normally associated with a single thread, connections should never be shared across threads. It is possible to see the same connection on multiple threads at the same time, but this is an error state caused by application programming error.
The transition from the InFreePool state to the InUse state is the most common transition when the application requests a connection from the pool. This transition is stated as follows:
InFreePool -> InUse:getConnection ANDfreeConnectionAvailable ANDNOT (connectionInUseWithSameProperties)
This transition states that a connection will be placed in use from the free pool, if all the following conditions are satisfied:
� Application has issued a getConnection() call on the datasource (getConnection)
� A connection is available for use in the connection pool (freeConnectionAvailable)
� No connection is already in use in the transaction with the same user name and password (NOT(connectionInUseWithSameProperties))
Any request for a connection that can be fulfilled by a connection from the free pool does not result in the creation of a new connection to the database. Therefore, if there is never more than one connection being used at a time from the pool by any number of applications, the pool never grows beyond a size of one. This assumes that all the getConnection() requests have the same username and password specified.
If the username and password on a getConnection() request is different than what's available in the pool, and there is room to create new connections, a new connection will be created with a different username and password. This means that even if there is only one connection in use at any given time, but the requests to a connection pool are for connections with different usernames and passwords, it is possible that the pool will have more than one connection in it. This may be less than the minimum number of connections specified for the pool.
All of the transitions so far have covered the scenarios of getting a connection for use by the application. At this point, the second set of transitions that result in a connection being closed, and either returned to the free pool or destroyed will be covered.
Chapter 4. WebSphere Application Server and DB2 UDB performance 157

Connections should be explicitly closed by the application by calling close() on the connection object. In most scenarios, this results in the following transition:
InUse -> InFreePool:(close AND NOT(otherReferences)) OR(connectionOrphaned AND noTx) OR(txEnds)
The transition from the InUse state to the InFreePool state can be caused by three different conditions as follows:
� If the application calls (close), and there are no references (NOT(otherReferences)) to it, either by an application (application sharing) or by the transaction manager (who holds a reference when the connection is enlisted in a transaction), the connection object is returned to the free pool.
� If the connection has not been used by the application for the orphan timeout amount of time (connectionOrphaned), and there is no transactional context (noTx), the connection is marked for return to the pool, and returned to the free pool during the next orphan timeout.
� If the connection was enlisted in a transaction, but the transaction manager has ended the transaction (txEnds), the connection is closed by default and returned to the pool.
This transition implies the following facts about connection pooling:
� When the application calls close() on a connection, it is returning the connection to the pool of free connections; it is not closing the connection to the database.
� When the application calls close() on a connection, if the connection is currently being shared, it is not returned to the free pool. Instead, after the last reference to the connection is dropped by the application, the connection is returned to the pool.
� When the application calls close() on a connection enlisted in a transaction, the connection is not returned to the free pool. Because the transaction manager must also hold a reference to the connection object, it cannot be returned to the free pool until the transaction has ended. This is because once a connection is enlisted in a transaction, it cannot be used in any other transaction by any other application, until after the transaction has been completed.
There is a case in which the application’s calling close() can result in the connection to the database being closed, bypassing the return of the connection to the pool. This happens if one of the connections in the pool has been determined to be stale. A connection is considered stale, if it can no longer be used to contact the database. One potential reason for a connection being marked as stale is if the database server has been shut down.
158 DB2 UDB/WebSphere Application Tuning Guide

When a connection is marked as stale, the entire pool is cleansed, because it is very likely that all of the connections would have become stale for the same reason. This cleansing operation includes marking all of the currently InUse connections as stale, so they can be destroyed upon closing.
The following transition states the behavior on a call to close(), when the connection is marked as stale:
InUse -> DoesNotExist:close ANDmarkedStale
This transition states that if the application has called close() on the connection, and it has been marked as stale during the pooling cleansing step (markedStale), then the connection object is closed to the database, and not returned to the pool.
Lastly, connections can be closed to the database, and removed from the pool as described by the following transition:
InFreePool -> DoesNotExist:caughtStaleConnection OR(connectionIdled ANDpoolSizeGTMin)
This transition states that there are two cases in which a connection is removed from the free pool and destroyed.
� If a StaleConnectionException is caught (caughtStaleConnection), all connections currently in the free pool are destroyed. This is because most likely all connections in the pool are stale. “StaleConnectionException” on page 160 describes actions on StaleConnectionException occurrences in more detail.
� If the connection has been in the free pool for longer than the idle timeout amount (connectionIdled), and the pool size is greater than the minimum number of connections (poolSizeGTMin), the connection is removed from the free pool and destroyed. This mechanism enables the pool to shrink back to its minimum size when the demand for connections is reduced.
WebSphere exceptionsWebSphere connection pooling monitors specific SQLExceptions thrown by the database. A set of these exceptions are mapped to WebSphere Application Server specific exceptions. WebSphere Application Server connection pooling provides these exceptions to ease development by not requiring the developer to know all of the database-specific SQLExceptions that could be thrown for very common occurrences.
Chapter 4. WebSphere Application Server and DB2 UDB performance 159
In addition, monitoring the SQLException enables WebSphere Application Server connection pooling, and therefore, the application to recover from common occurrences such as intermittent network or database outages.
Two commonly encountered exceptions are:
� ConnectionWaitTimeoutException� StaleConnectionException
ConnectionWaitTimeoutExceptionThis exception (com.ibm.ejs.cm.pool.ConnectionWaitTimeoutException) indicates that the application has waited for the connection timeout number of seconds, and has not been returned a connection. This can occur when the pool is at its maximum, and all of the connections are in use by other applications for the duration of the wait. In addition, there are no connections currently in use that the application can share, because either the user name and password are different, or it is in a different transaction.
In all cases in which ConnectionWaitTimeoutException is caught, there is very little to do in terms of recovery. It usually doesn't make sense to retry the getConnection() method, because if a longer wait time is required, the connection timeout should be set higher. Therefore, if this exception is caught by the application, the administrator should review the expected usage of the application, and tune the connection pool and the database accordingly. Catching this exception is optional, because ConnectionWaitTimeoutException is a subclass of SQLException; any application that catches SQLException automatically catches this exception as well.
StaleConnectionExceptionThis exception (com.ibm.websphere.ce.cm.StaleConnectionException) indicates that the connection currently being held is no longer valid. This can occur for a number of reasons, including these:
1. The application tries to get a connection and fails, as when the database is not started.
2. A connection is no longer usable due to a database failure. When an application tries to use a connection it has previously obtained, the connection is no longer valid. In this case, all connections currently in use by an application could get this error when they try to use the connection.
3. The application tries to use a JDBC resource, such as a statement, obtained on a now-stale connection.
4. The application using the connection has already called close() and then tries to use the connection again.
160 DB2 UDB/WebSphere Application Tuning Guide
5. The connection has been orphaned because the application had not used it within a time interval of twice the orphan timeout value, and then the application attempted to use the orphaned connection.
Applications are not required to explicitly catch a StaleConnectionException. A StaleConnectionException is a subclass of java.sql.SQLException, which applications are already required to catch. However, catching a StaleConnectionException makes it possible for applications to recover from bad connections in many instances.
The most common time for StaleConnectionException to be thrown is the first time that a connection is used, just after it is retrieved. Because connections are pooled, a database failure is not detected until the operation immediately following its retrieval from the pool, which is the first time communication to the database is attempted. And it is only when a failure is detected that the connection is marked stale. StaleConnectionException occurs less often if each method that accesses the database gets a new connection from the pool.
Examining the sequence of events that occur when a database fails to service a JDBC request shows that this occurs because all connections currently handed out to an application are marked stale; the more connections the application has, the more connections can be stale.
Generally when StaleConnectionException is caught, the transaction in which the connection was involved needs to be rolled back, and a new transaction begun with a new connection. Details on how to do this can be found in the “WebSphere Connection Pooling” document by Deb Ericson, Shawn Lauzon, Melissa Modjeski, which is located at:
http://www.ibm.com/software/webservers/appserv/whitepapers/connection_pool.pdf
4.2.2 Best practicesFrom an application programming perspective, WebSphere Application Server provides two options for establishing database connections:
1. Programming directly to the connection pooling model through the JDBC 2.0 Optional Package API.
Important: The first three items in the foregoing list cause the connection pool to be destroyed and rebuilt automatically. On the other hand, the last two items do not cause the connection pool to be destroyed, since the problem is not related to database or network connection errors that affect all the connections in the pool.
Chapter 4. WebSphere Application Server and DB2 UDB performance 161
2. Use of the IBM data access beans, which also use connection pooling, but give you additional ability to manipulate result sets.
The following considerations apply to both these approaches.
WebSphere Application Server connection pooling should be used in applications that meet any of the following criteria:
� It cannot tolerate the overhead of obtaining and releasing connections whenever a connection is used.
� It requires JTA1 transactions within WebSphere Application Server.
� It does not manage the pooling of its own connections.
� It does not manage the specifics of creating a connection, such as the database name, user name, or password.
Connection pooling best practices are categorized as being application related, and system related.
Application related best practicesThe following application programming techniques are considered to be best practices for achieving optimal performance.
� Cache JNDI lookups:
From a performance perspective, JNDI lookups are an expensive operation. Therefore, an application should perform these operations as infrequently as possible. This applies not only to datasource lookups, but also to the lookup of the javax.transaction.UserTransaction object in client-managed transactions.
Create a separate method that performs these lookup operations. Call this method from the servlet’s init() method, or from the enterprise bean’s ejbActivate() method as described in 2.9.6, “Use the HttpServlet Init method judiciously” on page 50.
1 Java Transaction API (JTA) specifies standard Java interfaces between a transaction manager and the parties involved in a distributed transaction system: the resource manager, the application server, and the transactional applications.
Note: The memory footprint for a connection is between one and two megabytes, and its consumption should therefore be optimized in WebSphere Application Server.
162 DB2 UDB/WebSphere Application Tuning Guide

� Use connection sharing:
Connections can be shared by the same user (user name and password), but only within the same transaction. This is known as connection sharing, and should be used only on a single thread. For example, when a servlet starts a user transaction and gets a connection, it does some database operations and then calls a CMP EJB, which also needs a connection. The connection is then shared between the servlet, and the EJB on a single thread.
Connections should never be shared across threads. It is possible to see the same connection on multiple threads at the same time, but this is an error state, and is caused by poor programming practices. For example, when a servlet init()2 method performs the JNDI lookup for a connection, and also gets its own connection. Each time the service() method is called, the same connection gets used, but these calls come in on different threads within the JVM. This can cause problems like time-outs and StaleConnectionException errors.
� Avoid using different user names and passwords:
Applications often run into problems when more than one connection is obtained, and each has a different user name. When the second connection with a different user name is obtained from the pool, a different connection to the database is returned to the application.
This results in two physical connections to the database being held by the application, with no connection sharing. If the datasource used to create the connection is not JTA-enabled (a one-phase commit datasource), then there is a global transaction in force resulting in an error condition, since there are two one-phase resources enlisted in the same global transaction.
� Do not declare connections as static objects:
If connection objects is declared as static, then it is possible for the same connection to be shared by different threads at the same time resulting in problems with connection pooling, and database access.
A connection should always be obtained and released within the method that requires it.
� Do not declare connection objects as instance variables:
In a servlet, all variables declared as instance variables act as if they are class variables. For example, suppose a servlet is defined with an instance variable:
Connection conn = null;
2 This is a static method, which is what enables multiple threads to use the same connection.
Chapter 4. WebSphere Application Server and DB2 UDB performance 163

This variable acts as if it is static. This implies that all instances of the servlet would use the same connection object. This is because a single servlet instance can be used to serve multiple Web requests in different threads.
� Do not manage data access in CMP beans:
If a CMP bean is written so that it manages its own data access, this data access might be part of a global transaction. Generally, it is best to have data access occur in a BMP session bean.
� Open one connection at a time:
In general, an application should open only one connection to the database at a time. If two getConnection() calls with the same parameters are issued in the same global transaction, only a single connection is allocated. You are allowed to open only one single-phase-commit connection within a global transaction.
However, if the application is not running in a global transaction (as is the case with most servlets), two getConnection() calls result in two separate connections. This utilizes more resources than necessary, and causes your connection pool to fill twice as fast, often resulting in ConnectionWaitTimeout exceptions.
If the application requires multiple simultaneous connections, close each connection as soon as it is no longer required, to free that connection up for another user.
� Always close objects:
It is very important that ResultSet, Statement, PreparedStatement, and Connection objects get closed properly in the application.
If connections are not closed properly, users may experience long waits for connections to time-out, and delay return of the connection to the free pool. Unclosed ResultSet, Statement, or PreparedStatement objects unnecessarily hold resources at the database as well.
To ensure that these objects are closed in both correct execution and exception or error states, always close ResultSet, Statement, PreparedStatement, and Connection object in the finally section of a try/catch block.
WebSphere Application Server will try to clean up JDBC resources on a connection after it has been closed. However, this behavior should not be relied upon, especially if the application might be migrated to another platform in the future, thus requiring code rewrite.
164 DB2 UDB/WebSphere Application Tuning Guide

� Obtain and close the connection in the same method:
This keeps the application from holding resources that are not being used, and leaves more available connections in the pool for other applications.
There may be times when it is not feasible to close a connection in the same method in which the connection was obtained. For example, if the isolation level is Read Committed and locks are obtained, closing the connection or result set causes these locks to be dropped. If it is not desirable to have the locks dropped until a later time, the connection should not be closed until after it is safe to drop the locks.
� Do not close connections in a finalize method:
If an application waits to close a connection or other JDBC resource until the finalize() method, the connection is not closed until the object that obtained it is garbage-collected, because that is when the finalize() method is called.
Databases can quickly run out of the memory required to store the information about all of the JDBC resources currently open. In addition, the pool can quickly run out of connections to service other requests.
System related best practicesRoutine monitoring of the connection pool is critical to adjusting the various parameters for achieving optimal performance. The Resource Analyzer is the primary tool for monitoring connection pool usage. Appropriate monitoring levels have to be set in order to view desired information.
While the default monitoring level is none, we recommend that you choose an appropriate monitoring level based on you organization’s needs, and the overheads associated with it for your particular environment. The administrator should also occasionally perform exception monitoring with a monitoring level of Maximum during bursts of peak activity to obtain adequate information about the system under stress, in order to effectively tune connection pool parameters.
Figure 4-5 shows an example of connection pool statistics captured by the Resource Analyzer with a monitoring level setting of Maximum.
Chapter 4. WebSphere Application Server and DB2 UDB performance 165
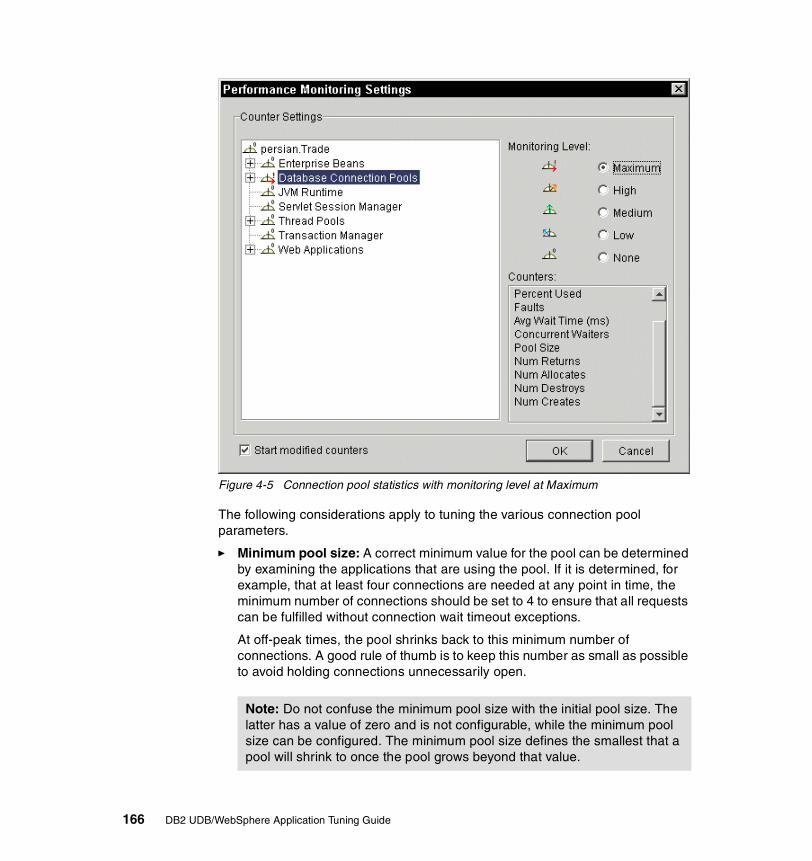
Figure 4-5 Connection pool statistics with monitoring level at Maximum
The following considerations apply to tuning the various connection pool parameters.
� Minimum pool size: A correct minimum value for the pool can be determined by examining the applications that are using the pool. If it is determined, for example, that at least four connections are needed at any point in time, the minimum number of connections should be set to 4 to ensure that all requests can be fulfilled without connection wait timeout exceptions.
At off-peak times, the pool shrinks back to this minimum number of connections. A good rule of thumb is to keep this number as small as possible to avoid holding connections unnecessarily open.
Note: Do not confuse the minimum pool size with the initial pool size. The latter has a value of zero and is not configurable, while the minimum pool size can be configured. The minimum pool size defines the smallest that a pool will shrink to once the pool grows beyond that value.
166 DB2 UDB/WebSphere Application Tuning Guide

The Pool Size field in Figure 4-5 on page 166 provides the average pool size during the monitoring interval, and can be used to set the minimum pool size value.
� Maximum pool size: The maximum number of connections that the connection pool can hold open to the database. The pool holds this maximum number of connections open to the database at peak times. At off-peak times, the pool shrinks back to the minimum number of connections.
The best practice is to ensure that only one connection is required on a thread at any time. This avoids possible deadlocks when the pool is at maximum capacity and no connections are left to fulfill a connection request. Therefore, with one connection per thread, the maximum pool size can be set to the maximum number of threads. When using servlets, this can be determined by looking at the MaxConnections property in the Servlet Engine.
If multiple connections are required on a thread, the maximum pool size value can be determined using the following formula:
T *(C -1)+1
In this formula:
T is the maximum number of threads
C is the number of concurrent database connections necessary per thread
For example, if the application uses two threads, each of which requires three connections, and a maximum of 10 applications could be using the pool at peak times, the resulting value would be (2 * 10) * (3 - 1) + 1, or 41.
The database must be also tuned to be able to handle the maximum number of connections in the pool, plus any additional connections required by programs other than from the application server. For example, if the maximum pool size is set to 25, indicating that the application server may hold 25 connections through this datasource at peak times, and if there is a second application (or even a second WebSphere datasource) that requires an additional 30 connections, ensure that the database can serve 55 connections concurrently.
The Avg Wait Times (ms), Faults, Percent Used and Percent Maxed fields in Figure 4-5, can help you decide whether the maximum pool size ought to be increased or decreased.
� Connection timeout: If applications are often catching ConnectionWaitTimeoutException, this usually means one of two things. Either the connection timeout property is set too low, or the connection pool is always at maximum capacity, and cannot find a free connection for the application to use:
– If the exception is being caused by the connection timeout value being set too low, the solution is to set it to a higher value.
Chapter 4. WebSphere Application Server and DB2 UDB performance 167

– If the exception is caused by too few connections in the pool, the maximum pool size setting needs to be investigated.
The Faults field in Figure 4-5 when analyzed in conjunction with the Percent Used, and Percent Maxed fields can provide guidance on the setting of this parameter.
� Idle timeout: Setting the idle timeout too low can cause performance problems, because the overhead of closing a connection to the database is incurred unnecessarily. In addition, because the connections have been closed, when peak times hit, not enough connections are in the pool, and new connections need to be created. On the other hand, holding connections in the pool for great amounts of time can result in memory problems in some databases. The database may hold information on all of the transactions that have occurred on the connection. When the connection is held open for a long time, this information builds up on the database server, which then runs out of memory.
The Idle Timeout property is application-dependent and often requires trial and error to find an optimal value.
A high value in the Num Creates and Num Destroys fields in Figure 4-5 may indicate a problem with the setting of this parameter value, and require raising this value.
� Orphan timeout: This timeout ensures that a rogue application does not unnecessarily hold connections in the InUse pool. If this value is set too low, it is possible that while an application is processing data, the unused connection can be orphaned, and returned to the pool. This results in a StaleConnectionException being thrown to the application after the application tries to use the orphaned connection, or one of its associated resources. If an application is experiencing large volumes of these exceptions, and it is determined that they are not due to a database or network failure, the orphan timeout should be investigated.
Applications that are written to obtain a connection, use it, and close it immediately after use, do not tend not to have problems with orphaning of connections. A connection that is actively processing at the database is not orphaned, even if the processing takes longer than the orphan timeout number of seconds.
A connection is marked for orphaning after it has been unused by the owning application for the orphan timeout number of seconds. Then, after a second cycle of orphan timeout number of seconds has elapsed, the connection is freed to the pool if the connection is still marked for orphaning. The only way that a connection can move from the orphaned state to the InUse state is if the owing application uses the connection again before it is freed to the pool. Connections participating in a transaction are never orphaned.
168 DB2 UDB/WebSphere Application Tuning Guide

The orphan timeout property is application-dependent. If an application is continuously receiving StaleConnectionException, the root cause of the exception throwing needs to be determined. This can be done by viewing the message of the exception. If the message states that the class is already closed, it is most likely that the connection is orphaned. If an SQLException is part of the StaleConnectionException message, the exception was caused by the database. If the message indicates that a connection was orphaned, a workaround is to set the orphan timeout to a larger value, while the application is reviewed to ensure that connections are closed as required.
� Statement cache size: This is covered in detail in 4.3, “Prepared statement cache” on page 169.
� Disable AutoConnection Cleanup: Use the default value of false. However, if the application needs to hold a connection outside of the scope of the transaction, the administrator must set this value to true. This option should be set to true only if the application always closes its own connection.
A large number of StaleConnectionException message occurrences, as well as a high value for Faults, Percent Used and Percent Maxed in Figure 4-5 may indicate a problem with this setting, poor application programming practices, or a combination thereof.
When this property is set to true, if the application does not close the connection, the pool will quickly run out of connections, thus depriving other applications from obtaining connections. This is different from orphaning connections, because connections in a transaction cannot be orphaned.
4.3 Prepared statement cacheApplications may access a database using JDBC via any of three options shown in Figure 4-6.
Attention: For further information on connection pooling refer to the WebSphere Connection Pooling white paper available at:
http://www.ibm.com/software/webservers/appserv/whitepapers/connection_pool.pdf
Chapter 4. WebSphere Application Server and DB2 UDB performance 169

Figure 4-6 The three options for JDBC statements
In Figure 4-6:
� A Statement is a class that can execute an arbitrary SQL String passed into it.
� A PreparedStatement3 refines a Statement by adding substitution parameters, and by separating the SQL compilation process from the execution of the Statement.
This allows applications to prepare the statement once (which is an expensive operation), and then reuse it multiple times with different distinct values in the parameter markers (shown as question marks).
Prior to the availability of the global statement cache in DB2 UDB V5, application programmers could use dynamic caching to cache prepared statements in the DB2 server using statement handles. In DB2 CLI terms this means that for a given statement handle, once a statement has been prepared, it does not need to be prepared again (even after commits or rollbacks), so long as the statement handle is not freed.
Applications that repeatedly execute the same SQL statement across multiple transactions, can save a significant amount of processing time and network traffic by:
– Associating each such statement with its own statement handle
– Preparing these statements once at the beginning of the application
3 A prepared statement is a pre-compiled SQL statement that is stored in a prepared statement object.
Issue SQL select, DML or DDL statements to the database.Statement stm = con.createStatement();ResultSet rs = stm.executeQuery(”SELECT * from TAB1”);
Allows repeatable invocation of the same SQL statement with parameters.PreparedStatement stm =con.prepareStatement(”UPDATE t1 SET c1 = ? WHERE c2 = ?”);for(int i=1; i<10; i++){ stm.setInt(1, array[i][0]); stm.setInt(2, array[i][1]); stm.execute();}
Calls a stored procedure (a prepared sequence of statements which resides on the database).CallableStatement stm = con.prepareCall(”CALL stp1(?, ?)”);stm.setInt(1,17);stm.setString(2, "seventeen");stm.execute();
PreparedStatement
Statement
CallableStatement
170 DB2 UDB/WebSphere Application Tuning Guide
– Then executing the statements as many times as is needed throughout the application.
By holding onto the statement handle, application programmers can reuse prepared statements across units-of-work (UOW).
Refer to the Call Level Interface Guide and Reference, SC09-2950 for more information on this subject.
Important: DB2 manuals specify that dynamic caching is not needed in DB2 Universal Database Version 5 and later because of the global dynamic statement cache that is stored on the server. This cache is used to store the most popular access plans for prepared SQL statements. Before each statement is prepared, the server automatically searches this cache to see if the access plan has already been created for the exact SQL statement (by this application or any other application or client). If so, the server does not need to generate a new access plan, but will use the one in the cache instead. There is now no need for the application to cache connections at the client unless connecting to a server that does not have a global dynamic statement cache. A brief overview of how prepared statements are handled in DB2 is provided in “Prepared statements in DB2” on page 177.
However, if an application may connect to multiple relational DBMSs that may or may not support a global dynamic statement cache, it would be appropriate for the application to use DB2 Call Level Interface’s (CLI) dynamic caching mechanism for achieving better performance.
Since WebSphere Application Server supports multiple relational DBMSs that may or may not have a global statement cache, it has been written using dynamic caching and statement handles.
Note: For remote client access, DB2 CLI provides an option, DEFERREDPREPARE, which defers the sending of the PREPARE request until the corresponding execute request is issued. The two requests are then combined into one command/reply flow (instead of two) to minimize network flow and to improve performance.
Deferred prepare is the default and must be explicitly turned off, if required.
Chapter 4. WebSphere Application Server and DB2 UDB performance 171

� A CallableStatement takes away the SQL compilation process entirely by executing a SQL stored procedure4.
WebSphere Application Server provides the administrator with an option of specifying a prepared statement cache as shown in Figure 4-1 on page 150. Similar to a prepared statement in the database, this cache stores the PreparedStatement object of previously prepared statements on a connection basis.
When a new prepared statement is requested on a connection, the cached prepared statement is returned, if available. Under certain workload conditions, this look aside capability can result in improved response times for Web applications.
4.3.1 Detailed descriptionThe statement cache contains PreparedStatement objects of most recently executed statements on a per connection basis as shown in Figure 4-7. It describes a datasource configured with a statement cache size of 10 statements, and a maximum of 3 concurrent connections.
4 A stored procedure is a prepared sequence of statements which resides on the DBMS.
Note: The size of this PreparedStatement object will vary from statement to statement, and consequently the memory footprint for the statement cache in WebSphere Application Server.
172 DB2 UDB/WebSphere Application Tuning Guide

Figure 4-7 Prepared Statement Cache: an example
In Figure 4-7, the application runs five SQL statements (two selects, one delete, one insert and one update). The connections have already been created, and many SQL statements have been executed. There are three prepared statements cached for Connection 1 and 2. Connection 3 has four statements cached. Because statements are compiled into prepared statements as they are used, the prepared statement cache reflects the database usage patterns of the application.
A PreparedStatement object, representing a given SQL statement, can appear multiple times in the prepared statement cache. In particular, it can appear once for every connection in the connection pool. In Figure 4-7, statements 1 and 2 appear three times — once for each connection. Statement 3 doesn't appear for connection 3 and Statement 4 and 5 only appear for connection 3. Hence, it might take a little longer to execute Statements 4 and 5 if they occur on Connections 1 and 2 because of the need to recompile them for those connections. A better alternative for this example would be to set the prepared statement cache of size to 15 statements, to allow for each of the 3 connections to cache their 5 prepared statements.
Chapter 4. WebSphere Application Server and DB2 UDB performance 173

The value of the statement cache can be set in the Connection Pooling tab from a datasource configuration panel in the WebSphere Advanced Administrative Console, as shown in Figure 4-3 on page 152. To disable the statement cache, set the Statement Cache Size value to 0.
The actions performed by WebSphere Application Server when the statement cache is defined with non-zero and zero values is described here.
Non-zero statement cache sizeThe following actions are performed by WebSphere Application Server when an application issues a prepare statement against a connection:
1. It does a look aside in the statement cache for this connection to see if a PreparedStatement object already exists for this statement.
– If such an object exists, it returns this object to the application
– If such an object does not exist, WebSphere Application Server requests a prepare against the database for this statement, and returns the PreparedStatement object to the application5
This operation is repeated for each prepare statement.
2. When the application performs a statement close() or commits, it puts this PreparedStatement object in the statement cache. If this action would cause the cache size limit to be exceeded, then it discards an existing PreparedStatement object in the cache using a first-in-first-out (FIFO) basis, to make room for this one. The PrepStmt Cache Discards field in Figure 4-5 on page 166 which counts the number of discards from the statement cache, is incremented after a discard.
5 With Deferred Prepare (which is the default), this prepare request is only sent to the database with the next execute request for this PreparedStatement object.
Note: A WebSphere Application Server request to prepare a statement does not necessarily cause the database to execute the prepare statement. DB2 UDB will first perform a look aside in its own global dynamic statement cache for this statement, before deciding to execute the prepare statement and return the PreparedStatement object to WebSphere Application Server.
Important: DB2 UDB will prepare a statement if it is not found in its global dynamic statement cache, even if the PreparedStatement object for this statement is still available in WebSphere Application Server’s statement cache.
174 DB2 UDB/WebSphere Application Tuning Guide

Zero statement cache sizeWhen there is no statement cache, WebSphere Application Server will execute a request for a prepare against the database for every application prepare statement. Here again, a separate statement handle is allocated by WebSphere Application Server for each open cursor. However, at commit, the statement handles are destroyed, since there is no statement cache. Subsequent applications that reuse this connection will require WebSphere Application Server to set up the appropriate structures to issue the prepare request against the database.
Our observations were based on a based on a simple test we conducted, with a zero statement cache, and a statement cache of 10. We turned on CLITRACE, so that we could monitor traffic from WebSphere Application Server to DB2. We ran the test using the example shown in Example 4-1 with the default autocommit ON, which meant that a commit was implied after each SQL statement execution.
Important: The statement cache holds a pool of PreparedStatement objects, each of which is associated with a statement handle that is tied to a particular connection.
WebSphere Application Server allocates a separate statement handle for each open cursor in the application, and moves the information related to this statement handle to the statement cache at commit time. Thinking of the statement cache as a pool of open statement handles for reuse by subsequent application units-of-work (UOWs) that use this same connection, helps to understand the mechanisms involved in this process.
Important: The elimination of the creation of a prepare request, and the creation and destruction of statement handle structures on the WebSphere Application Server and DB2 side, may contribute to measurable performance degradation depending upon the proportion of this activity to the overall processing of the application.
Given our understanding of the default deferred prepare statement option, and DB2’s algorithm for the global dynamic statement cache, performance benefits of the statement cache is unlikely to stem from a reduction in network flows, or an elimination of an SQL prepare by DB2.
Chapter 4. WebSphere Application Server and DB2 UDB performance 175

Example 4-1 Test sample
Prepare statement1 (SELECT * FROM TRADEACCOUNTBEAN WHERE USERID = ?)Execute statement1Close statement1Prepare statement2 (SELECT * FROM TRADEACCOUNTBEAN WHERE USERID = ?)Execute statement2Close statement2
We ran this simple program twice consecutively, and reviewed the CLITRACE trace output. Excluding SQL requests such as SQLAllocStmt, SQLNumParms, SQLBindParameter, SQLExecute, SQLNumResultCols, SQLFetch, SQLGetData, and SQLTransact, we found the following:
� For statement cache of zero
– 4 SQLPrepareW statements– 4 SQLFreeStmt with fOption=SQL_DROP
� For statement cache of 10
– 2 SQLPrepareW statements– 4 SQLFreeStmt with fOption=SQL_CLOSE
We ran the same test with autocommit=false with identical results.
Given the above observations, we can conclude that applications that issue SQL randomly issue a large number of prepare statements, and have database access constitute a major portion of their processing are likely to benefit from statement caching.
The following documents provide some performance numbers relating to many of the configuration parameters discussed here.
� RP Baartman, “IBM WebSphere Application Server 4.0: Tuning WebSphere, Out-of-the-box to Best Throughput” has a number of measurements related to Web container threads, pass-by-reference, ORB thread pool, connection pool, prepared statement cache, and JVM heap size. It documents performance improvements of up to 15% through tuning of the prepared statement cache.
� Harvey W. Gunther, WebSphere Application Server Development Best Practices for Performance and Scalability, IBM 2000 http://www.ibm.com/software/webservers/appserv/ws_bestpractices.pdf. It has specific best practices guidelines, and documents the benefits of implementing them in a controlled test environment.
Important: Your mileage will vary!
176 DB2 UDB/WebSphere Application Tuning Guide

The following section provides an overview of DB2’s handling of prepared statements.
Prepared statements in DB2In DB2, each SQL statement is cached at a database level, and can be shared among different applications unlike WebSphere Application Server’s prepared statement cache. Static SQL statements are shared among applications using the same package, while dynamic SQL statements are shared among applications using the same compilation environment, and the exact same statement text.
Once a dynamic SQL statement has been created and cached, it can be reused over multiple units of work without the need to prepare the statement again.
The size of the DB2 global statement cache is defined via the PCKCACHESZ database configuration parameter. This cache is allocated in DB2 out of the Database Global Memory when the database is initialized, and freed when the database is shutdown. It is used for caching both static and dynamic SQL statements.
Caching of packages allows the database manager to reduce its internal overhead by eliminating the need to access the system catalogs when reloading a package; or, in the case of dynamic SQL, eliminating the need for compilation. Sections are kept in the package cache until one of the following occurs:
� The database is shut down.� The package or dynamic SQL statement is invalidated.� The cache runs out of space.
Note: A true indication of the efficacy of any cache is to be able to determine the buffer hit ratio. Unfortunately, such a statistic is not currently available from WebSphere Application Server. The PrepStmt Cache Discards field in Resource Analyzer statistics as shown in Figure 4-5 on page 166, is not appropriate for ascertaining the efficacy of the statement cache.
You are therefore advised to adopt a trial and error approach to tuning this parameter, that is, starting with a value of zero and then progressively increasing its value until no benefits are measured.
Note: DB2 will automatically recompile the statement as required, if environment or data object changes occur, such as an object being created or dropped, running runstats, etc.
Chapter 4. WebSphere Application Server and DB2 UDB performance 177
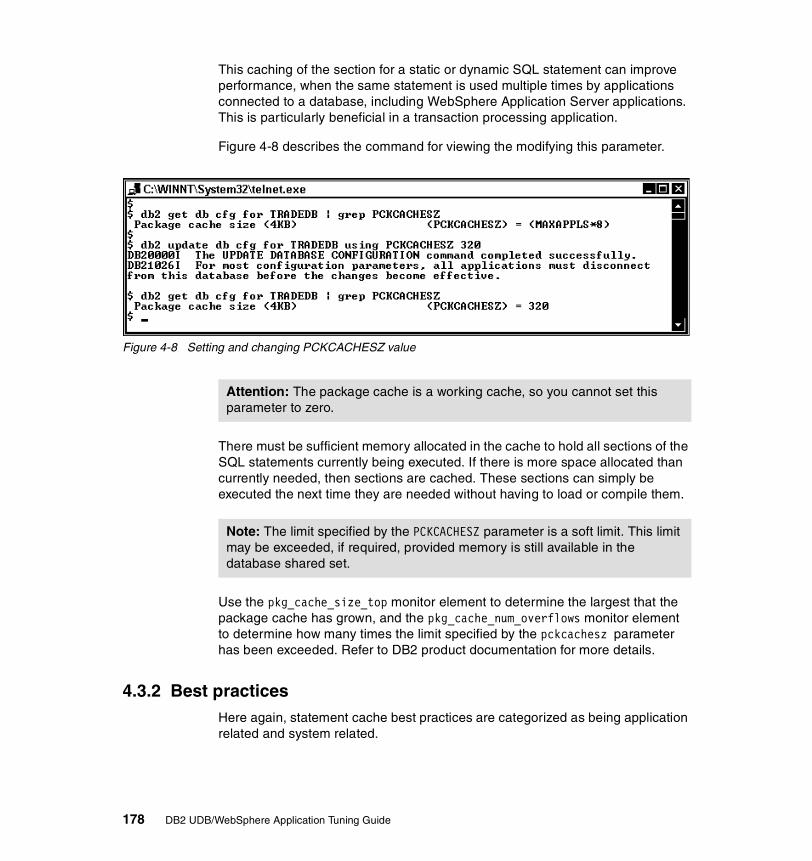
This caching of the section for a static or dynamic SQL statement can improve performance, when the same statement is used multiple times by applications connected to a database, including WebSphere Application Server applications. This is particularly beneficial in a transaction processing application.
Figure 4-8 describes the command for viewing the modifying this parameter.
Figure 4-8 Setting and changing PCKCACHESZ value
There must be sufficient memory allocated in the cache to hold all sections of the SQL statements currently being executed. If there is more space allocated than currently needed, then sections are cached. These sections can simply be executed the next time they are needed without having to load or compile them.
Use the pkg_cache_size_top monitor element to determine the largest that the package cache has grown, and the pkg_cache_num_overflows monitor element to determine how many times the limit specified by the pckcachesz parameter has been exceeded. Refer to DB2 product documentation for more details.
4.3.2 Best practicesHere again, statement cache best practices are categorized as being application related and system related.
Attention: The package cache is a working cache, so you cannot set this parameter to zero.
Note: The limit specified by the PCKCACHESZ parameter is a soft limit. This limit may be exceeded, if required, provided memory is still available in the database shared set.
178 DB2 UDB/WebSphere Application Tuning Guide

Application related best practicesThe key recommendation here is to use a prepared statement with parameter markers, followed by an execute statement in the application program as shown in Figure 4-6 on page 170. This approach is beneficial even if the statement is executed only once in a particular iteration of the program, since other execution iterations of the same application, or other applications can potentially exploit reuse of this PreparedStatement object in the statement cache.
System related best practicesIf the WebSphere Application Server statement cache is not large enough, useful entries will be discarded to make room for new entries. In general, the more prepared statements your application has, the larger the cache should be.
For example, if the application has 5 SQL statements, and the data source maximum connection is 10, set the prepared statement cache size to 50.
As indicated earlier, determining the efficacy of the statement cache in WebSphere Application Server has to be a trial and error exercise, since metrics such as a buffer hit ratio is not available, and the PrepStmt Cache Discards field in the Resource Analyzer can not be used in isolation for effective tuning.
WebSphere Application Server caching versus DB2 cachingWhile the DB2 manuals recommend that applications should no longer use dynamic caching since the global cache is available, WebSphere Application Server continues to offer the WebSphere Application Server administrator the choice of using it or not through the WebSphere Application Server statement cache option.
Note: While unrelated to statement caching, we recommend that you use stored procedures in DB2 for greater efficiencies when multiple SQL statements are executed in batch mode.
Tip: Size of prepared statement cache = number of unique SQL statements * maximum size of connection pool
Attention: The reader is advised to validate the efficacy of using WebSphere Application Server statement caching in their particular environment through trial and error.
Chapter 4. WebSphere Application Server and DB2 UDB performance 179

4.4 Session databaseMany Web applications find the use of in-memory local session cache adequate for their purpose. The local session cache keeps session information in memory, and local to the machine and WebSphere Application Server where the session information was first created.
Other Web applications may find the following disadvantages of local session management unacceptable:
� Local sessions do not share session information with other clustered machines. Users can only obtain their session information, if they return to the machine and WebSphere Application Server that is holding their session information on subsequent accesses to the Web site.
� A server failure takes down not only the WebSphere Application Server instances running on the server, but also destroys any sessions managed by those instances, since local sessions are not made persistent.
� WebSphere Application Server allows the administrator to define a limit on the number of sessions held in the in-memory cache via the administrative console settings on the session manager, shown in Figure 4-9. This prevents the sessions from acquiring too much memory in the Java Virtual Machine associated with the application server.
Figure 4-9 Session Manager Service — Advanced properties
180 DB2 UDB/WebSphere Application Tuning Guide
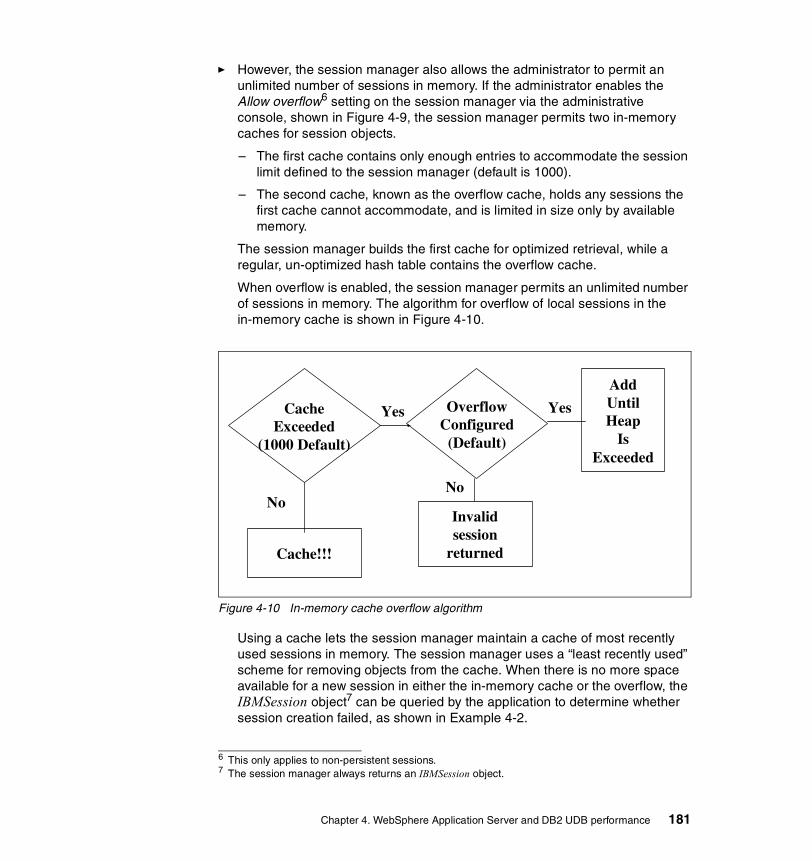
� However, the session manager also allows the administrator to permit an unlimited number of sessions in memory. If the administrator enables the Allow overflow6 setting on the session manager via the administrative console, shown in Figure 4-9, the session manager permits two in-memory caches for session objects.
– The first cache contains only enough entries to accommodate the session limit defined to the session manager (default is 1000).
– The second cache, known as the overflow cache, holds any sessions the first cache cannot accommodate, and is limited in size only by available memory.
The session manager builds the first cache for optimized retrieval, while a regular, un-optimized hash table contains the overflow cache.
When overflow is enabled, the session manager permits an unlimited number of sessions in memory. The algorithm for overflow of local sessions in the in-memory cache is shown in Figure 4-10.
Figure 4-10 In-memory cache overflow algorithm
Using a cache lets the session manager maintain a cache of most recently used sessions in memory. The session manager uses a “least recently used” scheme for removing objects from the cache. When there is no more space available for a new session in either the in-memory cache or the overflow, the IBMSession object7 can be queried by the application to determine whether session creation failed, as shown in Example 4-2.
6 This only applies to non-persistent sessions.7 The session manager always returns an IBMSession object.
OverflowConfigured
(Default)
CacheExceeded
(1000 Default)
Yes
No
AddUntilHeap
IsExceeded
Yes
Invalidsession
returnedCache!!!
No
Chapter 4. WebSphere Application Server and DB2 UDB performance 181

Example 4-2 Query IBMSession
IBMSession sess = (IBMSession)request.getSession();if(sess.isOverFlow())
{//redirect to error page telling the user that login failed at this timeand that the user should try again in a little while
}else{
//do the regular stuff}
� Without limits on the number of sessions, the session caches may consume all available memory in the WebSphere Application Server instance’s heap, leaving no room to execute Web applications. Two potential scenarios for such an occurrence are:
– The site receives greater traffic than anticipated, generating a large number of sessions held in memory.
– A malicious attack occurs against the site where a user deliberately manipulates their browser, so that the application creates a new session repeatedly for the same user.
These disadvantages can be overcome by enabling persistent session management. When the administrator enables this option, WebSphere Application Server places session objects in a database.
Administrators should enable persistent session management when:
� The user’s session data must be recovered by another clone, after a clone in a server groups fails or is shut down.
� The user’s session data is too valuable to lose through unexpected failure at the WebSphere Application Server node.
� The administrator desires better control of the session cache memory footprint. By sending cache overflow to a persistent session database, the administrator controls the number of sessions allowed in memory at any given time.
Note: When overflow is disabled for local sessions, and the maximum number of in-memory sessions limit is reached, IBMSession.isOverFlow() returns true — in all other cases, it returns false.
182 DB2 UDB/WebSphere Application Tuning Guide

All information stored in a persistent session database must be serialized. As a result all of the objects held by a session must implement java.io.Serializable if the session needs to be stored in a persistent session database. Refer to 2.9.19, “Ensure that session objects are serializable” on page 63 for guidelines on making session objects java.io.Serializable.
Persistent session management does not impact the session API, and Web applications require no API changes to support persistent session management. However, applications storing non-serializable objects in their sessions require modification before switching to persistent session management.
Figure 4-9 on page 180 shows how the administrator can configure an Invalidation timeout parameter. If a timeout value is set, it specifies the number of minutes since the session object was last accessed, after which the session can be removed from the in-memory cache and the database if persistent sessions are used.
If the user no longer needs the session object because they went through the logoff process for the site, the session becomes an excellent candidate for invalidation. Invalidating a session removes it from the session cache, as well as from the session database.
WebSphere Application Server offers three methods for invalidation session objects:
� Programmatically, by calling the invalidate() method on the session object.If the session object is accessed by multiple threads in a Web application, ensure that none of the threads still have references to the session object.
� An invalidator thread scans for timed out sessions every n seconds, where n is a function of the Invalidation timeout value. This sleep interval can be explicitly set for the invalidation thread using the system property SessionReaperInterval. This property is specified as -DSessionReaperInterval=interval(in seconds).
Attention: WebSphere Application Server only serializes attributes that are marked as Serializable. WebSphere Application Server traps non-serializable exceptions and writes them to the standard output log. The application is not aware of the NotSerializableException, and the problem is not detected until you attempt to use the missing data.
Attention: Session data is stored to the persistent store based on the Write frequency and Write contents option selected, and is not related to the cache overflow algorithm. The details of storing sessions in persistent store are discussed in 4.4.1, “Detailed description” on page 184.
Chapter 4. WebSphere Application Server and DB2 UDB performance 183

� For persistent sessions only, the administrator can specify times when the scan will be run. The session database cleanup schedule for invalidated sessions is set in the Configure Persistence Tuning window, as seen in Figure 4-12 on page 186.
4.4.1 Detailed descriptionA datasource must first be created for the database that will contain the session data.
Persistent session management is enabled by clicking the Persistence tab in the Session Manager Service window, and choosing one of various policies available as shown in Figure 4-11. The default policy is Medium.
After choosing the options on this window, you need to click the Database tab in order to set session database parameters. This is covered in “Session Manager Service — Database” on page 193.
Notes:
1. HttpSession timeouts are not enforced. Instead, all invalidation processing is handled at the configured invalidation times.
2. HttpSessionBindingListener processing is potentially delayed by this configuration. It is not recommended if listeners are used.
184 DB2 UDB/WebSphere Application Tuning Guide

Figure 4-11 Session manager service — persistence properties
Session Manager Service — PersistenceYou can choose to configure manually by clicking the appropriate button, which displays the Configure Persistence Tuning window shown in Figure 4-12. This panel allows the administrator to manually tune:
� How often the session data is written to the database� How much data is written� When the invalid sessions are cleaned up in the database
Chapter 4. WebSphere Application Server and DB2 UDB performance 185

Figure 4-12 Configure persistence tuning
The three properties associated with tuning persistence are write frequency, write contents, and cleanup of invalidated sessions in the database.
� Write frequency:
This group of options defines how often the HTTP session data is written to the persistent session database.
– End of servlet service:
With this option, WebSphere Application Server writes the session data to the session database at the completion of the HttpServlet.service() method call. Exactly what is written depends on the Write contents setting.
Note: The last access time attribute is always updated each time the session is accessed by the servlet or JSP. This done to make sure the session does not time out.
If you choose the End of servlet service option, each servlet or JSP access will result in a corresponding database update of the last access time. If you select the Manual update option, the update of the last access time in database occurs on sync() call or at later time.
186 DB2 UDB/WebSphere Application Tuning Guide
– Manual update:
This option allows the application to decide when a session should be stored in the session database. In manual mode, the session manager only sends changes to the persistent data store if the application explicitly requests a save of the session information. Session data will be written to the database when the sync() method is called on the IBMSession object.
Manual mode requires that an application developer use the IBMSession class for managing sessions. When the application invokes the sync() method, the session manager writes the modified session data and last access time to the persistent session database. The session data that is written out to the database is controlled by the Write contents option selected.
If the servlet or JSP terminates without invoking the sync() method, the session manager saves the contents of the session object into the session cache (if caching is enabled), but does not update the modified session data in the session database. The session manager will asynchronously update the database with only the last access time, during the invalidator thread scan. Web developers may use this interface to reduce unnecessary writes to the session database, and thereby to improve overall application performance.
All servlets in the Web application server must perform their own session management in manual mode.
– Time based:
Session data will be written to the database based on the specified write interval value.
The rationale for implementing time based write were the changes introduced with the Servlet 2.2 API. The Servlet 2.2 specification introduced two key concepts:
• It limits the scope of a session to a single Web application.
• It explicitly prohibits concurrent access to an HttpSession from separate Web applications, but permits concurrent access within a given JVM.
Note: Manual updates use an IBM extension to HttpSession that is not part of the Servlet 2.2 API
Chapter 4. WebSphere Application Server and DB2 UDB performance 187

Because of these changes, WebSphere Application Server provided the session affinity mechanism for ensuring that an HTTP request is routed to the Web application handling its HttpSession. This assurance still holds in a work load management (WLM) environment when using persistent HttpSessions. This means that the necessity to immediately write the session data to the database can now be relaxed somewhat in these environments (as well as non-clustered environments), since the database is now really only used for “failover” and “session cache full” scenarios.
Given these circumstances, it is now possible to gain potential performance improvements by reducing the frequency of database writes.
With this option, WebSphere Application Server can significantly reduce the I/O to the session database caused by the last access time updates. The last access time attribute of the HTTP session is updated every time the servlet or JSP accesses the session. The servlet or JSP does not have to update the session, just access it. When persistent session management is enabled, the changed last access time will be written to the database. If write at End of servlet service mode is enabled, then WebSphere Application Server could be writing to the session database every time it process an HTTP request. This can be a significant overhead. By using the time based mode, these updates to the database would be deferred, and done in a single transaction. Only the latest change to the last access time of the session will be written.
� Write contents:
These options control what is written to the session database.
– Only updated attributes:
It writes only the HttpSession properties that have been updated via setAttribute() and removeAttribute().
– All session attributes:
It writes all the HttpSession properties to the database.
When a new session is initially created (with either of the above two options), the entire session is written to the database including any Java objects bound to the session. The behavior for subsequent servlet or JSP requests for this session, varies depending on whether the single-row or multi-row database mode is in use. See , “Session Manager Service — Database” on page 193 for details on using single and multi-row sessions.
Note: Time based writes requires session affinity for session data integrity.
188 DB2 UDB/WebSphere Application Tuning Guide

– In single-row mode:
• Only updated attributes:
If any session attribute has been updated (via setAttribute() or removeAttribute()), then all of the objects bound to the session will be written to the database.
• All session attributes:
All bound session attributes will be written to the database.
– In multi-row mode:
• Only updated attributes:
Only the session attributes that were specified via setAttribute() or removeAttribute() will be written to the database.
• All session attributes:
All of the session attributes that reside in the cache will be written to the database. If the session has never left the cache, then this should contain all of the session attributes.
By using the All session attributes mode, the servlet and JSP can change Java objects that are attributes of the HttpSession without having to call setAttribute() on the HttpSession for that Java object in order for the changes to be reflected in the database.
Adding the All session attributes mode provides some flexibility to the application programmer, and protects against possible side effects of moving from local sessions to persistent sessions.
However, using All session attributes mode can potentially increase database activity and be a performance drain. Individual customers will have to evaluate the pros and cons for their installation. It should be noted that the combination of All session attributes mode with Time based write could greatly reduce the performance penalty, and essentially give you the best of both worlds.
Table 4-1 summarizes the action of the HttpSession setAttribute() and removeAttribute() methods for various combinations of the row type, Write contents, and Write frequency session persistence options.
Chapter 4. WebSphere Application Server and DB2 UDB performance 189

Table 4-1 Write contents vs. write frequency
Row type Write contents
Write frequency
Action for setAttribute
Action for remove- Attribute
Single-row Only updated attributes
End of servlet service / sync() call with Manual update
If any of the session data has changed then write all of this session's data from cache1
If any of the session data has changed then write all of this session's data from cache1
Single-row Only updated attributes
Time based If any of the session data has changed then write all of this session's data from cache1
If any of the session data has changed then write all of this session's data from cache1
Single-row All session attributes
End of servlet service / sync() call with Manual update
Always write all of this session's data from cache2
Always write all of this session's data from cache2
Single-row All session attributes
Time based Always write all of this session's data from cache
Always write all of this session's data from cache
Multi-row Only updated attributes
End of servlet service / sync() call with Manual update
Write only thread specific data that has changed
Delete only thread specific data that has been removed
Multi-row Only updated attributes
Time based Write thread specific data that has changed for all threads using this session
Delete thread specific data that has been removed for all threads using this session
190 DB2 UDB/WebSphere Application Tuning Guide

� Specify session database cleanup schedule for invalidated sessions:
The administrator can choose to defer the clearing of invalidated sessions (sessions that are no longer in use and timed out) from the database to offpeak hours. This can be done either once or twice a day as follows:
– First time of day (0-23):
The first hour during which the invalidated persistent sessions will be cleared from the database. This value must be a positive integer between 0 and 23.
Multi-row All session attributes
End of servlet service / sync() call with Manual update
Write all session data from cache
Delete thread specific data that has been removed for all threads using this session
Multi-row All session attributes
Time based Write all session data from cache
Delete thread specific data that has been removed for all threads using this session
Notes:
1. When a session is written to the database while using single-row mode, all of the session data is written. Therefore, no database deletes are necessary for properties that were removed via removeAttribute(), since the write of the entire session will not include removed properties.
2. Multi-row mode has the notion of thread-specific data. Thread-specific data is defined as session data that was added or removed while executing under this thread. If End of servlet service or Manual update modes are used and Only updated attributes is enabled, then only the thread-specific data is written to the database.
Row type Write contents
Write frequency
Action for setAttribute
Action for remove- Attribute
Chapter 4. WebSphere Application Server and DB2 UDB performance 191

– Second time of day (0-23):
The second hour during which the invalidated persistent sessions will be cleared from the database. This value must be a positive integer between 0 and 23.
The following considerations apply to time based write:
– The expiration of the write interval does not necessitate a write to the database unless the session has been touched (that is, getAttribute/setAttribute/removeAttribute was called) since the last write.
– If a session write interval has expired and the session has only been retrieved (that is, request.getSession() was called since the last write) then the last access time will be written to the database regardless of the Write contents setting.
– If a session write interval has expired and the session properties have been either accessed or modified since the last write then the session properties will be written out in addition to the last access time. Which session properties get written out is dependent on the Write contents settings.
– Time based write allows the servlet or JSP to issue IBMSession.sync() to force the write of session data to the database.
– If the time between session servlet requests (for a particular session) is greater than the write interval then the session effectively gets written out after each service method invocation.
– The session cache should be large enough to hold all of the active sessions. Failure to do this will result in extra database writes since the receipt of a new session request may result in writing out the oldest cached session to the database. Or to put it another way, if the session manager has to remove the least recently used HttpSession from the cache during a “full cache” scenario, the session manager will write out that HttpSession (per the Write contents settings) upon removal from the cache.
– The session invalidation time must be at least twice the write interval to ensure that a session does not inadvertently get invalidated prior to getting written to the database.
– A newly created session will always get written to the database at the end of the service method.
Also consider using schedule invalidation for intranet style applications that have a somewhat fixed number of users wanting the same HTTP session for the whole business day.
192 DB2 UDB/WebSphere Application Tuning Guide

Session Manager Service — DatabaseSelecting the Database tab in the Session Manager Service window takes you to the session database properties window shown in Figure 4-13.
Figure 4-13 Session manager service — database properties
The datasource for the session database must be a non-JTA enabled datasource. The user name and password should be set if required.
A brief discussion of the DB2 row size, and the Use multi-row sessions settings is provided in the following sections.
Chapter 4. WebSphere Application Server and DB2 UDB performance 193

DB2 row sizeThe session database includes a SESSIONS table that has three columns defined as follows:
� Small: Defined as VARCHAR with a length based on the DB2 row size� Medium: Defined as LONG VARCHAR� Large: Defined as a BLOB of size 2 megabytes
Session data is stored in one of these columns depending upon its size, and is moved between these columns, as the session grows or contracts in size.
Storing of session data in the “small” column tends to deliver greater DB2 buffer pool efficiencies than if it is stored in the “medium” or “large” columns. Therefore, a proper choice of DB2 row size based on an understanding of session data sizes can deliver improved performance.
Changing the DB2 row size is not a complex task, and involves the following steps:
1. If the SESSIONS table already exists, drop it from the DB2 database:
DB2 connect to sessionDB2 drop table sessions
2. Create a new DB2 buffer pool and tablespace, specifying the same page size (8 KB, 16 KB or 32 KB) for both, and assign the new buffer pool to this tablespace. Following are simple steps for creating an 8 KB page:
DB2 connect to sessionDB2 CREATE BUFFERPOOL sessionBP SIZE 1000 PAGESIZE 8KDB2 connect resetDB2 connect to sessionDB2 CREATE TABLESPACE sessionTS PAGESIZE 8K MANAGED BY SYSTEM USING ('D:\DB2\NODE0000\SQL00005\sessionTS.0') BUFFERPOOL sessionBPDB2 connect reset
Refer to DB2 product documentation for details.
3. Configure the correct tablespace name and page size in the Session Manager Service window, Database tab. As seen in Figure 4-13 on page 193, page size is referred to as “DB2 row size” in the session manager database properties.
4. Restart WebSphere. On startup, the session manager creates a new SESSIONS table based on the page size and table space name specified.
194 DB2 UDB/WebSphere Application Tuning Guide

Use multi-row sessionsWebSphere Application Server’s default configuration for persistent session management is the use of a single-row schema, in which each user session maps to a single database row. With this setup, there are hard limits to the amount of user-defined, application-specific data that WebSphere Application Server can access.
With a multi-row schema, each user session maps to multiple database rows. In a multi-row schema, each session attribute maps to a database row.
In addition to allowing larger session records, using a multi-row schema can yield performance benefits as discussed earlier.
To switch from single-row to multi-row schema for sessions, perform the following steps:
1. Modify the session manager properties to switch from single to multi-row schema.
2. Manually drop the SESSIONS table or delete all the rows in the it. To drop this table:
a. Determine which data source the session manager is using.b. In the data source properties, look up the database name.c. Use the database facilities to connect to the database.d. Drop the SESSIONS table.
3. Restart the application server or server group.
4.4.2 Best practicesLarge numbers of sessions that are held for extended durations, and contain huge amounts of information can pose several problems for a Web application.
1. If a site uses session caching, large sessions reduce the memory available in the WebSphere Application Server instance for other tasks, such as application execution.
Attention: It should be stressed that switching between multi-row and single-row is not a trivial proposition.
Chapter 4. WebSphere Application Server and DB2 UDB performance 195

For example, assume a given application stores 1 MB of information per user session object. If 100 users arrive over the course of 30 minutes, and assume the session timeout remains at 30 minutes, the application server instance must allocate 100 MB just to accommodate the newly arrived users in the session cache. Note this number does not include previously allocated sessions that have not timed out yet. The actual memory required by the session cache could be considerably higher than 100 MB.
1 MB per user session * 100 users = 100 MB
2. If persistent sessions are used, then frequent I/O to the session database can degrade performance, and will also require tuning the session database for optimal performance.
The following best practices are recommended for improving session management, and are categorized as being application related and system related.
Application related best practicesKey recommendations here are to ensure application code allow persistent sessions to be enabled or disabled by the administrator without impacting application code, reduce the session object size, reduce the session duration by releasing HttpSessions when finished, choose persistence options, and avoid creating HttpSessions in the JSPs by default.
1. Enable session persistence:
In order for the WebSphere session manager to persist a session to the database, all of the Java objects in an HttpSession must be serializable (that is, implement the java.io.Serializable interface). The HttpSession can also contain the J2EE objects which are not serializable:
– javax.ejb.EJBObject– javax.ejb.EJBHome– javax.naming.Context– javax.transaction.UserTransaction
The WebSphere session manager works around the problem of serializing these objects in the following manner:
– EJBObject and EJBHome each have Handle and HomeHandle object attributes that are serializable, and can be used to reconstruct the EJBObject and EJBHome.
– Context is constructed with a hash table based environment, which is serializable. WebSphere Application Server will retrieve the environment, then wrapper it with an internal, serializable object, so that on re-entry it can check the object type and reconstruct the Context.
196 DB2 UDB/WebSphere Application Tuning Guide
– UserTransaction has no serializable attributes. WebSphere provides two options:
• The Web developer can place the object in the HttpSession but WebSphere Application Server will not persist it outside the JVM.
• WebSphere Application Server has a new public wrapper object, com.ibm.websphere.servlet.session.UserTransactionWrapper, which is serializable and requires the InitialContext used to construct the UserTransaction. This will be persisted outside the JVM and be used to reconstruct the UserTransaction.
2. Reduce session object size:
Web developers must carefully consider the information kept by the session object, and apply some or all of the following techniques to reduce session object size:
– Remove from the session object information easily obtained or easily derived
– Rigorously remove unnecessary, unneeded, or obsolete data from the session
– Consider whether it would be better to keep a certain piece of data in an application database rather than in the HTTP session. This gives the developer full control over when the data is fetched or stored, and how it is combined with other application data. Web developers can leverage the power of SQL if the data is in an application database.
Note: As per J2EE, a Web component may only start a transaction in a service method. A transaction that is started by a servlet or JSP must be completed before the service method returns. That is, transactions may not span Web requests from a client. If there is an active transaction after returning from the service method, WebSphere Application Server will detect it and will abort the transaction.
Tip: In general, Web developers should consider making all other Java objects held by HttpSession serializable, even if immediate plans do not call for the use of persistent session management. If the Web site grows, and persistent session management becomes necessary, the transition between local and persistent management occurs transparently to the application if the sessions hold only serializable objects. If not, a switch to persistent session management requires coding changes to make the session contents serializable.
Chapter 4. WebSphere Application Server and DB2 UDB performance 197

This becomes particularly important when persistent sessions are used. There is a significant performance overhead when WebSphere Application Server has to serialize a large amount of data and write it to the database. Even if the Write contents option is enabled, if the session object contains large Java objects or collections of objects that are updated regularly, there is a significant performance penalty in persisting these objects. This penalty can be reduced by using Time based writes as described – on page 187.
For suggestions related to JSPs and servlets, please also refer to item 4., “Reduce persistent sessions database I/O” on page 203.
3. Release HttpSessions when finished:
HttpSession objects live inside the WebSphere servlet engine until:
– The application explicitly and programmatically releases it using the API javax.servlet.http.HttpSession.invalidate(). Quite often, programmatic invalidation is part of an application logout function.
– WebSphere Application Server destroys the allocated HttpSession when it expires (by default, after 1800 seconds or 30 minutes). WebSphere Application Server can only maintain a certain number of HttpSessions in memory. When this limit is reached, WebSphere Application Server:
• Removes the least recently used session in the case of persistent sessions.
• Denies session creation or moves it into the overflow table if the overflow flag is set in the case of in-memory sessions.
In a high volume system, it is desirable to avoid consuming memory for abandoned HttpSessions.
Notes: In general, best performance will be realized with session objects that are less than 2 KB in size. Once the session object starts to exceed 4-5 KB in size, a significant decrease in performance can be expected.
Even if session persistence is not an issue, minimizing the session object size will help to protect your Web application from scale-up disasters as user numbers increase. Large session objects will require more and more JVM memory, leaving no room to run servlets.
198 DB2 UDB/WebSphere Application Tuning Guide

Figure 4-14 Use of invalidate()
4. Choose persistence options:
Figure 4-11 on page 185 and Figure 4-12 on page 186 show the various options that can be configured with the persistence enablement. Four default options, or one custom option, are available to the application designer. Table 4-2 describes the pros and cons of the various options.
Table 4-2 Choosing persistence options
Persistence option Application scenario
Reasons to use Very High persistence option
� For very active, session intensive Web applications
� Maximizes the use of the in-memory cache, and tries to minimize database access
� Optimized for high performance applications
Reasons not to use Very High persistence option
� Since it uses in-memory caches extensively, and only persists data every 5 minutes, if the JVM crashes before persisting, then all session data that was changed since the last 5 minute interval cycle would be lost.
� If a lot of new sessions are created throughout the day, the SESSIONS table may become quite large since it is cleaned up only once a day at midnight. This can result in slower response times for sessions that need to be retrieved from the SESSIONS table.
Reasons to use the High persistence option
� The problem of very large SESSIONS table is resolved with this option, since it is cleaned up at intervals based on the Invalidation Timeout setting.
Chapter 4. WebSphere Application Server and DB2 UDB performance 199

Reasons not to use the High persistence option
� Since this setting uses the in-memory cache extensively, and only persists data every 5 minutes, if the JVM crashes before persisting, then all session data that was changed since the last 5 minute interval cycle would be lost.
� If the application has large objects that do not change very often, then the Write Contents setting of this option may cause unneeded object persistence by writing back all session objects each time a session is persisted.
Reasons to use the Medium (default) persistence option
� This option is appropriate when failover is more important than performance. This is because objects in the session that have changed are persisted after each servlet request.
� If a failure occurs, only the session data that was changed during the service method execution is lost.
Reasons not to use the Medium (default) persistence option
� Not appropriate if performance is more important than failover.
� If a lot of attributes are updated often, this option may add significant overhead when multi-row sessions is enabled.
Reasons to use the Low persistence option
� When failover is the top priority, this option is appropriate since all attributes are written out at the end of the service method regardless of whether that have changed or not.
Reasons not to use the Low persistence option
� When performance is more important than failover.
Manual Update option is entirely dependent upon the application developer since they have to use the com.ibm.websphere.servlet.session.IBMSession object instead of the HttpSession object. The sync() method can then be used to persist the session data to the SESSIONS table.
Reasons to use the Manual Update option
� Application servlets typically reads session data, but does not write it back often.
� Developer wants direct control over when the session information must be persisted.
Persistence option Application scenario
200 DB2 UDB/WebSphere Application Tuning Guide

5. Avoid creating HttpSessions in the JSP by default:
JSPs create HttpSessions by default per J2EE, to facilitate the use of JSP implicit objects, which can be referenced in JSP source and tags without explicit declaration. HttpSession is one of those objects.
If you do not use HttpSession in your JSPs, then performance can be enhanced by avoiding this default HttpSession creation by involving the following JSP page directive:
<%@ page session=“false”%>
System related best practicesKey recommendations here are to tune the session cache size, add additional WebSphere Application Server instances, increase available memory, reduce persistent sessions database I/O, tune multi-row persistent session management, tune the session timeout interval, tune the session database connection pool, and tune the session database.
1. Tune session cache size
The default session cache holds 1000 session objects. By lowering the number of session objects in the cache, the administrator can reduce the memory required by the cache.
However, if the user’s session is not in the cache, WebSphere Application Server must retrieve it from either the overflow cache (for local caching) or the session database (for persistent sessions). If the session manager must retrieve persistent sessions frequently, the retrievals may impact overall application performance.
Reasons not to use the Manual Update option
� Developer does not want explicit control over persistence to the session database.
� Application servlets update session information frequently.
� Developer needs to be completely compliant with the Servlet 2.2 specifications. Using the sync() method of the IBMSession object results in the servlet not being portable to other systems, since session persistence is not part of the Servlet 2.2 specification, but an IBM extension to it.
Persistence option Application scenario
Chapter 4. WebSphere Application Server and DB2 UDB performance 201

WebSphere Application Server maintains overflowed local sessions in memory as well. Local session management with cache overflow enabled allows an “unlimited” number of sessions in memory. As discussed earlier, the session manager builds the first cache for optimized retrieval, while a regular un-optimized hash table contains the overflow cache.
In order to limit the cache footprint to the number of entries specified in session manager, the administrator should use persistent session management, or disable overflow.
2. Add additional application server clones
WebSphere Application Server gives the administrator the option of creating additional application server instances, or clones. Creating additional clones spreads the demand for memory across more JVMs, thus reducing the memory burden on any particular instance. Depending on the memory and CPU capacity of the machines involved, the administrator may add additional instances within the same machine. Alternatively, the administrator may add additional machines to form a hardware cluster, and spread the instances across this cluster.
3. Increase available memory
WebSphere Application Server allows the administrator to increase an application server’s heap size. Increasing this value allows the instance to obtain more memory from the system, and thus hold a larger session cache.
A practical limit exists, however, for an instance’s heap size. The machine memory containing the instance needs to support the heap size requested. Also, if the heap size grows too large, the length of the garbage collection cycle with the JVM may impact overall application performance. This impact has been reduced with the introduction of multi-threaded garbage collection.
Tip: For best performance, define a primary cache of sufficient size to hold the normal working set of sessions for a given WebSphere Application Server.
Note: When using local session management without specifying the Allow overflow property, a full cache will result in the loss of user session objects.
Note: When configuring a session cluster, session affinity routing provides the most efficient strategy for user distribution within the cluster, even with session persistence enabled. With clones, the WebSphere HTTP plug-in provides affinity routing among clone instances.
202 DB2 UDB/WebSphere Application Tuning Guide

4. Reduce persistent sessions database I/O
Every time that a servlet or JSP accesses an HTTP session, the last access time is updated on the session object. This is done to make sure that the session does not time out. The last access time is updated even if the servlet does not call getAttribute() or setAttribute(). It only has to call getSession().
When persistent session management is enabled, the change to the last access time is written to the database. The Write contents option specifies what data is written to the database. When the End of servlet service Write frequency mode is enabled, the session is written at the end of the call to the service() method for the servlet or JSP. This can easily lead to a situation where WebSphere Application Server is writing the session to the database every time an HTTP request is processed. This is true even if the servlet or JSP only reads from the session.
For JSPs this is a particular concern. In compliance with the J2EE specification, by default, JSPs access the session object each time they are executed. This means that the last access time is changed and written to the database each time WebSphere Application Server executes the JSP.
From a performance point of view, the Web developer should consider the following:
– Optimize the use of the HttpSession within a servlet. Only store the minimum amount of data required in HttpSession. Data that does not have to be recovered after a clone fails, or is shut down may be best kept elsewhere, such as in a hash table. Recall that HTTP session is intended to be used as a temporary store for state information between browser invocations.
– JSPs that do not need to access the session object should use the JSP directive in Example 4-3. This tells the JSP container that you will not be accessing the session. This stops the last accessed time being updated during JSP execution.
Example 4-3 Directive to stop a JSP updating the session last accessed time
<%@ page session=“false”%>
– Use “Time based” Write frequency mode. This greatly reduces the amount of I/O, as the database updates are deferred up to a configurable number of seconds. Using this mode, all of the outstanding updates for a Web application are written out periodically based on configured write interval.
Note: By default this directive is set to true. This causes the last access time to be updated and written to the database every time WebSphere executes the JSP.
Chapter 4. WebSphere Application Server and DB2 UDB performance 203

– Use the Specify session database cleanup schedule for invalidated sessions option. When using the End of servlet service Write frequency mode, WebSphere Application Server does not have to write out the last access time with every HTTP request. This is because WebSphere Application Server does not have to synchronize the invalidator thread's deletion with the HTTP request’s access.
5. Tune multi-row persistent session management
When a session contains multiple objects accessed by different servlets or JSPs in the same Web application, multi-row session support provides a mechanism for improving performance. Multi-row session support stores session data in the persistent session database by Web application and value. Table 4-3 shows a simplified representation of a multi-row database table.
Table 4-3 Simplified multi-row session representation
In this example, if the user visits the ShoeStore application, and the servlet involved needs the user’s first name, the servlet retrieves this information through the session API. The session manager brings into the session cache only the value requested. The ShoeStore.Big.String item remains in the persistent session database until the servlet requests it. This saves time by reducing both the data retrieved and the serialization overhead for data the application does not use.
After the session manager retrieves the items from the persistent session database, these items remain in the in-memory session cache. The cache accumulates the values from the persistent session database over time as the various servlets within the Web application request them. With WebSphere Application Server’s session affinity routing, the user returns to this same cached session instance repeatedly. This reduces the number of reads against the persistent session database, and gives the Web application better performance.
Even with multi-row session support, Web applications perform best if the overall contents of the session objects remain small. Large values in session objects require more time to retrieve from the persistent session database, generate more network traffic in transit, and occupy more space in the session cache after retrieval.
Session ID Web application
Property Small value
Large value
DA32242SSGE2 ShoeStore ShoeStore.First.Name “Alice”
DA32242SSGE2 ShoeStore ShoeStore.Last.Name “Smith”
DA32242SSGE2 ShoeStore ShoeStore.Big.String “A big string....”
204 DB2 UDB/WebSphere Application Tuning Guide

Multi-row session support provides a good compromise for Web applications requiring larger sessions. However, single-row persistent session management remains the best choice for Web applications with small session objects. Single-row persistent session management requires less storage in the database, and requires fewer database interactions to retrieve a session’s contents (all of the values in the session are written or read in one operation). This keeps the session object’s memory footprint small, as well as reducing the network traffic between WebSphere and the persistent session database. Table 4-4 describes the pros and cons of single versus multi-row schemas.
Table 4-4 Single versus multi-row schemas
Consider configuring direct single-row usage to one database, and multi-row usage to another database while you verify which option suits your application's specific needs. You can do this by switching the data source used, then monitoring performance.
Programming issue Application scenario
Reasons to use single-row � You can read/write all values with just one record read/write.
� This takes up less space in a database, because you are guaranteed that each session is only one record long.
Reasons not to use single-row 2 MB limit of stored data per session. That is, the sum of sizes of all session attributes is limited to 2 MB.
Reasons to use multi-row � The application can store an unlimited amount of data; that is, you are limited only by the size of the database and a 2 MB-per-record limit (so the size of each session attribute can be 2 MB).
� The application can read individual fields instead of the whole record. When large amounts of data are stored in the session but only small amounts are specifically accessed during a given servlet's processing of an HTTP request, multi-row sessions can improve performance by avoiding unneeded Java object serialization.
Reasons not to use multi-row If data is small in size, you probably do not want the extra overhead of multiple row reads when everything could be stored in one row.
Chapter 4. WebSphere Application Server and DB2 UDB performance 205

In the case of multi-row usage, design your application’s data objects so that they do not to have references to each other. This is to prevent circular references. For example, suppose you are storing two objects A and B in the session using HttpSession.put(..), and A contains a reference to B. In the multi-row case, because objects are stored in different rows of the database, when objects A and B are retrieved later, the object graph between A and B is different from what was stored. A and B behave as independent objects.
6. Tune the session timeout interval:
By default, each user receives a 30-minute interval between requests before the session manager invalidates the user’s session. Not every site requires a session timeout interval this generous. By reducing this interval to match the requirements of the average site user, the session manager purges the session from the cache (and the persistent store, if enabled) more quickly.
Avoid setting this parameter too low and frustrating users. The administrator must take into account a reasonable time for an average user to interact with the site (read returned data, fill out forms, and so on) when setting the interval. Also, the interval must represent any increased response time during peak times on the site (such as heavy trading days on a brokerage site, for example).
Finally, in some cases where the persistent session database table contains a large number of entries, frequent execution of the invalidation timeout scanner reduces overall performance. In cases where the database contains many session entries, avoid setting the session timeout so low it triggers frequent, expensive scans of the persistent session database for timed-out sessions.
Restriction: Avoid circular references within sessions if using multi-row session support. The multi-row session support does not preserve circular references in retrieved sessions.
Note: The Invalidation timeout scanner interval is a function of the Invalidation timeout value.
As indicated earlier, in WebSphere Application Server 4.03, a new system property SessionReaperInterval has been defined to allow the sleep interval to be set for the invalidation thread. The system property should be specified as -DSessionReaperInterval=interval(in seconds). Refer to the WebSphere Application Server Version 4.0.3 Release Notes at the following URL for further details. http://www-3.ibm.com/software/webservers/appserv/doc/v40/ae/infocenter/was/403RN.html
206 DB2 UDB/WebSphere Application Tuning Guide
Alternatively, the administrator should consider Time based invalidation, where scans for invalid object can be deferred to a time that normally has low demand.
7. Tune the session database connection pool:
When using persistent session management, the session manager interacts with the defined database through a WebSphere Application Server data source. Each data source controls a set of database connections known as a connection pool. By default, the data source opens a pool of no more than 10 connections. The maximum pool size represents the number of simultaneous accesses to the persistent session database available to the session manager.
For high-volume Web sites, the default settings for the persistent session data source may not be sufficient. If the number of concurrent session database accesses exceeds the connection pool size, the data source queues the excess requests until a connection becomes available. Data source queueing can impact the overall performance of the Web application (sometimes dramatically).
The same tuning considerations as described in 4.2, “Connection pool” on page 148, and 4.3, “Prepared statement cache” on page 169 apply to session database connection pool, and prepared statement cache respectively.
As discussed earlier, session affinity routing combined with session caching reduces database read activity for session persistence. Likewise, Manual update Write frequency, Time based Write frequency, and multi-row persistent session management reduce unnecessary writes to the persistent database. Incorporating these techniques may also reduce the size of the connection pool required to support session persistence for a given Web application.
8. Tune the session database:
While the session manager implementation in WebSphere Application Server provides for a number of parameters that can be tuned to improve performance of applications that utilize HTTP sessions, maximizing performance will require tuning the underlying session persistence table SESSIONS.
We discuss tuning considerations as being either DB2 row size related, or traditional tuning.
Chapter 4. WebSphere Application Server and DB2 UDB performance 207
a. DB2 row size:
“DB2 row size” on page 194 provides an overview of this issue. In order to determine what the DB2 row size ought to be, one needs to determine the average (or median) session object size being created by the application. This information is not readily available in WebSphere Application Server.
However, if persistent sessions are enabled, one may query the SESSIONS table at frequent intervals to obtain the number and average size of the session object stored in each column of the SESSIONS table, using the SQL statement shown in Example 4-4.
Example 4-4 Number and average size of persistent session objects
SELECT COUNT(*), AVG(LENGTH(small)) FROM sessions WHERE small IS NOT NULLUNIONSELECT COUNT(*), AVG(LENGTH(mediunm)) FROM sessions WHERE medium IS NOT NULLUNIONSELECT COUNT(*), AVG(LENGTH(large)) FROM sessions WHERE large IS NOT NULL
This provides a snapshot at a given point in time, and repeated monitoring should help get a better idea of the number and average size of the session objects.
b. Traditional tuning:
This issue covers ground such as index creation, isolating the database instance, data placement, disk striping, locking, buffer pool sizes, etc. Chapter 3, “Overview of DB2 UDB 8” on page 97 provides an overview of DB2 tuning considerations.
WebSphere Application Server provides a “first step” in this regard by creating an index for the SESSIONS table when creating the table. The index is comprised of the session ID, the property ID (for multi-row sessions) and the Web application name.
Attention: This is not an accurate method of determining session object sizes, since session objects that have been removed due to session invalidations may not have been factored into the results.
Tip: The persistent session database performs best if it is not shared with other databases, such as the WebSphere Application Server administrative database. This eliminates contention for resources, such as connections, which impacts performance. In addition, a separate session database allows greater latitude for tuning via disk striping for the database/tablespace, physical disk to disk controller isolation, etc.
208 DB2 UDB/WebSphere Application Tuning Guide

4.5 Enterprise Java BeansIn this section, we provide a brief overview of EJBs, and then discuss performance considerations as they apply to accessing a DB2 database.
4.5.1 EJB overviewEJB is a specification for a Java server-side services framework from which vendors can create EJB server implementations. The benefit to application developers is that they can focus on writing the business logic necessary to support their application, without having to worry about implementing the surrounding framework.
The specification details certain minimal yet crucial services such as transactions, security and naming. The specification does not state how vendors should go about implementing these services, thus giving them the freedom to provide enhancements without sacrificing portability regarding core services.
EJBs is just one a number of technologies that compose the J2EE platform. Others include:
� Servlets
� JavaServer Pages (JSP) – a template technology for embedding dynamic server-side Java code in HTML or XML pages
� Java Message Service – a standard API for communicating with Message Oriented Middleware systems
� J2EE Connectors a standard API and specification for communicating with Enterprise Information Systems
One of the key organizing principles of J2EE is that it is composed of two fundamental types of objects: containers and components. Figure 4-15 has been adapted from the J2EE specification, and shows the kinds of containers present in a J2EE application environment, and the components that are deployed in those containers.
Chapter 4. WebSphere Application Server and DB2 UDB performance 209

Figure 4-15 J2EE containers and components
The EJB container intercepts a client request, and determines how to handle that request by looking at the runtime characteristics of the EJB specified during deployment. All access to the EJB by the client is strictly through the EJB container. The container resolves object references to actual bean instances.
.jar, .war, and .ear filesIn J2EE, the various components shown in Figure 4-15 are linked together into logical units through a nested set of special .jar files and deployment descriptors. The EJB JAR file contains all the interfaces and deployed code that make up entity, session EJBs, and a deployment descriptor .xml.
Web archive .war files consist of a set of .class files that may be Java servlets or or classes that the servlet needs to carry out its functions, JavaServer Pages (.jsp) files, and other Web resources such as .html and .gif files. Web archive files must also contain an XML deployment descriptor (always named web.xml) that describes these structures.
Application client .jar files consist of a set of .class files that make up a Java application, including one class whose main method starts the application and any resources files (e.g property files) it needs. An application client .jar file will also contain an XML deployment descriptor that describes the application.
210 DB2 UDB/WebSphere Application Tuning Guide

EJB .jar files, Web archive .war files, and application client .jar files can be combined to form a final top level of application structure called an enterprise archive .ear file. An .ear file consists of any combination of any number of files of the above three .jar types, plus an additional deployment for the combination.
EJB typesThe different types of EJBs are shown in Figure 4-16.
Figure 4-16 Types of EJBs
There are two basic types of EJBs — session EJBs and entity EJBs
1. Session EJBs:
Session EJBs are function-oriented components. They represent a set of behaviors that reside on a server that can be invoked by clients.
There are two sub-types of session EJBs — stateless session EJBs, and stateful session EJBs as follows:
– Stateless session EJB:
These represent a set of related behaviors (methods) that do not retain client-specific states between invocations. Contrary to popular belief, stateless session beans can in fact, possess instance variables, but those variables must be shared among multiple potential clients (e.g., they should be read-only). This often overlooked fact can be key to understanding some potential uses of stateless session EJBs.
Chapter 4. WebSphere Application Server and DB2 UDB performance 211
For readers familiar with traditional transaction-processing systems like CICS or Encina, you can think of each method call to a stateless session EJB as an individual non-conversational transaction.
– Stateful Session EJB:
Each stateful session EJB is “owned” by a single client, and is uniquely connected to that client. As a result of this, stateful session EJBs may retain client state across method invocations. That is to say, a client may call a method that sets a variable value in one method, and then be assured that another, later, method invocation to retrieve that value will retrieve the same value.
2. Entity EJBs:
Entity EJBs model data entities, and provide shared distributed transactional access to persistent data. As such, entity EJBs provide concurrent shared access to multiple users. An individual entity EJB represents a single persistent entity, for instance a row in a relational database. In contrast, session EJBs model businesses processes, and provide exclusive access to a single client either for a length of a method (in the stateless case), or for the life of the bean (in the stateful case).
There are two basic subtypes of Entity EJBs — container managed persistence (CMP) entity EJBs, and bean managed persistence (BMP) entity EJBs.
– CMP:
CMP means that the EJB container handles all database access required by the entity bean. The bean's code contains no database access (SQL) calls. As a result, the bean's code is not tied to a specific persistent storage mechanism (database). This provides independence from the underlying database implementations, and the same entity EJB can be deployed on different J2EE servers that use different databases, without modifying or recompiling the entity EJB code. In other words, entity EJBs your entity beans are more portable.
– BMP:
BMP EJBs leave the management of such details as what SQL is executed to the developer of the EJB. Each BMP EJB is responsible for storing and retrieving its own state from a persistent store, in response to specific “hook” messages like ejbLoad() and ejbStore(), that are sent to it at appropriate times during its lifecycle.
212 DB2 UDB/WebSphere Application Tuning Guide
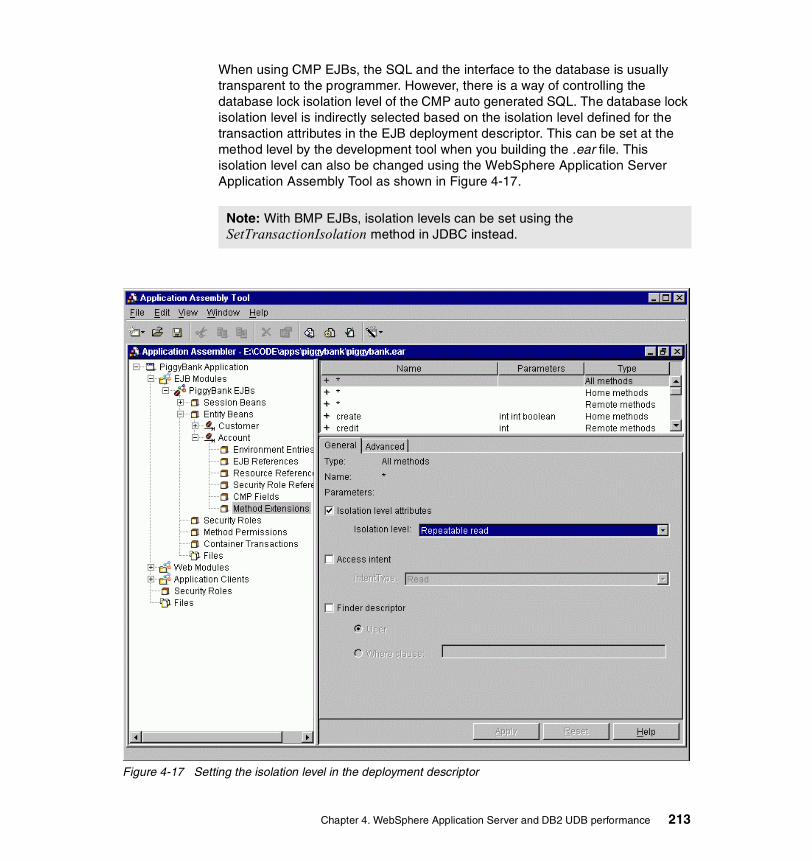
When using CMP EJBs, the SQL and the interface to the database is usually transparent to the programmer. However, there is a way of controlling the database lock isolation level of the CMP auto generated SQL. The database lock isolation level is indirectly selected based on the isolation level defined for the transaction attributes in the EJB deployment descriptor. This can be set at the method level by the development tool when you building the .ear file. This isolation level can also be changed using the WebSphere Application Server Application Assembly Tool as shown in Figure 4-17.
Figure 4-17 Setting the isolation level in the deployment descriptor
Note: With BMP EJBs, isolation levels can be set using the SetTransactionIsolation method in JDBC instead.
Chapter 4. WebSphere Application Server and DB2 UDB performance 213

Isolation levels are used to specify the degree to which an EJB transaction accessing a resource may be affected by other concurrent transactions accessing the same resource. For entity EJBs mapped to a relational database, the isolation level determines the locking policy used when accessing a database. Isolation levels are discussed in detail in the WebSphere Application Server InfoCenter documentation.
The most restrictive isolation level is Serializable. An EJB that specifies this isolation is guaranteed to get consistent results from the database for the duration of the transaction. To achieve this behavior, every row that is touched by an SQL SELECT issued by the EJB, or the underlying persistence layer is locked for the duration of the transaction. This locking scheme can cause significant bottlenecks with multiple concurrent user access.
The mapping of WebSphere Application Server isolation levels to DB2’s isolation levels in shown in Table 2-1 on page 82. The default EJB Isolation level attributes setting is Repeatable Read, which maps to the DB2 isolation level of Read Stability as shown in Table 2-1 on page 82. The semantics of Read Stability may be unnecessary for many applications, and result in needless locks being taken thus potentially impacting application concurrency. For most applications, the semantics of EJB Read Committed (DB2 isolation of Cursor Stability) is probably adequate. The reader should evaluate the most appropriate semantic requirements of their application before choosing the isolation level. Refer to DB2 product documentation for details about DB2’s isolation levels.
Another setting that has a potential performance impact on database access is the Access Intent setting that can be specified at the individual method level as shown in Figure 4-17. The default value for this setting is Update.
� With this setting at Read, the container accesses the database with a read only intent. This results in an ‘S’ lock on the data, and allows other concurrent read only users to share access to the data. If read only methods are the only methods invoked on an entity EJB instance during the course of a transaction, then WebSphere Application Server optimizes out the ejbStore operation that stores the bean’s persistent fields back to the database. This read only optimization is a WebSphere Application Server extension to the EJB specification.
� With this setting at Update, the container accesses the database with an intent to update (‘U’ lock), and then writes the contents back to the database regardless of whether the retrieved data was changed or not. The ‘U’ lock is incompatible with other concurrent users who have an intent to update, which can lead to poor response times due to potential waits and timeouts. The write back to the database causes an ‘X’ lock to be taken on the data, which is released when the transaction commits.
214 DB2 UDB/WebSphere Application Tuning Guide

Letting the Access Intent to default to Update for EJB methods that are read only can result in unnecessary locking and issuance of an SQL UPDATE statement. This can negatively impact concurrency and throughput of the application.
It is therefore important to let the EJB Server know which EJB methods are read only, and which ones are update.
Figure 4-18 shows the setting of the access intent of an EJB Method in the Application Assembly Tool.
Figure 4-18 Setting access intent of an EJB Method in Application Assembly Tool
Chapter 4. WebSphere Application Server and DB2 UDB performance 215

4.5.2 EJB performance considerationsFrom a database perspective, the following two considerations apply:
� Ensure that the Isolation level attributes setting selection is based on the minimal semantic requirements of the application. In most cases, this corresponds to Read Committed on the Java side, which translates to Cursor Stability on the DB2 side.
� Ensure that the Access Intent is set to Read for all EJB read only methods.
216 DB2 UDB/WebSphere Application Tuning Guide
Chapter 5. Problem determination scenarios
In this chapter, we discuss some commonly encountered problems in a DB2 UDB WebSphere environment, and describe scenarios for identifying and resolving such problems.
The topics covered include:
� Introduction� Exception events scenarios� Routine monitoring scenarios
5
© Copyright IBM Corp. 2003 217
5.1 IntroductionOne of the main objectives of an IT organization is to ensure that its infrastructure delivers the required performance to ensure that business objectives are continuously met in a constantly evolving and changing business environment. This requires the IT professional to adopt a strategy that is both proactive and reactive to conditions and events that would tend to adversely impact IT systems performance, and thereby the business.
The proactive effort involves a number of tasks, including these:
� Capacity planning of IT resources
� Choosing the most effective IT architecture for the current and anticipated workload
� Adopting best practices in application design, development and deployment
� Performing rigorous regression testing prior to deployment in a production environment
� Performing routine monitoring of key performance indicators to forestall potential performance problems, as well as gather information for capacity planning
The reactive effort involves having a well-defined methodology for identifying the root cause of a problem, and resolving the problem by applying best practices.
In the following sections, we describe commonly encountered problems that have been identified through routine monitoring, as well as from exception events such as user complaints about poor response times or aborted transactions.
We have determined that the commonly encountered problems in a DB2 UDB WebSphere environment have to do with:
� Connection pool size
� Concurrency issues with EJB isolation mismatches and EJB access intent specifications
� Session database tuning when large session objects are involved
Attention: In this book, we focus on problem determination and best practices relating to the DB2 UDB WebSphere software environment, and assume that there are no bottlenecks involving hardware, operating system and network resources. In the real world however, potential shortfalls in these resources must be identified and addressed as well.
218 DB2 UDB/WebSphere Application Tuning Guide
� Prepared statement cache size
� DB2 UDB and WebSphere configuration parameter mismatches
� Routine DB2 UDB tuning of the WebSphere administration repository and the session database
In our scenarios, we have not included problems linked with either the prepared statement cache, or the WebSphere Application Server administrative database.
5.2 Exception events scenariosWe focus here on a methodology to respond to exception events such as user complaints about poor performance, and identify the steps that should be followed to identify the root cause of the problem, so that it can be resolved satisfactorily.
Figure 5-1 provides an overview of a typical sequence of steps to be followed when resolving performance problems.
Note: We used the Trade 2 (aka WebSphere eBusiness Benchmark) and PiggyBank applications in our scenarios — these applications are described in detail later.
Important: Users run with routine monitoring levels during normal operations, and only perform exception monitoring involving more detailed traces for short bursts of time to assist with problem diagnosis. This is due to the negative performance impact on applications during detailed tracing.
In our controlled problem determination scenarios, we chose to run with high levels of diagnostic tracing to perform our problem determination. We recognize that this adversely impacts system and application performance, and may color conclusions about relative merits or benefits of the absolute metrics measured, however, our focus was primarily on problem determination and not on performance measurements.
Chapter 5. Problem determination scenarios 219

Figure 5-1 A typical problem determination methodology
The entire sequence of steps is triggered by an exception event such as a user complaining about poor response times, or error messages appearing on their screens.
These symptoms must be evaluated for criticality as shown by the decision box (“Needs immediate attention”) in Figure 5-1.
� Symptoms that are sporadic and non-disruptive need no immediate action, other than to potentially trigger routine monitoring for possible corrective action. Routine monitoring is covered in this book.
Needs Immediate Attention?
yes
no
Formulate one or more hypotheses
May require exception (more detailed) monitoring to obtain the
information necessary to validate or reject a hypothesis
Apply recommended best practices
System Performing
OK?
Identify the root cause of the problem through hypothesis
validation
Verify the validity of each hypothesis in turn by reviewing
key indicators
yes
Document for future reference
Document for future reference
Identify the symptoms
220 DB2 UDB/WebSphere Application Tuning Guide

� Symptoms that recur frequently and disrupt business processes require prompt attention to avoid adverse business impact. We cover some of these scenarios in this book.
� Catastrophic events such as a failure of the system, or the application server or database server also need immediate attention such as an immediate restart. These events are not discussed in this book.
Based on the symptoms and a knowledge base of prior experiences (both external and internal), one should formulate one or more hypotheses as the potential root cause of the problem.
Each hypothesis should then be tested in turn using all available metrics associated with the application under consideration — this includes system resources, network resources, application server resources, and database server resources. Sometimes, the metrics available from routine monitoring and resource manager message events may be inadequate to validate or reject a particular hypothesis. In such cases, one may have to request additional diagnostic information through more detailed monitoring levels either on the production system, or an available comparable regression system. Such monitoring is often referred to as exception monitoring.
Once a hypothesis is validated and the root cause problem has been identified, best practices specific to the root cause problem can be applied to attempt to resolve the problem.
Once the root cause problem has been resolved, the steps executed and the knowledge gained should become part of the knowledge base to assist in resolving future problem situations.
The following subsections cover the following problem determination scenarios:
� Connection pool size � Concurrency issues� Non-serializable objects
Important: Best practices guidelines are based on user experiences for a given workload and environment, and may or may not provide beneficial results in your particular environment. Therefore, a thorough understanding of the fundamentals of the technical architecture and design is required to explore other alternatives, when the documented best practices fail to provide relief. Problem resolution in such cases tends to be an iterative process, where the application of a best practice may result in the manifestation of new symptoms, and a formulation of a fresh set of hypotheses.
Chapter 5. Problem determination scenarios 221

We have organized the description of each scenario as follows:
� Description of the application� Environment configuration� Monitor level settings� Workload used� Triggering event� Hypotheses and their validation� Root cause of the problem� Apply best practices
5.2.1 Connection pool sizeThe primary question is whether the connection pool is too big or too small. Problems with connection pool size generally manifest themselves in resource constrained situations such as during peak periods involving large number of users and/or high volume of transactions.
We cover three problem scenarios associated with connection pools:
� Case 1: Configuration parameter mismatch� Case 2: Small connection pool size� Case 3: Poor coding techniques with connection pooling
Case 1: Configuration parameter mismatchThe root cause problem demonstrated here is one where the connection pool has been defined with a number of permissible connections (Maximum pool size) to a datasource, that exceeds the maximum number of connections supported by DB2 UDB (as specified by the MAXAPPLS parameter in the database config file). Such a mismatch manifests itself with a message that appears to indicate an undersized connection pool.
Description of the applicationThe Trade 2 application was used in this scenario. It models an online brokerage firm providing Web based services such as getting stock quotes, and buying and selling stock. A detailed description of this application is provided in Appendix A, “Sample applications” on page 331.
Environment configurationFigure 5-2 shows the environment used for the Trade application for the configuration parameter mismatch scenario.
Note: Given the online trading nature of the application, we decided to disable session persistence in the WebSphere Application Server Session Manager service.
222 DB2 UDB/WebSphere Application Tuning Guide

Figure 5-2 Configuration parameter mismatch scenario environment
Our WebSphere Application Server and DB2 UDB servers were installed on separate AIX machines persian and mansel respectively. We used the WebSphere Performance Tool (formerly AKTOOLS) to drive the workload.
Monitor level settingsBoth WebSphere Application Server and DB2 UDB were installed using default configurations, and default settings were used. The relevant settings are summarized in Table 5-1.
Table 5-1 Configuration parameter mismatch scenario monitor level settings
Hardware configuration Software configuration
Database Server (mansel) AIX 4.3.3 ML08
RS/6000 44P1 GB Memory32 GB disk
DB2 UDB EE v7.2 FP6Instance name: db2inst1DIAGLEVEL: 4Log name: db2diag.log and jdbcerr.logLog path: /home/db2inst1/sqllib/db2dumpDatabases: WAS40 and TRADEDB
Application Server (persian) AIX 4.3.3 ML08
Application ServerWeb Browsers
persian(Trade App Server)
Database Server
mansel TRADEDB
akstress (50 users)
IExplorer 5.00.3315Netscape Comm 4.72
Mozila 0.9.9Opera 6.0
web client(1 user)
IExplorer 5.00.3315
WAS AE 4.0.2 FP2IHS 1.3.19
DB2 Client 7.2 FP6 DB2 Server 7.2 FP6
WAS40
Windows 2000 RS/6000 44PAIX 4.3.3 ML08
RS/6000 44PAIX 4.3.3 ML08
Chapter 5. Problem determination scenarios 223

Figure 5-3 Changing DB2 DIAGLEVEL parameter
RS/6000 44P1 GB Memory32 GB disk
WAS AE v4.0.2 FP2Log name: tracefile and activity.logLog path: /usr/WebSphere/AppServer/logs
Application name: TradeLog name: Tradestdout.txt and Tradestderr.txtLog path: /tmp
HTTP Server v1.3.19Log name: error.log and access.logLog path: /usr/HTTPServer/logs
DB2 UDB Runtime Client v7.2 FP6
Attention: The diagnostic error capture level parameter DIAGLEVEL default value of 3 is appropriate for routine monitoring.
We chose to change this value to 4 which is the highest level of information in all our problem determination scenarios, using the commands shown in Figure 5-3. This is because the routine monitoring level does not provide us with the information required to perform proper problem diagnosis.
This is equivalent to performing exception monitoring for problem diagnosis.
Hardware configuration Software configuration
224 DB2 UDB/WebSphere Application Tuning Guide

Figure 5-4 Setting performance monitoring level on database connection pools
The connection pool configuration for the TRADEDDB datasource is shown in Figure 5-5. Note the maximum pool size value of 40.
Attention: We also changed the default monitoring levels on the database connection pools for TRADEDB from None to Maximum from the Resource Analyzer menu bar and selected Actions —> Monitoring Settings and set the Maximum monitoring level, as shown in Figure 5-4.
This action corresponds to performing exception monitoring as well.
Chapter 5. Problem determination scenarios 225

Figure 5-5 TRADEDB datasource connection pool configuration
Workload usedThe scenario test consisted of a load recorded in akstress that simulates 50 users that login to the Trade 2 application. The startstress.bat script shown in Example 5-1 was run 12 times to get 48 users, and interactions from 2 browsers to get a total sum of 50 users.
Example 5-1 The startstress.bat script
start akstress -config explorer.acfstart akstress -config netscape.acfstart akstress -config mozilla.acfstart akstress -config opera.acf
226 DB2 UDB/WebSphere Application Tuning Guide

Each user accesses his or her portfolio, buys and sells two stocks, and then logs out. This load is run for about 30 minutes, while a regular Web browser user is performing the same action.
Triggering eventOften the reason to start the analysis of a Web site is a customer complaint about application response time, or an error message returned. Our triggering event in this case was a number of user complaints about random login failures that appeared to occur during periods in the day when the workload was known to be at peak levels. The error users received is shown in Figure 5-6.
Figure 5-6 Error 500 trying to login to the Trade application
Chapter 5. Problem determination scenarios 227

We concluded that the repeated occurrence of this problem had a negative impact on the business, and needed to be resolved promptly. We therefore had to diagnose the problem with minimal exception monitoring, and resolve it quickly.
Hypotheses and their validationWe postulated the following hypotheses as the potential cause of the problem. Given our controlled environment, we ignored real world root cause possibilities such as network bandwidth concerns, Web server problems, system utilization, and process priorities.
� Hypothesis 1: Application is not running
� Hypothesis 2: Communication problem between the WebSphere Application Server and the DB2 server
� Hypothesis 3: Application unable to connect to the database — WebSphere Application Server or DB2 problem
Each of these hypotheses was validated in turn as follows, using information available from the WebSphere Application Server and DB2 logs. The first two hypotheses involve a simple procedure to determine problems with the application or the network. The final hypothesis involved a detailed analysis of the error shown in Figure 5-6.
Hypothesis 1: Application is not runningThere are three ways to check whether the application is still running:
� Verify that the Java process for Trade is running, using the following AIX command
ps -ef | grep | grep Trade
The output of this command is shown in Figure 5-7, with the arrow highlighting the Trade application Java process.
228 DB2 UDB/WebSphere Application Tuning Guide
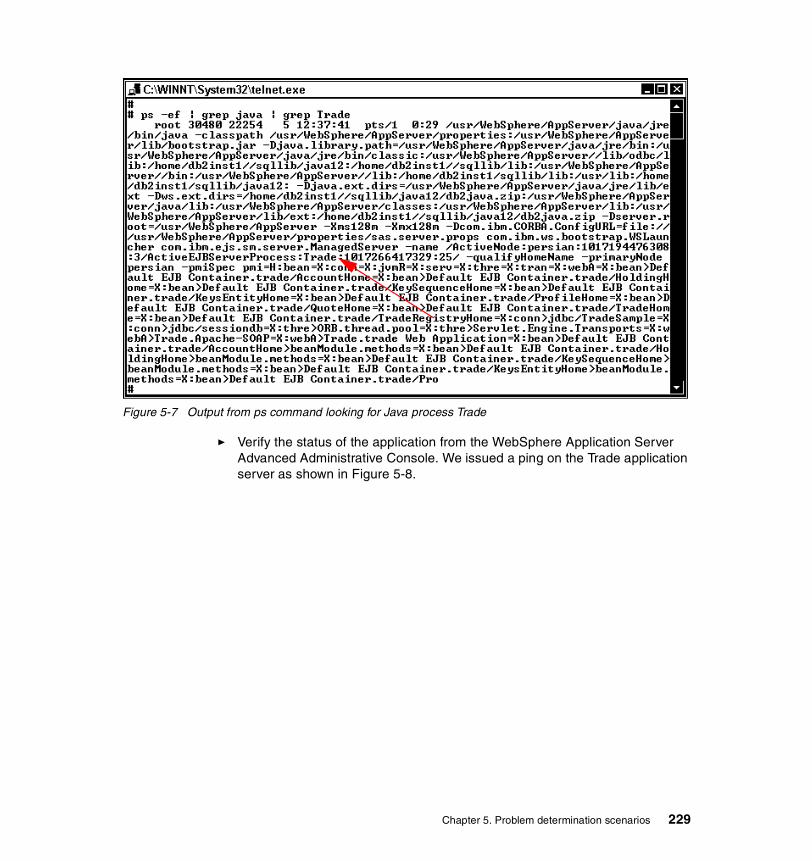
Figure 5-7 Output from ps command looking for Java process Trade
� Verify the status of the application from the WebSphere Application Server Advanced Administrative Console. We issued a ping on the Trade application server as shown in Figure 5-8.
Chapter 5. Problem determination scenarios 229

Figure 5-8 Issuing a ping on application server Trade
The result of this ping confirms that the Trade application was running as shown in Figure 5-9.
Figure 5-9 Ping confirmation that Trade is running
230 DB2 UDB/WebSphere Application Tuning Guide

� Verify the application is running by invoking the welcome.jsp, which presents the login page. The welcome.jsp is invoked as shown in Figure 5-10.
Figure 5-10 Invoking welcome.jsp to confirm Trade is running
Note: We therefore discarded this hypothesis as being the cause of our problem.
Chapter 5. Problem determination scenarios 231

Hypothesis 2: Communication problem between both serversTo verify whether there was a communication problem between the WebSphere Application Server (on persian) and the DB server (on mansel), we issued a ping from persian to mansel, as shown in Figure 5-11.
Figure 5-11 Ping from Application Server (persian) to Database Server (mansel)
Response times were deemed acceptable. We also found no network errors in the WebSphere Application Server error report when requested with the following AIX command
errpt
The result of this command is shown in Figure 5-12.
Figure 5-12 Error report from the Application Server (persian)
Note: We concluded that a communication problem between the WebSphere Application Server and the database server was not the cause of our problem.
232 DB2 UDB/WebSphere Application Tuning Guide

Hypothesis 3: Application unable to connect to the databaseAfter loading welcome.jsp, and a login attempt failed with the error message shown in Figure 5-6 on page 227, we reviewed the application logs.
We looked at the application Tradestdout.txt file where some errors related to the connection pool were reported. A portion of this file is shown in Figure 5-13 with the messages of interest being circled.
Figure 5-13 Errors: Tradestdout.txt file trying to connect to TRADEDB data source
Two error messages caught our attention:
� The following error can be raised for multiple reasons, such as the database not running, or a communication problem with the database server.
2cd39bd5 Connection Poo X CONM6009E: Failed to get connection to the database from data source (jdbc/TradeSample).
This did not appear to be a WebSphere Application Server problem.
� The following error is more specific and describes a problem when the connection pool is trying to expand, that is, when it is trying to get a new connection to the database.
2cd39bd5 Connection Poo W Failed to expand connection pool; waiting for a free connection instead.
This is a warning message and the application will continue to run in such cases.
Chapter 5. Problem determination scenarios 233

Since both messages complained about being unable to get a connection to the database, we routinely checked to ensure that DB2 was up and running, using the command shown in Figure 5-14.
Figure 5-14 List applications currently running on database manager
The result of this command directed us to look elsewhere for the problem. We turned our attention to the db2diag.log where we found a number of messages like the one shown in Figure 5-15.
Note: We therefore concluded that this did not appear at first glance to be a WebSphere Application Server problem, and that we had to look to DB2 as being a potential cause of the problem.
234 DB2 UDB/WebSphere Application Tuning Guide
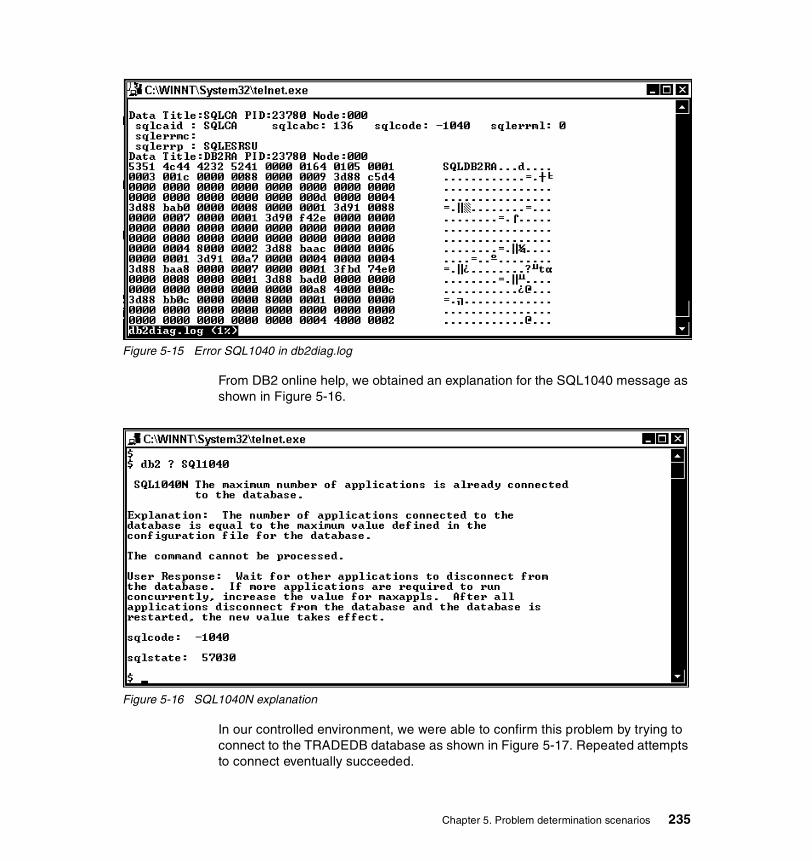
Figure 5-15 Error SQL1040 in db2diag.log
From DB2 online help, we obtained an explanation for the SQL1040 message as shown in Figure 5-16.
Figure 5-16 SQL1040N explanation
In our controlled environment, we were able to confirm this problem by trying to connect to the TRADEDB database as shown in Figure 5-17. Repeated attempts to connect eventually succeeded.
Chapter 5. Problem determination scenarios 235

Figure 5-17 Error SQL1040 trying to connect to TRADEDB
From this SQLCODE explanation it was clear that the number of connections (MAXAPPLS) available for TRADEDB database was reached. The command used to review the configuration for MAXAPPLS in TRADEDB database is shown in Figure 5-18.
Figure 5-18 MAXAPPLS value in TRADEDB configuration
The value of MAXAPPLS was set to 30, and this was the limit reached that prevented WebSphere Application Server connection pool from getting a new connection to service application requests.
Root cause of the problemOur connection pool size maximum was defined to be 40 as seen in Figure 5-5. When the number of simultaneous users accessing Trade caused WebSphere Application Server to request more than 30 connections to DB2, the MAXAPPLS threshold of 30 was exceeded and DB2 denied the connection.
Apply best practicesA number of possible actions can be taken to resolve this problem. One or more of the following actions may be taken to address the problem.
� Increase the MAXAPPLS value to at least match the connection pool size maximum if this database is only being accessed from WebSphere Application Server. If other applications are running against the same database, then those applications will have to be accounted for in arriving at a suitable value for MAXAPPLS. Another consideration in choosing this value is determining the number and duration of peak workloads during a day, and choosing an appropriate MAXAPPLS value to handle it.
236 DB2 UDB/WebSphere Application Tuning Guide

� Reduce the duration of how long an application keeps a connection open to the database. Ensure that applications are closing and releasing connections, and handling transaction durations as per best practices described in 4.2.2, “Best practices” on page 161. This scenario is covered later.
� Reduce the connection pool size maximum to below the MAXAPPLS value. This in effect will not solve the problem, but will queue requests inside WebSphere Application Server which is recommended, and will avoid failing requests to be made to DB2. This decision would have to be made based on the frequency of occurrence of these problems, the priority of the application, and the negative business impact of upsetting users.
In our case, we assumed the peak workload of 40 simultaneous connections to DB2 as being the basis for setting the MAXAPPLS value, and set it to 40 as shown in Figure 5-19. We also assumed that there were no resource limitations on the database server that negatively affect performance by the increase in this value.
Figure 5-19 Changing MAXAPPLS value for TRADEDB
We experienced no re-occurrence of our previous problem after a rerun of our test scenario. However, a new error message appeared, as discussed in the following case.
Important: Increasing the MAXAPPLS value can cause a greater load to be placed on DB2 in terms of processor, memory and locking contention. If adequate resources are not available on the database server to handle the increased workload, significant performance bottlenecks may surface elsewhere.
Chapter 5. Problem determination scenarios 237
Case 2: Small connection pool sizeThe root cause problem demonstrated here is one where the connection pool size is undersized for the given workload. This scenario is a follow on of the configuration parameter mismatch described in “Case 1: Configuration parameter mismatch” on page 222. The hardware and software configuration used was identical to the one shown in Table 5-1 on page 223. The workload used was also the same one used in the previous case.
Triggering eventOur triggering event in this case was a large number of user complaints about poor response times, after successful login and some operations.
Hypotheses and their validationWe postulated the following hypotheses as the potential cause of the problem. Here too, given our controlled environment, we ignored real world root cause possibilities such as network bandwidth concerns, Web server problems, system utilization, and process priorities:
� There is a communication problem between the WebSphere Application Server and the DB2 server.
� WebSphere Application Server has a problem.
Hypothesis 1 was eliminated as the possible cause of the problem using the same procedure used in “Case 1: Configuration parameter mismatch” on page 222.
Hypothesis 2: WebSphere Application Server has a problemWe looked at the application Tradestdout.txt file but found no error or warning messages that could be the cause of response time problems.
We then used the Resource Analyzer tool to monitor the behavior of database connections. We noticed that when the maximum of 40 connections was reached, the average wait time started to increase as shown in Figure 5-20.
Note: Network and Web server problems can cause poor response times in a real world environment, however, this did not apply to our controlled environment.
Note: This corresponds to exception monitoring, since a monitoring level of Maximum for database connections is required to obtain this information in the Resource Analyzer tool. The default is none.
238 DB2 UDB/WebSphere Application Tuning Guide

Figure 5-20 Monitoring connections and waiting time on data source TRADEDB
Our connection pool configuration for the TRADEDB datasource is shown in Figure 5-5 on page 226, where a maximum of 40 connections have been defined. Note that the average pool size is 40. This confirmed the warning that reaching and working at the maximum pool size will lead to longer wait times for a connection, thereby resulting in poorer response times for the user.
Root cause of the problemWhen the number of simultaneous users accessing Trade requiring access to the database exceeded 40, WebSphere Application Server had to queue the requests until a connection became available. This led to longer wait times and poorer response times.
Average wait time increasing
Chapter 5. Problem determination scenarios 239

Apply best practicesA number of possible actions can be taken to resolve this problem. Here too, one or more of the following actions may be taken to address the problem.
� Increase the maximum connection pool size after ensuring that the WebSphere Application Server has enough resources to handle the increased workload. MAXAPPLs in the DB2 will also have to be increased correspondingly after taking into account the ramifications of doing so on the database server side.
If there are no resource constraints in the WebSphere Application Server and DB2 server, then the maximum pool size can be increased. Begin with small increases in the pool size, and continue monitoring in order to identify the high watermark beyond which there is no improvement in wait times. Ensure that system behavior is not adversely impacted with these increases.
� Reduce the duration of how long an application keeps a connection open to the database. Ensure that applications are closing and releasing connections, and handling transaction durations as per best practices described in 2.9.13, “Release JDBC resources when done” on page 58. This scenario is covered later.
� Reduce the maximum thread size in the Web Container queue as shown in Figure 2-11 on page 39. This in effect will not solve the problem, but will queue requests inside the Web Server which is recommended, and will avoid waits to occur in WebSphere Application Server. This decision would have to be made based on the frequency of occurrence of these problems, the priority of the application, and the negative business impact of upsetting users.
In our scenario, we concluded that a maximum of 50 concurrent users were expected, and decided to change both the maximum pool size and MAXAPPLS on TRADEDB to 50. We reran our workload for 30 minutes, and found the response times acceptable. No significant average waiting time increases were found for this workload as shown in Figure 5-21. Note the average pool size number of 48 which is below the maximum.
240 DB2 UDB/WebSphere Application Tuning Guide

Figure 5-21 Monitoring connection pool after changing max pool size to 50
Case 3: Poor coding techniques with connection poolingThe root cause problem demonstrated here is one involving poor coding techniques that manifests itself as an undersized connection pool. This results in poorer response times or other errors such as the login error described earlier. Our test servlet did not close connections, which led to perceived problems with connection pool size.
Description of the applicationWe created a simple test servlet that lists accounts from the TRADEDB database of the Trade application. The servlet code is available in Appendix B.1, “Connection close servlet” on page 336.
Environment configurationFor this scenario, we have a 3-tier application running as shown in Figure 5-22.
Chapter 5. Problem determination scenarios 241

Figure 5-22 Poor coding techniques – connection pooling scenario environment
Our WebSphere Application Server and DB2 UDB servers were installed on separate AIX machines persian and mansel respectively. We used the WebSphere Performance Tool (formerly AKTOOLS) to drive the workload.
Monitor level settingsBoth WebSphere Application Server and DB2 UDB were installed using default configurations, and default settings were used. The relevant settings are the same as those summarized in Table 5-1 on page 223.
We also changed the WebSphere Application Server maximum pool size for the TRADEDB datasource to 25, as shown in Figure 5-23.
Attention: We also changed the default monitoring levels on the database connection pools for TRADEDB from None to Maximum from the Resource Analyzer menu bar and selected Actions —> Monitoring Settings and set the Maximum monitoring level, as shown in Figure 5-4.
This action corresponds to performing exception monitoring as well.
Application ServerWeb Browser
persian(Trade App Server)
Database Server
mansel TRADEDB
akstress (10 users)
Netscape Comm 4.72
WAS AE 4.0.2 FP2IHS 1.3.19
DB2 Client 7.2 FP6 DB2 Server 7.2 FP6
WAS40
RS/6000 44PAIX 4.3.3 ML08
RS/6000 44PAIX 4.3.3 ML08
242 DB2 UDB/WebSphere Application Tuning Guide
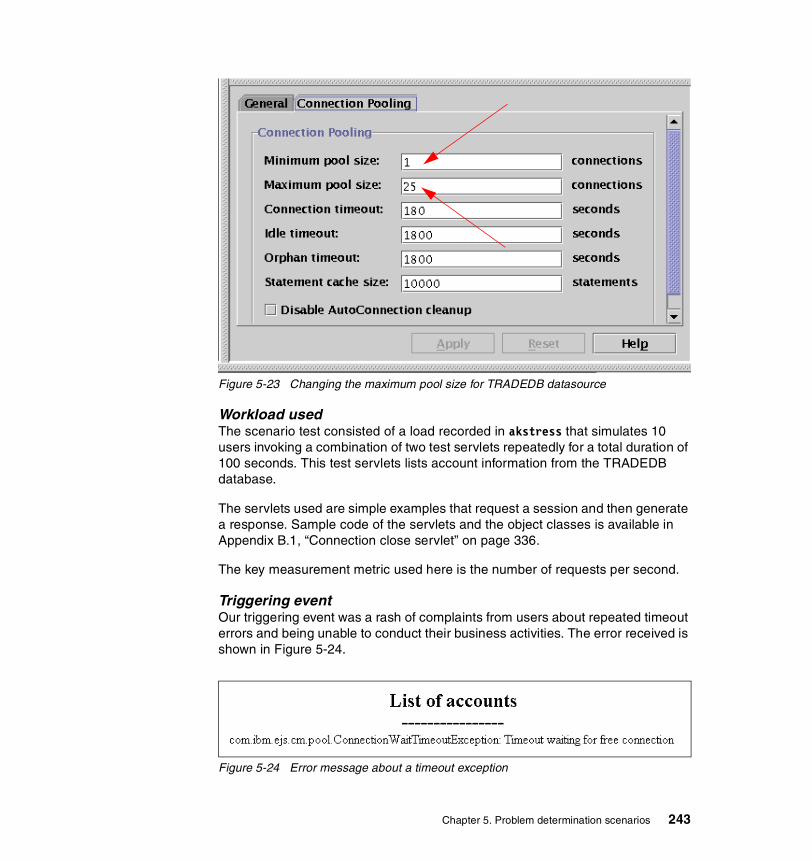
Figure 5-23 Changing the maximum pool size for TRADEDB datasource
Workload usedThe scenario test consisted of a load recorded in akstress that simulates 10 users invoking a combination of two test servlets repeatedly for a total duration of 100 seconds. This test servlets lists account information from the TRADEDB database.
The servlets used are simple examples that request a session and then generate a response. Sample code of the servlets and the object classes is available in Appendix B.1, “Connection close servlet” on page 336.
The key measurement metric used here is the number of requests per second.
Triggering eventOur triggering event was a rash of complaints from users about repeated timeout errors and being unable to conduct their business activities. The error received is shown in Figure 5-24.
Figure 5-24 Error message about a timeout exception
Chapter 5. Problem determination scenarios 243

This is an error message generated by our test servlets complaining about their failure to get a connection within the timeout interval configured in the WebSphere Application Server. Figure 5-23 shows this timeout interval to be 180 seconds.
Hypotheses and their validationWe postulated the following hypotheses as the potential cause of the problem. Given our controlled environment, we ignored real world root cause possibilities such as network bandwidth concerns, Web server problems, system utilization and process priorities.
� Hypothesis 1: Communication problem between WebSphere Application Server and DB2 server
� Hypothesis 2: DB2 problem
� Hypothesis 3: Connection pool is too small
� Hypothesis 4: Application code problems
Hypothesis 1: Communication problem between both serversWe chose to ping the DB2 server (mansel) from WebSphere Application Server (persian) as shown in Figure 5-25, to determine if any communication problems existed that may be the root cause.
Figure 5-25 Pinging mansel from persian
244 DB2 UDB/WebSphere Application Tuning Guide

Hypothesis 2: DB2 problem We considered that the problem may be that DB2 is not up and running, or the limit of MAXAPPLS was reached as was the case in an earlier scenario.
We first verified that DB2 was up and running using the following command in the command window of the DB2 server.
db2 list applications
The results of this command is shown in Figure 5-26 indicating that DB2 is up and running.
Figure 5-26 db2 list applications command
Note: We therefore decided that a communication problem between the WebSphere Application Server and the database server was not the cause of the problem.
Note: We chose to look at DB2 first because we simulated a scenario where the WebSphere Application Server administrator believed that WebSphere Application Server had been over-configured for far more database connections than the anticipated workload coming through the Web container. This over-configuring had been done in the light of anticipated EJB modules that had not yet been installed on WebSphere Application Server.
Chapter 5. Problem determination scenarios 245

The first eight characters of application id is the IP address of the machine which has executed the application. Note that the first eight characters of all 25 applications accessing TRADEDB is the same, that is, 0901273B which is the IP address of the WebSphere Application Server machine persian.
The fact that 25 connections were supported from WebSphere Application Server, which also happens to be the maximum connection pool size, indicates that reaching the limit of MAXAPPLS (our default was 50) is not a problem.
Hypothesis 3: Connection pool is too smallWe had to revisit this possibility, given that the first two hypotheses had to be discarded.
We reviewed the contents of WebSphere Administrative Console for possible event messages. A portion of these events is shown in Figure 5-27.
Figure 5-27 WebSphere Administrative Console Event Messages
Note: We therefore discarded the limit of MAXAPPLS being reached as being the cause of the problem.
246 DB2 UDB/WebSphere Application Tuning Guide

Clicking on the Details button provides a full description of the event, identifying the datasource generating the event as shown in Figure 5-28.
Figure 5-28 WebSphere Administrative Console Event Details
We then invoked the Resource Analyzer tool to review information about the database connection pool as shown in Figure 5-29.
The figure shows the Pool Size to be 25 (which is the maximum), and that the Percent Used and Percent Maxed was 100. This indicates that all the connections were being used, and new requests for connections will timeout after the connection timeout interval (180 seconds) unless an application releases a connection. The Num Returns field shows 100 connections being returned to the pool even though there were 125 allocations in total from the 10 concurrent users. This seemed unusual for the two very simple servlets we wrote.
Chapter 5. Problem determination scenarios 247
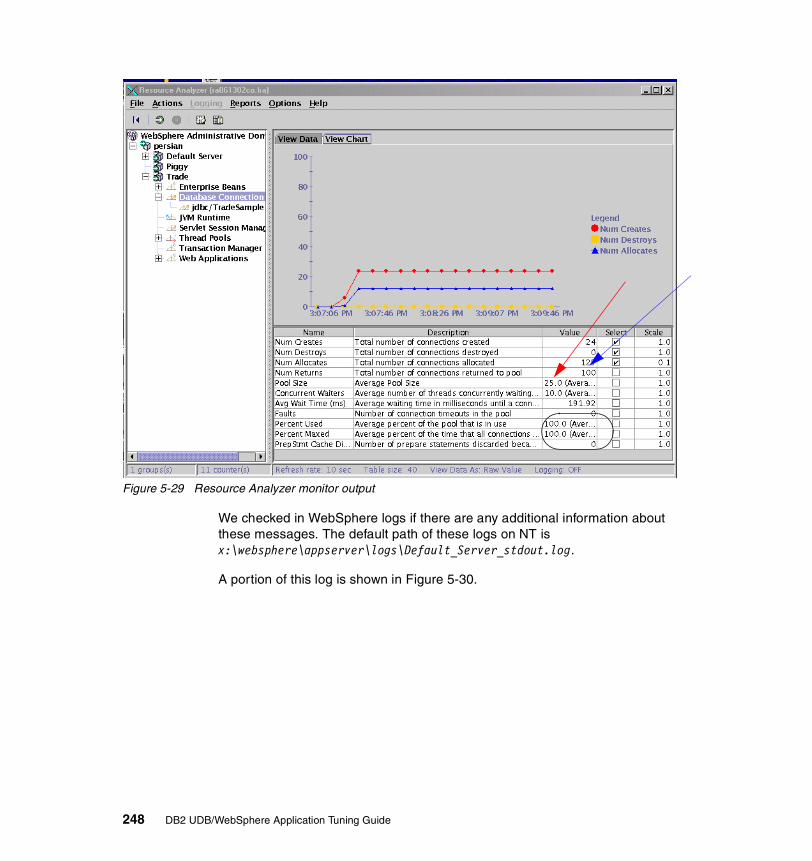
Figure 5-29 Resource Analyzer monitor output
We checked in WebSphere logs if there are any additional information about these messages. The default path of these logs on NT is x:\websphere\appserver\logs\Default_Server_stdout.log.
A portion of this log is shown in Figure 5-30.
248 DB2 UDB/WebSphere Application Tuning Guide

Figure 5-30 WebSphere stdout log
The error messages in the Default_Server_stdout.log shows that the error was from the TestServlet.java file.
We then checked the TestServlet.java program and determined that the connection was not being closed in the application.
Chapter 5. Problem determination scenarios 249
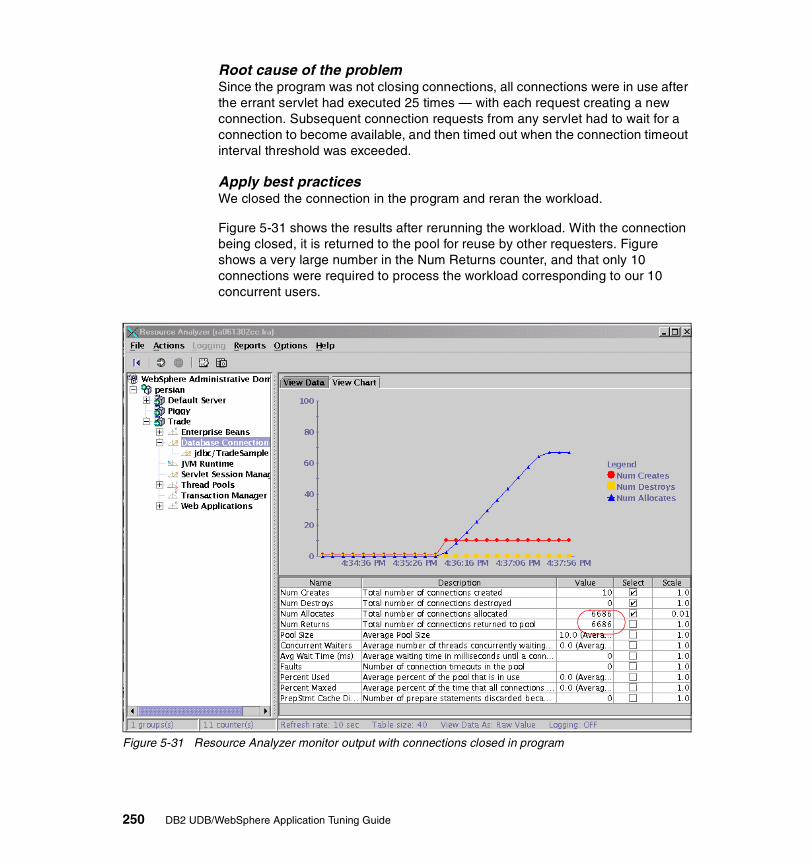
Root cause of the problemSince the program was not closing connections, all connections were in use after the errant servlet had executed 25 times — with each request creating a new connection. Subsequent connection requests from any servlet had to wait for a connection to become available, and then timed out when the connection timeout interval threshold was exceeded.
Apply best practices We closed the connection in the program and reran the workload.
Figure 5-31 shows the results after rerunning the workload. With the connection being closed, it is returned to the pool for reuse by other requesters. Figure shows a very large number in the Num Returns counter, and that only 10 connections were required to process the workload corresponding to our 10 concurrent users.
Figure 5-31 Resource Analyzer monitor output with connections closed in program
250 DB2 UDB/WebSphere Application Tuning Guide

5.2.2 Concurrency issuesWe cover the following two problem scenarios:
� Case 1: EJB isolation mismatch, DB configuration parameters, etc.� Case 2: EJB access intent
Case 1: EJB isolation mismatch, DB config parameters, etc.The root cause problem demonstrated here is one where an unnecessary high level isolation definition at the EJB level causes significant locking contention on the DB2 server, resulting in poor response times and rollbacks. Other concurrency related factors such as undersized database configuration parameters, and sub-optimal access path selection for SQL statements are also covered in this scenario.
Description of the applicationWe used the PiggyBank application that was developed for the WebSphere Version 4 Application Development Handbook, SG24-6134, where it is fully described. It is a very simple banking application based on EJBs, servlets and JSPs. It stores its data in two database tables, CUSTOMER and ACCOUNT.
All of the application business logic is implemented as EJBs, which store persistent application data, such as account and customer information, in the database. Rather than make direct JDBC calls to persist the data to the database, the application uses container-managed persistence (CMP) entity EJBs, which delegates this task to the WebSphere EJB container.
The flow of the application is shown in Figure 5-32 through Figure 5-35.
Chapter 5. Problem determination scenarios 251

Figure 5-32 The user logs in
252 DB2 UDB/WebSphere Application Tuning Guide

Figure 5-33 Main menu with the options
Chapter 5. Problem determination scenarios 253
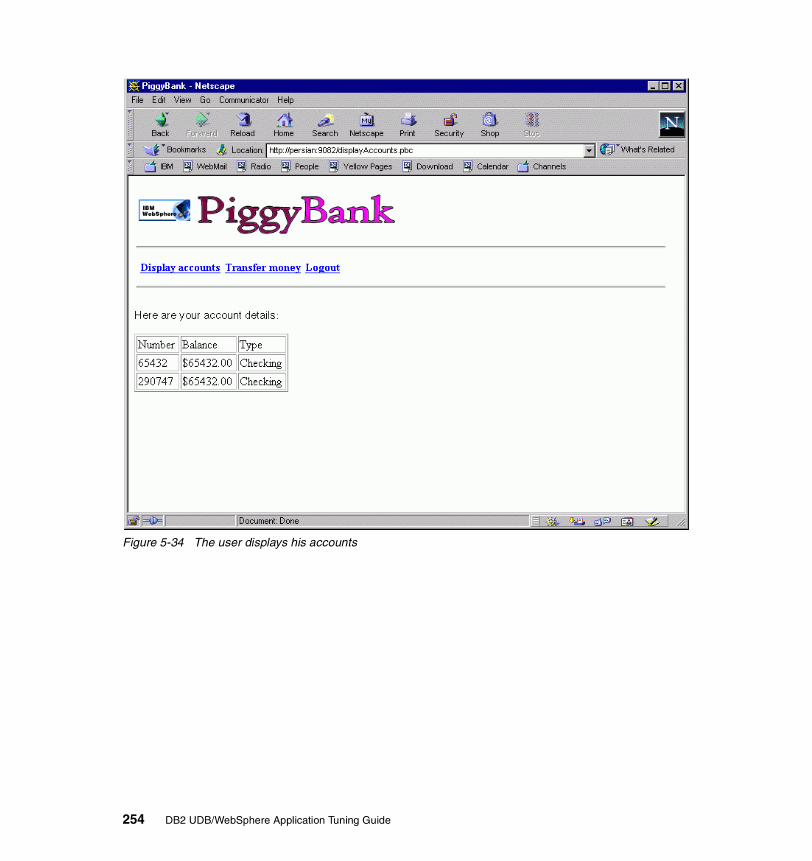
Figure 5-34 The user displays his accounts
254 DB2 UDB/WebSphere Application Tuning Guide

Figure 5-35 Transfer money between the users different accounts
Chapter 5. Problem determination scenarios 255

Environment configurationFigure 5-36 shows the environment used for the PiggyBank application for the EJB isolation mismatch scenario.
Figure 5-36 EJB isolation mismatch scenario environment
Our WebSphere Application Server and DB2 UDB servers were installed on separate AIX machines persian and mansel respectively. We used the WebSphere Performance Tool to drive the workload.
Monitor level settingsBoth WebSphere Application Server and DB2 were installed using default configurations, and default settings were used. The relevant settings are summarized in Table 5-2.
Note: Given the online banking nature of the application, we chose to disable session persistence in the WebSphere Application Server Session Manager service.
Application ServerWeb Browsers
persian(Trade App Server)
Database Server
mansel TRADEDB
Batch Updateprogram
web client(2 users)akstress
100,000 seconds
WAS AE 4.0.2 FP2IHS 1.3.19
DB2 Client 7.2 FP6 DB2 Server 7.2 FP6
WAS40
Windows 2000 RS/6000 44PAIX 4.3.3 ML08
RS/6000 44PAIX 4.3.3 ML08
256 DB2 UDB/WebSphere Application Tuning Guide

Table 5-2 EJB isolation mismatch scenario monitor settings
Hardware configuration Software configuration
Database Server (mansel) AIX 4.3.3 ML08
RS/6000 44P1 GB Memory32 GB disk
DB2 UDB EE v7.2 FP6Instance name: db2inst1DIAGLEVEL: 4Log name: db2diag.log and jdbcerr.logLog path: /home/db2inst1/sqllib/db2dumpDatabases: WAS40 and PIGGY
Application Server (persian) AIX 4.3.3 ML08
RS/6000 44P1 GB Memory32 GB disk
WAS AE v4.0.2 FP2Log name: tracefile and activity.logLog path: /usr/WebSphere/AppServer/logs
Application name: PiggyLog name: Piggystdout.txt and Piggystderr.txtLog path: /usr/WebSphere/AppServer/logs
HTTP Server v1.3.19Log name: error.log and access.logLog path: /usr/HTTPServer/logs
DB2 UDB Runtime Client v7.2 FP6
Attention: The diagnostic error capture level parameter DIAGLEVEL default value of 3 is appropriate for routine monitoring.
We chose to change this value to 4 which is the highest level of information in all our problem determination scenarios, using the commands shown in Figure 5-3. This is because the routine monitoring level does not provide us with the information required to perform proper problem diagnosis.
This is equivalent to performing exception monitoring for problem diagnosis.
Attention: We configured DB2 with a LOCKTIMEOUT value of 20 seconds in order to decrease the amount of time an application can wait for a lock in our controlled environment. The default value is 300 seconds.
Chapter 5. Problem determination scenarios 257
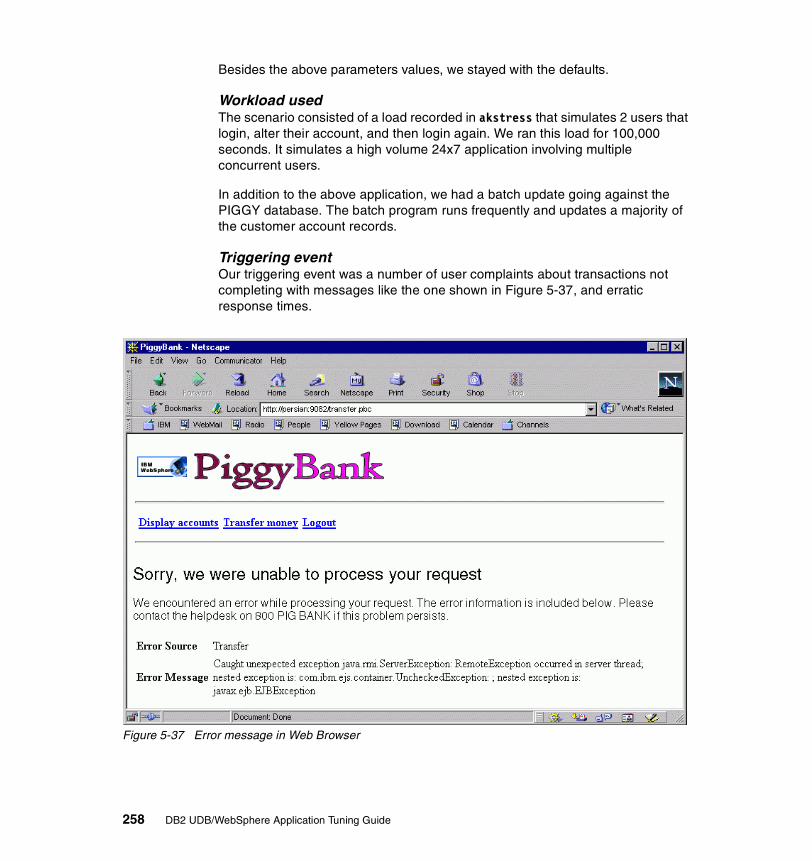
Besides the above parameters values, we stayed with the defaults.
Workload usedThe scenario consisted of a load recorded in akstress that simulates 2 users that login, alter their account, and then login again. We ran this load for 100,000 seconds. It simulates a high volume 24x7 application involving multiple concurrent users.
In addition to the above application, we had a batch update going against the PIGGY database. The batch program runs frequently and updates a majority of the customer account records.
Triggering event Our triggering event was a number of user complaints about transactions not completing with messages like the one shown in Figure 5-37, and erratic response times.
Figure 5-37 Error message in Web Browser
258 DB2 UDB/WebSphere Application Tuning Guide
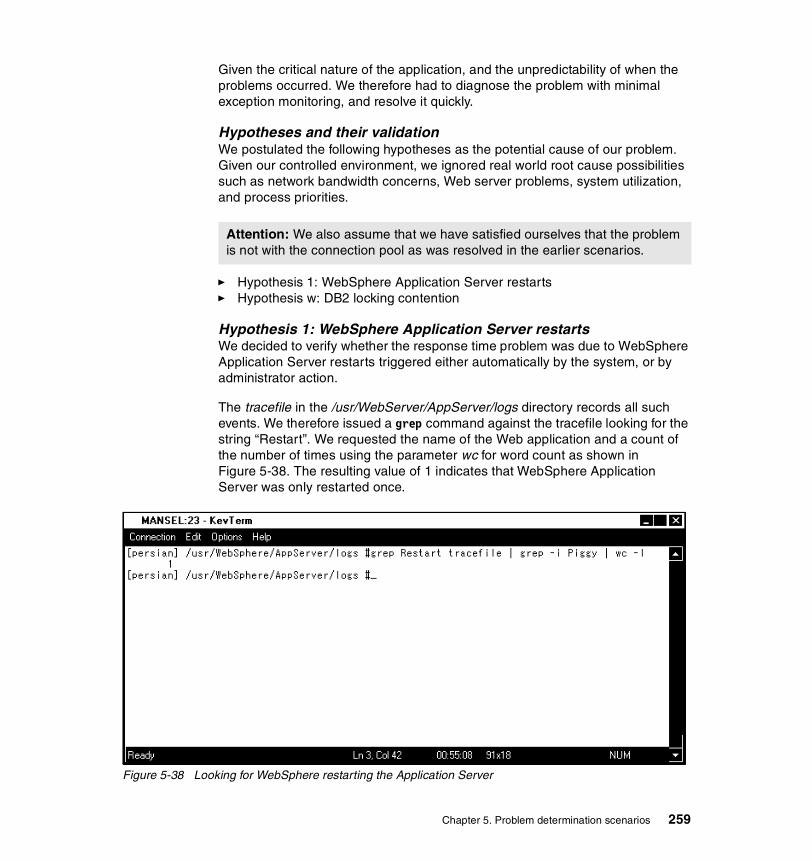
Given the critical nature of the application, and the unpredictability of when the problems occurred. We therefore had to diagnose the problem with minimal exception monitoring, and resolve it quickly.
Hypotheses and their validationWe postulated the following hypotheses as the potential cause of our problem. Given our controlled environment, we ignored real world root cause possibilities such as network bandwidth concerns, Web server problems, system utilization, and process priorities.
� Hypothesis 1: WebSphere Application Server restarts� Hypothesis w: DB2 locking contention
Hypothesis 1: WebSphere Application Server restartsWe decided to verify whether the response time problem was due to WebSphere Application Server restarts triggered either automatically by the system, or by administrator action.
The tracefile in the /usr/WebServer/AppServer/logs directory records all such events. We therefore issued a grep command against the tracefile looking for the string “Restart”. We requested the name of the Web application and a count of the number of times using the parameter wc for word count as shown in Figure 5-38. The resulting value of 1 indicates that WebSphere Application Server was only restarted once.
Figure 5-38 Looking for WebSphere restarting the Application Server
Attention: We also assume that we have satisfied ourselves that the problem is not with the connection pool as was resolved in the earlier scenarios.
Chapter 5. Problem determination scenarios 259
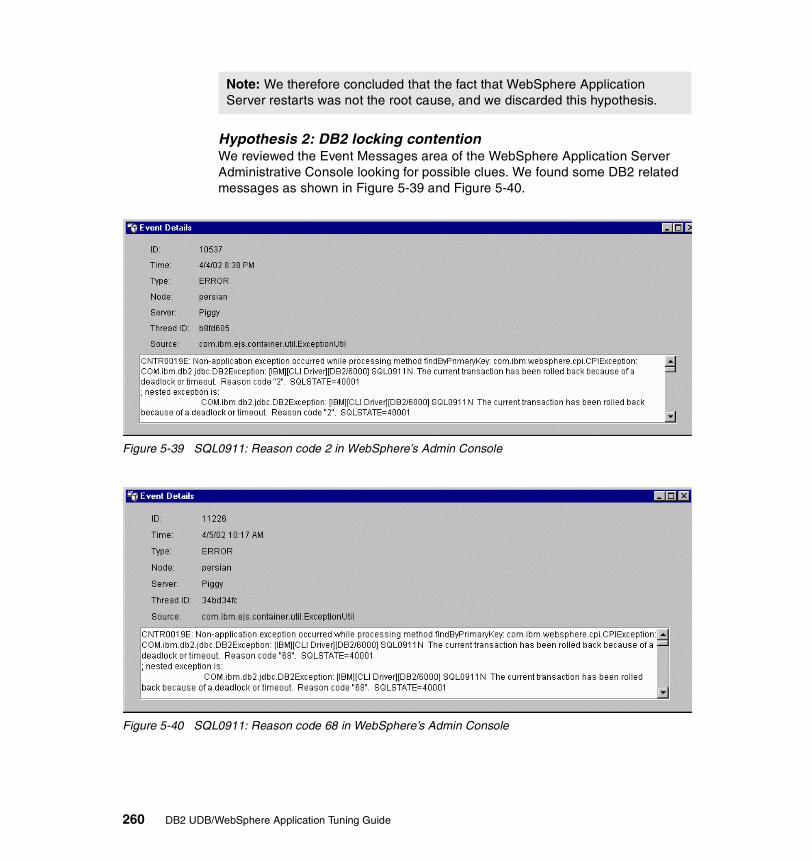
Hypothesis 2: DB2 locking contentionWe reviewed the Event Messages area of the WebSphere Application Server Administrative Console looking for possible clues. We found some DB2 related messages as shown in Figure 5-39 and Figure 5-40.
Figure 5-39 SQL0911: Reason code 2 in WebSphere’s Admin Console
Figure 5-40 SQL0911: Reason code 68 in WebSphere’s Admin Console
Note: We therefore concluded that the fact that WebSphere Application Server restarts was not the root cause, and we discarded this hypothesis.
260 DB2 UDB/WebSphere Application Tuning Guide

Other infrequent messages such as the one shown in Figure 5-41 were discovered. This is a remote exception, and mentions Corba Transaction_Rolledback, but does not point to any database related problem, other than the fact that it mentions transactions.
Figure 5-41 Corba Transaction_Rolledback error in WebSphere’s Admin Console
We chose to focus on the SQL error messages, and particularly on the one shown in Figure 5-39 — this is highlighted in Example 5-2.
Example 5-2 Error message SQL0911N, Reason code “2”
[IBM][CLI Driver][DB2/6000] SQL0911N The current transaction has been rolled back because of a deadlock or timeout. Reason code "2". SQLSTATE=40001
We issued the following command on a DB2 command line in order to get a fuller explanation of the error message.
db2 ? SQL0911N
Example 5-3 lists the results of this command.
Example 5-3 Explanation of the SQL0911N error message
SQL0911N The current transaction has been rolled back because of a deadlock or timeout. Reason code "<reason-code>".
Explanation: The current unit of work was involved in anunresolved contention for use of an object and had to be rolledback.
The reason codes are as follows:
Chapter 5. Problem determination scenarios 261
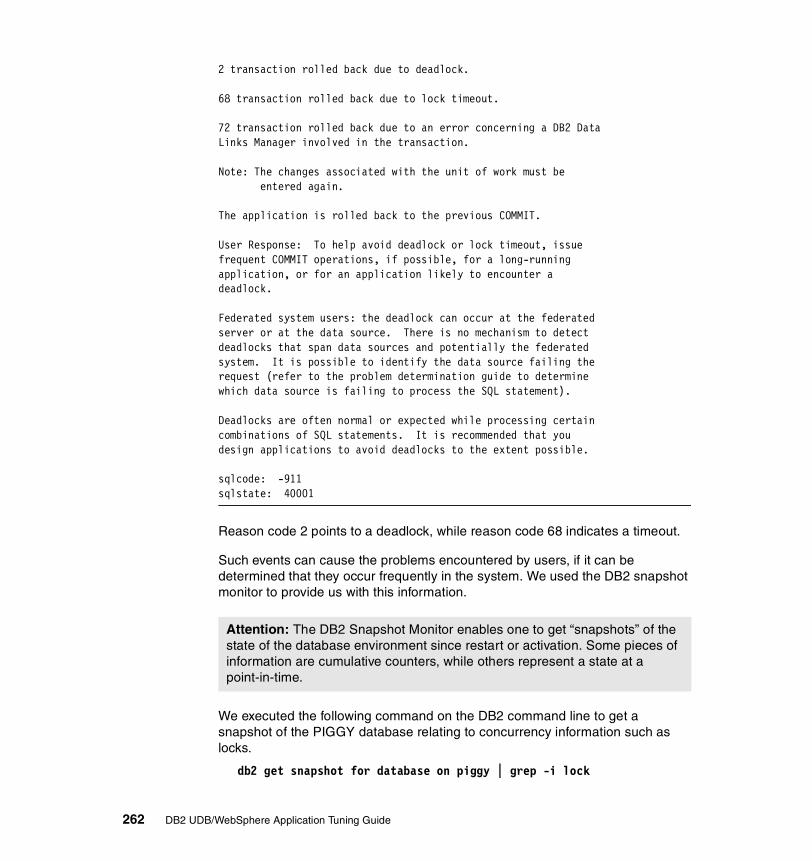
2 transaction rolled back due to deadlock.
68 transaction rolled back due to lock timeout.
72 transaction rolled back due to an error concerning a DB2 DataLinks Manager involved in the transaction.
Note: The changes associated with the unit of work must be entered again.
The application is rolled back to the previous COMMIT.
User Response: To help avoid deadlock or lock timeout, issuefrequent COMMIT operations, if possible, for a long-runningapplication, or for an application likely to encounter adeadlock.
Federated system users: the deadlock can occur at the federatedserver or at the data source. There is no mechanism to detectdeadlocks that span data sources and potentially the federatedsystem. It is possible to identify the data source failing therequest (refer to the problem determination guide to determinewhich data source is failing to process the SQL statement).
Deadlocks are often normal or expected while processing certaincombinations of SQL statements. It is recommended that youdesign applications to avoid deadlocks to the extent possible.
sqlcode: -911sqlstate: 40001
Reason code 2 points to a deadlock, while reason code 68 indicates a timeout.
Such events can cause the problems encountered by users, if it can be determined that they occur frequently in the system. We used the DB2 snapshot monitor to provide us with this information.
We executed the following command on the DB2 command line to get a snapshot of the PIGGY database relating to concurrency information such as locks.
db2 get snapshot for database on piggy | grep -i lock
Attention: The DB2 Snapshot Monitor enables one to get “snapshots” of the state of the database environment since restart or activation. Some pieces of information are cumulative counters, while others represent a state at a point-in-time.
262 DB2 UDB/WebSphere Application Tuning Guide

Figure 5-42 lists the results of this command.
Figure 5-42 Snapshot from database focusing on locks.
The snapshot clearly indicates the occurrence of DB2 lock contention as follows:
� 144 lock waits — This corresponds to an application having to wait for another user to release a lock on a required resource before it can continue to execute.
� 10 deadlocks — Indicates where DB2 had to choose victims among two or more users waiting on resources held by each other.
� 2 lock timeouts — Indicates where an application wait for a locked resource has exceeded the threshold specified in LOCKTIMEOUT in order to get a lock, and had to be rolled back.
� 36 Lock Escalations — Indicates where the total number of locks taken by has exceeded the LOCKLIST specified value, and DB2 has therefore escalated the granularity of the lock taken from row level locks to a table level lock. Such an escalation has the potential to significantly impact concurrency among users requesting incompatible locks on shared resources. Exclusive lock escalations are the most restrictive of such locks, essentially single threading execution of applications contending for the same resource. There are 32 such escalations.
Again assuming exception monitoring, the following DB2 command lists the current status of all connected applications.
list application show detail | grep PIGGY
Important: We assume here that this information is being captured in “real time”, that is, during or immediately after the user problems have occurred. This is equivalent to performing exception monitoring.
Chapter 5. Problem determination scenarios 263
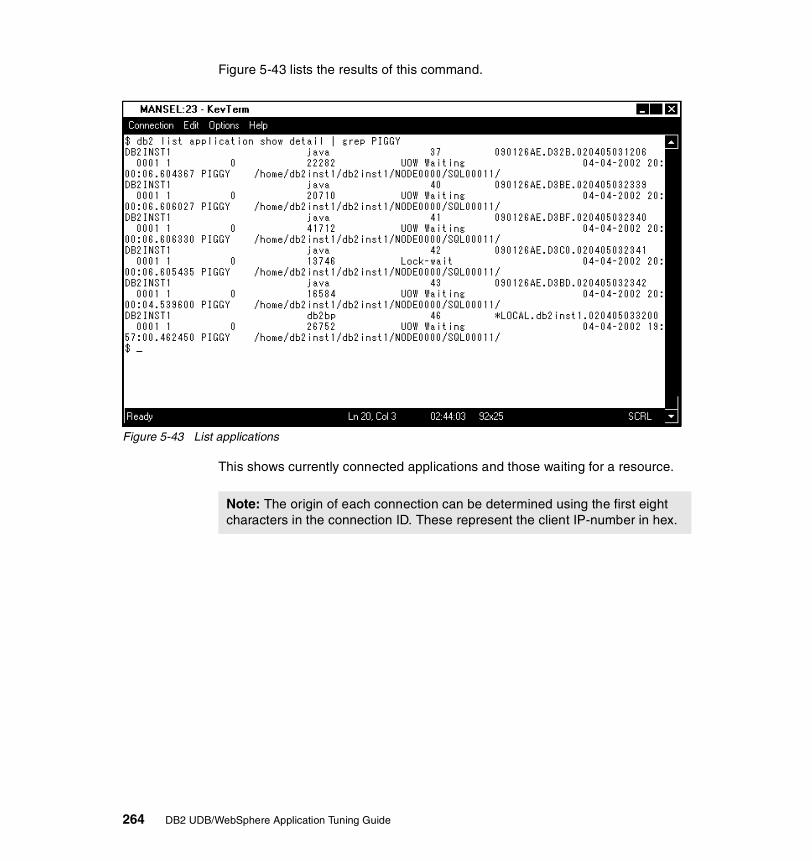
Figure 5-43 lists the results of this command.
Figure 5-43 List applications
This shows currently connected applications and those waiting for a resource.
Note: The origin of each connection can be determined using the first eight characters in the connection ID. These represent the client IP-number in hex.
264 DB2 UDB/WebSphere Application Tuning Guide

The same information can be obtained from the DB2 Control Center, which provides a more “user-friendly” interface, as shown in Figure 5-44 and Figure 5-45.
Figure 5-44 DB2 Control Center, list applications
Chapter 5. Problem determination scenarios 265

The output of the Applications tab is shown next in Figure 5-45.
Figure 5-45 Current connected applications with status
The problem is clearly with locking contention, but we need to identify the culprits.
For this, we analyzed isolation levels used by the applications, database parameters relating to locking and concurrency, and information about deadlocks, lock waits, and lock escalations, as follows:
� Isolation levels used by the applications
We reviewed the EAR file containing the application, which includes EJBs. We used the Application Assembly Tool in WebSphere Application Server to determine the isolation level as shown in Figure 5-46. This tool can be used to modify isolation levels as well.
266 DB2 UDB/WebSphere Application Tuning Guide

Figure 5-46 Application Assembly Tool
We noticed that the application EJB was configured for Java Repeatable Read which happens to be the default isolation level. This corresponds to a rather restrictive Read Stability isolation level in DB2 per Table 2-1 on page 82.
Note: The semantics of this application needs to be reviewed in order to determine whether or not the Java Repeatable Read isolation can be diluted to a level that translates to a less restrictive isolation level in DB2.
Chapter 5. Problem determination scenarios 267
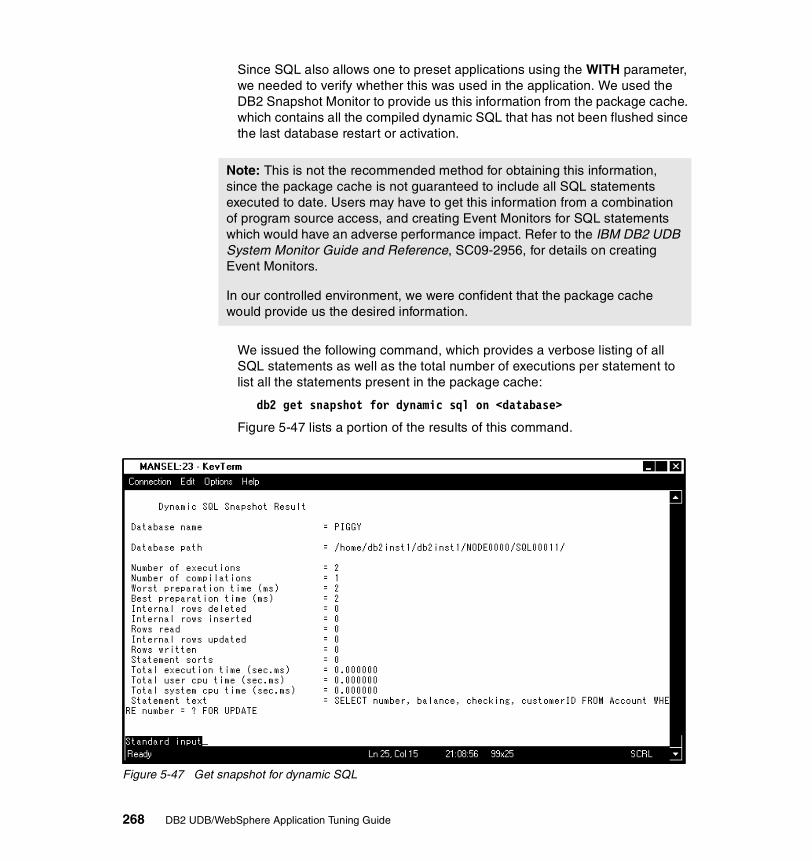
Since SQL also allows one to preset applications using the WITH parameter, we needed to verify whether this was used in the application. We used the DB2 Snapshot Monitor to provide us this information from the package cache. which contains all the compiled dynamic SQL that has not been flushed since the last database restart or activation.
We issued the following command, which provides a verbose listing of all SQL statements as well as the total number of executions per statement to list all the statements present in the package cache:
db2 get snapshot for dynamic sql on <database>
Figure 5-47 lists a portion of the results of this command.
Figure 5-47 Get snapshot for dynamic SQL
Note: This is not the recommended method for obtaining this information, since the package cache is not guaranteed to include all SQL statements executed to date. Users may have to get this information from a combination of program source access, and creating Event Monitors for SQL statements which would have an adverse performance impact. Refer to the IBM DB2 UDB System Monitor Guide and Reference, SC09-2956, for details on creating Event Monitors.
In our controlled environment, we were confident that the package cache would provide us the desired information.
268 DB2 UDB/WebSphere Application Tuning Guide
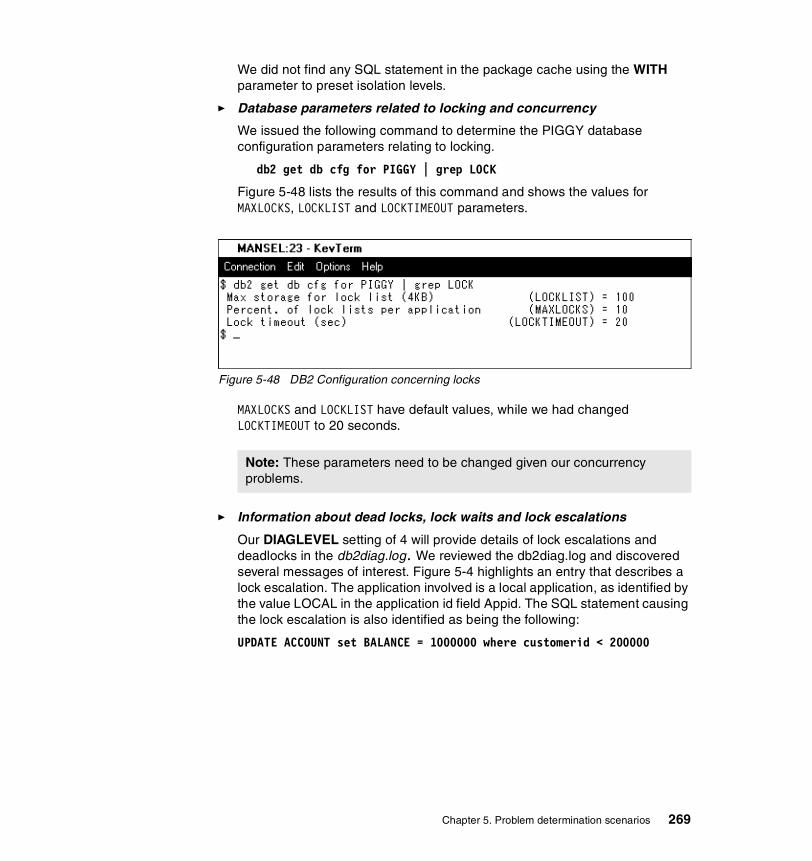
We did not find any SQL statement in the package cache using the WITH parameter to preset isolation levels.
� Database parameters related to locking and concurrency
We issued the following command to determine the PIGGY database configuration parameters relating to locking.
db2 get db cfg for PIGGY | grep LOCK
Figure 5-48 lists the results of this command and shows the values for MAXLOCKS, LOCKLIST and LOCKTIMEOUT parameters.
Figure 5-48 DB2 Configuration concerning locks
MAXLOCKS and LOCKLIST have default values, while we had changed LOCKTIMEOUT to 20 seconds.
� Information about dead locks, lock waits and lock escalations
Our DIAGLEVEL setting of 4 will provide details of lock escalations and deadlocks in the db2diag.log. We reviewed the db2diag.log and discovered several messages of interest. Figure 5-4 highlights an entry that describes a lock escalation. The application involved is a local application, as identified by the value LOCAL in the application id field Appid. The SQL statement causing the lock escalation is also identified as being the following:
UPDATE ACCOUNT set BALANCE = 1000000 where customerid < 200000
Note: These parameters need to be changed given our concurrency problems.
Chapter 5. Problem determination scenarios 269
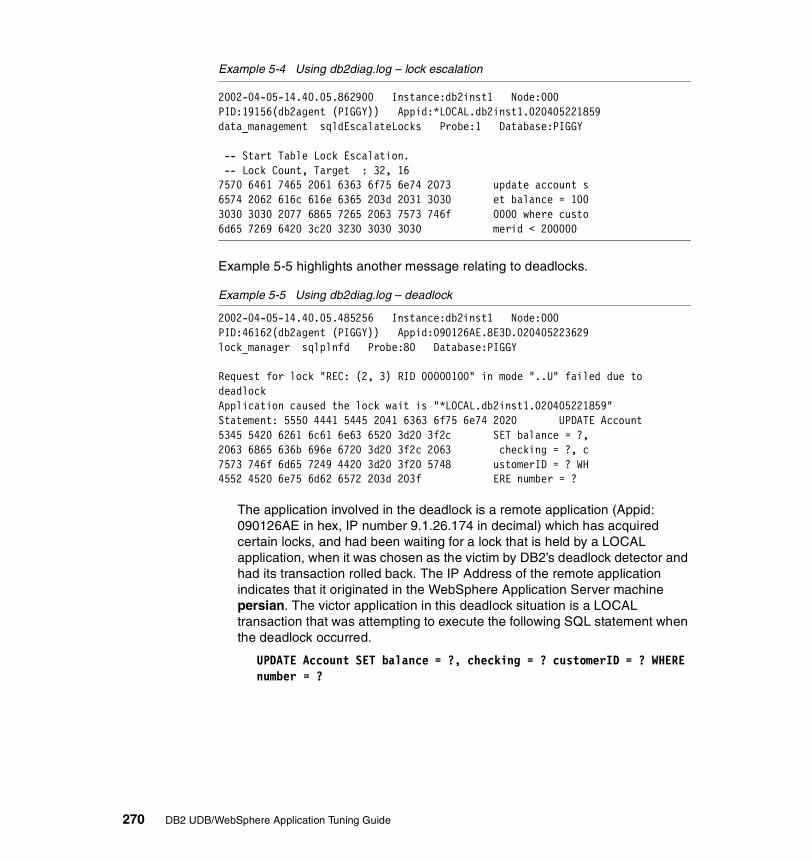
Example 5-4 Using db2diag.log – lock escalation
2002-04-05-14.40.05.862900 Instance:db2inst1 Node:000PID:19156(db2agent (PIGGY)) Appid:*LOCAL.db2inst1.020405221859data_management sqldEscalateLocks Probe:1 Database:PIGGY
-- Start Table Lock Escalation. -- Lock Count, Target : 32, 167570 6461 7465 2061 6363 6f75 6e74 2073 update account s6574 2062 616c 616e 6365 203d 2031 3030 et balance = 1003030 3030 2077 6865 7265 2063 7573 746f 0000 where custo6d65 7269 6420 3c20 3230 3030 3030 merid < 200000
Example 5-5 highlights another message relating to deadlocks.
Example 5-5 Using db2diag.log – deadlock
2002-04-05-14.40.05.485256 Instance:db2inst1 Node:000PID:46162(db2agent (PIGGY)) Appid:090126AE.8E3D.020405223629lock_manager sqlplnfd Probe:80 Database:PIGGY
Request for lock "REC: (2, 3) RID 00000100" in mode "..U" failed due to deadlockApplication caused the lock wait is "*LOCAL.db2inst1.020405221859"Statement: 5550 4441 5445 2041 6363 6f75 6e74 2020 UPDATE Account5345 5420 6261 6c61 6e63 6520 3d20 3f2c SET balance = ?,2063 6865 636b 696e 6720 3d20 3f2c 2063 checking = ?, c7573 746f 6d65 7249 4420 3d20 3f20 5748 ustomerID = ? WH4552 4520 6e75 6d62 6572 203d 203f ERE number = ?
The application involved in the deadlock is a remote application (Appid: 090126AE in hex, IP number 9.1.26.174 in decimal) which has acquired certain locks, and had been waiting for a lock that is held by a LOCAL application, when it was chosen as the victim by DB2’s deadlock detector and had its transaction rolled back. The IP Address of the remote application indicates that it originated in the WebSphere Application Server machine persian. The victor application in this deadlock situation is a LOCAL transaction that was attempting to execute the following SQL statement when the deadlock occurred.
UPDATE Account SET balance = ?, checking = ? customerID = ? WHERE number = ?
270 DB2 UDB/WebSphere Application Tuning Guide

We decided to taker a closer look at the above SQL statement which was causing deadlocks. We used DB2 Visual Explain for our purpose, which can be invoked from the DB2 Control Center as shown in Figure 5-49.
Figure 5-49 Explain SQL in DB2 Control Center
We copied the above SQL statement as shown in Figure 5-50.
Chapter 5. Problem determination scenarios 271

Figure 5-50 Explain the SQL statement
Tip: When editing an SQL statement into Visual Explain, you can specify for each predicate either a distinct value or a question mark (“?” — also known as a parameter marker), which is acts as a placeholder for a value to be supplied later.
When a distinct value is specified in a predicate, for example, ..WHERE ID = 123. DB2 will then create an access plan based on the cardinality for that value using information available in the system catalog.
When a parameter marker is supplied, for example, ...WHERE ID = ?, DB2 treats this parameter marker as if it were a variable value, and optimizes the access path accordingly.
Most application programs use parameter markers, and unless the application uses the same value every time for a predicate, the use of question marks in the predicate is appropriate, to ensure that the access plan mirrors what the real access plan DB2 will generate for the SQL statement.
272 DB2 UDB/WebSphere Application Tuning Guide

The result of the visual explain, shown in Figure 5-51, gives a graphical view of the execution plan for the SQL statement.
Figure 5-51 Result of the visual explain
The results show the SQL statement performing a tablespace scan, which is usually undesirable from a performance or concurrency perspective. Our knowledge of the application tells us that the NUMBER column should only support unique values. Since this column is used as a predicate, we decided to determine why DB2 had not chosen an index on this column as its access path.
Chapter 5. Problem determination scenarios 273
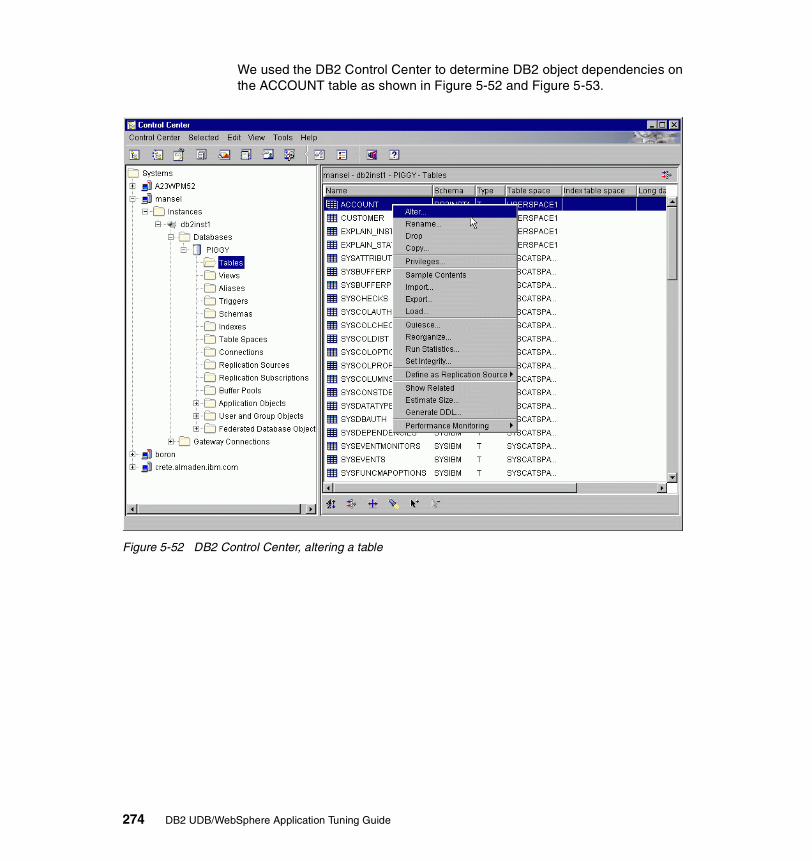
We used the DB2 Control Center to determine DB2 object dependencies on the ACCOUNT table as shown in Figure 5-52 and Figure 5-53.
Figure 5-52 DB2 Control Center, altering a table
274 DB2 UDB/WebSphere Application Tuning Guide

Figure 5-53 No unique index on table ACCOUNT
We found that there was no unique index on the NUMBER column. Besides the integrity concern of not enforcing unique values in this column, performance and concurrency can be significantly impacted as well.
Root cause of the problemA number of factors appear to be the cause of the problem, including restrictive EJB isolation levels, under-configured database configuration parameters, and sub-optimal access paths for certain SQL statements.
Chapter 5. Problem determination scenarios 275

Apply best practicesWe decided to address all these issues to resolve the concurrency problem.
� Change EJB isolation level to be less restrictive
We considered our PiggyBank application and concluded that it did not require the Java Repeatable Read (DB2 Read Stability) isolation level, since very rarely if any time does more than customer access the same account simultaneously.
We therefore decided to change the Isolation Level Attribute of the EJBs from Repeatable Read to Read Committed. This translates in DB2 to Cursor Stability which is a far less restrictive locking level. Figure 5-54 shows how we changed this using the Application Assembly Tool.
Figure 5-54 Application Assembly Tool
We saved the new Application EAR file, and deployed it with code regeneration.
276 DB2 UDB/WebSphere Application Tuning Guide

� Change database config locking parameters
In our controlled environment, we were not constrained on memory resources, and decided to increase the allocation of memory for LOCKLIST, and MAXLOCKS.
– An optimal LOCKLIST parameter value can be computed by knowing the memory requirements of each lock, the maximum number of concurrent connections and the average number of concurrent locks held by an application.
Each initial lock on a DB2 object consumes 72 bytes of memory, with each additional lock on the same object consuming 36 bytes. LOCKLIST parameter value is specified in 4KB blocks, and may be computed as follows.
In this equation:
Maxconapp is the maximum number of connected applications.
Avgnumlocks is the average number of locks per connected application.
Important: This may not be an option in resource constrained environments, and other alternatives may have to be considered such as reducing the number of concurrent applications, frequent commits in the application program, less restrictive locking, and optimizing access paths to reduce the impact of locking.
Note: The default LOCKLIST parameter value is 200 KB (50 4-KB blocks) on Windows, and 400 KB (100 4-KB blocks) on UNIX.
LOCKLIST Maxconapp Avgnumlocks 72××4096
-------------------------------------------------------------------------------------------=
Chapter 5. Problem determination scenarios 277

– The MAXLOCKS parameter can be adjusted to reduce lock escalations. MAXLOCKS is specified as a percentage of LOCKLIST memory that can be assigned to single application at a given time before lock escalation is triggered.
We considered increasing MAXLOCKS to prevent lock escalation occurring in the update batch program. We computed the ACCOUNT table to have 20,000 rows, and we estimated that the update batch program touched about 70% of the rows. Therefore 14000 rows times 72 bytes per lock gives us over one megabyte. This value is larger than the default LOCKLIST value of 400K.
We therefore decided to increase the value of the LOCKLIST parameter to two megabytes, and the MAXLOCKS parameter to 50%. This would allow a single application to obtain up to one megabyte before triggering lock escalation.
We also modified the update batch script to issue three separate SQL statements with commits after each SQL statement, instead of the single SQL statement it currently had. This additionally limits the lock consumption of the update batch process, thereby further reducing if not eliminating lock escalations.
Another little known feature available in DB2 is the ability to inhibit next key locking by setting the variable DB2_RR_TO_RS parameter to yes via the db2set command. This is appropriate when SQL INSERTs and DELETEs are seen to have problems due to next-key-locking. The DB2_RR_TO_RS option stops all next key locking on user tables, but does not affect system catalog tables. While this consideration did not apply to our environment, you may consider its applicability in your environment.
Note: The splitting of the SQL in the batch program into three SQL statements and three units-of-work has certain ramifications. In the event of failure in the second or third SQL statements, the effects of the previously executed statements are not rolled back, and appropriate restart logic must be implemented in the application program to ensure proper semantics.
Restriction: When this option is enabled, any packages bound with Cursor Stability are automatically changes to Read Stability, because DB2 can no longer guarantee Cursor Stability. Do not use this if you require ANSI and SQL92 standard Cursor Stability.
This option is no longer necessary in DB2 Version 8 with type-2 indexes. See Chapter 3 for more information
278 DB2 UDB/WebSphere Application Tuning Guide
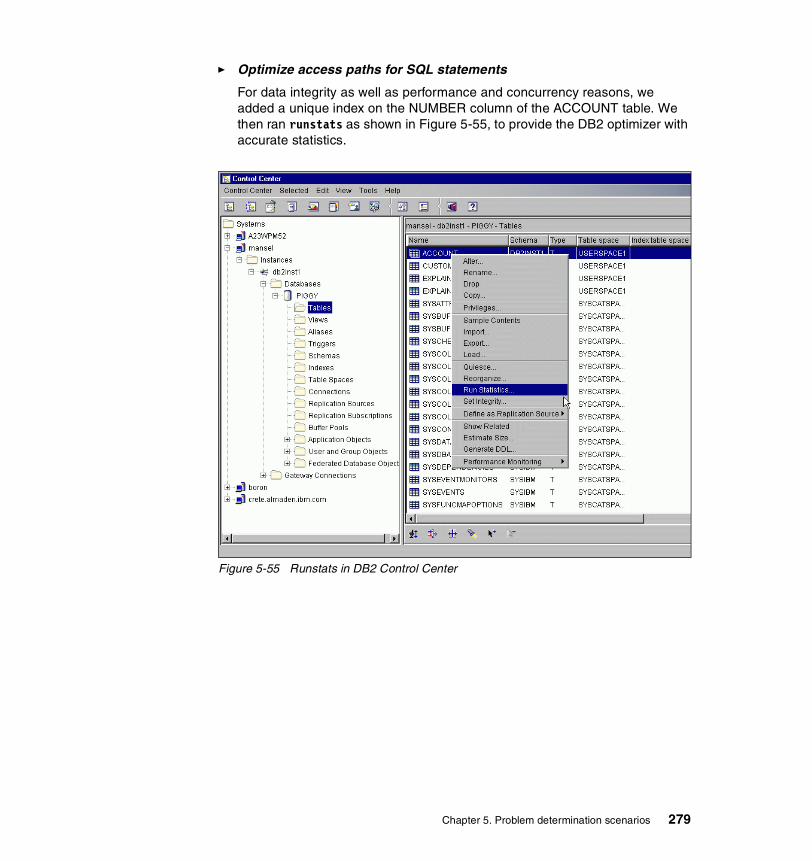
� Optimize access paths for SQL statements
For data integrity as well as performance and concurrency reasons, we added a unique index on the NUMBER column of the ACCOUNT table. We then ran runstats as shown in Figure 5-55, to provide the DB2 optimizer with accurate statistics.
Figure 5-55 Runstats in DB2 Control Center
Chapter 5. Problem determination scenarios 279
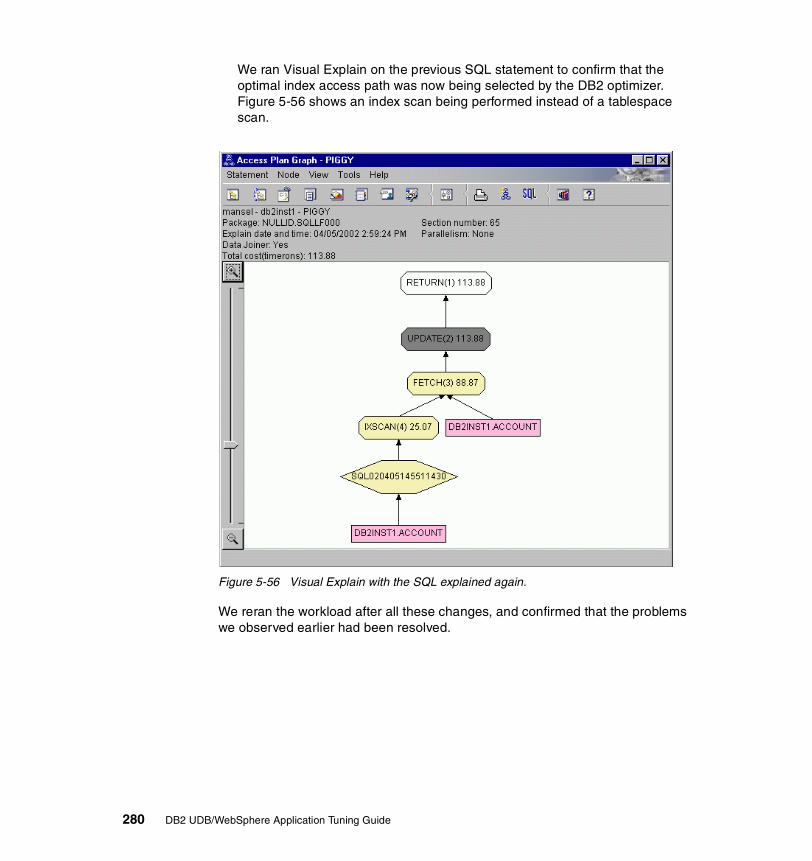
We ran Visual Explain on the previous SQL statement to confirm that the optimal index access path was now being selected by the DB2 optimizer. Figure 5-56 shows an index scan being performed instead of a tablespace scan.
Figure 5-56 Visual Explain with the SQL explained again.
We reran the workload after all these changes, and confirmed that the problems we observed earlier had been resolved.
280 DB2 UDB/WebSphere Application Tuning Guide

Case 2: EJB access intentThe root cause problem demonstrated here is one where the default EJB Access Intent specification with Entity EJBs with Container Managed Persistence (CMP) can have a signification adverse performance impact in certain applications.
Generally, when an instance of an entity EJB is spawned, and gets involved in a transaction, its data is usually read from a database. The EJB spec demands that this data be written back to the database when the transaction ends. When the Entity EJB reads the data from the database, it needs to ensure that the data is not modified while the instance is active. It therefore reads the data with an intent to update it, and then writes the modified data back to the database when the transaction commits. This is appropriate for transactions that mostly update the data they read.
Unfortunately, this read operation with update intent, and the writing back to the database occurs, even when if the data has not been modified. For entity EJBs that only perform read access to data, this mode of operation can cause significant locking contention and performance problems.
EJBs are used in many types of application environments. With their built in features for transactions and session handling, they are most used in workload patterns that must involve logins and transactions.
Description of the applicationOur scenario involves the stock quote requests transactions of the Trade application. Stock quote requests tend to outnumber trading transactions by orders of magnitude, sometimes as high as a 1000 to 1. Many users tend to login to their brokerage site and request stock quotes on their favorite stocks throughout the day. Some users tend to login once at the beginning of the day, and leave their browser open on the site the rest of the day as shown in Figure 5-57.
Chapter 5. Problem determination scenarios 281

Figure 5-57 Getting stock quotes in Trade
The frequency of stock quote requests increases substantially on active trading days, and events of particular relevance to stock symbols that the user is interested in.
282 DB2 UDB/WebSphere Application Tuning Guide

Environment configurationFigure 5-58 shows the environment used for this scenario.
Figure 5-58 EJB Access Intent scenario environment
Our WebSphere Application Server and DB2 server were installed on a single dedicated machine, with adequate CPU, memory and disk resources for our scenario. We used the WebSphere Performance Tool to drive out workload.
Monitor settingsBoth WebSphere Application Server and DB2 were installed with default configurations, and default settings were used. The relevant settings are summarized in Table 5-3.
Web Browser Application and Database Server
TRADEDB
akstress (2 users)
WAS AE 4.0.2 FP2IHS 1.3.19
DB2 Client 7.2 FP6
DB2 Server 7.2 FP6
WAS40
eServer xSeries 330Windows 2000 with Service Pack 2
boron(Trade App Server)
Chapter 5. Problem determination scenarios 283

Table 5-3 EJB Access Intent scenario monitor settings
Adequate buffer pool size was specified.
Workload usedThe scenario consisted of a load recorded in akstress that simulates 2 users that login, and request stock quotes, and then repeatedly re-requests the same stock quotes. We ran this load that initiates 1,000,000 page requests. It simulates a high volume trading application involving multiple customers that predominantly perform stock quote requests.
Triggering eventOur triggering event was a number of user complaints about very poor response times, and complaints from the customer service department about account brokerage account closures due to inadequate online service levels. No error messages were reported by the customer.
The “dot-com” era launched the online trading frenzy, and while day trading euphoria has lost its lustre, customer interest in browsing stock quotes is continuing. Attracting and retaining customers is of particular concern, especially in the current economic climate.
Hypotheses and their validationWe postulated the following hypotheses as the potential cause of the problem. Given our controlled environment, we ignored real world root cause possibilities such as network bandwidth concerns, and Web server problems:
� Hypothesis 1: Lack of CPU resources � Hypothesis 2: Disk I/O contention� Hypothesis 3: Memory constraints� Hypothesis 4: Contention in the database
Hardware configuration Software configuration
Database and Application Server (boron)
Windows 2000 FixPack2
IBM eServer xSeries 330Twin CPU 1.1 GHz each4GB memory36 GB disk
HTTP Server v1.3.19WAS AE v4.0.2 FP2Application name: TradeLog name: tracefile, activity.log, Tradestdout.txt and Tradestderr.txtLog path: c:\usr\WebSphere\AppServer\logsDB2 UDB EE v7.2 FP6DIAGLEVEL: 3Databases: WAS40 and TRADEDBLog name: db2diag.loglLog path: c:\home/db2inst1/sqllib/db2dump
284 DB2 UDB/WebSphere Application Tuning Guide
Hypothesis 1: Lack of CPU resourcesWe considered whether CPU constraints at peak workloads could be the cause of the problem since we had a single machine serving both WebSphere Application Server and DB2.
Hypothesis 2: Disk I/O contentionWe speculated whether the possible cause of the poor response times at peak periods, could be due to disk I/O contention in the shared WebSphere Application Server and DB2 environment.
Stock information is supplied by an external service provider via an MQ Series queue, and is written to the database. Active stock symbols tend to be buffer pool resident, and do not cause synchronous read I/O to occur. Using the Windows Task Manager Statistics, and selecting columns I/O Read Bytes, I/O Write Bytes, etc., we found that disk I/O contention was within acceptable parameters during peak periods.
Hypothesis 3: Memory constraintsWe considered whether system swapping due to potential memory constraints as being the cause of the problem. However, the Windows Task Manager Statistics indicated plenty of free memory available for use.
Attention: We also assume that we have satisfied ourselves that the problem is not with the connection pool as resolved in the earlier scenarios.
Note: This notion was quickly discarded after monitoring the system with the Window System Monitor at peak periods. CPU consumption did not go up to 100% in our observations.
Note: We therefore discarded disk I/O contention as the cause of the poor response times.
Attention: In a UNIX environment, we would have used vmstat and iostat to determine swapping and disk activity.
Note: We therefore discarded memory constraints as the cause of the problem.
Chapter 5. Problem determination scenarios 285
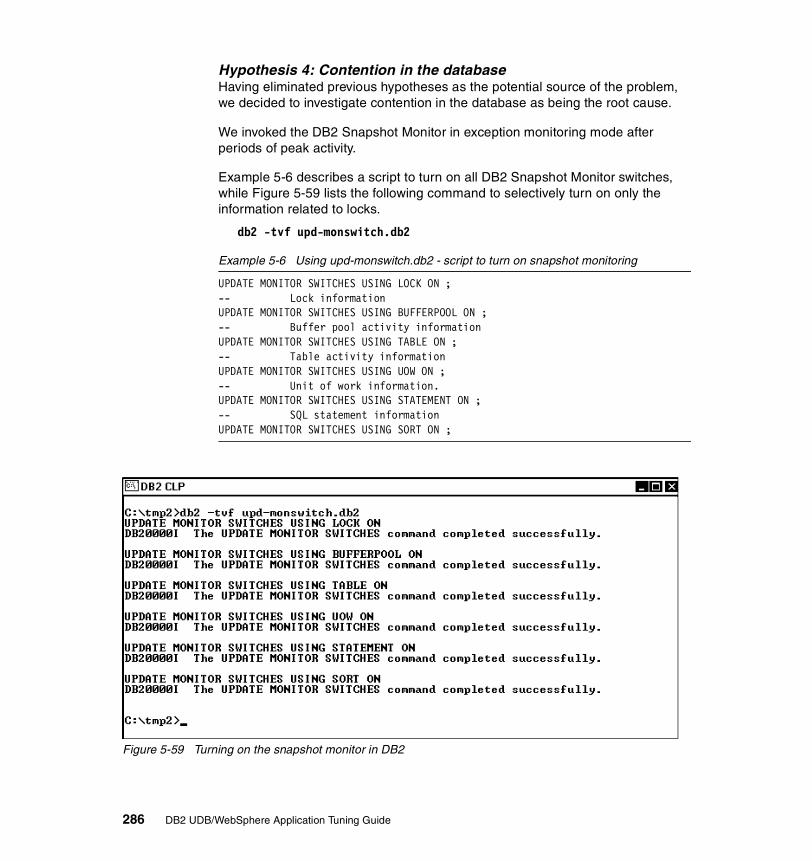
Hypothesis 4: Contention in the databaseHaving eliminated previous hypotheses as the potential source of the problem, we decided to investigate contention in the database as being the root cause.
We invoked the DB2 Snapshot Monitor in exception monitoring mode after periods of peak activity.
Example 5-6 describes a script to turn on all DB2 Snapshot Monitor switches, while Figure 5-59 lists the following command to selectively turn on only the information related to locks.
db2 -tvf upd-monswitch.db2
Example 5-6 Using upd-monswitch.db2 - script to turn on snapshot monitoring
UPDATE MONITOR SWITCHES USING LOCK ON ;-- Lock information UPDATE MONITOR SWITCHES USING BUFFERPOOL ON ;-- Buffer pool activity information UPDATE MONITOR SWITCHES USING TABLE ON ;-- Table activity information UPDATE MONITOR SWITCHES USING UOW ON ;-- Unit of work information. UPDATE MONITOR SWITCHES USING STATEMENT ON ;-- SQL statement information UPDATE MONITOR SWITCHES USING SORT ON ;
Figure 5-59 Turning on the snapshot monitor in DB2
286 DB2 UDB/WebSphere Application Tuning Guide

After turning on the monitor switches, we issued the following command to obtain information about locking:
db2 get snapshot on database for tradedb | grep -i lock
Figure 5-60 lists the results of this command.
Figure 5-60 db2 get snapshot for database | grep -i lock
We noticed no occurrences of timeouts, deadlocks or lock escalations, but were and lock escalations, but saw quite a few cases of lock waits. While the average wait time (Lock Waits [1690] / Time database waited on locks (ms) [39872]) of 24 ms for a lock is not high and therefore not causing lock timeouts, the number of lock waits seemed high for our environment.
We reviewed the contents of the db2diag.log for more information, but found no error messages that warranted attention.
We decided to analyze the TradeQuoteBean EJB which obtains stock quotes in the Resource Analyzer. With the monitoring level set at high, we monitored the Resource Analyzer for a while during the peak period and observed an unusually high value for the Num Stores field as highlighted in Figure 5-61.
Note: We installed freeware from http://www.gnu.org to enable us to issue UNIX related commands in the Windows environment.
Attention: In our controlled environment, these number are relatively high. In a real world environment, the administrator will have to determine their own thresholds for investigation.
Chapter 5. Problem determination scenarios 287
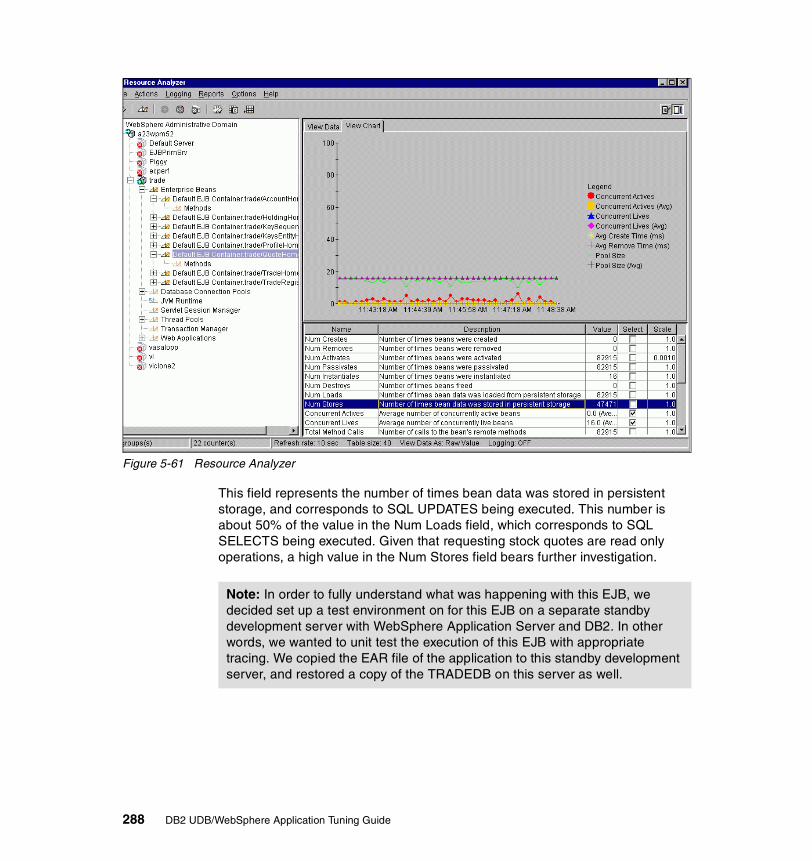
Figure 5-61 Resource Analyzer
This field represents the number of times bean data was stored in persistent storage, and corresponds to SQL UPDATES being executed. This number is about 50% of the value in the Num Loads field, which corresponds to SQL SELECTS being executed. Given that requesting stock quotes are read only operations, a high value in the Num Stores field bears further investigation.
Note: In order to fully understand what was happening with this EJB, we decided set up a test environment on for this EJB on a separate standby development server with WebSphere Application Server and DB2. In other words, we wanted to unit test the execution of this EJB with appropriate tracing. We copied the EAR file of the application to this standby development server, and restored a copy of the TRADEDB on this server as well.
288 DB2 UDB/WebSphere Application Tuning Guide
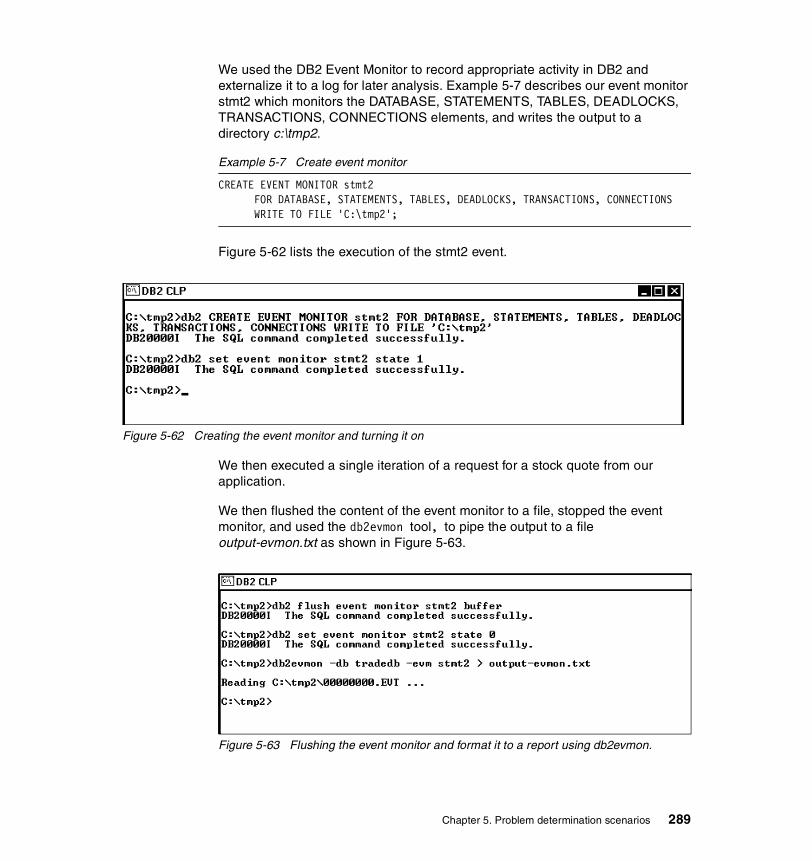
We used the DB2 Event Monitor to record appropriate activity in DB2 and externalize it to a log for later analysis. Example 5-7 describes our event monitor stmt2 which monitors the DATABASE, STATEMENTS, TABLES, DEADLOCKS, TRANSACTIONS, CONNECTIONS elements, and writes the output to a directory c:\tmp2.
Example 5-7 Create event monitor
CREATE EVENT MONITOR stmt2 FOR DATABASE, STATEMENTS, TABLES, DEADLOCKS, TRANSACTIONS, CONNECTIONS WRITE TO FILE 'C:\tmp2';
Figure 5-62 lists the execution of the stmt2 event.
Figure 5-62 Creating the event monitor and turning it on
We then executed a single iteration of a request for a stock quote from our application.
We then flushed the content of the event monitor to a file, stopped the event monitor, and used the db2evmon tool, to pipe the output to a file output-evmon.txt as shown in Figure 5-63.
Figure 5-63 Flushing the event monitor and format it to a report using db2evmon.
Chapter 5. Problem determination scenarios 289
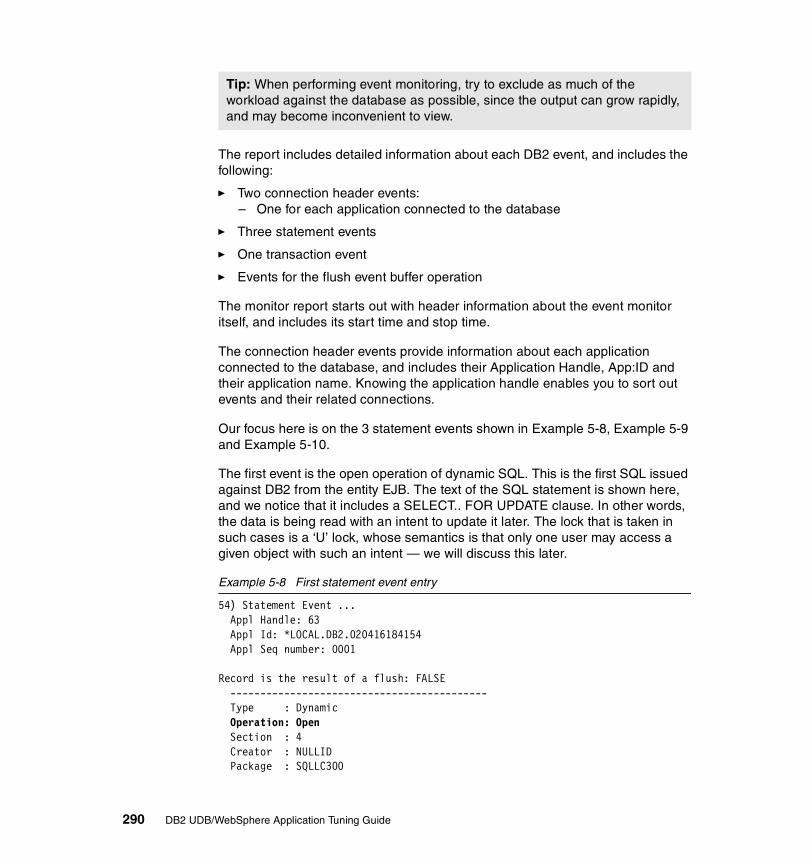
The report includes detailed information about each DB2 event, and includes the following:
� Two connection header events: – One for each application connected to the database
� Three statement events
� One transaction event
� Events for the flush event buffer operation
The monitor report starts out with header information about the event monitor itself, and includes its start time and stop time.
The connection header events provide information about each application connected to the database, and includes their Application Handle, App:ID and their application name. Knowing the application handle enables you to sort out events and their related connections.
Our focus here is on the 3 statement events shown in Example 5-8, Example 5-9 and Example 5-10.
The first event is the open operation of dynamic SQL. This is the first SQL issued against DB2 from the entity EJB. The text of the SQL statement is shown here, and we notice that it includes a SELECT.. FOR UPDATE clause. In other words, the data is being read with an intent to update it later. The lock that is taken in such cases is a ‘U’ lock, whose semantics is that only one user may access a given object with such an intent — we will discuss this later.
Example 5-8 First statement event entry
54) Statement Event ... Appl Handle: 63 Appl Id: *LOCAL.DB2.020416184154 Appl Seq number: 0001
Record is the result of a flush: FALSE ------------------------------------------- Type : Dynamic Operation: Open Section : 4 Creator : NULLID Package : SQLLC300
Tip: When performing event monitoring, try to exclude as much of the workload against the database as possible, since the output can grow rapidly, and may become inconvenient to view.
290 DB2 UDB/WebSphere Application Tuning Guide
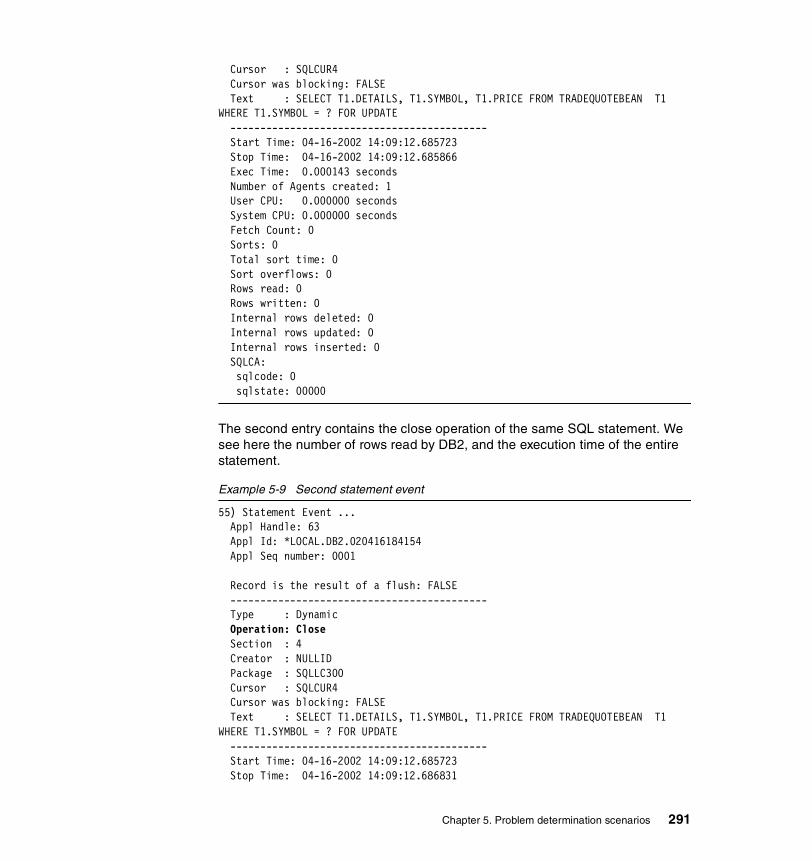
Cursor : SQLCUR4 Cursor was blocking: FALSE Text : SELECT T1.DETAILS, T1.SYMBOL, T1.PRICE FROM TRADEQUOTEBEAN T1 WHERE T1.SYMBOL = ? FOR UPDATE ------------------------------------------- Start Time: 04-16-2002 14:09:12.685723 Stop Time: 04-16-2002 14:09:12.685866 Exec Time: 0.000143 seconds Number of Agents created: 1 User CPU: 0.000000 seconds System CPU: 0.000000 seconds Fetch Count: 0 Sorts: 0 Total sort time: 0 Sort overflows: 0 Rows read: 0 Rows written: 0 Internal rows deleted: 0 Internal rows updated: 0 Internal rows inserted: 0 SQLCA: sqlcode: 0 sqlstate: 00000
The second entry contains the close operation of the same SQL statement. We see here the number of rows read by DB2, and the execution time of the entire statement.
Example 5-9 Second statement event
55) Statement Event ... Appl Handle: 63 Appl Id: *LOCAL.DB2.020416184154 Appl Seq number: 0001
Record is the result of a flush: FALSE ------------------------------------------- Type : Dynamic Operation: Close Section : 4 Creator : NULLID Package : SQLLC300 Cursor : SQLCUR4 Cursor was blocking: FALSE Text : SELECT T1.DETAILS, T1.SYMBOL, T1.PRICE FROM TRADEQUOTEBEAN T1 WHERE T1.SYMBOL = ? FOR UPDATE ------------------------------------------- Start Time: 04-16-2002 14:09:12.685723 Stop Time: 04-16-2002 14:09:12.686831
Chapter 5. Problem determination scenarios 291
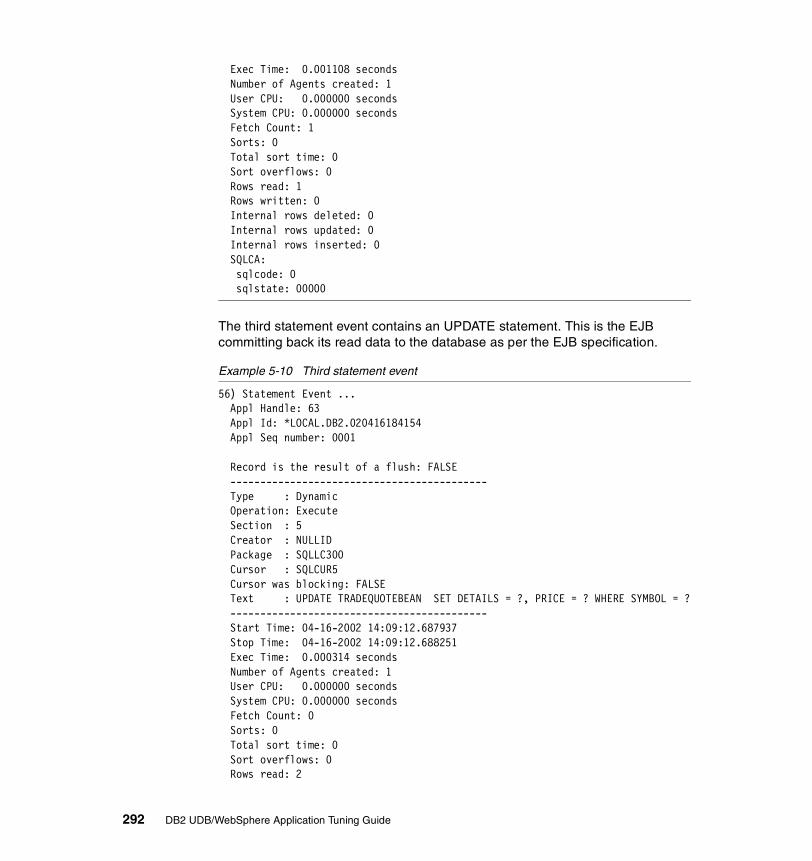
Exec Time: 0.001108 seconds Number of Agents created: 1 User CPU: 0.000000 seconds System CPU: 0.000000 seconds Fetch Count: 1 Sorts: 0 Total sort time: 0 Sort overflows: 0 Rows read: 1 Rows written: 0 Internal rows deleted: 0 Internal rows updated: 0 Internal rows inserted: 0 SQLCA: sqlcode: 0 sqlstate: 00000
The third statement event contains an UPDATE statement. This is the EJB committing back its read data to the database as per the EJB specification.
Example 5-10 Third statement event
56) Statement Event ... Appl Handle: 63 Appl Id: *LOCAL.DB2.020416184154 Appl Seq number: 0001
Record is the result of a flush: FALSE ------------------------------------------- Type : Dynamic Operation: Execute Section : 5 Creator : NULLID Package : SQLLC300 Cursor : SQLCUR5 Cursor was blocking: FALSE Text : UPDATE TRADEQUOTEBEAN SET DETAILS = ?, PRICE = ? WHERE SYMBOL = ? ------------------------------------------- Start Time: 04-16-2002 14:09:12.687937 Stop Time: 04-16-2002 14:09:12.688251 Exec Time: 0.000314 seconds Number of Agents created: 1 User CPU: 0.000000 seconds System CPU: 0.000000 seconds Fetch Count: 0 Sorts: 0 Total sort time: 0 Sort overflows: 0 Rows read: 2
292 DB2 UDB/WebSphere Application Tuning Guide

Rows written: 0 Internal rows deleted: 0 Internal rows updated: 0 Internal rows inserted: 0 SQLCA: sqlcode: 0 sqlstate: 00000
After the three Statement Events, the Transaction Event shown in Example 5-11 represents the commit. Included in this event record is the whole time span of the transaction (3.368 milliseconds), as well as the number of rows read in the whole transaction, and the maximum numbers of locks held by the application.
Example 5-11 Transaction event
57) Transaction Event ... Appl Handle: 63
Record is the result of a flush: FALSE Appl Id: *LOCAL.DB2.020416184154 Appl Seq number: 0001 Completion Status: Committed Start time: 04-16-2002 14:09:12.685723 Stop time: 04-16-2002 14:09:12.689091 Exec Time: 0.003368 seconds Previous transaction stop time: User CPU: 0.000000 seconds System CPU: 0.000000 seconds Lock wait time: 0 milliseconds Maximum number of locks held: 4 Lock escalations: 0 X lock escalations: 0 Rows Read: 3 Rows Written: 0 Log space used: 0
Root cause of the problemThe above report clearly indicates the EJB stock quote read only operation is actually executing requests for data with an intent to update followed by an actual update of the data at commit. The resulting ‘U’ lock on the appropriate stock symbol thus serializes other applications’ requests for the same stock quote, thus leading to lock waits. This phenomenon would be exacerbated in peak workload situations involving multiple user requests for stock quotes for a particular stock symbol.
To confirm our diagnosis, we needed to review the Access Intent attribute in the TradeQuoteBean Method Extensions.
Chapter 5. Problem determination scenarios 293

We used the Application Assembly Tool, and loaded the EAR file, TradeSample.Ear. We selected the EJB TradeQuoteBean, under EJB Modules -> Trade Sample EJB -> Entity Beans -> TradeQuoteBean -> Method Extensions.
In the menu of Method Extensions, we noticed that the Access Intent attribute left to default as shown in Figure 5-64. When no overall Access Intent attribute is set, the default for all methods is assumed to have an Access Intent attribute of Update.
Figure 5-64 Application Assembly Tool — method extensions
We then took a look at the separate methods within the EJB TradeQuoteBean as shown in Figure 5-65. Note that the Access Intent attribute can be set on a per method basis. The method we use in our code to obtain stock quotes is the findByPrimaryKey() method. Figure 5-65 shows that findByPrimaryKey() method does not have an Access Intent attribute set either. Here again, if the Access Intent attribute is not set, it defaults to an Update operation.
294 DB2 UDB/WebSphere Application Tuning Guide

Figure 5-65 Application Assembly Tool, browsing individual EJB methods
Apply best practicesThe resolution is fairly simple. Since we know that the TradeStockQuote is a read only operation, we need to make the EJB Server aware of it as follows:
1. We modified the application EAR file so that read only methods in the deployment descriptor have their Access Intent attribute set to Read. Figure shows the setting of the findByPrimaryKey method to be a read only method.
Chapter 5. Problem determination scenarios 295

Figure 5-66 Setting the findByPrimaryKey method to read only
2. After saving the changes to the EAR file, generate the CMP code that manages the JDBC communication to the database. Figure 5-67 shows the location of the Files tab for selecting the “Generate Code for Deployment”.
Clicking the “Generate Code for Deployment” tab, takes you to the window shown in Figure 5-68. We chose DB2 UDB as the database type, clicked the “Generate code” button to initiate the generation of the EAR file. After the generation, we exited the Application Assembly Tool.
296 DB2 UDB/WebSphere Application Tuning Guide

Figure 5-67 Tab of Generate code for the deployment
Chapter 5. Problem determination scenarios 297

Figure 5-68 Generate code for deployment
3. We then removed the old application using the WebSphere Application Server Admin Console, and deployed the newly generated application EAR file that included the changes made to the findByPrimaryKey method.
4. We then restarted the Application Server containing the new application, and reran our single stock quote on the test server with the DB2 Event Monitor to view the impact of our changes. The Statement and Transaction events section in the new Event Monitor report were as follows:
– Two statement events– One transaction event
298 DB2 UDB/WebSphere Application Tuning Guide

The changes have clearly had an impact. The first Statement Event is an Open Operation of a dynamic SQL as shown in Example 5-12, and shows that the SQL statement no longer contains the FOR UPDATE clause.
Example 5-12 First statement event
10) Statement Event ... Appl Handle: 14 Appl Id: *LOCAL.DB2.020415202235 Appl Seq number: 0001
Record is the result of a flush: FALSE ------------------------------------------- Type : Dynamic Operation: Open Section : 4 Creator : NULLID Package : SQLLC400 Cursor : SQLCUR4 Cursor was blocking: FALSE Text : SELECT T1.DETAILS, T1.SYMBOL, T1.PRICE FROM TRADEQUOTEBEAN T1 WHERE T1.SYMBOL = ? ------------------------------------------- Start Time: 04-16-2002 15:23:38.720178 Stop Time: 04-16-2002 15:23:38.720344 Exec Time: 0.000166 seconds Number of Agents created: 1 User CPU: 0.000000 seconds System CPU: 0.000000 seconds Fetch Count: 0 Sorts: 0 Total sort time: 0 Sort overflows: 0 Rows read: 0 Rows written: 0 Internal rows deleted: 0 Internal rows updated: 0 Internal rows inserted: 0 SQLCA: sqlcode: 0 sqlstate: 00000
The second Statement Event is the close operation counterpart of the open operation shown in Example 5-12, and is not shown here.
The Transaction Event is shown in Example 5-13. This shows the new execution time of the transaction to be 2.635 milliseconds, which is faster than the previous update transaction.
Chapter 5. Problem determination scenarios 299

Example 5-13 The transaction event
12) Transaction Event ... Appl Handle: 14
Record is the result of a flush: FALSE Appl Id: *LOCAL.DB2.020415202235 Appl Seq number: 0001 Completion Status: Committed Start time: 04-16-2002 15:23:38.720178 Stop time: 04-16-2002 15:23:38.722813 Exec Time: 0.002635 seconds Previous transaction stop time: 04-15-2002 13:23:38.717045 User CPU: 0.000000 seconds System CPU: 0.000000 seconds Lock wait time: 0 milliseconds Maximum number of locks held: 8 Lock escalations: 0 X lock escalations: 0 Rows Read: 1 Rows Written: 0 Log space used: 0
We then tried a stress test using akstress on the test server with 10 concurrent users requesting stock quotes without any think time between requests, and monitored the DB2 database using the DB2 Snapshot Monitor.
Figure 5-69 shows the results of the snapshot.
Figure 5-69 DB2 snapshot for locks on the database
300 DB2 UDB/WebSphere Application Tuning Guide

The lock waits are gone, since ‘U’ locks are no longer being taken by DB2. The changes can now be moved to the main Web site in a batch window when downtime is acceptable, since the operation involves stopping the WebSphere Application Server, deploying the new application, and restarting the WebSphere Application Server.
5.2.3 Non-serializable objectsThe root cause problem demonstrated here is that the application creates non-serializable session objects that cannot be persisted, thereby resulting in potential loss of data and user dissatisfaction. In our “Shopping Cart” application, we created multiple session objects, some of which were serializable while others were not serializable.
When persistent sessions were enabled for this application, the application user experienced intermittent problems with the information stored in the shopping cart. This resulted in complaints about “random” information loss in their shopping cart contents.
Description of the applicationFor the purposes of our scenario, we created a shopping cart application where a user could purchase floppies and/or books from an online store. The application recorded the purchases of the books/floppies in the shopping cart as session objects. The “book” object was created as a serializable object, while the “floppy” object was erroneously created as a non-serializable object.
Chapter 5. Problem determination scenarios 301

Figure 5-70 and Figure 5-71 show the user interface of this shopping cart application. In this application, the user can return to the online store many times — adding and removing purchases in the shopping cart over a period of time, before committing to a checkout of the purchases.
Figure 5-70 Initial screen of the shopping cart application
302 DB2 UDB/WebSphere Application Tuning Guide
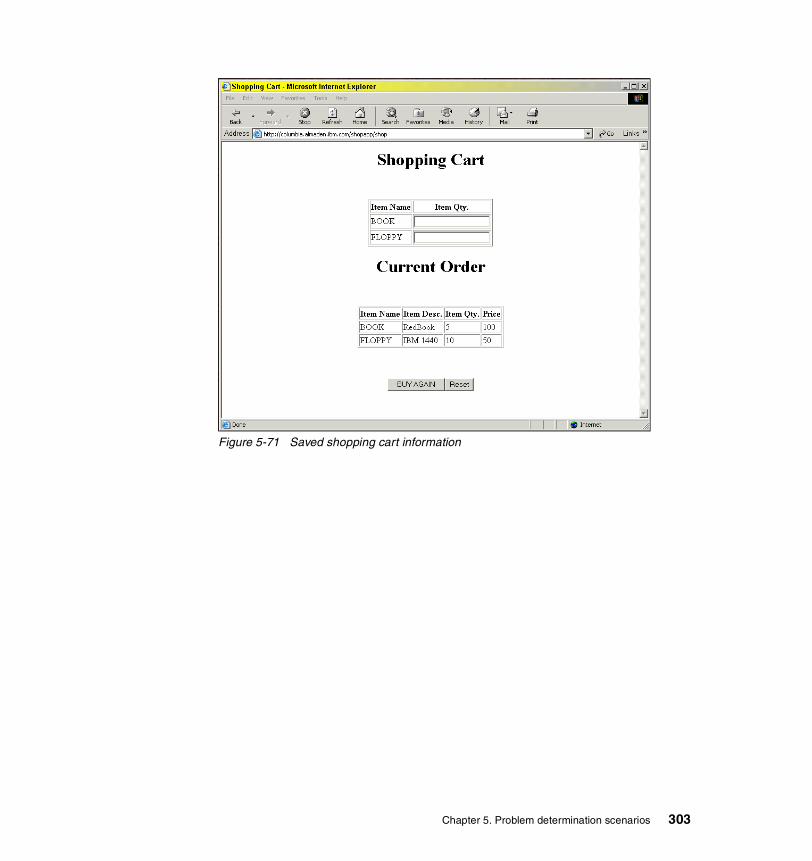
Figure 5-71 Saved shopping cart information
Chapter 5. Problem determination scenarios 303

Environment configurationFigure 5-72 shows the environment used for this scenario.
Figure 5-72 Non-serializable object scenario environment
Our WebSphere Application Server and DB2 UDB servers were installed on separate AIX machines persian and mansel respectively. We used the WebSphere Performance Tool to drive the workload.
Monitor level settingsBoth WebSphere Application Server and DB2 were installed using default configurations, and default settings were used. The relevant settings are as shown in Table 5-4.
Table 5-4 Non-serializable objects scenario monitor level settings
Hardware configuration Software configuration
Database Server (mansel) AIX 4.3.3 ML08
RS/6000 44P1 GB Memory32 GB disk
DB2 UDB ESE v8.1 Instance name: db2inst1DIAGLEVEL: 4Log name: db2diag.log and jdbcerr.logLog path: /home/db2inst1/sqllib/db2dumpDatabases: WAS40 and TRADEDB
Application Server (persian) AIX 4.3.3 ML08
Application ServerWeb Browsers
persian(Trade App Server)
Database Server
manselTRADEDB
web client(15 users)akstress
360 seconds
WAS AE 4.05IHS 1.3.19
DB2 Client 8.1
DB2 Server 8.1
WAS40
Windows 2000 RS/6000 44PAIX 4.3.3 ML08
RS/6000 44PAIX 4.3.3 ML08
304 DB2 UDB/WebSphere Application Tuning Guide

For the Session Manager service, we chose a maximum in-memory session count of 10, disabled session overflow, and set the invalidation timeout to 2 minutes. The monitoring level we chose for session management was High, the JVM was Low, and the database connection was Medium. The minimum connection pool size for the session database was 1, and the maximum was 25. We had a DB2 row size of 32K for the session database, and defined 125 buffers for this tablespace.
RS/6000 44P1 GB Memory32 GB disk
WAS AE v4.0.5Log name: tracefile and activity.logLog path: /usr/WebSphere/AppServer/logs
Application name: OnlinestoreLog name: Tradestdout.txt and Tradestderr.txtLog path: /tmp
HTTP Server v1.3.19Log name: error.log and access.logLog path: /usr/HTTPServer/logs
DB2 UDB Runtime Client v8.1
Attention: The diagnostic error capture level parameter DIAGLEVEL default value of 3 is appropriate for routine monitoring.
We chose to change this value to 4, which is the highest level of information in all our problem determination scenarios, using the commands shown in Figure 5-3. This is because the routine monitoring level does not provide us with the information required to perform proper problem diagnosis.
This is equivalent to performing exception monitoring for problem diagnosis.
Attention: We realize that the timeout value of 2 minutes and a maximum in-memory session count of 10 is probably unrealistic in the real world, but we needed to set it to these values in our scenario to artificially simulate the problem.
Hardware configuration Software configuration
Chapter 5. Problem determination scenarios 305

Workload usedThe scenario consisted a load recorded in akstress that simulated 15 users who execute the add/remove/change purchases from the shopping cart repeatedly. We assumed a maximum think time of 20 seconds between interactions of a single user. We ran this load for 6 minutes.
Triggering eventOur triggering event in this case was a number of user complaints about random loss of data in their shopping carts.
Hypotheses and their validationWe postulated each of the following hypotheses as the potential cause of the problem. Given our controlled environment, we ignored real world root cause possibilities such as network bandwidth concerns, system utilization, and process priorities.
� Hypotheses 1: Persistence not enabled � Hypotheses 2: Low invalidation timeout value or in-memory cache overflow� Hypotheses 3: Non-serializable objects
Each of these hypotheses was validated in turn. The first two hypotheses involved a lookup of the configuration settings of the Session Manager Service. The third involved an analysis of the WebSphere Application Server logs.
Hypotheses 1: Persistence not enabledWe first wanted to verify that session persistence had indeed been enabled for this application, but looking up the configuration settings of the Session Manager Service, as shown in Figure 5-73.
306 DB2 UDB/WebSphere Application Tuning Guide

Figure 5-73 Verifying Session Manager Service persistence setting
Hypotheses 2: Low Invalidation timeout value or cache overflowWe speculated on whether the shopping cart information was being lost because of a low value for the Invalidation timeout value (which would cause the session information to be discarded prematurely), or a small cache for the in-memory sessions (which would result in session objects overflowing to the overflow cache).
Figure 5-74 indicates a timeout value of 2 minutes, which is adequate for our scenario, but would probably be too small for a real world environment.
Note: We discarded this hypothesis as the potential cause of the problem.
Note: The writing of session objects to the persistent datastore is driven by the persistence policies of very high, high, medium (default), low, and manual configuration, as shown in Figure 4-11 on page 185.
Chapter 5. Problem determination scenarios 307
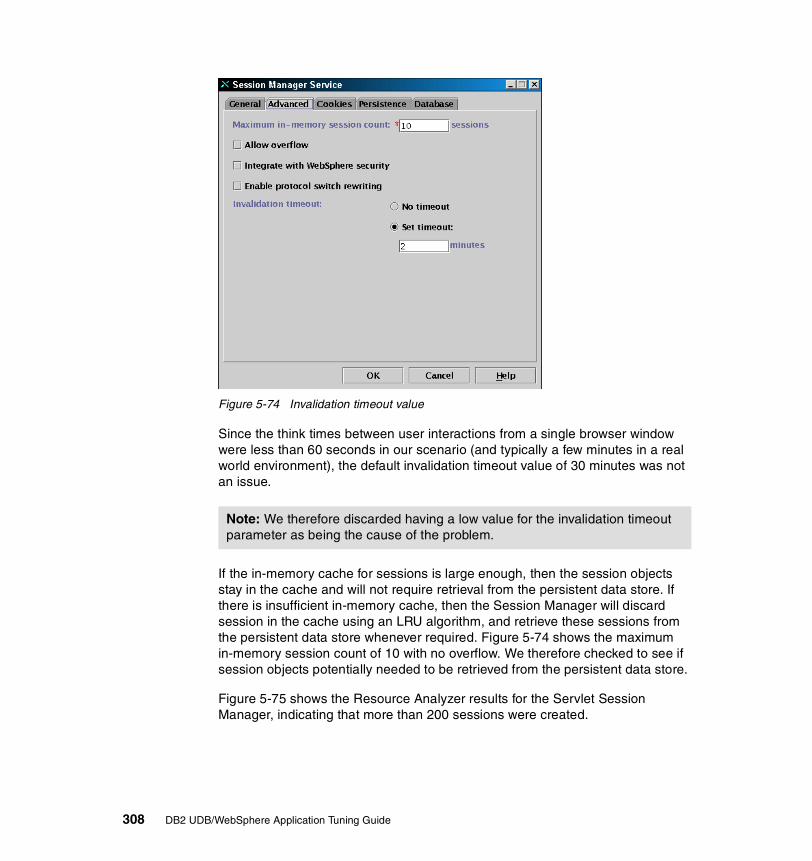
Figure 5-74 Invalidation timeout value
Since the think times between user interactions from a single browser window were less than 60 seconds in our scenario (and typically a few minutes in a real world environment), the default invalidation timeout value of 30 minutes was not an issue.
If the in-memory cache for sessions is large enough, then the session objects stay in the cache and will not require retrieval from the persistent data store. If there is insufficient in-memory cache, then the Session Manager will discard session in the cache using an LRU algorithm, and retrieve these sessions from the persistent data store whenever required. Figure 5-74 shows the maximum in-memory session count of 10 with no overflow. We therefore checked to see if session objects potentially needed to be retrieved from the persistent data store.
Figure 5-75 shows the Resource Analyzer results for the Servlet Session Manager, indicating that more than 200 sessions were created.
Note: We therefore discarded having a low value for the invalidation timeout parameter as being the cause of the problem.
308 DB2 UDB/WebSphere Application Tuning Guide

Figure 5-75 Number of sessions created
Given our rather small in-memory session cache of 10, we were assured that sessions would have been flushed out of the cache, thus potentially requiring subsequent retrieval of sessions from the persistent data store.
We therefore turned our attention to sessions in the persistent data store.
Hypotheses 3: Objects not serializedWe decided to view the WebSphere Application Server logs for any potential messages of interest. In particular, we looked at the contents of the stdout log located in /WAS_HOME/logs/Default_Server_stdout.log.
Note: This in itself is not the cause of the random information loss problem, because the session would still be in the persistent data store for retrieval and use. However, having a small in-memory cache can potentially impact performance due to the added overhead of retrieving sessions from the persistent data store.
Chapter 5. Problem determination scenarios 309

Figure 5-76 Stdout log contents showing non-serializable object
Figure 5-72 shows one of many error messages indicating that the “Floppy” object is not serialized, thereby resulting in it not being externalized to the persistent data store.
Root cause of the problemThe non-serializable nature of the “Floppy” object causes this information to be lost since this object can not be serialized to the persistent data store. When a shopping cart containing any session object is flushed from the in-memory cache, and is subsequently requested — it needs to be retrieved from the persistent data store. In the case of the “Floppy” object, this information is not available due to the non-serializable problem, resulting in information being lost. The random nature of this problem can manifest itself, in cases where the “Floppy” object is still in the in-memory cache and is available for access without having to retrieve it from the persistent data store. Depending upon the size of the in-memory cache, session activity, and the non-serializable problem, the user will most likely experience random information loss problems.
A review of the application indicated that it was written with two session objects “Book” and “Floppy”. The “Book” object was serializable, but the “Floppy” was not.
Attention: This exception is not caught by the application program, but is written to stdout.
310 DB2 UDB/WebSphere Application Tuning Guide

The question then arises as to why this problem was not caught during testing. The answer could be that it was probably not rigorously tested, but more likely that the size of the in-memory cache and amount of session activity during testing was such as to not manifest this problem.
Apply best practicesThe correct approach is to fix the application program to make the “Floppy” object serializable as recommended in 1., “Enable session persistence:” on page 196.
Until this code correction is implemented, one may consider increasing the in-memory session count and enabling overflow — assuming adequate memory is available. This should be considered a stop-gap arrangement only, until the more permanent code correction is implemented.
We ran the SessionInspect servlet against a user session that was ordering floppies. Figure 5-77 shows the error message generated by this servlet. This information is also captured in the WebSphere Application Server logs.
Attention: A servlet/jsp is available for use during development to verify that session objects being created are serializable. The servlet and its use is described in Appendix B.3, “SessionInspectServlet.jsp” on page 339.
We strongly recommend that application developers run this servlet with the sessions created to ensure that all of their objects are serialized. In this scenario, we dealt with objects being created — the application may have far more objects that are not serializable.
Chapter 5. Problem determination scenarios 311

Figure 5-77 SessionInspectServlet output
5.3 Routine monitoring scenariosAs discussed in 2.11, “Monitoring and tuning tools” on page 86, WebSphere Application Server provides a number of tools for monitoring and tuning the WebSphere Application Server environment.
The default monitoring situation is as follows:
� All logs are always enabled.� Monitoring level is none.
312 DB2 UDB/WebSphere Application Tuning Guide

We therefore recommend the following routine monitoring activities as it relates specifically to the DB2 UDB and WebSphere Application Server environment:
1. Start out with the default monitoring level of none for the production environment.
2. At periods of peak activity, choose high or maximum monitoring levels for short bursts of time to capture information about the system under stress.
3. Review information in the various logs for unusual messages.
4. Periodically gather information from sources such as the session database, and the administrative database.
Routine monitoring should at least be gathering relevant information about:
� Connection pool usage� Session database activity� JVM memory utilization
Important: While the Resource Analyzer has qualitatively identified resource counter impacts as low, medium and high, the quantitative overhead incurred for a given resource monitoring level setting will depend upon an installation’s specific configuration and application workload.
There are no published measurements of quantitative overheads for various resource monitoring level settings for any given application workload and configuration.
Therefore, the reader is strongly advised to determine the overheads associated with each monitoring level within a regression test environment that closely mirrors their production environment.
Note: Eventually, based on regression tests, application requirements and acceptable monitoring overheads, choose the most appropriate monitoring levels for your environment.
Attention: This information should then be routinely analyzed for unusual activity, or changes in the workload that may portend problems in the future. This analysis may also require adjusting the routine monitoring levels based on a thorough understanding of the overheads associated with activating a particular level for a given resource.
Chapter 5. Problem determination scenarios 313

In this section, we will be routinely monitoring the average size of a persistent session object, and then apply best practices considerations to improve its performance. The three conditions we will be considering are:
� 100K session object size with persistence� 100K session object size with local caching� 30K session object size with persistence
5.3.1 Determining average session object sizeWhen persistent sessions are enabled, sessions get written to the SESSIONS table in the session database, and depending upon the size of the session object, the data is written to either the small, medium or large columns of the table. The rows in this table get deleted based on the invalidation timeout configuration parameters discussed in 4.4, “Session database” on page 180.
Example 5-14 describes an SQL statement that lists the total number of session objects and their average size as stored in the SESSIONS table. This statement needs to be executed at different times during the day over a period of many days or weeks, in order to get a feel for the number and average size of persistent session objects within your environment.
Example 5-14 Number and average size of persistent session objects
SELECT COUNT(*), AVG(LENGTH(small)) FROM sessions WHERE small IS NOT NULLUNIONSELECT COUNT(*), AVG(LENGTH(mediunm)) FROM sessions WHERE medium IS NOT NULLUNIONSELECT COUNT(*), AVG(LENGTH(large)) FROM sessions WHERE large IS NOT NULL
Attention: Administrators should determine the specific resource categories, and desirable performance counters applicable for their particular environment.
Note: While it would be desirable to monitor non-persistent session object sizes for potential performance tuning, this information is not readily accessible from the monitoring tools available.
Note: This is a snapshot of the contents of the SESSIONS table, and this information must be collected over different intervals before taking any performance tuning action such as increasing or decreasing the DB2 row size configuration parameter discussed in “DB2 row size” on page 194.
314 DB2 UDB/WebSphere Application Tuning Guide
5.3.2 100K session object size with persistenceThe root cause problem demonstrated here is that an application is creating very large session objects that are being persisted. This is having a negative performance impact due to over utilization of memory in the WebSphere Application Server, as well as negatively impacting response times due to I/O activity on the session database.
Our measurement metric is the number of requests per second completed in the measured interval.
Description of the applicationFor the purposes of our mock routine monitoring exercise, we created an application that consistently created a fixed 100K session object that had persistence enabled in order for us to be able to determine its average size using the SQL shown in Example 5-14.
Environment configurationFigure 5-78 shows the environment used for the 100K session object size scenario.
Chapter 5. Problem determination scenarios 315

Figure 5-78 100K session object configuration
Our WebSphere Application Server and DB2 UDB servers were installed on separate AIX machines persian and mansel respectively. We used the WebSphere Performance Tool to drive the workload.
Monitor level settingsBoth WebSphere Application Server and DB2 were installed using default configurations, and default settings were used. The relevant settings are the same as used in Figure 5-2 on page 257.
We had chosen the DIAGLEVEL to be 4 in our exception monitoring scenarios, and chose to stay with it here as well. Note that the default is 3.
For the Session Manager service, we chose the default maximum in-memory session count of 1000, and the invalidation timeout of 30 minutes. The monitoring level we chose for session management was high, the JVM was low, and the database connection was medium. The minimum connection pool size for the session database was 1, and the maximum was 25. We had a DB2 row size of 32K for the session database, and defined 125 buffers for this tablespace. We had the DB2 Database Manager monitor switch DFT_MON_BUFPOOL turned on.
Application ServerWeb Browsers
persian(Trade App Server)
Database Server
manselTRADEDB
web client(5 users)akstress
30 seconds
WAS AE 4.0.2 FP2IHS 1.3.19
DB2 Client 7.2 FP6
DB2 Server 7.2 FP6
WAS40
Windows 2000 RS/6000 44PAIX 4.3.3 ML08
RS/6000 44PAIX 4.3.3 ML08
316 DB2 UDB/WebSphere Application Tuning Guide

Besides the above parameters values, we stayed with the defaults.
Workload usedThe scenario consisted a load recorded in akstress that simulates 5 users that execute our mock servlet repeatedly. We ran this load for 30 seconds. The servlet used is described in Appendix B.2, “Large session object servlet” on page 337.
Example 5-15 shows the results from the WPT as delivering a throughput of 75.77 requests per second, while Figure 5-79 shows the results from Resource Analyzer as creating 131 sessions. There were no memory exceptions.
Example 5-15 Results of 100K session object with persistence
Uptime: 0 hours 0 minutes 31 seconds Number of Clients: 5 Pages Attempted: 646 Pages To Be Attempted: 0 Pages per second: 20.84 Requests completed: 2349 Requests per second: 75.77 Failed Connections (*): 0
Figure 5-79 100K session object with persistence
Chapter 5. Problem determination scenarios 317

Triggering event Our triggering event was a mock up that simulated a regular analysis of the results of routine monitoring of persistent session object sizes over a period of time (known to be 100K and therefore not shown executing the SQL shown in Example 5-14 on page 314). Our session object analysis using Example 5-14 on page 314 showed 131 sessions being created with an object size of 100K.
Root cause of the problemAfter reviewing the application program, it appeared that the application program had chosen to store unnecessary data in the session object which was leading to the creation of large session objects.
Apply best practicesAfter reviewing the various choices to reduce session object size as described in 2 on page 197, we decided on the following course of action:
1. Initiate the process of modifying the application to reduce the session size, for implementation at a future date.
2. Disable session persistence since the application was non-critical, and loss of session data would not be a major concern.
3. Disallow overflow of in memory sessions to avoid swamping of memory due to in memory caching of these large sessions. This can lead to lost sessions which is not a major concern for our non-critical application.
We reran the workload with these changes and observed the following results. Example 5-16 shows the results from the WPT as delivering a throughput of 111.29 requests per second, which is a 48% throughput increase. Figure 5-80 shows the results from Resource Analyzer as creating 192 sessions. However, we did get 8 out of memory exceptions as shown in Figure 5-81.
Example 5-16 100K session object with no persistence
Uptime: 0 hours 0 minutes 31 seconds Number of Clients: 5 Pages Attempted: 954 Pages To Be Attempted: 0 Pages per second: 30.77 Requests completed: 3450 Requests per second: 111.29 Failed Connections (*): 0
Attention: We concluded that the number and frequency of 100K persistent session object sizes would have an adverse performance impact, and could perhaps be tuned to achieve better performance.
318 DB2 UDB/WebSphere Application Tuning Guide

Figure 5-80 100K session object – no persistence – no overflow
Figure 5-81 100K session object – no persistence – memory exceptions
Chapter 5. Problem determination scenarios 319

The occurrence of memory exceptions indicates loss of sessions, which we were willing to accept to achieve better throughput for out given application environment.
Clearly, the disabling of session persistence had a significant impact on our throughput.
5.3.3 100K session object size with local cachingThe root cause problem demonstrated here is that of another business application that is creating very large session objects that are not being persisted because of the non-critical nature of the application. However, an increase in the workload is causing out of memory exceptions that are negatively impacting the performance of other applications in the WebSphere Application Server JVM due to over utilization of memory.
Our measurement metric is the number of requests per second completed in the measured interval, plus the median response times.
Description of the applicationFor the purposes of our mock routine monitoring exercise, we created an application that consistently created a fixed 100K session object that had local caching with overflow enabled. We used the same servlet as described in Appendix B.2, “Large session object servlet” on page 337.
Environment configurationWe used the same configuration as shown in Figure 5-78 except for a change in the workload to 25 concurrent users over a 30 second interval.
Monitor level settingsThe same settings were used as in the previous example, except that we allowed session overflow.
Workload usedThe scenario consisted a load recorded in akstress that simulates 25 users that execute our mock servlet repeatedly. We ran this load for 30 seconds.
Example 5-17 shows the results from the WPT as delivering a throughput of 101.91 requests per second, while Figure 5-82 shows the results from Resource Analyzer as creating 183 sessions.
320 DB2 UDB/WebSphere Application Tuning Guide

Example 5-17 100K session object – local caching with overflow
Uptime: 0 hours 0 minutes 32 seconds Number of Clients: 25 Pages Attempted: 882 Pages To Be Attempted: 0 Pages per second: 27.56 Requests completed: 3261 Requests per second: 101.91 Failed Connections (*): 0
The median response times for this run for are shown in Example 5-18, which is obtained from the WebSphere Performance Tools.
Example 5-18 100K session object – local caching with overflow – response times
Page statistics for page page0 Successes: 183 Min time (milliseconds): 60 Max time (milliseconds): 6008 Mean time (milliseconds): 780
Page statistics for page page1 Successes: 183 Min time (milliseconds): 120 Max time (milliseconds): 10835 Mean time (milliseconds): 1152
Page statistics for page page2 Successes: 177 Min time (milliseconds): 110 Max time (milliseconds): 9423 Mean time (milliseconds): 760
Page statistics for page page3 Successes: 172 Min time (milliseconds): 50 Max time (milliseconds): 10155 Mean time (milliseconds): 734
Page statistics for page page4 Successes: 167 Min time (milliseconds): 40 Max time (milliseconds): 10064 Mean time (milliseconds): 940
Chapter 5. Problem determination scenarios 321

Figure 5-82 100K session object – local caching with overflow
Triggering event Our triggering event was a mock up that simulated a regular analysis of the results of routine monitoring of persistent session object sizes over a period of time (known to be 100K and therefore not shown executing the SQL shown in Example 5-14 on page 314), and the monitoring of memory exceptions. Our session object analysis using Example 5-14 on page 314 showed 183 sessions being created with an object size of 100K, and 16 occurrences of memory exceptions, which we deemed excessive in our mock exercise.
Root cause of the problemAfter reviewing the application program, it appeared that the application program had chosen to store unnecessary data in the session object which was leading to the creation of large session objects, and the overflow of sessions to secondary cache was causing memory overutilization.
322 DB2 UDB/WebSphere Application Tuning Guide
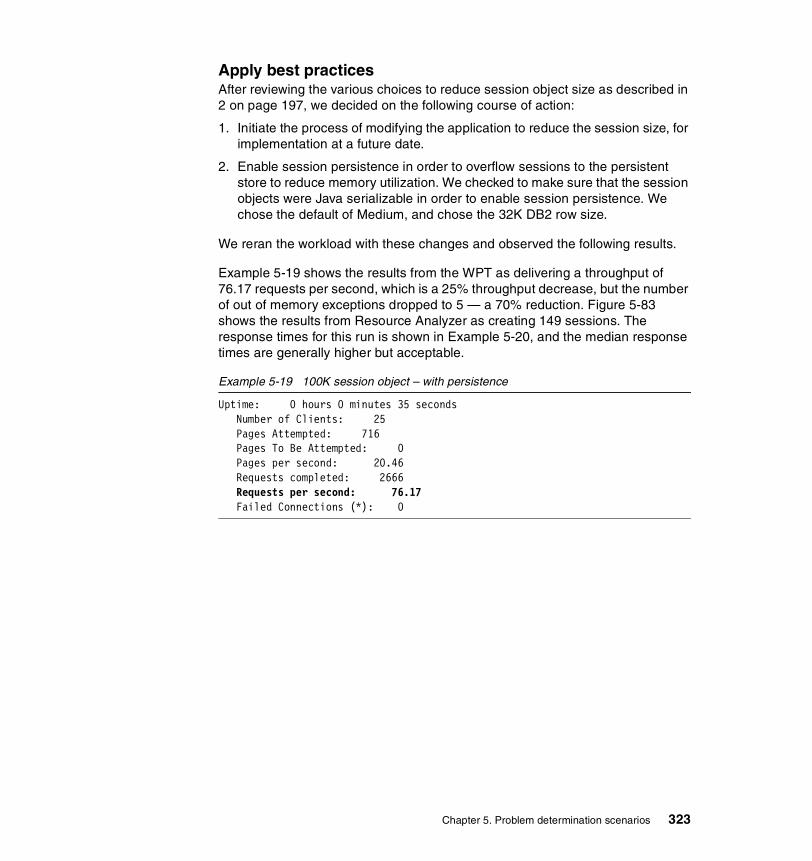
Apply best practicesAfter reviewing the various choices to reduce session object size as described in 2 on page 197, we decided on the following course of action:
1. Initiate the process of modifying the application to reduce the session size, for implementation at a future date.
2. Enable session persistence in order to overflow sessions to the persistent store to reduce memory utilization. We checked to make sure that the session objects were Java serializable in order to enable session persistence. We chose the default of Medium, and chose the 32K DB2 row size.
We reran the workload with these changes and observed the following results.
Example 5-19 shows the results from the WPT as delivering a throughput of 76.17 requests per second, which is a 25% throughput decrease, but the number of out of memory exceptions dropped to 5 — a 70% reduction. Figure 5-83 shows the results from Resource Analyzer as creating 149 sessions. The response times for this run is shown in Example 5-20, and the median response times are generally higher but acceptable.
Example 5-19 100K session object – with persistence
Uptime: 0 hours 0 minutes 35 seconds Number of Clients: 25 Pages Attempted: 716 Pages To Be Attempted: 0 Pages per second: 20.46 Requests completed: 2666 Requests per second: 76.17 Failed Connections (*): 0
Chapter 5. Problem determination scenarios 323

Figure 5-83 100K session object with persistence
Example 5-20 100K session object – with persistence – response times
Page statistics for page page0 Successes: 150 Min time (milliseconds): 60 Max time (milliseconds): 5498 Mean time (milliseconds): 603
Page statistics for page page1 Successes: 150 Min time (milliseconds): 201 Max time (milliseconds): 7140 Mean time (milliseconds): 1617
Page statistics for page page2 Successes: 146 Min time (milliseconds): 230 Max time (milliseconds): 4877 Mean time (milliseconds): 1316
Page statistics for page page3 Successes: 139
324 DB2 UDB/WebSphere Application Tuning Guide

Min time (milliseconds): 250 Max time (milliseconds): 7121 Mean time (milliseconds): 1158
Page statistics for page page4 Successes: 131 Min time (milliseconds): 231 Max time (milliseconds): 4847 Mean time (milliseconds): 994
While session persistence has a negative impact on throughput and response times, it has a positive impact on memory utilization.
5.3.4 30K session object sizeThe root cause problem demonstrated here is that of another application creating large session objects that are persisted for business reasons (loss of sessions being unacceptable). This is having a negative performance impact due to over utilization of memory in the WebSphere Application Server, as well as negatively impacting response times due to I/O activity on the session database. The servlet used is described in Appendix B.2, “Large session object servlet” on page 337, except that this time it creates a session object of size 30K.
Our measurement metric was the number of requests per second completed in the measured interval.
Description of the applicationFor the purposes of our mock routine monitoring exercise, we created an application that consistently created a fixed 30K session object that had persistence enabled in order for us to be able to determine its average size using the SQL shown in Example 5-14.
Environment configurationWe used the same environment configuration as the one used for the 100K session object, that is, Figure 5-78. Here again, we used the WebSphere Performance Tool to drive the workload.
Monitor level settingsAgain, we used the same settings as used with the 100K session object size.
Note: We allocated a separate 4K buffer pool of 1000 buffers for the SESSIONS tablespace, and used the default DB2 row size of 4K
Chapter 5. Problem determination scenarios 325

Workload usedOur scenario again consisted a load recorded in akstress that simulates 3 users that execute our 30K session object mock servlet repeatedly. We ran this load for 30 seconds.
Example 5-21 shows the results from the WPT as delivering a throughput of 45.97 requests per second, while Figure 5-84 shows the results from Resource Analyzer as creating 286 sessions. Example 5-22 shows the buffer pool statistics for the SESSIONS tablespace. There were no out of memory exceptions.
Example 5-21 30K session object with persistence – 4KDB2 row size
Uptime: 0 hours 0 minutes 31 seconds Number of Clients: 3 Pages Attempted: 1425 Pages To Be Attempted: 0 Pages per second: 45.97 Requests completed: 1425 Requests per second: 45.97 Failed Connections (*): 0
Figure 5-84 30K session object with persistence – 4KDB2 row size
326 DB2 UDB/WebSphere Application Tuning Guide
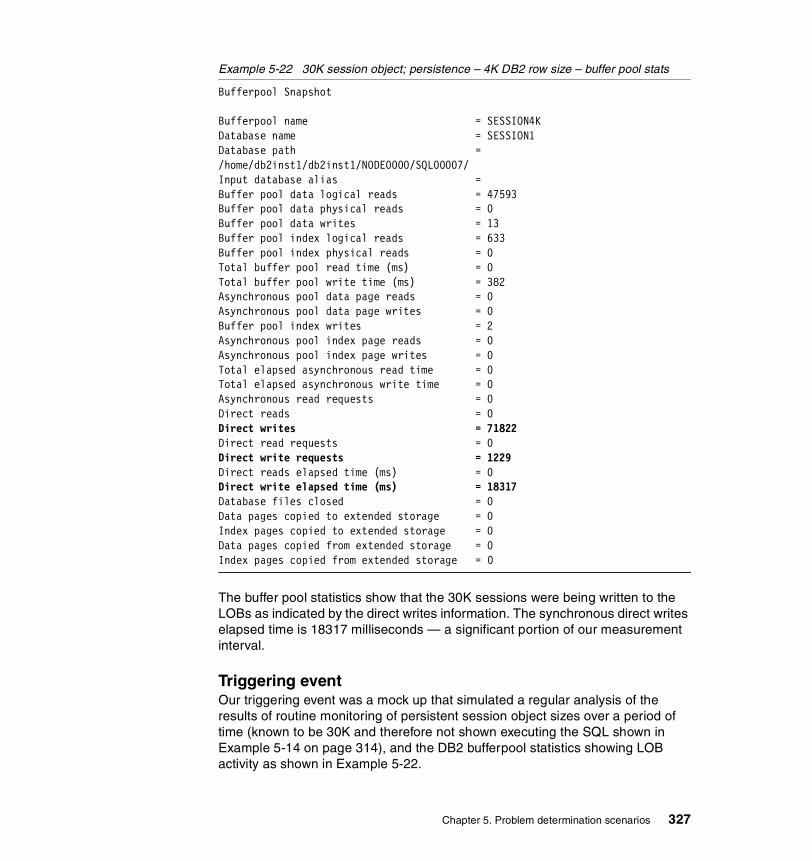
Example 5-22 30K session object; persistence – 4K DB2 row size – buffer pool stats
Bufferpool Snapshot
Bufferpool name = SESSION4KDatabase name = SESSION1Database path = /home/db2inst1/db2inst1/NODE0000/SQL00007/Input database alias =Buffer pool data logical reads = 47593Buffer pool data physical reads = 0Buffer pool data writes = 13Buffer pool index logical reads = 633Buffer pool index physical reads = 0Total buffer pool read time (ms) = 0Total buffer pool write time (ms) = 382Asynchronous pool data page reads = 0Asynchronous pool data page writes = 0Buffer pool index writes = 2Asynchronous pool index page reads = 0Asynchronous pool index page writes = 0Total elapsed asynchronous read time = 0Total elapsed asynchronous write time = 0Asynchronous read requests = 0Direct reads = 0Direct writes = 71822Direct read requests = 0Direct write requests = 1229Direct reads elapsed time (ms) = 0Direct write elapsed time (ms) = 18317Database files closed = 0Data pages copied to extended storage = 0Index pages copied to extended storage = 0Data pages copied from extended storage = 0Index pages copied from extended storage = 0
The buffer pool statistics show that the 30K sessions were being written to the LOBs as indicated by the direct writes information. The synchronous direct writes elapsed time is 18317 milliseconds — a significant portion of our measurement interval.
Triggering event Our triggering event was a mock up that simulated a regular analysis of the results of routine monitoring of persistent session object sizes over a period of time (known to be 30K and therefore not shown executing the SQL shown in Example 5-14 on page 314), and the DB2 bufferpool statistics showing LOB activity as shown in Example 5-22.
Chapter 5. Problem determination scenarios 327

Root cause of the problemAfter reviewing the application program, we determined that the application program had been written reasonably efficiently, but that some savings of session object size could be achieved using the techniques described in 2 on page 197. However, these savings would still result in session objects of over 20K.
Apply best practicesAfter reviewing the various choices to reduce session object size as described in 2 on page 197, we decided on the following course of action:
1. Initiate the process of modifying the application to reduce the session size, for implementation at a future date.
2. Could not disable session persistence because of the critical nature of the application, where loss of session data would create significant customer dissatisfaction and complaints.
3. Increase the DB2 row size from 4K to 32K in order to exploit the greater efficiencies of storing the session objects in the small column of the SESSIONS table rather than in the medium column, as described in “DB2 row size” on page 194.
We reran the workload with these changes, and observed the following results.
Example 5-23 shows the results from the WPT as delivering a throughput of 55.35 requests per second, while Figure 5-85 shows the results from Resource Analyzer as creating 266 sessions. Example 5-24 shows the buffer pool statistics for the SESSIONS tablespace. There were no out-of-memory exceptions.
Attention: We concluded that the number and frequency of 30K persistent session object sizes, and the LOB activity would have an adverse performance impact, and could perhaps be tuned to achieve better performance.
Note: We created a 32K buffer pool of 125 buffers instead of the 1000 4K buffer pool in order to measure benefits under similar system configurations.
328 DB2 UDB/WebSphere Application Tuning Guide
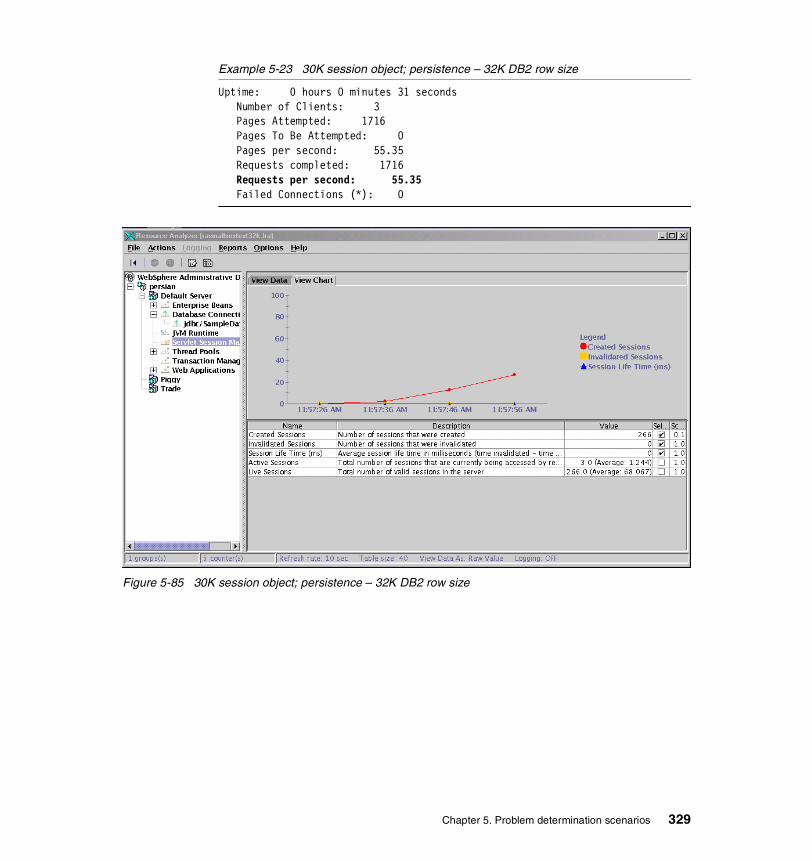
Example 5-23 30K session object; persistence – 32K DB2 row size
Uptime: 0 hours 0 minutes 31 seconds Number of Clients: 3 Pages Attempted: 1716 Pages To Be Attempted: 0 Pages per second: 55.35 Requests completed: 1716 Requests per second: 55.35 Failed Connections (*): 0
Figure 5-85 30K session object; persistence – 32K DB2 row size
Chapter 5. Problem determination scenarios 329
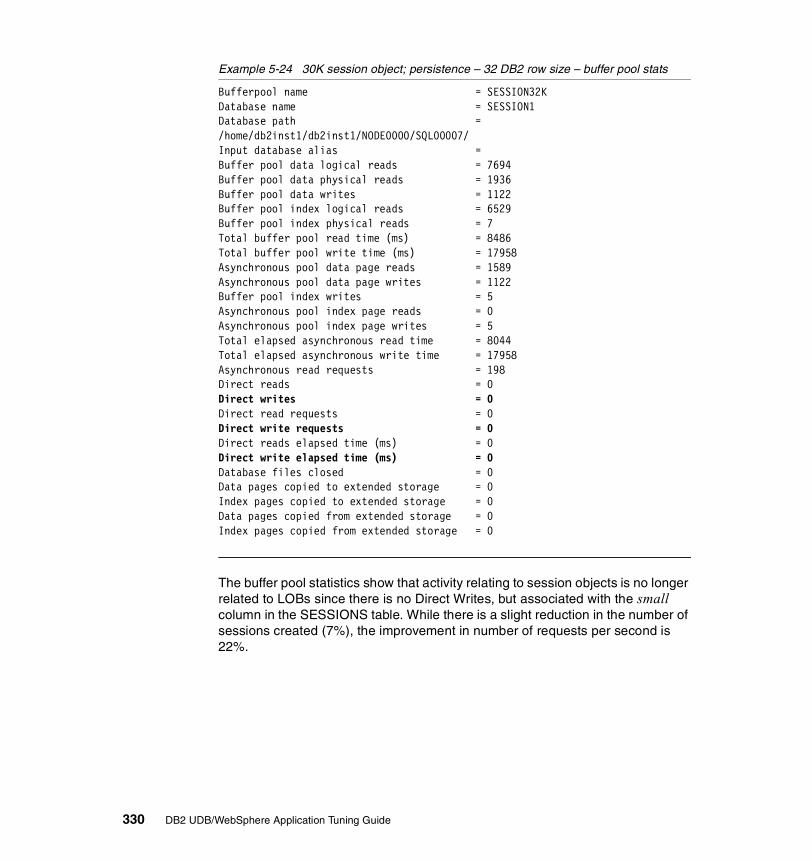
Example 5-24 30K session object; persistence – 32 DB2 row size – buffer pool stats
Bufferpool name = SESSION32KDatabase name = SESSION1Database path = /home/db2inst1/db2inst1/NODE0000/SQL00007/Input database alias =Buffer pool data logical reads = 7694Buffer pool data physical reads = 1936Buffer pool data writes = 1122Buffer pool index logical reads = 6529Buffer pool index physical reads = 7Total buffer pool read time (ms) = 8486Total buffer pool write time (ms) = 17958Asynchronous pool data page reads = 1589Asynchronous pool data page writes = 1122Buffer pool index writes = 5Asynchronous pool index page reads = 0Asynchronous pool index page writes = 5Total elapsed asynchronous read time = 8044Total elapsed asynchronous write time = 17958Asynchronous read requests = 198Direct reads = 0Direct writes = 0Direct read requests = 0Direct write requests = 0Direct reads elapsed time (ms) = 0Direct write elapsed time (ms) = 0Database files closed = 0Data pages copied to extended storage = 0Index pages copied to extended storage = 0Data pages copied from extended storage = 0Index pages copied from extended storage = 0
The buffer pool statistics show that activity relating to session objects is no longer related to LOBs since there is no Direct Writes, but associated with the small column in the SESSIONS table. While there is a slight reduction in the number of sessions created (7%), the improvement in number of requests per second is 22%.
330 DB2 UDB/WebSphere Application Tuning Guide

Appendix A. Sample applications
In this appendix we describe the Trade 2 application, the Piggy Bank application, and the Web Performance Tools used in the problem determination scenarios.
A
© Copyright IBM Corp. 2003 331

A.1 Trade 2 applicationThe Trade 2 benchmark, also called the WebSphere Performance Benchmark Sample, has been developed by IBM and is publicly available. This application models an online brokerage firm providing Web based services such as login, buy, sell, get quote and more. Figure 5-86 shows the various application components and model-view-controller topology.
The Trade 2 application is a collection of Java™ classes, Java Servlets, Java Server Pages and Enterprise Java Beans (EJBs) that service requests made by registered users. This application runs as a single java process which is managed by WebSphere Application Server.
This workload exercises the entire solution stack that consists of the WebSphere Application Server, JVM, and the Just-In-Time (JIT) compiler, the HTTP server, the DB2 Database Server and the DB2 client, the AIX operating system, and the system hardware.
Figure 5-86 Trade 2 application
Further details about this application including sample code can be obtained from http://www-3.ibm.com/software/webservers/appserv/wpbs_download.html.
EJBPersistence
TradeDatabase
TradeservletsTrade
servletsTrade
servletsTrade
servletsTrade
servlets
TradeservletsTrade
servletsTrade
servletsTrade
servletsTradeJSPs
HTTPClient E
JBA
cces
sB
ean
s
Trad
eS
essi
on
Bea
ns
ProfileCMP
HoldingCMP
AccountCMP
RegisterCMP
QuoteCMP
Session EntityTrade EJBs
332 DB2 UDB/WebSphere Application Tuning Guide

A.2 PiggyBank applicationThe PiggyBank application is a very simple banking application that was designed as a sample application in the development of the WebSphere Version 4 Application Development Handbook, SG24-6134. The source code for the multiple versions of the application and other supporting files such as Ant build scripts and Rose models are included in the Web material that supports this book.
The high-level architecture of the PiggyBank application is illustrated in Figure 5-87, showing two types of application clients sharing the same back-end business logic and data.
Figure 5-87 PiggyBank high-level application architecture
All of the application business logic is implemented as Enterprise JavaBeans (EJBs). The EJBs store persistent application data, such as account and customer information, in the database. Rather than make direct JDBC calls to persist data, the application uses container-managed persistent (CMP) entity EJBs, leaving the task to the WebSphere EJB container.
Both client channels communicate with the EJBs using RMI over IIOP—the standalone client communicates with the EJBs directly, whereas the Web client uses HTTP to connect to servlets that make RMI calls on behalf of the client, and display the results using Java ServerPages (JSPs).
The only logic implemented locally in the clients is basic validation and conversation management specific to the channel. The application implements the model-view-controller (MVC) architecture — each client channel implements its own view and controller, but shares the same model.
Browser Database Server
EJBServerIIOP
Database
JDBCWeb
Application IIOPHTTP
Servlets & JSPs
Standalone Client IIOP
Appendix A. Sample applications 333

A.3 WebSphere Performance Tools (WPT) WPT (formerly AKtools) is a set of applications allowing a user to test a Web server, a Web site, and/or a Web application.
Version 1.9 of WPT consists of two applications:
� akstress is a high-performance, simple, threaded HTTP engine which is capable of simulating hundreds or even thousands of HTTP clients, using a highly configurable set of directives in a human readable and easily modified configuration file.
� akrecord is a simple eavesdropping proxy that will record a user's session against a Web server for later playback in akstress.
When the two applications are combined, it becomes very easy to quickly build an akstress configuration, which, with minor tuning, allows a user to evaluate the usability of a server, site, or Web application.
akstress is built on the code from server other internal IBM stress test tools. Those tools have been used for the last several years for things like HTTP/1.1 verification testing, large Web site stress analysis, HTTP Server SVT testing, and Web server unit testing efforts.
The following is a list of some of the available functions in this tool:
� Fully configurable HTTP headers� SSL support� Support for HTTP/1.1 functions, including persistent connections and
chunked-transfer encoding.� Built-in cookie cache (for session testing)� Result verification� Full logging� Overall and request-level statistics� Simple to use, no requirement for third party interpreters, etc.� Socks support for recording and replay
Further details can be obtained from:http://www.alphaworks.ibm.com/tech/wptools.
Attention: This product is currently available as an IBM internal use only tool.
Attention: It is important to note that WPT is not a replacement for some of the high-end Web stress tools. It was created to be either a “quick and dirty” testing tool, or used in environments where the purchase of high-end tools is prohibitive.
334 DB2 UDB/WebSphere Application Tuning Guide
Appendix B. Sample scripts
In this appendix we list some of the sample code used in the problem determination scenarios.
B
© Copyright IBM Corp. 2003 335

B.1 Connection close servlet This is the servlet used in the problem determination scenario “Case 3: Poor coding techniques with connection pooling” on page 241 dealing with this topic.
Example 5-25 TestServlet – connection close problem
import javax.servlet.http.*;import java.io.*;import java.util.*;import java.sql.*;import javax.sql.*;import javax.naming.*;import javax.servlet.*;
public class TestServlet extends HttpServlet{
public void doGet(HttpServletRequest request,HttpServletResponse response) throws ServletException,IOException {
PrintWriter out=response.getWriter();Connection con=null;
try
{
con = getConnection();Statement stmt=con.createStatement();ResultSet rset=stmt.executeQuery("select * from tradeaccountbean");while(rset.next()){
out.println(rset.getString(1));}
}catch(Exception e){
out.println(e);}
finally {
try {//con.close();} catch (Exception e) {}
}}
The highlighted line of code “//con.close():” was commented out to create the problem of a program not closing the connection.
336 DB2 UDB/WebSphere Application Tuning Guide
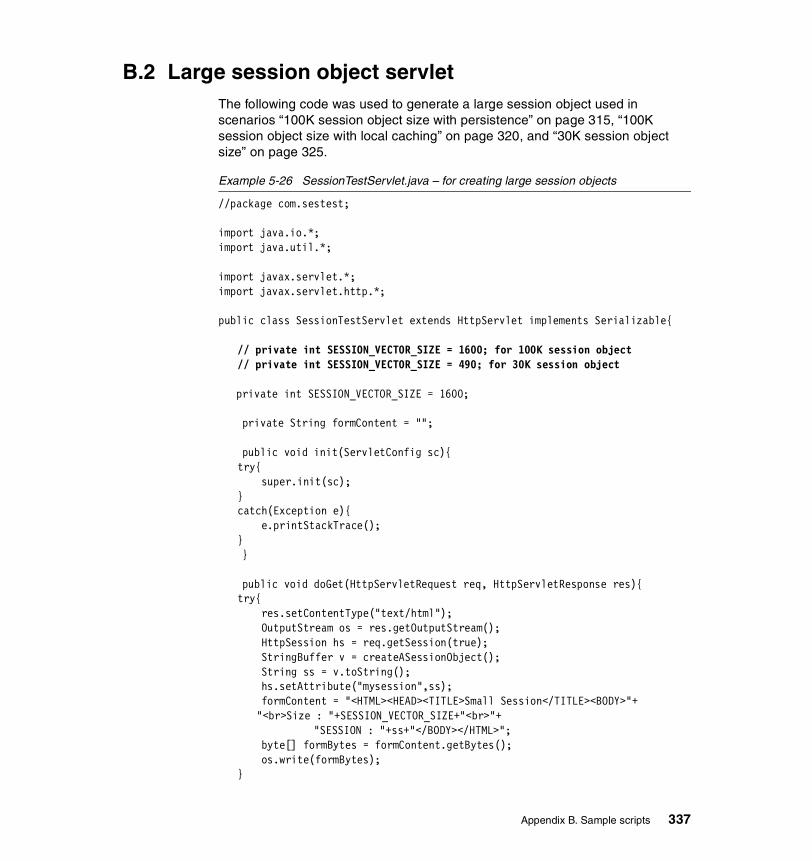
B.2 Large session object servlet The following code was used to generate a large session object used in scenarios “100K session object size with persistence” on page 315, “100K session object size with local caching” on page 320, and “30K session object size” on page 325.
Example 5-26 SessionTestServlet.java – for creating large session objects
//package com.sestest;
import java.io.*;import java.util.*;
import javax.servlet.*;import javax.servlet.http.*;
public class SessionTestServlet extends HttpServlet implements Serializable{
// private int SESSION_VECTOR_SIZE = 1600; for 100K session object// private int SESSION_VECTOR_SIZE = 490; for 30K session object
private int SESSION_VECTOR_SIZE = 1600;
private String formContent = "";
public void init(ServletConfig sc){try{ super.init(sc);}catch(Exception e){ e.printStackTrace();}
}
public void doGet(HttpServletRequest req, HttpServletResponse res){try{ res.setContentType("text/html"); OutputStream os = res.getOutputStream(); HttpSession hs = req.getSession(true); StringBuffer v = createASessionObject(); String ss = v.toString(); hs.setAttribute("mysession",ss); formContent = "<HTML><HEAD><TITLE>Small Session</TITLE><BODY>"+
"<br>Size : "+SESSION_VECTOR_SIZE+"<br>"+ "SESSION : "+ss+"</BODY></HTML>";
byte[] formBytes = formContent.getBytes(); os.write(formBytes);}
Appendix B. Sample scripts 337

catch(Exception e){ e.printStackTrace();}
}//end method doGet
private StringBuffer createASessionObject(){ String str = "International Technical Support Organization San Jose CA USA"; StringBuffer v = new StringBuffer(); for(int i=0;i<SESSION_VECTOR_SIZE;i++){ v.append(str); } return v; }//end method createASessionObject
}//end class SessionTestServlet
Choosing the appropriate SESSION_VECTOR_SIZE determines the size of the session object. A size of 1600 creates a session object of size 100K, while a size of 490 creates a session object size of 30K.
338 DB2 UDB/WebSphere Application Tuning Guide
B.3 SessionInspectServlet.jsp SessionInspectServlet described in Example 5-27 can help application developers determine if session objects they create are java.io.Serializable or not, which in turn will affect support for session persistence. SessionInspectServlet helps to:
� Determine attributes present in the session.
� Find serializable and non-serializable attributes in the session.
� Determine the size of each serializable attribute in the session.
� Determine whether a session attribute is implemented properly or not; that is, if the session attribute, and all of its internals, are serializable or not.
SessionInspectServlet serializes and deserializes session attributes in memory to simulate session persistence, so that application developers need not enable session persistence to run this servlet.
The following steps describe the process for using SessionInspectServlet:
1. Create and compile servlet.
2. Drop the servlet classes into your webapp's web-inf/classes folder.
3. Define a servlet/uri entry in web.xml for class SessionInspectServlet. If serve by class is enabled for your webapp, then servlet/uri definition is not needed.
4. Start your Web module.
5. Open a browser and access your Web module from the browser, and navigate the application in the browser so that session gets populated.
6. Open a new browser using CTRL+N, and access the SessionInspectServlet in the new browser window. This will display the current content of the session. You can access SessionInspectServlet as you navigate your application, and determine the contents of the session along the way. Any non-serializable problems will be alerted as shown in Figure 5-77 on page 312.
Appendix B. Sample scripts 339

Example 5-27 SessionInspectServlet.jsp
<%@ page import="java.io.*,java.util.*,javax.servlet.*,javax.servlet.http.*" session="false" %>
<% response.setHeader("Pragma", "No-cache"); response.setHeader("Cache-Control", "no-cache"); response.setDateHeader("Expires",0);
HttpSession session = request.getSession(false); if (session == null) {
out.println("No session"); } else {
dump(request, response); } %> <%! public void dump(HttpServletRequest request, HttpServletResponse response) throws ServletException, IOException { HttpSession sess = request.getSession(); PrintWriter out = response.getWriter(); out.println("<HTML><BODY>"); out.println("<b>Session object details:</b>"); out.println(" <br>Creation time :" + new java.util.Date(sess.getCreationTime())); out.println(" <br>Max inactive time :" + sess.getMaxInactiveInterval());
Enumeration enum = sess.getAttributeNames(); ArrayList nonser = new ArrayList(); ArrayList ser = new ArrayList(); HashMap errors = new HashMap(); HashMap sizes = new HashMap(); if(enum.hasMoreElements()) { while(enum.hasMoreElements()) { String key = (String) enum.nextElement(); Object value = sess.getAttribute(key); if(value instanceof Serializable) { Object error = verifySerialization(key, value, sizes); ser.add(key); if(error != null) { errors.put(key, error); } } else { nonser.add(key); } } displayContent(out, nonser, ser, errors, sizes);
340 DB2 UDB/WebSphere Application Tuning Guide

} else { out.println("<br><br>Currently there are no attributes present in session"); } out.println("</BODY></HTML>");
}
void displayContent( PrintWriter out, ArrayList nonser, ArrayList ser, HashMap errors, HashMap sizes) { out.println("<br><br><b> Non Serializable attributes in session (attribute names): </b>"); Iterator iter = nonser.iterator(); int count = 0; while(iter.hasNext()) { count++; String key = (String) iter.next(); out.println("<br> "+count+") " + key); }
out.println("<br><br><b>Serializable attributes in session (attribute names and their sizes in bytes):</b> "); count = 0; iter = ser.iterator(); long totalSize = 0; while(iter.hasNext()) { count++; String key = (String) iter.next(); if(errors.containsKey(key)) out.println( "<br>" +count+") " + key + "<A HREF=\"#"+key+"\"><font COLOR=\"#0000FF\">(Error serializing/deserializing the object, see below for details)</font></A>"); else { long currSize = ((Long)sizes.get(key)).longValue(); out.println("<br> "+count+") "+ key+"----------------"+currSize); totalSize+=currSize; } } if(totalSize != 0) out.println("<br> Total Size of all serializable attributes = "+totalSize);
Appendix B. Sample scripts 341

if(errors.size() > 0) { out.println("<br><br><br><b>Errors serializing/deserializing attributes:</b>"); iter = errors.keySet().iterator(); while(iter.hasNext()) { String key = (String) iter.next(); out.println("<br><b><A NAME=\""+key+"\">Attribute name= "+key+"</A></b>"); SerializationErrorDesc desc = (SerializationErrorDesc) errors.get(key); out.println("<br>"+desc.message+"</br>"); desc.th.printStackTrace(out); } } else { out.println("<br><br><b>No errors serializing/deserializing attributes currently present in session</b>"); }
}
public SerializationErrorDesc verifySerialization(String key, Object obj, HashMap sizes) { byte[] data = null; try { ObjectOutputStream oos = null; ByteArrayOutputStream baos = null;
// serialize session (app data only) into byte array buffer baos = new ByteArrayOutputStream(); oos = new ObjectOutputStream(baos); oos.writeObject(obj); oos.flush();
data = baos.toByteArray(); sizes.put(key,new Long(data.length)); } catch(Throwable th) { return new SerializationErrorDesc( th, key, "Error serializing the attribute:"); }
try { ByteArrayInputStream bais = new ByteArrayInputStream(data); BufferedInputStream bis = new BufferedInputStream(bais);
342 DB2 UDB/WebSphere Application Tuning Guide

ObjectInputStream ois = new MyObjectInputStream(Thread.currentThread().getContextClassLoader(),bis); Object tmp = ois.readObject(); } catch(Throwable th) { return new SerializationErrorDesc( th, key, "Error de-serializing the attribute:"); } return null; }
class MyObjectInputStream extends java.io.ObjectInputStream { ClassLoader cl = null; MyObjectInputStream(ClassLoader cl, java.io.InputStream in) throws IOException{ super(in); this.cl=cl; }
protected Class resolveClass(ObjectStreamClass osc) throws IOException, ClassNotFoundException{ try { return Class.forName(osc.getName()); } catch(ClassNotFoundException cnfe) { } return cl.loadClass(osc.getName()); } }
class SerializationErrorDesc { Throwable th = null; String attr = null; String message = null; SerializationErrorDesc(Throwable th, String attr, String message) { this.th = th; this.attr = attr; this.message = message; }
}%>
Appendix B. Sample scripts 343

344 DB2 UDB/WebSphere Application Tuning Guide

acronyms
AAT Application Assembly Tool
AE Advanced Edition
APIs Application Programming Interfaces
BMP Bean Managed Persistence
CMP Container Managed Persistence
DB2 UDB IBM DB2 Universal Database
DD Deployment Descriptor
EJB Enterprise Java Beans
EAR Enterprise Archive
HTML HyperText Markup Language
HTTP HyperText Transfer Protocol
IBM International Business Machines
ITSO International Technical Support Organization
J2C J2EE Connector
J2EE Java 2 Platform Enterprise Edition
JAR Java Archive
JCA Java Connector Architecture
JDK Java Development Kit
JMS Java Message Service
JDBC Java Database Connectivity
JNDI Java Naming and Directory Interface
JSP Java Server Pages
JTA Java Transaction API
JTS Java Transaction Service
LDAP Lightweight Directory Access Protocol
MIME Multi-Purpose Internet Mail Extensions
Abbreviations and
© Copyright IBM Corp. 2003
ORB Object Request Broker
OSE Open Servlet Engine
PKI Public_key Infrastructure
RDBMS Relational Database Management System
RMI Remote Method Invocation
SSL Secure Sockets Layer
URL Uniform Resource Locator
WAR Web Archive
WAS WebSphere Application Server
XML Extensible Markup Language
345

346 DB2 UDB/WebSphere Application Tuning Guide

Related publications
The publications listed in this section are considered particularly suitable for a more detailed discussion of the topics covered in this redbook.
IBM RedbooksFor information on ordering these publications, see “How to get IBM Redbooks” on page 349.
� IBM WebSphere V4.0 Advanced Edition Handbook, SG24-6176
� WebSphere Version 4 Application Development Handbook, SG24-6134
� WebSphere Scalability: WLM and Clustering using WebSphere Application Server Advanced, SG24-6153
� DB2 UDB e-business Guide, SG24-6539
� IBM DB2 UDB V7.1 Performance Tuning Guide, SG24-6012
Other resourcesThese publications are also relevant as further information sources:
� DB2 UDB Administration Guide: Planning, SC09-4822
� DB2 UDB Administration Guide: Implementation, SC09-4820
� DB2 UDB Administration Guide: Performance, SC09-4821
� DB2 UDB Call Level Interface Guide and Reference Volume 1, SC09-4849
� DB2 UDB Call Level Interface Guide and Reference Volume 2, SC09-4850
� DB2 UDB SQL Reference Volume 1, SC09-4844
� DB2 UDB SQL Reference Volume 2, SC09-4845
� Willy Chiu, Design for Scalability - An Update, IBM, 2001http://www7b.boulder.ibm.com/wsdd/library/techarticles/hvws/scalability.html
� Gennaro Cuomo, IBM WebSphere Application Server 4.0 Performance Tuning Methodology, IBM 2002http://www.ibm.com/software/webservers/appserv/doc/v40/ws_40_tuning.pdf
� Harvey W. Gunther, WebSphere Application Server Development Best Practices for Performance and Scalability, IBM 2000http://www.ibm.com/software/webservers/appserv/ws_bestpractices.pdf
© Copyright IBM Corp. 2003 347
� Deb Ericson, Shawn Lauzon, Melissa Modjeski, WebSphere Connection Pooling, IBM 2001http://www.ibm.com/software/webservers/appserv/whitepapers/connection_pool.pdf
� RP Baartman, IBM WebSphere Application Server 4.0: Tuning WebSphere, Out-of-the-Box to Best Throughput, IBM 2001
� Rahul Kitchlu and Peter He, Session Persistence - Improving Performance Using WebSphere and DB2 UDB, IBM 2002http://www7b.software.ibm.com/dmdd/library/techarticle/0203kitchlu/0203kitchlu.html
� Yongli An, Tsz Kin Tony Lau, Peter Shum, A Scalability Study for WebSphere Application Server and DB2 UDB, IBM 2001http://www7b.boulder.ibm.com/dmdd/library/techarticle/0202an/0202an.pdf
� Yongli An, Peter Shum, DB2 Tuning tips for OLTP applications, IBM 2001http://www7b.software.ibm.com/dmdd/library/techarticle/anshum/0107anshum.html
� Grant Hutchison, DB2 WAS Integration, IBM 2002http://www.websphere-users.ca/presentations/hutchison.PDF
� Grant Hutchison, DB2 and WebSphere at Light Speed, IDUG presentation 2002
� David Draeger, Best Practices using HTTP Sessions, June 2002
� C. M. Saracco, Leveraging DBMS Stored Procedures through Enterprise JavaBeans, TR 03.723, IBM, August 2000
Referenced Web sitesThese Web sites are also relevant as further information sources:
� http://www.ibm.com/software/data/db2/udbIBM DB2 Universal Database
� http://www.ibm.com/software/webservers/appservIBM WebSphere Application Server
� http://www.ibm.com/software/webservers/appserv/infocenter.htmlIBM WebSphere InfoCenter
� http://www.ibm.com/websphereIBM WebSphere Software Platform
� http://www.ibm.com/websphere/developer/zones/hvwsIBM High Volume Web Site Team
� http://java.sun.com/j2eeSun’s Java 2 Platform, Enterprise Edition site
� http://java.sun.com/products/Sun’s Java Technology Products and APIs site
348 DB2 UDB/WebSphere Application Tuning Guide348 DB2 UDB/WebSphere Application Tuning Guide

How to get IBM RedbooksSearch for additional Redbooks or redpieces, view, download, or order hardcopy from the Redbooks Web site:
ibm.com/redbooks
Also download additional materials (code samples or diskette/CD-ROM images) from this Redbooks site.
Redpieces are Redbooks in progress; not all Redbooks become redpieces and sometimes just a few chapters will be published this way. The intent is to get the information out much quicker than the formal publishing process allows.
IBM Redbooks collectionsRedbooks are also available on CD-ROMs. Click the CD-ROMs button on the Redbooks Web site for information about all the CD-ROMs offered, as well as updates and formats.
Related publications 349

350 DB2 UDB/WebSphere Application Tuning Guide350 DB2 UDB/WebSphere Application Tuning Guide

Index
Symbols.ear 210.jar 210.war 210
Numerics100K session object size with local caching 320100K session object size with persistence 31530K session object size 32564-bit 129
AAAT 79Access Intent 59, 214, 216access intent 83ACTIVATE DATABASE command 136Active 37administrative domain 26Administrative interfaces 27Administrative repository 27administrative repository 26Administrative server 27Advanced Edition 16Agent Private Memory 126AGENT_STACK_SZ 129alias 25Allow overflow 181ALTER BUFFERPOOL 137APP_CTL_HEAP_SZ 128APPLHEAPSZ 129application flow 34Application Global Memory 126Application related best practices 196Application servers 19ASLHEAPSZ 129AUDIT_BUF_SZ 127auto reloads 78Avoid creating HttpSessions in the JSP by default 201
Bbean instance 62
© Copyright IBM Corp. 2003
Best practices 161, 178, 195BMP 83, 212buffer pool 136buffer pool hit ratio 137BUFFPAGE 128, 137Business Intelligence 3Business to business 7
CCall By Reference 60Call-by-Reference 84Call-by-Value 84Choose persistence options 199Clients 18
Browser-based 18Java 18
cloned environment 33Clones 22
Horizontal clones 23Vertical clones 23
clones 21, 33closed 37CLUSTER 112clustered environment 32CMP 83, 212column data types 109compaction 74concurrency 115Concurrency issues 251Configuration parameter mismatch 222Connection close servlet 336Connection pool 148connection pool 72–73
Always close objects 164Application related best practices 162Avoid using different user names and passwords 163Best practices 161Cache JNDI lookups 162configuring for a datasource 152Connection Timeout 167connection timeout 153ConnectionWaitTimeoutException 160
351

Disable AutoConnection Cleanup 169Disable AutoConnection cleanup 154Do not close connections in a finalize method 165Do not declare connection objects as instance variables 163Do not declare connections as static objects 163Do not manage data access in CMP beans 164DoesNotExist 156existing connection reused 156Idle Timeout 168idle timeout 153InFreePool state 157InUse state 156lifecycle 154maximum pool 153Maximum Pool Size 167Minimum Pool Size 166minimum pool size 152new connection 156Obtain and close the connection in the same method 165Open one connection at a time 164Orphan Timeout 168orphan timeout 153StaleConnectionException 160state change 155Statement cache size 169statement cache size 154System related best practices 165Use connection sharing 163valid states 155WebSphere exceptions 159
connection pool example 150connection pool statistics 165Cookies 29–30cookies 33CREATE BUFFERPOOL 137CRON 45Customer Relationship Management 2Customer self-service 7
DData placement 136data placement 106Data source connection pool 42Database Configuration Parameter
AGENT_STACK_SZ 129APP_CTL_HEAP_SZ 128APPLHEAPSZ 129ASLHEAPSZ 129BUFFPAGE 128, 137DBHEAP 128DRDA_HEAP_SZ 129ESTORE_SEG_SZ 128LOCKLIST 128NUM_ESTORE_SEGS 128PCKCACHESZ 128QUERY_HEAP_SZ 129RQRIOBLK 129SORTHEAP 129STAT_HEAP_SZ 129STMTHEAP 129UDF_MEM_SZ 129UTIL_HEAP_SZ 128
database configuration parameter
MAXAPPLS 126DLCHKTIME 105NUM_IOCLEANERS 105NUM_IOSERVERS 104PCKCACHESZ 136
Database Global Memory 125Database Manager Configuration Parameter
AUDIT_BUF_SZ 127FCM_NUM_ANCHORS 127FCM_NUM_BUFFERS 127FCM_NUM_CONNECT 127FCM_NUM_RQB 127MAXAGENTS 126MON_HEAP_SZ 127
database manager configuration parameter
INTRA_PARALLEL 133MAX_COORDAGENTS 101–102, 134MAX_LOGICAGENTS 100MAXAGENTS 134MAXAPPLS 101MAXCAGENTS 100–101MAXLOCKS 135
Database Manager Shared Memory 125Database Shared Memory 125datasource 36, 44, 50, 95datasource configuration panel 151Datasource queuing 72datasources 20, 56
352 DB2 UDB/WebSphere Application Tuning Guide

DB configuration 134DB2 agents 99DB2 Registry Variable
DB2MEMDISCLAIM 126DB2MEMMAXFREE 126
DB2 row size 194, 208DB2 snapshot for locks on the database 300DB2 Snapshot Monitor 137db2admin.log 140db2loggr 105DB2MEMDISCLAIM 126DB2MEMMAXFREE 126db2pclnr 104db2pfchr 103DBHEAP 128deadlock 105deadlock detector 105deadlocks 83, 122Default Server 20default_host 25DEFERREDPREPARE 171deployment descriptor 20, 210Determining average session object size 314dirty pages 104DNS 25DoesNotExist 156downstream 65DRDA_HEAP_SZ 129dynamic caching 170–171Dynamic SQL 114
EEAR 33e-business 4e-business application considerations 11e-business applications 17e-business imperatives 2e-business infrastructure 8e-commerce 2efficient SQL 113EJB 36, 59, 79EJB Access Intent 281EJB and DB2 isolation levels 82EJB container 21, 24, 36, 39, 69EJB container queuing 69EJB entity beans 53EJB homes 54EJB module 21
EJB modules 20EJB overview 209EJB performance considerations 216EJB requests 24EJB types 211EJBs 19, 59Embedded HTTP server 19Enable session persistence 196End of servlet service 186enterprise bean 21enterprise beans 21Enterprise Java Beans 209Enterprise Resource Planning (ERP) 3Entity EJBs 212ESTORE_SEG_SZ 128Exception events scenarios 219external HTTP server 78
FFCM_NUM_ANCHORS 127FCM_NUM_BUFFERS 127FCM_NUM_CONNECT 127FCM_NUM_RQB 127firewalls 91fragment caching 85fragmentation 74, 77
Ggarbage collection 50, 74–75, 94GenPluginCfg 19global dynamic statement cache 171global statement cache 170Growable flag 67
HHigh Volume Web Site 4Horizontal clones 12Horizontal scaling 23HTML 28HTTP server plug-in 78HttpSession 44, 46
removeAttribute 188setAttribute 188
HttpSession interface 34HttpSession invalidation 46HttpSession timeouts 184
Index 353

IIBM Application Framework for e-business 9IBM HTTP Server 31IIOP 26, 39indexes 111Init method 50in-memory cache overflow 306In-memory cache overflow algorithm 181instance variable 63Internal HTTP Transport 78invalidated sessions 191Invalidation timeout 183invalidation timeout 305–307Isolation level 216isolation level 59, 81, 119, 134, 213–214
JJ2EE 14, 36, 85, 197
Compatibility test suite 14Reference Implementation software 14
J2EE application 20J2EE Connectors 209J2EE containers and components 210J2EE SDK 15J2SE 15JAR 21Java administrative console 26Java applets 18Java Message Service 209Java RMI/IIOP 18Java servlet specification 34Java Transaction API (JTA) 162java.io.Serializable 63Java-enabled browsers 18JavaServer Pages (JSP) 209JDBC 15, 45, 65, 161JDBC connection pooling 55JDBC connections 56JDBC resources 58JMS 15JNDI 15, 35, 54, 56, 162JSP 28, 85JSP considerations 47JSPs 19JTA 162, 193JTA- 163JVM 19, 23, 33, 94, 96JVM memory considerations 74
JVM memory usage 75JVMPI 94JVMPI profiler 75
KKey business processes 3Knowledge management 3
Llarge object graphs 44Large session object servlet 337load balancing 21, 32local session cache 180lock contention 123lock conversion 121lock escalation 121, 134lock type compatibility 120LOCKLIST 128LOCKSIZE 111Log Analyzer 93Logs 91
Activity 92Administrative server 91Application server 91WebSphere plug-in trace 92
logs 105
MManual update 187Max Connections setting 37MAXAGENTS 126MaxClients 38MAXLOCKS 121, 134MaxPoolThreads 38memory leaks 76memory utilization 124MON_HEAP_SZ 127Multiple buffer pools 139multi-row sessions 195
NNo Local Copies 60node 26non-serializable objects 301, 310normalization 108NUM_ESTORE_SEGS 128
354 DB2 UDB/WebSphere Application Tuning Guide

OOnline shopping 6Online Trading 7ORB 36, 39–41, 69, 95ORB properties 95OSE Remote 19over utilizing objects 76
Ppage cleaners 104parameter markers 170, 179PCKCACHESZ 128, 177–178Performance monitoring servlet 91Performance tuner wizard 95persistent sessions 63, 301PiggyBank
architecture 333PiggyBank application 219, 333PiggyBank high-level application architecture 333pkg_cache_num_overflows 178pkg_cache_size_top 178plugin-cfg.xml 19PMI 86PoolThreadLimit 38Poor coding techniques with connection pooling 241port number 25prefetchers 103prepared statement 170Prepared statement cache 42, 169prepared statement cache 73Prepared Statement Cache example 173Prepared statements in DB2 177PreparedStatement object 172–173primary key 111Problem Determination Scenarios 217
100K session object size with local caching 320100K session object size with persistence 31530K session object size 325Concurrency issues 251Configuration parameter mismatch 222Connection pool size 222EJB Access Intent 281EJB isolation mismatch, DB config parameters, etc. 251Poor coding techniques with connection pooling 241problem determination methodology 220
Small connection pool size 238Publish and subscribe 6
Qquery optimization 113query rewrite 113QUERY_HEAP_SZ 129queue 36queues
open 37
RRead committed 82Read Stability 82Redbooks Web site 349
Contact us xxiRelease HttpSessions when finished 198remote call 53REORGCHK command 139Repeatable read 82Resource Analyzer 87
Percent Maxed 41RMI/IIOP 69ROI 2Routine monitoring scenarios 312RQRIOBLK 129runstats 123
SSample applications 331Sample Scripts 335Serializable 82, 214serializable 63, 197, 323Server affinity 30, 32server affinity 29Server groups 21server groups 21Servlet 49servlet 48Servlet 2.2 specification 33, 187Servlet engine 20servlet instance variable 48Servlet Redirector 19Servlet requests 24Servlets 28, 209servlets 20, 56, 85Session Affinity 32
Index 355

session affinity 188session cache 188, 192Session clustering 32session database cleanup schedule 191Session EJBs 211session ID 33session identifier 29session invalidation time 192Session management 29
Invalidating sessionsCleanup schedule 184Programmatically 183Timeout 183
Last access time 186Overflow cache 181
Full overflow cache 202Performance considerations
Clones 202Database I/O 203Database tuning 207Memory 202Session cache size 201Session object size 197Session timeout 206
PersistentEnabling persistent sessions 184Multi-row schemas 195Multi-row schemas pros/cons 199, 205Serializable requirements 183, 195Single-row schemas 195Single-row schemas pros/cons 199, 205Single-row to multi-row migration 195When to use persistent sessions 182Write contents 188Write frequency 186
session management 30, 44Allow overflow 181Application related best practices 196Avoid creating HttpSessions in the JSP by de-fault 201Best practices 195Choose persistence options 199Enable session persistence 196Release HttpSessions when finished 198System related best practices 201Tune multi-row persistent session management 204
session managerSessionReaperInterval 183
Session Manager Service - Persistence 185session object size 314session objects 63session overflow 305session persistence 306Session tracking mechanisms 30SessionInspect 311SessionReaperInterval 183SessionTestServlet.java 337shared memory 99shopping cart 301Single buffer pool 139SingleThreadModel 47SMP 23SORTHEAP 129SSL 29, 31SSL session identifier 33SSL session identifiers 29, 31SSLV3TIMEOUT 31Stage 1 predicate 113Stage 1 predicates 113STAT_HEAP_SZ 129state information 29stateful 29, 32, 61stateful session EJB 212stateless 29stateless session EJB 211statement cache
Application related best practices 179autocommit ON 175autocommit=false 176Best practices 178buffer hit ratio 177Deferred Prepare 174Non-zero statement cache size 174PrepStmt Cache Discards 174System related best practices 179WAS prepared statement cache vis-a-vis DB2 global cache 179Zero statement cache size 175
Statement Cache Size 174statement handles 170Static SQL 114stderr 52stdout 52STMTHEAP 129stream 35String concatenation 50Supply chain 2
356 DB2 UDB/WebSphere Application Tuning Guide

synchronization 48, 59System.err 52System.out 52System.out.println 52
Ttable design 108table locks 111tablespaces 109
DMS 109SMS 110
TestServlet 336thread pool 70Thread pool size 40threads 68ThreadsPerChild 38Time based 187Topology selection criteria 11Traces 92Trade 2 219Trade 2 application 332transient 63transient variable 63Tuning WAS 43
UUDF_MEM_SZ 129unique index 111upstream 65URL encoding/rewriting 29–30URL rewriting 33User Defined Data Types 109UTIL_HEAP_SZ 128
VVertical clones 11Virtual Hosts 25
WWaiting 37WAR 20WAS Admin Console 38WAS Queuing Network 65Web administrative console 26Web container 19–20, 24, 33, 38–39, 66, 70, 95web container 35Web container queuing 67
Web module 20Web modules 21Web Server 18Web server plug-in 19–20Web server queue 65Web site classification 5web.xml 20WebSphere Admin Console 40WebSphere administration repository 219WebSphere administrative model 26WebSphere application model 28WebSphere Performance Benchmark Sample 332WebSphere Performance Tools 334WebSphere plug-in 32, 35, 78WebSphere Queuing Network 36–37WebSphere Session Manager 33WebSphere session manager 30WLM 21, 24, 32, 78Workgroup collaboration 3Workload management 24Write contents 188Write contents vs. Write frequency 190Write frequency 186write-ahead logging 105
XXML 85, 94
Index 357

358 DB2 UDB/WebSphere Application Tuning Guide
(0.5” spine)0.475”<
->0.875”250 <
-> 459 pages
DB2 UDB/WebSphere Perform
ance Tuning Guide


®
SG24-6417-01 ISBN 0738429406
INTERNATIONAL TECHNICALSUPPORTORGANIZATION
BUILDING TECHNICALINFORMATION BASED ONPRACTICAL EXPERIENCE
IBM Redbooks are developed by the IBM International Technical Support Organization. Experts from IBM, Customers and Partners from around the world create timely technical information based on realistic scenarios. Specific recommendations are provided to help you implement IT solutions more effectively in your environment.
For more information:ibm.com/redbooks
DB2 UDB/WebSpherePerformance Tuning Guide
Overview of DB2 UDB and WebSphere Application Server architectures
Best practices in tuning a DB2 UDB / WebSphere environment
Problem determination scenarios
This IBM Redbook deals with tuning a DB2 UDB / WebSphere Application Server environment, and is aimed at a target audience of DB2 UDB application developers and database administrators (DBAs).
We provide an overview of WebSphere Application Server architecture and its main components, and introduce some of its key application tuning and system tuning parameters. Then we continue with an overview of DB2 UDB architecture and components, and introduce its key application and system tuning parameters.
We describe in detail the key components that impact performance in a WebSphere and DB2 UDB environment, and provide best practices guidelines for tuning such an environment.
Finally, we discuss some of the commonly encountered problems in a DB2 UDB / WebSphere environment, and describe scenarios for identifying and resolving such problems.
Back cover