dba - shelton reese - software engineersheltonreese.com/db2 performance tuning guide.doc · web...
TRANSCRIPT

DB2 UDB v9.1 Performance Tuning Guide
Author: Shelton ReeseDate: Monday, 08 May 2023Version: 1.0Email: [email protected] Website: http://www.sheltonreese.com

Table of Contents
1. Testing methodology..................................................................................................42. Database performance tuning.....................................................................................4
2.1 Runstats................................................................................................................4Updating catalog statistics......................................................................................4
2.2 Database monitoring............................................................................................7Monitoring and tuning database configuration parameters....................................8Buffer pool size......................................................................................................8Log buffer size (LOGBUFSZ).............................................................................11Application heap size (APPLHEAPSZ)...............................................................11Sort heap size (SORTHEAP) and sort heap threshold (SHEAPTHRES)............12Number of agents (MAXAGENTS, NUM_POOLAGENTS and NUM_INITAGENTS)..........................................................................................14Locks (LOCKLIST, MAXLOCKS and LOCKTIMEOUT)................................16Maximum number of active applications (MAXAPPLS)....................................19Number of asynchronous page cleaners (NUM_IOCLEANERS).......................20Number of I/O servers (NUM_IOSERVERS).....................................................21Number of commits to group (MINCOMMIT)...................................................22
2.3 Event monitoring................................................................................................252.4 Access plans.......................................................................................................25
2.4.1 Selects.........................................................................................................252.4.2 Inserts..........................................................................................................262.4.2 Deletes.........................................................................................................262.4.3 Updates........................................................................................................262.4.4 Commits......................................................................................................262.4.5 Unions.........................................................................................................272.4.6 Joins.............................................................................................................272.4.7 Indexing.......................................................................................................28
2.5 Memory..............................................................................................................292.5.1 Bufferpool...................................................................................................292.5.2 Sortheap.......................................................................................................292.5.3 Private memory...........................................................................................30
2.6 CPU....................................................................................................................302.7 Disk....................................................................................................................312.8 Logging..............................................................................................................312.9 Locking..............................................................................................................322.10 Application.......................................................................................................322.11 Sorting..............................................................................................................32
3 Server performance monitoring................................................................................333.1 Unix performance monitoring............................................................................33
AIX Disk Layout Considerations.........................................................................333.2 Windows performance tuning............................................................................34
4. Important database manager (dbm) parameters.......................................................352

4.1 Monitoring parameters.......................................................................................354.2 Authority parameters..........................................................................................354.3 Stored procedure parameters..............................................................................354.4 Parallel parameters.............................................................................................354.5 Shared memory parameters................................................................................364.7 Communication parameters...............................................................................36
5. Important database (db) parameters.........................................................................375.1 Lock parameters.................................................................................................375.2 Parallel parameters.............................................................................................375.3 Shared memory parameters................................................................................375.4 Private memory parameters................................................................................375.5 Bufferpool parameters........................................................................................385.6 Log parameters...................................................................................................38
6. DB2 v9.1 Performance enhancements.....................................................................396.1 Multidimensional clustering...............................................................................396.2 Prefetching enhancements..................................................................................396.3 Page cleaner I/O improvements.........................................................................396.4 Catalog and authorization caching on databases with multiple partitions.........396.5 Threading of Java UDFs and stored procedures................................................396.6 Connection Concentrator...................................................................................396.7 Materialized query tables...................................................................................40
Conclusion....................................................................................................................40
3

1. Testing methodology
1) Create a benchmark environment2) Run test and capture results3) Investigate4) Make small changes5) Retest
To resolve the performance issues as part of the effort to resolve the performance problems, I installed and executed seven pieces of software on the AIX servers, as follows.
db2_status.ksh –d <dbname> --> this script waits for the sampling time and then gathers all the DB2 snapshot information into the IBM snapshot tables. The script provides the following data for review:
The hit ratio for the data and index pages of every bufferpool. The hit ratio for the catalog cache. The hit ratio for the package cache. The number of sorts serviced and number of sorts rejected. The average elapsed time for each sort. The update command to update the configuration to proper settings
db2_aix_check.ksh This script reads the AIX configuration and reports on any problem that might be found with possible suggestions for fixes it also dumps all of raw db2 data for all instances (run as root) .
Some AIX housekeeping: export LIBPATH=db2instance_home_directory/sqllib/lib:/usr/lib:/libexport LANG=en_US
2. Database performance tuning
2.1 Runstats
4

Updating catalog statistics
Background
The RUNSTATS utility updates statistics in the system catalog tables to help with the query optimization process. Without these statistics, the database manager could make a decision that would adversely affect the performance of an SQL statement. The RUNSTATS utility allows you to collect statistics on the data contained in the tables, indexes, or both tables and indexes. Use the RUNSTATS utility to collect statistics based on both the table and the index data to provide accurate information to the access plan selection process in the following situations:
When a table has been loaded with data, and the appropriate indexes have been created.
When a table has been reorganized with the REORG utility. When there have been extensive updates, deletions, and insertions
that affect a table and its indexes. ("Extensive" in this case may mean that 10 to 20 percent of the table and index data has been affected.)
Before binding application programs whose performance is critical. When you want to compare new statistics with previous statistics.
Running statistics on a periodic basis enables you to discover performance problems at an early stage.
When the prefetch quantity is changed. When you have used the REDISTRIBUTE NODEGROUP utility.
When optimizing SQL queries, the decisions made by the SQL compiler are heavily influenced by the optimizer's model of the database contents. This data model is used by the optimizer to estimate the costs of alternative access paths that can be used to resolve a particular query. A key element in the data model is the set of statistics gathered about the data contained in the database and stored in the system catalog tables. This includes statistics for tables, nicknames, indexes, columns, and user-defined functions (UDFs). A change in the data statistics can result in a change in the choice of access plan selected as the most efficient method of accessing the desired data.
Examples of the statistics available which help define the data model to the optimizer include:
The number of pages in a table and the number of pages that are not empty.
The degree to which rows have been moved from their original page to other (overflow) pages.
The number of rows in a table.
5

Statistics about individual columns such as the number of distinct values in a column.
The degree of clustering of an index; that is, the extent to which the physical sequence of rows in a table follows an index.
Statistics about the index such as the number of index levels and the number of leaf pages in each index.
The number of occurrences of frequently used column values. The distribution of column values across the range of values present in
the column. Cost estimates for user-defined functions (UDFs) in this case you don’t
have them.
RUNSTATS can help you determine how performance is related to changes in your database. The statistics show the data distribution within a table. When used routinely, RUNSTATS provides data about tables and indexes over a period of time, thereby allowing performance trends to be identified for your data model as it evolves over time. Rebind applications that use static SQL after using RUNSTATS so that the query optimizer can choose the best access plan given the new statistics. However, for applications using dynamic SQL (e.g. most vendor applications) rebinding is not necessary since the statement will be optimized based on the statistics at run time. When statistical information about tables is not accurate, it may cause performance problems. In a worst-case scenario, a particular SQL statement may cause DB2 to use a table scan instead of an index scan. The statistics will be updated in the db2service program included with the weekend maintenance scripts.
How to update the statistics
Statistics for objects are updated in the system catalog tables only when explicitly requested. There are several ways to update some or all of the statistics:
Using the RUNSTATS (run statistics) utility. Using LOAD, with statistics collection options specified. Coding SQL UPDATE statements that operate against a set of
predefined catalog views. Using the "reorgchk update statistics" command.
When you do not exactly know all the table names, or there are too many, the easiest way to do RUNSTATS is to use the "db2 reorgchk update statistics" command. The exact script looks like this:
#!/bin/ksh
6

for i in `db2 list db directory|grep -B 4 -i Indirect|grep name|grep Database| awk '{print $4}'`doecho 'DBname = ' $iDBname=$idb2 connect to $idb2 -x "select rtrim(TABSCHEMA) || '.' || TABNAME from syscat.tables where stats_time < (current timestamp - 7 days) and type='T'" > runstats.temp if [ "$?" -eq 1 ];then echo "No tables for database $DBname" continue fi while read line_by_line do db2 "reorgchk update statistics on table ${A}" db2 commit done < runstats.temp rm –f runstats.tempdb2rbind $DBname -l bind.logdoneecho Runstats ended at `date`
The script above does not require table names. This one command performs RUNSTATS on all tables.
Note: If you know the name of the table and to avoid having large numbers of tables that may take a long time to complete, it's preferable to do RUNSTATS on each table one at a time. The command looks like the following:
db2 -v runstats on table TAB_NAME with distribution and detailed indexes all
Checking to see if RUNSTATS has been run
First thing to check is that runstats has been done on the database.If not then you should perform a runstats when the users aren't using the system, as ittakes out locks on the tables.
One quick way to see whether RUNSTATS has been performed on your database is to query some system catalog tables. For example, as shown in the script above, you can run this command:
db2 -v "select tbname, nleaf, nlevels, stats_time from sysibm.sysindexes"
7

If RUNSTATS has not yet been run, you will see "-1" for the nleaf and nlevels columns, and a "-" for the stats_time column. These columns contain real numbers if RUNSTATS has been run, and the stats_time column will contain the timestamp when RUNSTATS ran. If you think the time shown in stats_time is too old, it's time to do runstats again. Based on the analysis for runstats attached to this document, I recommend a full runstats be done using the script provided above.
The DB2 commands such as runstats have a C API which will allow programs to access them. If you are writing your program in Java, the 2 methods are:-
1. Write a JNI encapsulation interface, so you can call the C API from Java2. Create a Java Process object and associate an operating system command with it. You can read any output using a BufferedStreamReader.
2.2 Database monitoring
Update all the monitoring switches first :-
"db2 update dbm cfg using dft_mon_bufpool on dft_mon_lock on dft_mon_uow on dft_mon_stmt on dft_mon_table on dft_mon_sort on"
To get a database snapshot: - “db2 get snapshot for db on <database>”
Since V9.1, you can now select snapshot statistics using SQL table functions. E.g. “select total_sort_time from table(snapshot_database(‘<dbname>’,-1)) dbsnap
Monitoring and tuning database configuration parameters
The following database configuration tuning steps were used in the environment to achieve reasonably good performance and at the same time enable us to avoid obvious pitfalls. Among the configuration parameters, database manager configuration parameters require a restart of the database manager, and most database configuration parameters require the application to reconnect to the database in order to have the changes take effect. The configuration parameters I recommend changing are described here:
Buffer pool size Log buffer size Application heap size Sort heap size and sort heap threshold Number of agents Locks
8
Maximum number of active applications Number of asynchronous page cleaners Number of I/O servers Number of commits to group
Buffer pool size
Background
A buffer pool is an area of storage in memory into which database pages (containing table rows or index entries) are temporarily read and changed. The purpose of the buffer pool is to improve database system performance. Data can be accessed much faster from memory than from a disk. Therefore, the fewer times the database manager needs to read from or write to a disk, the better the performance. The configuration of one or more buffer pools is the single most important tuning area, since it is here that most of the data manipulation takes place for applications connected to the database (excluding large objects and long field data).
By default, applications use the buffer pool called IBMDEFAULTBP, which is created when the database is created. The DB2 database configuration parameter BUFFPAGE controls the size of a buffer pool when the value of NPAGES is -1 for that buffer pool in the SYSCAT.BUFFERPOOLS catalog table. Otherwise the BUFFPAGE parameter is ignored, and the buffer pool is created with the number of pages specified by the NPAGES parameter.
Recommendations
For applications that only use one buffer pool , change NPAGES to -1 so that BUFFPAGE controls the size of the buffer pool. This makes it easier to update and report the buffer pool size along with other DB2 database configuration parameters.
After making sure that you can use the BUFFPAGE parameter in the database configuration to control the buffer pool size, set it to a proper value. Setting it to a reasonably large value is a safe thing based on the size of your database and the nature of your application. Usually, the default value of this parameter is very small and may not be satisfactory. Consider the following:
As a starting point, and if you have enough memory on your machine, set BUFFPAGE to 40,000 pages (160 MB), or 10% of the total memory on your machine.
9

For databases, set aside as much as memory as possible for the buffer pool while keeping the system stable. As a starting point, try 1.6 GB and then experiment with more.
How to change the parameter
Run the following script to:
1. Verify the catalog value 2. Enable the use of the database configuration parameter BUFFPAGE 3. Update the value of BUFFPAGE for all databases.
db2 -v connect to DB_NAMEdb2 -v select * from syscat.bufferpoolsdb2 -v alter bufferpool IBMDEFAULTBP size -1db2 -v connect resetdb2 -v update db cfg for dbname using BUFFPAGE bigger_valuedb2 -v terminate
Investigative steps
To determine whether the BUFFPAGE parameter is in use for buffer pool size of database, run:
db2 -v connect to DB_NAMEdb2 -v SELECT * from SYSCAT.BUFFERPOOLSdb2 -v connect resetdb2 -v terminate
Examine the results. If each buffer pool has an NPAGES value of -1, then the buffer pool size is being controlled through the BUFFPAGE parameter in the database configuration.
To determine whether the database buffer pool size is big enough, collect snapshots for the database and/or buffer pool while running the application. A script similar to the following will give you the needed information:
db2 -v update monitor switches using bufferpool ondb2 -v get monitor switchesdb2 -v reset monitor all
-- run the Java application --
./db2_status.ksh –d <DB_NAME>
db2 -v terminate
10

Make sure that you issue the "db2 -v get snapshot" before you lose your database connection. When the last application disconnects from the database, the database terminates and all snapshot statistics will be lost. To ensure there is always a connection that keeps the database up, use one of the following methods:
Maintain one separate connection in the window where you are collecting snapshots.
Use the DB2 ACTIVATE DATABASE command.
In the snapshot output, either from the database snapshot or buffer pool snapshot, look for the following "logical reads" and "physical reads" so that you can calculate the buffer pool hit ratio, which can help you tune your buffer pools:
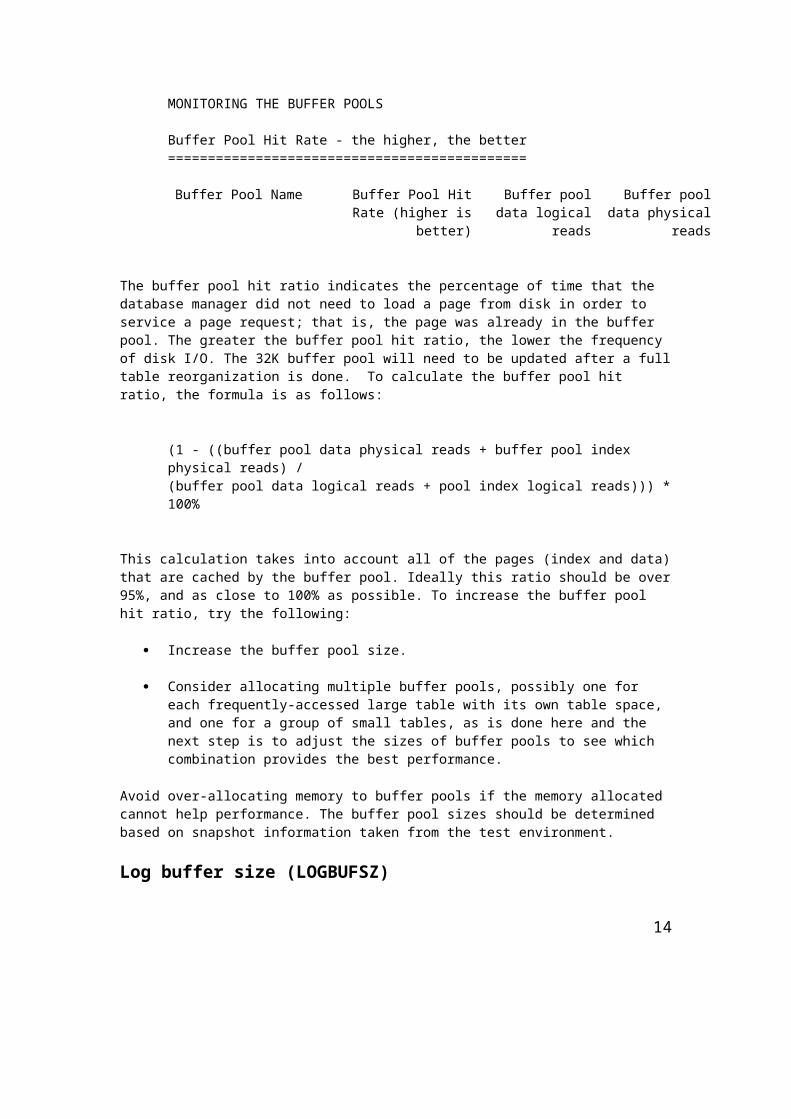
MONITORING THE BUFFER POOLS
Buffer Pool Hit Rate - the higher, the better=============================================
Buffer Pool Name Buffer Pool Hit Rate (higher is
better)
Buffer pool data logical
reads
Buffer pool data physical
reads
The buffer pool hit ratio indicates the percentage of time that the database manager did not need to load a page from disk in order to service a page request; that is, the page was already in the buffer pool. The greater the buffer pool hit ratio, the lower the frequency of disk I/O. The 32K buffer pool will need to be updated after a full table reorganization is done. To calculate the buffer pool hit ratio, the formula is as follows:
(1 - ((buffer pool data physical reads + buffer pool index physical reads) /(buffer pool data logical reads + pool index logical reads))) * 100%
This calculation takes into account all of the pages (index and data) that are cached by the buffer pool. Ideally this ratio should be over 95%, and as close to 100% as possible. To increase the buffer pool hit ratio, try the following:
Increase the buffer pool size.
Consider allocating multiple buffer pools, possibly one for each frequently-accessed large table with its own table space, and one for a group of small tables, as is done here and the next step is to adjust the sizes of buffer pools to see which combination provides the best performance.
Avoid over-allocating memory to buffer pools if the memory allocated cannot help performance. The buffer pool sizes should be determined based on snapshot information taken from the test environment.
11
Log buffer size (LOGBUFSZ)
Background
LOGBUFSZ is a database configuration parameter. It is the parameter for the log buffer. It allows you to specify the amount of database shared memory to use as a buffer for log records before writing these records to disk. The log records are written to disk when one of the following events occurs:
A transaction commits. The log buffer is full. As a result of some other internal database manager event.
Buffering the log records results in more efficient log file I/O, because the log records are written to disk less frequently and more log records are written each time. Increase the size of this buffer area if there is considerable read activity on a dedicated log disk, or if there is high disk utilization. When increasing the value of this parameter, consider the DBHEAP parameter, too, because the log buffer area uses space controlled by the DBHEAP parameter.
How to change the parameter
The default value for this parameter, is 8 (4KB pages), and that is not big enough for a large database. The optimal value for LOGBUFSZ is 128, or 256 4KB pages. For example, you can use the command below to change it:
db2 -v update database cfg for DB_NAME using LOGBUFSZ <value>db2 -v terminate
Investigative steps
Use the database snapshot to determine whether the LOGBUFSZ parameter is optimal or not by looking at the lines shown in the following example from the production server:
Log pages read = 484961Log pages written = 21963890Maximum total log space used (Bytes) = 8,024,082,185 (8 GB)
In general, the ratio between "log pages read" and "log pages written" should be as small as possible. An ideal value would be zero log pages read while seeing a good number of log pages written. When there are too many log pages read, it means a bigger LOGBUFSZ is needed. The current LOGBUFSZ is 8.
Application heap size (APPLHEAPSZ)
Background
12

APPHEAPSZ is a database configuration parameter that defines the number of private memory pages available to be used by the database manager on behalf of a specific agent or subagent. The heap is allocated when an agent or subagent is initialized for an application. The amount allocated is the minimum amount needed to process the request given to the agent or subagent. As the agent or subagent requires more heap space to process larger SQL statements, the database manager will allocate memory as needed, up to the maximum specified by this parameter.
How to change the parameter
Here is the command to change the default value 128 4KB pages to the optimal value:
db2 -v update db cfg for DB_NAME using applheapsz <new value>db2 -v terminate
Investigative steps
When your application receives an error indicating that there is not enough storage in the application heap, increase the value of APPLHEAPSZ for <1024>.
Sort heap size (SORTHEAP) and sort heap threshold (SHEAPTHRES)
Background
SORTHEAP is a database configuration parameter that defines the maximum number of private memory pages to be used for private sorts, or the maximum number of shared memory pages to be used for shared sorts. If the sort is a private sort, then this parameter affects agent private memory. If the sort is a shared sort, then this parameter affects the database shared memory. Each sort has a separate sort heap that is allocated as needed, by the database manager. This sort heap is the area where data is sorted. If directed by the optimizer, a smaller sort heap than the one specified by this parameter is allocated using information provided by the optimizer.
SHEAPTHRES is a database manager configuration parameter. Private and shared sorts use memory from two different memory sources. The size of the shared sort memory area is statically predetermined at the time of the first connection to a database based on the value of SHEAPTHRES. The size of the private sort memory area is unrestricted. The SHEAPTHRES parameter is applied differently for private and shared sorts:
For private sorts, SHEAPTHRES is an instance-wide soft limit on the total amount of memory that can be consumed by private sorts at any given time. When the total private-sort memory consumption for an instance reaches this limit, the memory allocated for additional incoming private-sort requests is considerably reduced.
For shared sorts, SHEAPTHRES is a database-wide hard limit on the total amount of memory consumed by shared sorts at any given time. When this limit is reached, no further shared-sort memory requests are allowed until the total shared-sort memory consumption falls below the limit specified by SHEAPTHRES.
13
Examples of operations that use the sort heap include hash joins and operations where the table is in memory. Explicit definition of the threshold prevents the database manager from using excessive amounts of memory for large numbers of sorts.
Recommendations
Use the database system monitor to track sort activity.
Use appropriate indexes to minimize the use of the sort heap.
When frequent large sorts are required, increase the value of SORTHEAP.
If you increase SORTHEAP, determine whether the SHEAPTHRES parameter in the database manager configuration file also needs to be adjusted.
The sort heap size is used by the optimizer in determining access paths. Consider rebinding applications (using the REBIND PACKAGE command) after changing this parameter.
Ideally, you should set the sort heap threshold (SHEAPTHRES) parameter to a reasonable multiple of the largest SORTHEAP parameter you have in your database manager instance. This parameter should be at least two times the largest SORTHEAP defined for any database within the instance. Use the DB2_STATUS.KSH script for help with this.
How to change the parameters
To change the values of SORTHEAP and SHEAPTHRES, run the following commands:
-- SORTHEAP should be changed for individual database --db2 -v update db cfg for DB_NAME using SORTHEAP a_value-- SHEAPTHRES is a database manager parameter --db2 -v update dbm cfg using SHEAPTHRES b_valuedb2 -v terminate
Investigative steps
The application should not be performing large sorts. They are too costly in terms of CPU and I/O resource. Usually, the default value for SORTHEAP size (256 4KB pages) is adequate. In fact, for high concurrency OLTP, you may want to decrease this value from the default. When further investigation is needed, you can issue the following command:
db2 -v update monitor switches using sort on
Then, let your application run for a while, and type:
db2 -v get snapshot for database on DBNAME
14

Look at the output in the following example:
Active Sorts = 3Total Sort Heap Allocated = 276Total sort time (ms) = 78818393Total Sorts = 23203178Average elapsed time per sort = 3.39 msSorts requiring merge phases = 0.17 %
i.e. started as piped sort, but required more memory than allocated.
Post Threshold Sorts = 0Piped Sorts Requested = 0Piped Sorts Accepted = 0Piped Sorts Serviced = 100.00 %
Commit statements attempted = 210927Rollback statements attempted = 905Dynamic statements attempted = 93416272Static statements attempted = 284145
From this, you can calculate the number of sorts per transaction and the percentage of sorts that overflowed the memory that was available to them.
SortsPerTransaction 109= (Total Sorts) / (Commit statements attempted + Rollback statements attempted)
PercentSortOverflow 1.4= (Sort overflows * 100 ) / (Total sorts)
Rule of thumb: If SortsPerTransaction is greater than 5, it might indicate there are too many sorts per transaction. If PercentSortOverflow is greater than 3 percent, there may be serious and unexpected large sorts occurring. When this happens, increasing SORTHEAP just hides the performance problem--it does not fix it. The true solution to this problem is to improve the access plan for problematic SQL statements by adding the correct indexes.
Number of agents (MAXAGENTS, NUM_POOLAGENTS and NUM_INITAGENTS)
Background
These are database manager configuration parameters.
The MAXAGENTS parameter indicates the maximum number of database manager agents that are available at any given time to accept application requests. The value of MAXAGENTS should be at least the sum of the values for MAXAPPLS (maximum concurrent applications) in each database to be accessed concurrently. If the number of databases is greater than the NUMDB parameter, then the safest course is to use
15

the product of NUMDB with the largest value for MAXAPPLS. Each additional agent requires some resource overhead that is allocated at the time the database manager is started.
The NUM_POOLAGENTS parameter is a guideline for how large you want the agent pool to grow. If more agents are created than is indicated by the value of this parameter, they will be terminated when they finish executing their current request, rather than be returned to the pool. If the value for this parameter is 0, agents will be created as needed, and may be terminated when they finish executing their current request.
To avoid the costs associated with the frequent creation and termination of agents in an OLTP environment in which many applications are concurrently connected, increase the value of NUM_POOLAGENTS to be closer to the value of MAXAGENTS.
The NUM_INITAGENTS parameter determines the initial number of idle agents that are created in the agent pool at DB2START time. Specifying a sizable number of initial agents, while not necessary, can accelerate the warming-up period.
Recommendations
In most cases, set MAXAGENTS and NUM_POOLAGENTS to a value that slightly exceeds the maximum expected number of concurrent application connections. This would mean over 300.
Leaving NUM_INITAGENTS as the default should be fine. We used 64 as a start.
How to change the parameter
In order to change these parameters, run the following commands:
db2 -v update dbm cfg using MAXAGENTS a_valuedb2 -v update dbm cfg using NUM_POOLAGENTS b_valuedb2 -v update dbm cfg using NUM_INITAGENTS c_valuedb2 -v terminate
Investigative steps
Anytime during a run, you can use the following command to get the snapshot data for database manager:
db2 -v get snapshot for database manager
and look for the following lines of output:
High water mark for agents registered = 125High water mark for agents waiting for a token = 0Agents registered = 114Agents waiting for a token = 0
16

Idle agents = 70
If you find that either "Agents waiting for a token" or "Agents stolen from another application" is not equal to 0, you may need to increase MAXAGENTS to allow more agents to be available to the database manager. There is no need to change the MAXAGENTS. The DB2_STATUS will guide the way.
Locks (LOCKLIST, MAXLOCKS and LOCKTIMEOUT)
Background
These lock-related controls are database configuration parameters:
LOCKLIST indicates the amount of storage that is allocated to the lock list. There is one lock list per database, and it contains the locks held by all applications concurrently connected to the database. Locking is the mechanism that the database manager uses to control concurrent access to data in the database by multiple applications. Both rows and tables can be locked. Each lock requires 32 or 64 bytes of the lock list, depending on whether or not other locks are held on the object:
o 64 bytes are required to hold a lock on an object that has no other locks held on it.
o 32 bytes are required to record a lock on an object that has an existing lock held on it.
MAXLOCKS defines a percentage of the lock list held by an application that must be filled before the database manager performs lock escalation. When the percentage of the lock list used by one application reaches MAXLOCKS, the database manager escalates the locks, which means it replaces row locks with table locks, thereby reducing the number of locks in the list. When the number of locks held by any one application reaches this percentage of the total lock list size, lock escalation occurs for the locks held by that application. Lock escalation also occurs if the lock list runs out of space. The database manager determines which locks to escalate by looking through the lock list for the application and finding the table with the most row locks. If after replacing these with a single table lock, the MAXLOCKS value is no longer exceeded, lock escalation stops. If not, lock escalation continues until the percentage of the lock list held is below the value of MAXLOCKS. The MAXLOCKS parameter multiplied by the MAXAPPLS parameter cannot be less than 100.
Although the escalation process itself does not take much time, locking entire tables (versus individual rows) decreases concurrency, and overall database performance may decrease for subsequent accesses against the affected tables.
Suggestions for controlling the size of the lock list include:
o Commit frequently to release locks. o When performing many updates, lock the entire table for the duration of the
transaction before updating (using the SQL LOCK TABLE statement). This
17

uses only one lock and keeps others from interfering with the updates, but it does reduce concurrency of the data to other users.
o Use the LOCKSIZE parameter of the ALTER TABLE statement to control how locking is done for a specific table on a permanent basis.
o Examine the isolation level used for the application. Using the Repeatable Read isolation level may result in an automatic table lock in some cases. Use the Cursor Stability isolation level when possible to decrease the number of share locks held. If application integrity requirements are not compromised, use Uncommitted Read instead of Cursor Stability to further decrease the amount of locking.
Use the following steps to determine the number of pages required for your lock list:
1. Calculate a lower bound for the size of your lock list: (512 * 32 * MAXAPPLS) / 4096, where 512 is an estimate of the average number of locks per application and 32 is the number of bytes required for each lock against an object that has an existing lock.
2. Calculate an upper bound for the size of your lock list: (512 * 64 * MAXAPPLS) / 4096, where 64 is the number of bytes required for the first lock against an object.
3. Estimate the amount of concurrency you will have against your data and, based on your expectations, choose an initial value for lock list that falls between the upper and lower bounds that you have calculated.
Use the database system monitor to tune the MAXLOCKS value.
When setting MAXLOCKS, consider the size of the lock list (LOCKLIST):
MAXLOCKS = 100 * (512 locks per application * 32 bytes per lock * 2) / (LOCKLIST * 4096 bytes)
This sample formula allows any application to hold twice the average number of locks. You can increase MAXLOCKS if only a few applications run concurrently, because there will not be a lot of contention for the lock list space under these conditions.
4. LOCKTIMEOUT specifies the number of seconds that an application will wait to obtain a lock. This helps avoid global deadlocks for applications.
If you set this parameter to 0, the application will not wait for locks. In this situation, if no lock is available at the time of the request, the application immediately receives a -911.
If you set this parameter to -1, lock timeout detection is turned off. In this situation, the application will wait for a lock (if one is not available at the time of the request) until either the lock is granted or until a deadlock occurs.
Recommendation
18

Set LOCKTIMEOUT to quickly detect waits that are occurring because of an abnormal situation, such as a transaction that is stalled (possibly as a result of a user leaving their workstation.) Set it high enough so that valid lock requests do not time-out because of peak workloads, during which time there is an increased wait for locks.
In an online transaction processing (OLTP) environment, start with a value of 30 seconds. In a query-only environment you could start with a higher value. In either case, use benchmarking techniques to tune this parameter.
How to change the parameters
To change the lock parameters, run the following commands:
db2 -v update db cfg for DB_NAME using LOCKLIST a_numberdb2 -v update db cfg for DB_NAME using MAXLOCKS b_numberdb2 -v update db cfg for DB_NAME using LOCKTIMEOUT c_numberdb2 -v terminate
Investigative steps
Once the lock list is full, performance can degrade because lock escalation generates more table locks and fewer row locks, thus reducing concurrency on shared objects in the database. Additionally, there may be more deadlocks between applications (because they are all waiting on a limited number of table locks), which will result in transactions being rolled back. Your application will receive an SQLCODE of -912 when the maximum number of lock requests has been reached for the database. If lock escalations are causing performance concerns you may need to increase the value of LOCKLIST parameter or the MAXLOCKS parameter. You may use the database system monitor to determine if lock escalations are occurring, to track the number of times an application (connection) experienced a lock timeout, or that a database detected a timeout situation for all applications that were connected.
1. First, run the following command to turn on the DB2 monitor for locks: db2 -v update monitor switches using lock on db2 -v terminate
2. Then collect your snapshots for the database: db2 -v get snapshot for database on DB_NAME
3. In the snapshot output, examine the following items: Locks held currently = 0 Lock waits = 0 Time database waited on locks (ms) = 25047 Lock list memory in use (Bytes) = 1824552 Deadlocks detected = 0 Lock escalations = 526 Exclusive lock escalations = 526 Agents currently waiting on locks = 0 Lock Timeouts = 120 Internal rollbacks due to deadlock = 0
If the "Lock list memory in use (Bytes)" exceeds 50 percent of the defined LOCKLIST size, then increase the number of 4KB pages in the LOCKLIST database configuration parameter.
19

The lock escalations lock timeouts and deadlocks does indicate some potential problems in your system or application. The locking problems normally indicate some fairly significant concurrency problems in the application that should be dealt with before the lock list parameter is increased.
Maximum number of active applications (MAXAPPLS)
Background
MAXAPPLS is a database configuration parameter. It specifies the maximum number of concurrent applications (both local and remote) that can be connected to a database. Because each application that attaches to a database requires some private memory to be allocated, allowing a larger number of concurrent applications will use more memory. The value of this parameter must be equal to or greater than the sum of the connected applications, plus the number of these same applications that may be concurrently in the process of completing a two-phase commit or rollback.
Recommendations
To run the WebSphere Internet application, make sure that MAXAPPLS is set to the right value (large enough but not unnecessarily large) to accommodate the maximum concurrent users/connections. For those applications that use connection pooling, I suggest setting MAXAPPLS to the connection pool size plus one or two (just in case you need to invoke command line connection to do something at the same time).
How to change the parameter
To change the value of MAXAPPLS, run the following command:
db2 -v update db cfg for DB_NAME using MAXAPPLS a_numberdb2 -v terminate
Investigative steps
When an application attempts to connect to a database, but the value of MAXAPPLS has already been reached, the following error is returned to the application indicating that the maximum number of applications have been connected to the database. The current setting is 1000.
SQL1040N The maximum number of applications is already connected to the database. SQLSTATE=57030
Number of asynchronous page cleaners (NUM_IOCLEANERS)
Background
NUM_IOCLEANERS is a database configuration parameter that lets you specify the number of asynchronous page cleaners for a database. These page cleaners write changed pages from the buffer pool to disk before the space in the buffer pool is required by a database
20

agent. This allows the agents to read new pages without having to wait for changed pages to be written out. As a result, your application's transactions should run faster.
If you set the parameter to zero (0), no page cleaners are started and as a result, the database agents will perform all of the page writes from the buffer pool to disk. This parameter can have a significant performance impact on a database stored across many physical storage devices, because in this case there is a greater likelihood that one of the devices will be idle. If no page cleaners are configured, your applications may encounter periodic "log full" conditions.
If the applications for a database consist primarily of transactions that update data, an increase in the number of cleaners will speed up performance. Increasing the page cleaners will also reduce recovery time from soft failures, such as power outages, because the contents of the database on disk will be more up-to-date at any given time.
Here are some factors to consider when setting the value for this parameter:
1. If transactions are run against the database, set this parameter to be between one and the number of physical storage devices used for the database. My recommendation is to set it at least to the number of CPUs on your system.
2. Environments with high update transaction rates may require more page cleaners to be configured.
3. Environments with large buffer pools may also require more page cleaners to be configured.
How to change the parameter
The following command can be used to set this parameter to a new value:
db2 -v update db cfg for DB_NAME using NUM_IOCLEANERS a_numberdb2 -v terminate
Investigative steps
Use the database system monitor to help you tune this configuration parameter using information from the snapshot data (or event monitor) about write activity from a buffer pool.
When using snapshot and collecting snapshot data for the buffer pool, monitor the following counters:
Buffer pool data writes = 1254991Asynchronous pool data page writes = 1205276
Buffer pool index writes = 4746571Asynchronous pool index page writes = 4716387
LSN Gap cleaner triggers = 184582Dirty page steal cleaner triggers = 138781Dirty page threshold cleaner triggers = 987976
21

How to decide whether NUM_IOCLEANERS should be reduced or increased?
Decrease NUM_IOCLEANERS if both of the following conditions are true:
"Buffer pool data writes" is approximately equal to "Asynchronous pool data page writes."
"Buffer pool index writes" is approximately equal to "Asynchronous pool index page writes."
Increase NUM_IOCLEANERS if either of the following conditions is true:
"Buffer pool data writes" is much greater than "Asynchronous pool data page writes." "Buffer pool index writes" is much greater than "Asynchronous pool index page
writes."
Dirty page steal cleaner triggers tells the number of times a page cleaner was invoked because a synchronous write was needed during the victim buffer replacement for the database. For a better response time, this number should be as low as possible. With the counters shown above, you can use the following formula to calculate what percentage of all cleaner invocations are represented by this element:
Dirty page steal cleaner triggers / (Dirty page steal cleaner triggers + Dirty page threshold cleaner triggers + LSN Gap cleaner triggers)
If this ratio is high, it may indicate that you have too few page cleaners defined. Too few page cleaners increases recovery time after failures. The current ratio is 0.105.
Number of I/O servers (NUM_IOSERVERS)
Background
I/O servers are used on behalf of the database agents to perform prefetch I/O and asynchronous I/O by utilities such as backup and restore. This parameter, a database configuration parameter, specifies the number of I/O servers for a database. No more than this number of I/Os for pre-fetching and utilities can be in progress for a database at any time. An I/O server waits while an I/O operation that it initiated is in progress. Non-prefetch I/Os are scheduled directly from the database agents and as a result are not constrained by NUM_IOSERVERS.
Recommendations
In the environment, use the default.
How to change the parameter
Use the following command to set NUM_IOSERVERS to a new value:
db2 -v update db cfg for DB_NAME using NUM_IOSERVERS a_number
22
db2 -v terminate
Number of commits to group (MINCOMMIT)
Background
MINCOMMIT is database configuration parameter that lets you delay the writing of log records to disk until a minimum number of commits have been performed. This delay can help reduce the database manager overhead associated with writing log records. This can mean improved performance when you have multiple applications running against a database and many commits are requested by the applications within a very short time frame. This grouping of commits will only occur when the value of this parameter is greater than one and when the number of applications connected to the database is greater than, or equal to, the value of this parameter. When commit grouping is being performed, application commit requests are held until either one second has elapsed or the number of commit requests equals the value of this parameter.
Recommendations
The default value for MINCOMMIT is 1. Increase this parameter from its default value if multiple read/write applications typically request concurrent database commits. This will result in more efficient logging file I/O because it will occur less frequently and write more log records each time it does occur. If you believe the default value is not adequate, then it is recommended that you start with 3, and move it up and down to see the performance impact on your workload. You could also sample the number of transactions per second and adjust this parameter to accommodate the peak number of transactions per second (or some large percentage of it). Accommodating peak activity minimizes the overhead of writing log records during heavy load periods.
If you increase MINCOMMIT, you may also need to increase the LOGBUFSZ parameter to avoid having a full log buffer force a write during these heavy load periods. In this case, the LOGBUFSZ should be equal to:
MINCOMMIT * (log space used, on average, by a transaction)
Here is how to use the database system monitor to help you tune this parameter in the following ways:
Calculating the peak number of transactions per second:
By taking monitor samples throughout a typical day, you can determine your heavy load periods. One way to accomplish this is as follows:
1. At the beginning of your measurements, issue the following command:
db2 -v reset monitor for database db_name
(This will not reset the counters for high water marks.)
2. At the end of your measurements, issue the following command:
23

db2 -v get snapshot for database on db_name
3. Use the following output to calculate the peak number of transactions:
First database connect timestamp = Last reset timestamp =Last backup timestamp = Snapshot timestamp = Commit statements attempted = 210927Rollback statements attempted = 905Dynamic statements attempted = 93416272Static statements attempted = 284145Failed statement operations = 342903Log space available to the database (Bytes)= 27726997980
Let totalTransactions be the sum of “commit statements attempted” and “rollback statements attempted.”
Let totalElapsedTime (in seconds) be the difference between “Last reset timestamp” and “Snapshot timestamp”. Calculate the number of transactions per second as
NumOfTransPerSecond = totalTransactions / totalElapsedTime
Calculating the log space used per transaction:
In a similar manner, by using sampling techniques over a period of time and a number of transactions, you can calculate an average of the log space used with the following monitor element: log_space_used (unit of work log space used).
1. Reset the monitor for the database of interest at the beginning of the measurements using the command:
db2 –v reset monitor for database db_name.
2. Take the snapshots at the end of the measurements using the command:
db2 –v get snapshot for database on db_name.
3. Output like that shown above is produced.
4. Calculate the log space used per transaction can be calculated using the following formula:
LogSpaceUsedPerTrans = log_space_used / totalTransactions
How to change the parameter
Use the following command to change the MINCOMMIT value:
24

db2 –v update db cfg for DB_NAME using MINCOMMIT a_numberdb2 –v terminate
25

2.3 Event monitoring
DB2 Event monitor collects stats on SQL statements.
"db2 create event monitor <event_name> for statements write to file '<filepath>'""db2 set event monitor <monitor_name> state = 1"
If there's no event analyser, the collected event files can be ftp'ed back to the PC or the
"db2evmon -path <path>"
where <path> is where the DB2 event monitor files are located, can be used. This provides a textual output.
If using the DB2 event analyser you can sort by "elapsed time" or "sort time" say to work out which SQL statements are using the most resources.
2.4 Access plans
Use visual explain to identify the problems with the query plans. This is a quick way to spot where indexes aren't being used. If you can't do this, use one of the following to get text output:-
a) db2exfmt - Provides access plan for previously explained statementb) dynexpln - provides access plans for dynamic sql statements provided in input filec) db2expln - provides access plans for static sql statements held in packagesd) db2evmon - provides statistics on sql statements provided the appropriate stmts event monitor has been created and set to state 1 previously (see section 2.3 above)
2.4.1 Selects
If large amounts of data are to be selected, ensure that you have tablespaces with large Prefetch and page sizes and that num_io_servers matches the disks that you have. Prefetch size should equal num_io_servers*extent size, as each i/o server will be allocated an extent size to prefetch.
Moving to DB2 DWE will dramatically improve select performance of a query returning a large number of rows.
26

DWE is a shared nothing architecture, where a query is split and run concurrently against each of the DWE partitions. Each partition runs as a separate database engine. This means that if you are using 64-bit DB2, you can exploit more of the server physical memory by using DWE. (Problems with DWE, is that loads need to be split manually and data distribution needs to be properly balanced. Also database management will increase and setup can be complex)
Allocate separate tablespaces and bufferpools for tables which have large volumes read. Remember to run “runstats” whenever you add an index to a table to improve the access plan. Also, you should add the “optimize for <n> rows” clause to ensure that the optimiser creates the plan for a limited rather than full row sets.
2.4.2 Inserts
If more than 25% of a table is to be inserted, then using "DB2 LOAD" is more efficient. Turn off logging and drop indexes if not required. If inserting a large volume of rows, increase the size of extent size. Allocate separate tablespaces for tables which have large volumes of inserts.
From v9.1, you can also use the “db2 load from <cursor> of cursor” terminology to directly load data from a query cursor, rather than having to export the query results to a file and load it back in from file
2.4.2 Deletes
If you want to empty the entire table –
"db2 import empty.del of del replace into <table>"
is more efficient. Remember that if you delete large quantities of data, you should do a “reorg” to release the freespace. Otherwise, rows which are inserted will ignore the freespace and queries will have to read the freespace.
2.4.3 Updates
Instead of doing :-
27

update parent set newval = (select newval from child where child.col = parent.col) where exists (select newval from child where child.col = parent.col)
it's more efficient to do:-
for row as select * from childdo update parent set newval = row.newval where col = row.col end for
(The second version allows an index on the larger parent table to be used.)
2.4.4 Commits
Transactions should be sufficiently long to ensure that data is consistent but of a short enough length so that lock contention does not occur. DB2 normally auto-commits sql statements by default. Although, this reduces logging contention due to the log writing and bufferpool cleansing which occurs on each commit, this has a serious impact on performance.
In a single process system e.g. a database load, you should only commit when you have to. In a high volume web transaction system, committing can be buffered by setting the min-commit parameter. If you set it to 10 say, each application which issues a commit will be held back until the 10th application has requested a commit or 1 second passes. Obviously if there are 1000 commits a second, say, this improves throughput, but if there are less than 10, it slows throughput. From DB2 v9.1 onwards, you can release locks on a closed cursor without committing the entire transaction. You can also hold a cursor open over multiple transactions.
2.4.5 Unions
Ensure that there is sufficient sortheap to hold the contents of the tables to be union together.
2.4.6 Joins
28

In terms of joins, a nested loop join should choose the table with the least rows as the inner table (scanned multiple times) and the one with the largest rows as the outer table.
Merge joins are used for tables where there's a foreign key index on the inner table column and a primary key index on the outer table. Otherwise tends to be used when there are 2 small tables. Advantage of these is inner table only needs scanning once. Downside is that both tables need to be sorted before the join.
Hash joins apply a hashing algorithm to join columns and place the resulting values into hash buckets. Hash joins will be used if there are 2 large tables to be joined and the DB2 optimization level is > 5. You also need to
"db2set DB2_HASH_JOIN=on".
(Once set on, check db snapshot for "number of hash join overflows" and increase sheapthres and sortheap if this is >0)
Anti-Joins should be used where "and not exists" criteria is used in queries against large tables.
"db2set DB2_ANTI_JOIN=on"
29

2.4.7 Indexing
Ensure that index tablespaces are spread across multiple disks separate from the data tablespaces. If indexing large tables, ensure that the prefetch size is large. Also you can create a cluster index for the index on a table which is most often queried. Alternatively, when you reorg, you should reorg on this index. This ensures that data is stored in order based on this index, which means searching on this index is speeded up.
Check db snapshot that "Rows read" is no more than 10 times "Rows selected". If it's many multiples greater than this, then this is indicative that full table scans are occurring.
You can check the table snapshot to see which tables are most heavily read from, and then search the sql select statements (captured by the event monitor) to see which queries are reading these tables.
Ensure that indexes are placed on columns used in sql statements that are joined, appear frequently in filter criteria resulting in less than 10% dataset returned, or have "order by", ”group by” or “distinct” criteria.
If there only a couple of columns extra to those in the where criteria are to be returned, consider adding these as include columns to an index.
30
2.5 Memory
If there's a memory problem, check bufferpool and sort heap first. Total database memory should never exceed more than 80% of total physical memory.
sheapthres should be set at instance level to control max sort heap. sortheap should be set to sheapthres/no. of concurrent queries at database level.
svmon available for AIX gives a true picture of total physical and used memory.
"ps aeux" shows memory used per process
Always leave where possible at least 20% of physical memory for the operating system.
2.5.1 Bufferpool
Check that this is sufficient by running "db2 get snapshot for db on <db>"and checking that "buffer pool data physical reads /
(buffer pool data logical reads+buffer pool data physical reads)" is less than 5%.
If not
“alter bufferpool <bufpool> size <number of pages”
then restart instance.
num_io_cleaners should be set to the number of CPUs. This parameter determines the number of processes which will be kicked off by the engine asynchronously when the chngpgs_thresh is hit.
32-bit operating systems can only address up to 4 GB of memory. However, DB2 allows you to page in more memory space for sorting using extended storage. To benefit from this, create a new temporary tablespace and an associated bufferpool with the “extended storage” parameter. You also need to set num_estore_segs and estore_seg_sz.
31

2.5.2 Sortheap
Run
"db2 get snapshot for db on <db>"
and check that sort overflows aren't occurring.
Note: Before increasing sortheap/sheapthres, you need to ensure that indexes are placed on columns used in sql statements that are joined or have "order by", ”group by” or “distinct” criteria.
If there's not enough physical memory or the 2GB (32-bit) barrier is being reached, it is why the move to DB2 DWE was beneficial.
2.5.3 Private memory
“db2set DB2MEMDISCLAIM=yes”
The command tells DB2 to release memory when an agent process is terminated.
"db2set DB2MAXMEMFREE=<bytes>"
This command should be set to the number of bytes which each agent process should retain. This should be set larger for data warehouse agent processes which should hold on to more private memory instead of re-allocating it.
2.6 CPU
If CPU is the problems. Check indexing of queries. Unindexed queries will have to join hundreds if not 1000s of rows. If it's I/O move tables or indexes to other disks.
If it is a web environment or one in which connections are made then removed, then you should increase the agent pool. This is a server-side equivalent to a connection pool
One known performance problem with DB2 UDB is if the DBA used standard SMS containers. These extend the tablespace, one page at a time. Running db2empfa against the database ensures that extents rather than pages are
32

used and can quickly improve performance. Note: From V9.1 onwards, SMS tablespaces will grow an extent at a time by default. Using DMS (pre-allocated storage) tablespaces will improve perf even more dramatically.
TOPAS if it's installed shows you the programs which use the most CPU
vmstat monitors memory and process usage %usr shows percentage of CPU that user programs are using, and %sys is operating system CPU usage.
Also check that the scan rate column is low (vmstat -s) - should be zero most times with occasional bursts. Constantly high, means that it's paging information in and out of memory.
33

2.7 Diskiostat -xnc reports disk i/o activities (AIX and Solaris). In a well-tuned system, disk activity should be minimal, %b (busy), %wio and/or wt should be less than 20%. To improve disk usage, spread data over multiple RAIDed disks
db2set DB2_STRIPED_CONTAINERS=on (before you create tablespaces). This ensures that the database and RAID stripes match up, so there aren’t excess I/O calls.
db2set DB2_PARALLEL_IO=* (ensures that if you have a single container on RAIDed disks, the DB2 engine will kick off num_io_server processes to fetch data from disk)
The new tokens "NO FILE SYSTEM CACHING" indicate that caching at the file system level will be OFF for any particular tablespace.
ALTER TABLESPACE <tablespace name> ... NO FILE SYSTEM
2.8 Logging
Logging can also have an effect. Logging should be done on a separate disk from the main database tables and indexes. Modifying the log_buf_sz can have an effect if there's a lot of logging going on. Logs should be put on seperate disk. You can avoid logging by doing the following:-
create table <table> .... not logged initially;alter table <table>.... activate not logged initially;
Note: If you rollback a transaction, you will need to drop and re-create the table, which makes it only really useful in data-warehouse population environments.
If you have long running transactions you should have a small number of large log files to hold the redo information e.g. data warehouses. If you are worried about the recovery time in this situation set softmax to 50 say, and a consistent check point will be taken when a redo is half filled. This halves the recovery time. Setting it to 10 will improve recovery time by 10 times.
34

However, creating a consistent check point has an influence on application performance. If you have many short running transactions that is OLTP, you should have a large number of small log files.
35

2.9 Locking
If there's lock contention, first thing to do is to
"db2set set DB2_RR_TO_RS=yes".
This will ensure that next key locking of rows does not occur during insert/deletes.
Note: In V9, you can use type2 indexes which avoid next key locking
Also set "LOCK_TIMEOUT" to be 10 (seconds) rather than -1.
If you are updating/inserting a substantial proportion of a table, it’s more efficient to take out an exclusive lock on the table (alter table <table> locksize table) rather than allowing row locks to fill the locklist and then be escalated.If row locks are being escalated unnecessarily, increase maxlocks to a higher percentage or increase the size of the locklist.
If you want to avoid holding locks open for a long time on a base table, one solution is to create a materialised query table (MQT) against it with deferred refresh. You can run your program against the MQT allowing normal application users to work unhindered with the base table.
2.10 Application
For an OLTP environment, check the db snapshot that "Package cache inserts" are small compared to "package cache lookups". If they aren’t this means that sql statements are not being parameterised. This is ok, only if there are a large number of statements which are executed only once.
If you have many CPUs and only a single process e.g. data warehouse loading, then turning on INTRA_QUERY_PARALLELISM and setting DFT_DEGREE and MAX_QUERYDEGREE to –1 to allow the optimiser to decide how many CPUs to use to process the sql statement.
If you are retrieving a large amount of data, you should increase ASLHEAPSZ for local clients and RQRIOBLK for remote clients as well as QUERY_HEAP_SZ so as to hold as much data as possible. Note, these parameters can go up to 500,000 (2GB)
2.11 Sorting
36

Sheapthres needs to be set at the instance level to number of concurrent sorts * sortheap. Sortheap should be set at the database level to hold the largest amount of data to be sorted. If the "total sort time (ms)" or "total sort overflows" from the db snapshot is large then you need to track down which queries should be indexed.
32-bit operating systems can only address up to 4GB of memory. However, DB2 allows you to page in more memory space for sorting using extended storage. To benefit from this, create a new temporary tablespace and an associated bufferpool with the “extended storage” parameter. You also need to set num_estore_segs and estore_seg_sz.
37

3 Server performance monitoring
3.1 Unix performance monitoring
nmon available for AIX gives a good system overview.
svmon available for AIX gives a true picture of total physical and used memory.
Topas if it's installed shows you the programs which use the most CPU
vmstat monitors memory and process usage
%usr shows percentage of CPU that user programs are using, and %sys is operating system CPU usage. Also check that the scan rate column is low - should be zero most times with occasional bursts. Constantly high, means that it's paging information in and out of memory.
sar -o temp 60 10 will sample CPU usage for 10 minutes and write to file temp.
iostat -xnc reports disk i/o activities (AIX and Solaris). In a well-tuned system, disk activity should be minimal, %b (busy), %wio and/or wt should be less than 20%. To improve disk usage, spread data over multiple RAID disks
AIX Disk Layout Considerations
The purpose of this section is to provide some considerations that are recommended to enable either improved data access speed (striping) or high availability of data (mirroring), depending upon which best suits the business purposes following the new design implementation.
From an AIX perspective, planning is important, and good disk layouts are imperative for optimum DB2 performance. This is one of the most overlooked areas in database planning. Striping, also known as RAID 0, is a technology that was developed to achieve maximum I/O performance. The basic concept is that data is written and read from the file system in chunks across the width of the physical disk layout in parallel. The width represents the number of disks within the layout, striping represents the contiguous layout of data across separate disks. If performance is what you have in mind, striping is what you want.
Mirroring, also known as RAID 1, is a feature on AIX that can be useful within a DB2 data layout. The objective of mirroring is redundancy and high availability of data. Having two or more copies of data is important from a high availability standpoint in reducing downtime. If
38

one copy goes bad, the system automatically starts using the other copy. If high availability of data is important, mirroring should be your choice.
There are, however, tradeoffs to be considered in each layout. For instance, although striping gives you the best performance in parallel reads and writes, failure of a single disk will render your data useless. Although mirroring will give you data redundancy, writing of data to disk is costly because it would mean up to three writes depending on how many copies you have configured. But, because of the flexibility of the LVM in AIX, you could minimize the penalty factor of each one of these configurations by tuning the following parameters:
Striping o max_coalesce o queue_depth o minpgahead o maxpgahead o lvm_bufcnt
Mirroring o Write scheduling policy o Mirror write consistency o Write verify
3.2 Windows performance tuning
Task manager shows you CPU, memory and disk usage on a per process basis. Windows XP also shows you total network performance.
You should
“db2set DB2NTNOCACHE=off”,
to avoid double-buffering of data on Windows. Note: From V9.1, you’ll be able to avoid double-buffering of data on all operating systems by creating a tablespace with a “NO FILE SYSTEM CACHING” clause.
If you have multiple disks, make sure that you move the paging file to a separate disk. By default, it’s created on the c: drive.
If you have more than 4GB of physical memory, you need to turn on Windows AWE. You do this with the /PAE boot.ini switch. (only useful for W2K+3 Advanced and Datacenter servers)
39

4. Important database manager (dbm) parameters
4.1 Monitoring parametersdft_mon_bufpool Turn on monitoring of
bufferpool usagedft_mon_lock Turn on monitoring of
table and row-level locks
dft_mon_sort Turn on monitoring of sorts
dft_mon_stmt Turn on monitoring of sql
dft_mon_table Turn on monitoring of table reads, writes and overflows
dft_mon_uow Turn on monitoring of transactions
mon_heap_sz Memory used when you switch monitoring on
4.2 Authority parameterssysadm_group Group can do anything. Only group
which can update dbm cfgsysctrl_group Group that’s able to perform all
maintenance and admin commands within the instance but can’t read data.
sysmaint_group Group which can perform backup/restore and runstats ondatabases within the instance
4.3 Stored procedure parameters
Keepdari Keep stored procedures in memory after they terminate
Maxdari Maximum number of stored procedures which can be run
40

4.4 Parallel parameters
intra_parallel Allow multiple agents to process a sql statement in parallel
max_querydegree Maximum number of agents to be used to process a sql
statement in parallel
41

4.5 Shared memory parametersEach of the following parameters defines maximum amount of memory which is shared between agents operating within the database instance.
min_priv_mem Minimum amount of memory reserved on instance startup for agents use.
priv_mem_thresh Minimum amount of memory which is kept reserved for private use
Sheapthres Maximum amount of memory to be used by sorts
num_poolagents Number of agents kept in a pool ready for new connections
num_initagents Number of agents allocated on instance start-up ready for new connections
Maxagents Maximum number of agents for this instance
audit_buf_sz Memory used by the db2aud audit process
Backbufsz Memory used during a database backup
Restbufsz Memory used during a database restore
4.6 Agent private memory parameters
Each of the following parameters are the maximum amount of memory which can be allocated for each agent. Without parallelism switched on, an agent is a server process which matches a single client connection. With parallelism switched on, multiple agents may be created in order to process commands from a single client connection.
Aslheapsz Memory used as a communication buffer between an application and each of it’s agents opened cursors.
query_heap_sz Memory which is used to hold all the data for all the agent cursors opened. This should be set to aslheapsz*number of open cursors
agent_stack_sz Memory allocated to every agent to process sql statements
udf_mem_sz Memory used to store each user defined
42
function used by agentjava_heap_sz Memory used by each java stored procedures
used by agentrqioblk Memory which holds blocks of data to be sent
between an agent and it’s application
4.7 Communication parameters
Svcename Should be set to the service name in /etc/services which has been defined for this instance
43

5. Important database (db) parameters
5.1 Lock parameters
Locklist Memory used to hold information on table and row level locks
Maxlocks Percentage of locklist which can be allocated before row level locks are escalated to table locks
locktimeout Time in seconds until a lock wait is abandoned.
Dlchktime Time in millisecs until a deadlock is rolled back
5.2 Parallel parameters
dft_queryopt Optimisation level to be used in determining ideal access plan
dft_degree Normal number of agents to be used to process sql statements in parallel
5.3 Shared memory parameters
app_ctl_heap_sz Maximum agent shared memory allocated to a parallel
application dbheap Holds control information for all tables indexes
tablespaces and bufferpools used by database applications. Also contains the catalog cache and log buffer
catalogcache_sz Holds information about tables to speed up processing of sql statements
logbufsz Memory which acts as a buffer between the log writer process
and the redo log filesutilheapsz Memory used by the backup restore reorg and
runstats utilitiespckcachesz Memory used to store copies of sql statementsmaxappls Maximum number of applications which can
connect to database 44
avg_appls Average number of applications which are connected to the database. Helps determine optimal access plan
5.4 Private memory parameters
sortheap Maximum memory allocated for each sortstmtheap Maximum memory allocated by compiler whilst
generating optimal access plan for the sql statmentapplheapsz Maximum agent private memory allocated to a
non-parallel application stat_heap_sz Memory used by the runstats utility
45
5.5 Bufferpool parameters
Buffpage Default bufferpool memory used to hold retrieved table data
chngpgs_thresh Number of allowed dirty pages in bufferpool before they are written to disk. A dirty page is one that’s been changed in memory and not committed to disk.
num_iocleaners Number of processes which clean dirty pages from the Bufferpool
num_ioservers Number of processes which read data from disk into the
bufferpooldft_prefetch_sz If not specified on tablespace creation this is the
default parameter which determines how much data can be prefetched from disk into the bufferpool in 1 go during a full table scan.
5.6 Log parameters
Logfilsiz Size in pages of a primary or secondary logfileLogprimary Number of log files which can actively hold
transaction information during normal workload conditions
logsecond Number of additional log files which can be temporarily created to hold active transaction information
newlogpath Directory in which any new transaction log files should be created
softmax Normally when a logfile is full a point of consistency is created. i.e. data held in the bufferpool is written back to disk. This ensures that if a database crashes the database only has to rollforward commands in the latest active log file. If the logfile is large . this can still take time however. Setting softmax to 50 say will ensure that a point of consistency is taken when the logfile is only 50% full reducing the
46

recovery time
logretain If switched on transaction logs are archived rather than overwritten. This means that if a database fails you can restore from previous backup and rollforward archived logs to the point of failure.
Userexit A userexit is used to archive the transaction log files
47

6. DB2 v9.1 Performance enhancements
6.1 Multidimensional clustering
Data warehouse fact tables can now be clustered on more than one dimension. This has the advantage that if a range query uses only the dimensions in the cluster, then only a proportion of the fact table is scanned. Reorgs of the fact table are also unnecessary.
6.2 Prefetching enhancements
You can now create block-based bufferpools which means blocked cursors (used in full table scans) can now write data to memory as a block instead of a page. This improves reading and writing data from disk to memory.
6.3 Page cleaner I/O improvements
V9 allows page cleaners to take advantage of operating systems e.g. AIX asynchronous I/O facilities. When cleaning dirty data pages from the bufferpool, the db2 cleaner process passes it to the operating system and carries on with it’s work.
6.4 Catalog and authorization caching on databases with multiple partitions
The system catalog is now cached on every partition of the database. This improves DB2 DWE performance, which prior to V9, had to contact the catalog partition for table/index statistics
6.5 Threading of Java UDFs and stored procedures
The DARI processes now use a thread model. This means that thread-safe programs (i.e. programs with multiple concurrent threads which don’t impact on each other) will run much more quickly
6.6 Connection Concentrator
48

DB2 has always had a server-side agent pool which allows server-side resources for web applications to be shared more efficiently. V9 allows for a client connection pool as well.
49

6.7 Materialized query tables
Prior to V9, DB2 allowed summary tables i.e. a table which is based on a query which includes a GROUP BY clause and is pre-queried and stored. V9 extends this functionality, and allows a MQT to be defined based on any query. Furthermore, an MQT can also be created on nicknames (database tables residing in attached federated databases).
Finally, an MQT can have a staging table associated with it and be incrementally refreshed. I.e. when one of the MQTs source tables changes, the changes are fed to the staging table which then increments the MQT. The performance improvement occurs due to the DB2 optimizer working out if the MQT is up-to-date or not, and using it in queries, where appropriate.
Conclusion Traditional 24 x 7 performance monitors only meet the demands of today’s technology environment from an operator’s perspective, since they are designed to provide high-level availability information.
IBM provides the diagnostic and resolution capabilities that database administrators needto address today’s performance and availability problems in detail. This document provides tuning parameters in both AIX and DB2 for optimal DB2 performance. It touches on file system layouts from an AIX perspective, and buffer pool management from a DB2 perspective. It contains a few monitoring utilities in DB2 and AIX to aid in capturing performance data, and recommends some specific operating system environment settings to allow for maximum resource usage by DB2.
The attached files consisting of scripts written specifically for the project provide the following: an innovative performance interface, detailed statistics, and robust alarming capabilities, making it possible to quickly diagnose any DB2 error. The DB2_AIX_CHECK.KSH script is the result of the interactive analysis done by IBM for rapid problem identification.
DB2_STATUS.KSH is the second file to be used for applying the results of the analysis done above in this document. These components allow the users to easily resolve problems identified with the provided software. All tools and support files such as the db2support.zip are available in the DB2 home directory of the server.
50