dbs group (dbs sp) buy statistics not its first rodeo
TRANSCRIPT

25.89
May 21, 2019
Banks
Sin
gapore
THIS REPORT HAS BEEN PREPARED BY MAYBANK KIM ENG RESEARCH
SEE PAGE 9 FOR IMPORTANT DISCLOSURES AND ANALYST CERTIFICATIONS
Co. Reg No: 198700034E MICA (P) : 099/03/2012
Thilan Wickramasinghe [email protected] (65) 6231 5840
DBS Group (DBS SP)
Not its first rodeo
China exposure evokes doom & gloom. Is it justified?
North Asia delivers a third of DBS’ income. Intensifying US-China trade
tensions have created operating and news-flow risks. Nevertheless, DBS
has been delivering North Asian ROAs that are significantly above its
long-term mean since the trade war began in 1Q18. Asset quality is also
much better than at home. In North Asia, DBS is mostly exposed to high-
quality corporates and FIs, funded by a large, low-cost CASA base. This
puts it in a stronger position to deal with trade-war volatility than
regional peers, we believe. Importantly, its Singapore earnings should be
more than sufficient to back guided dividend payments. Maintain BUY
with multi-stage DDM (10.3% COE, 3% terminal) based TP of SGD29.46
Exposed to right segments
According to management, 85% of DBS’ North Asian loans are made to
mostly large corporates and FIs in HK and China. Direct CNY loans make
up just 3.7% of its book vs 43% for USD & HKD loans. This level of
wholesale exposure lowers its portfolio risks compared with a retail- and
SME-heavy book, which may be hurt more by trade wars. Additionally,
57% of DBS’ North Asia lending is funded by low-cost CASA. This provides
a margin advantage. DBS has been delivering ROAs that are 30bps above
its long-term 0.9% since the trade war began, pointing its franchise
strength.
Balance sheet to manage volatility
North Asian credit charges have been materially lower than elsewhere
for the bank since the trade war began. 1Q19 NPLs here were 0.8% vs
2.0% for the group. This underscores the quality of its portfolio, in our
view. DBS has a 14.1% CET. Provisions will need to double to take this
down to 13.5%: management’s minimum comfort level. Even then, it
would be 5.1% higher than the MAS minimum. The last time this played
out was in 2009 during the GFC, when DBS was structurally different with
a higher dependence on trading income.
Dividends secure
All else being equal, we estimate that its minimum-dividend guidance of
SGD1.20 for prospective 4.6% yields can be funded just by earnings from
Singapore. Domestically, DBS should benefit from rising NIMs from
mortgage re-pricing and its low-cost funding base. While trade-war news
may affect short-term sentiment, we believe DBS is structurally well-
placed to weather the volatility. BUY.
Share Price SGD 25.89
12m Price Target SGD 29.46 (+14%)
Previous Price Target SGD 29.46
BUY
Statistics
52w high/low (SGD)
3m avg turnover (USDm)
Free float (%)
Issued shares (m)
Market capitalisation
Major shareholders:
29.0%
2.1%
2.1%
2,564
73.2
Temasek Holdings
Capital Research
The Vanguard Group
29.40/22.80
70.3
SGD66.4B
USD48.2B
Price Performance
95
105
115
125
135
145
155
20.0
22.0
24.0
26.0
28.0
30.0
32.0
May-17 Aug-17 Nov-17 Feb-18 May-18 Aug-18 Nov-18 Feb-19
DBS Group - (LHS, SGD) DBS Group / Straits Times Index - (RHS, %)
-1M -3M -12M
Absolute (%) (6) 3 (11)
Relative to index (%) (1) 6 (2)
Source: FactSet
FYE Dec (SGD m) FY17A FY18A FY19E FY20E FY21E
Operating income 11,924 13,183 14,429 16,032 17,147
Pre-provision profit 6,719 7,385 8,322 9,125 9,764
Core net profit 4,067 5,625 6,437 6,948 7,622
Core EPS (SGD) 1.6 2.2 2.5 2.7 3.0
Core EPS growth (%) (4.6) 38.3 14.4 7.9 9.7
Net DPS (SGD) 1.4 1.2 1.4 1.5 1.6
Core P/E (x) 15.7 10.8 10.3 9.6 8.7
P/BV (x) 1.3 1.2 1.3 1.2 1.2
Net dividend yield (%) 5.8 5.1 5.3 5.7 6.3
Book value (SGD) 18.51 19.13 20.12 21.20 22.40
ROAE (%) 9.2 12.2 13.6 13.9 14.4
ROAA (%) 0.8 1.1 1.1 1.1 1.2
Consensus net profit - - 6,201 6,607 7,038
MKE vs. Consensus (%) - - 3.8 5.2 8.3
2
DBS Group
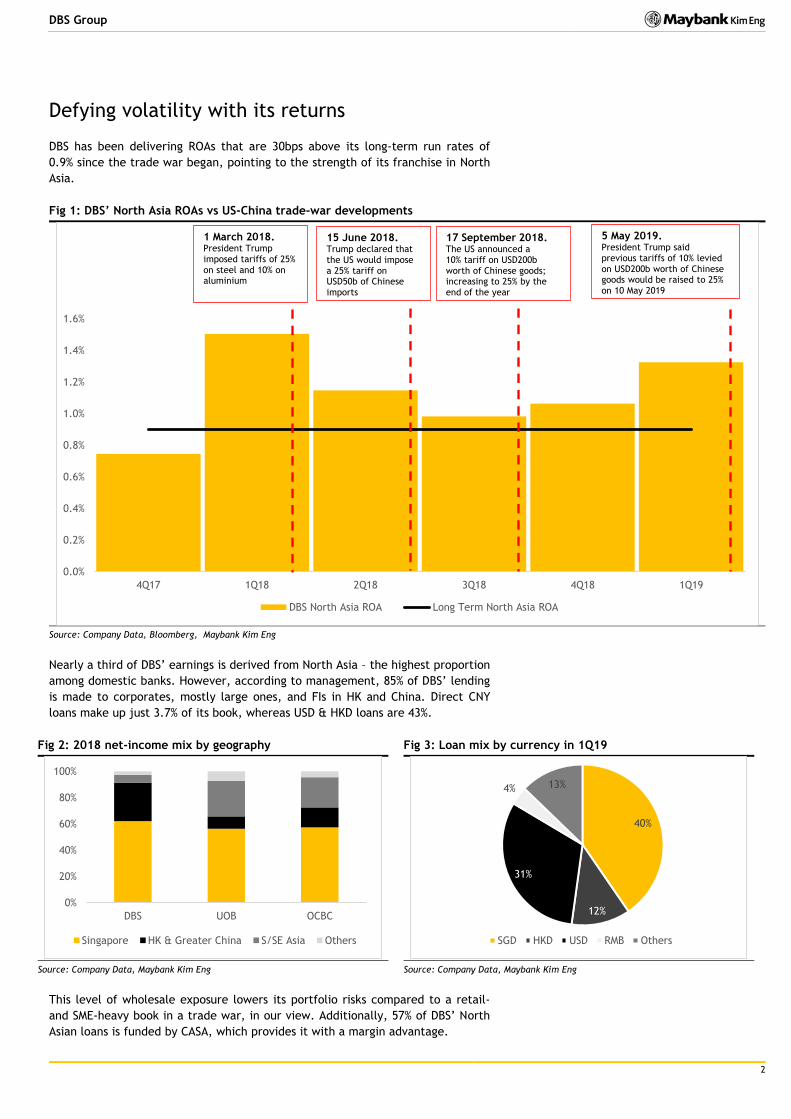
Defying volatility with its returns
DBS has been delivering ROAs that are 30bps above its long-term run rates of
0.9% since the trade war began, pointing to the strength of its franchise in North
Asia.
Fig 1: DBS’ North Asia ROAs vs US-China trade-war developments
Source: Company Data, Bloomberg, Maybank Kim Eng
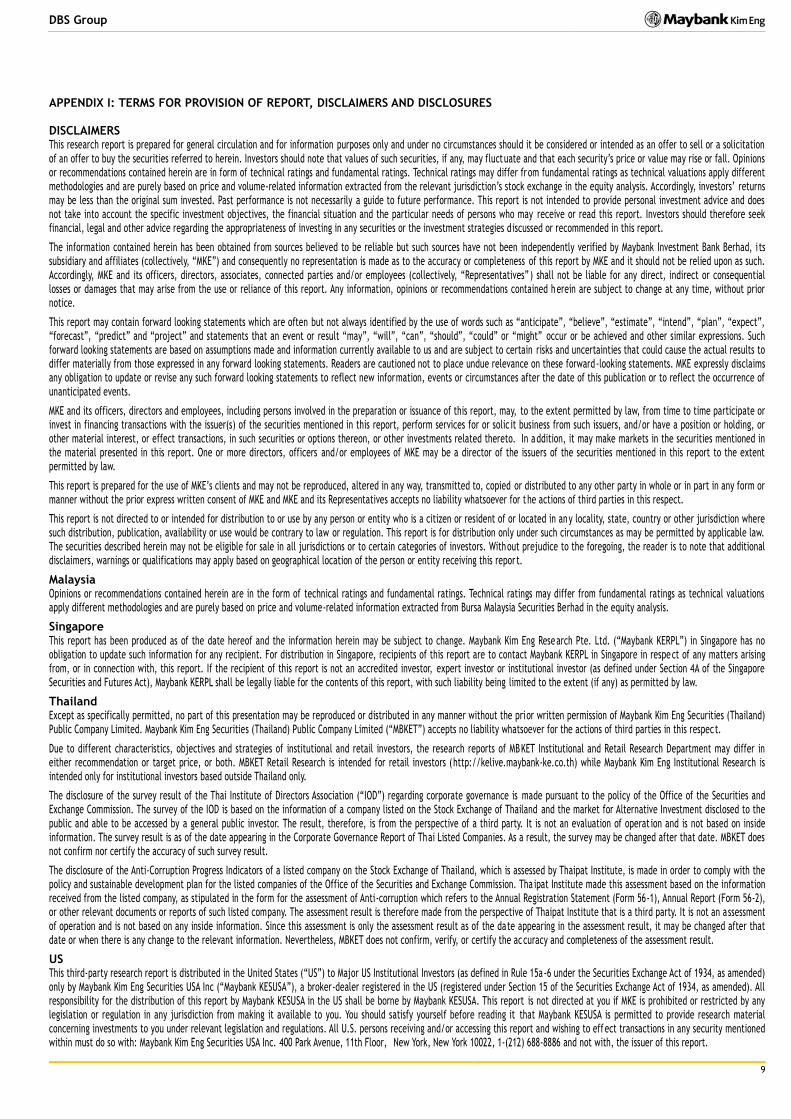
Nearly a third of DBS’ earnings is derived from North Asia – the highest proportion
among domestic banks. However, according to management, 85% of DBS’ lending
is made to corporates, mostly large ones, and FIs in HK and China. Direct CNY
loans make up just 3.7% of its book, whereas USD & HKD loans are 43%.
Fig 2: 2018 net-income mix by geography
Source: Company Data, Maybank Kim Eng
Fig 3: Loan mix by currency in 1Q19
Source: Company Data, Maybank Kim Eng
This level of wholesale exposure lowers its portfolio risks compared to a retail-
and SME-heavy book in a trade war, in our view. Additionally, 57% of DBS’ North
Asian loans is funded by CASA, which provides it with a margin advantage.
0.0%
0.2%
0.4%
0.6%
0.8%
1.0%
1.2%
1.4%
1.6%
4Q17 1Q18 2Q18 3Q18 4Q18 1Q19
DBS North Asia ROA Long Term North Asia ROA
1 March 2018. President Trump imposed tariffs of 25% on steel and 10% on aluminium
15 June 2018. Trump declared that the US would impose a 25% tariff on USD50b of Chinese imports
17 September 2018. The US announced a 10% tariff on USD200b worth of Chinese goods; increasing to 25% by the end of the year
5 May 2019. President Trump said previous tariffs of 10% levied on USD200b worth of Chinese goods would be raised to 25% on 10 May 2019
0%
20%
40%
60%
80%
100%
DBS UOB OCBC
Singapore HK & Greater China S/SE Asia Others
40%
12%
31%
4% 13%
SGD HKD USD RMB Others

3
DBS Group
Strong balance sheet to manage volatility
North Asian credit charges have been materially lower than elsewhere in its
operations since Trump fired his first trade-war salvo.
Fig 4: Credit charges for North Asia vs group
Source: Company data, Maybank Kim Eng
NPLs in North Asia were 0.8% in 1Q19 vs 2% for the group. This underscores the
quality of its portfolio, in our view. With lower exposure to the retail and SME
sectors, which should feel the pinch of the trade war sooner and harder than
large corporates with scale and diversification, DBS should be better positioned
than its regional peers in North Asia, we believe.
DBS has a 14.1% CET. Provisions will need to double from here to take this down
to 13.5%, management’s minimum comfort level. This would still be 5.1% higher
than the MAS minimum. The last time this played out was in 2009 during the GFC.
At that time, DBS was structurally different with a much larger dependence on
trading income and higher-risk financial instruments.
Fig 5: CET1
Source: Company Data, Maybank Kim Eng
Fig 6: Total provisions (SGDm)
Source: Company Data, Maybank Kim Eng
-0.50%
-0.40%
-0.30%
-0.20%
-0.10%
0.00%
0.10%
4Q17 1Q18 2Q18 3Q18 4Q18 1Q19
North Asia Group
Net writeback
Net charge
0.0%
2.0%
4.0%
6.0%
8.0%
10.0%
12.0%
14.0%
16.0%
2014 2015 2016 2017 2018 1Q19
CET1
Management comfort level
Regulatory minimum -
500
1,000
1,500
2,000
2,500
3,000
3,500
4,000
4,500
5,000
2008 2009 2010 2011 2012 2013 2014 2015 2016 2017 2018
SGDm

4
DBS Group
Dividends secure
All else being equal, DBS’ minimum guided dividend of SGD1.20 for a 4.6%
prospective yield should be deliverable just from its 2018 Singapore earnings.
Fig 7: Geographical earnings (SGDm) vs pay outs needed for minimum dividends
Source: Company data, Maybank Kim Eng
Domestically, DBS should benefit from rising NIMs from mortgage re-pricing as
well as its traditional low-cost funding base.
Fig 8: NIM evolution
Source: Company data, Maybank Kim Eng
We forecast yields of 5.3% for FY19E, a payout that we believe its ex-North Asian
operations can comfortably support.
So while trade-war news flow may affect short-term sentiment, we think DBS is
structurally well-placed to weather the volatility. BUY.
-
1,000
2,000
3,000
4,000
5,000
6,000
2018 PAT Total payout for SGD1.20 dividend
Singapore HK Rest of Greater China South and SEA Rest of the world
1.55%
1.60%
1.65%
1.70%
1.75%
1.80%
1.85%
1.90%
1.95%
2.00%
2010 2011 2012 2013 2014 2015 2016 2017 2018 2019E 2020E 2021E

5
DBS Group
Value Proposition
SE Asia’s largest bank by assets, with strength in large
corporate loans, cash management and wealth
Over 50% market share of SGD CASA deposits through
strong heartland banking franchise. Also strong USD
funding base through HK operations
Current strategy has the group refocusing on commercial
banking following attempts to transform in to a universal
bank pre-GFC which had mixed results
Increasing presence in South and South Asia particularly
India and Indonesia
Early adopter of technology and automation providing
opportunities for new revenue streams and cost savings
IT spending set to double. New revenue opportunities
Source: Company, Maybank Kim Eng
Price Drivers
Historical share price trend
Source: Company, Maybank Kim Eng, Factset
1. Record earnings with robust lending and stable asset
quality following strong 1Q15, despite declining trade
loans.
2. Sharp CNY devaluation, O&G, commodities and China’s
NPL worries.
3. Positive sentiment from expectation of Fed rate hike,
USD strength and oil
4. Concerns of US-China trade war, slowing mortgage
lending from property cooling measures and slower
regional growth
Financial Metrics
NIMs are set to rise from 1.80% in 2017 to 1.94% by 2021E
as the group leverages on their low cost funding base in a
backdrop of rising rates
More stable fee income from loan fees and wealth
management will increasingly replace volatile trading
income. Fee income should grow from 55.7% of non-int
income in 2016 to 60.1% in 2021E
Gross NPLs should see the continued downtrend from a
O&M sector driven flare up of 1.7% in 2017 to 1.4% in
2021E
Continued focus on margin enhancement and opex
management should drive core-ROAEs higher from 8.8% in
2017 to 13.64% in 2021E
ROEs set to rise from higher margins
Source: Company, Maybank Kim Eng
Swing Factors
Upside
Potentially higher margins from rising rates and
leveraging low cost funding base
Regional integration may provide cross-selling
opportunities enhancing customer returns
Wider customer base and lower customer acquisition
costs from the launch of the digital bank in India
Downside
Sharp decline in value of trading securities and shocks in
fixed-income portfolio.
Increasing deposit competition raising cost of funding
More property cooling measures depressing mortgage
growth sentiment further
0
200
400
600
800
1,000
1,200
2010 2012 2014 2016 2018 2020E
SGDm
6% CAGR
90
100
110
120
130
140
150
160
170
180
190
12.0
14.0
16.0
18.0
20.0
22.0
24.0
26.0
28.0
30.0
32.0
May-14 May-15 May-16 May-17 May-18
DBS Group - (LHS, SGD)
DBS Group / Straits Times Index - (RHS, %)
0%
2%
4%
6%
8%
10%
12%
14%
16%
2010 2012 2014 2016 2018 2020E
1
2
3
4

6
DBS Group
FYE 31 Dec FY17A FY18A FY19E FY20E FY21E
Key Metrics
Core P/E (x) 15.7 10.8 10.3 9.6 8.7
Core FD P/E (x) 15.7 10.8 10.3 9.6 8.7
P/BV (x) 1.3 1.2 1.3 1.2 1.2
P/NTA (x) 1.5 1.4 1.4 1.3 1.3
Net dividend yield (%) 5.8 5.1 5.3 5.7 6.3
INCOME STATEMENT (SGD m)
Interest income 10,833.0 13,798.0 18,154.2 20,263.6 21,744.9
Interest expense (3,042.0) (4,843.0) (8,279.5) (9,157.3) (9,954.7)
Net interest income 7,791.0 8,955.0 9,874.7 11,106.3 11,790.1
Net insurance income 0.0 0.0 0.0 0.0 0.0
Net fees and commission 2,622.0 2,780.0 2,919.0 3,065.0 3,218.2
Other income 1,511.0 1,448.0 1,635.3 1,860.5 2,139.2
Total non-interest income 4,133.0 4,228.0 4,554.3 4,925.4 5,357.3
Operating income 11,924.0 13,183.0 14,428.9 16,031.7 17,147.5
Staff costs (2,825.0) (3,185.0) (3,599.1) (4,210.9) (4,505.7)
Other operating expenses (2,380.0) (2,613.0) (2,507.8) (2,696.2) (2,877.5)
Operating expenses (5,205.0) (5,798.0) (6,106.9) (6,907.1) (7,383.2)
Pre-provision profit 6,719.0 7,385.0 8,322.1 9,124.6 9,764.3
Loan impairment allowances (1,894.0) (710.0) (696.1) (900.1) (751.4)
Other allowances 0.0 0.0 0.0 0.0 0.0
Associates & JV income 0.0 0.0 0.0 0.0 0.0
Pretax profit 5,129.5 6,627.0 7,626.0 8,224.6 9,012.9
Income tax (625.5) (974.0) (1,112.8) (1,200.1) (1,315.1)
Minorities (133.0) (76.0) (76.0) (76.0) (76.0)
Discontinued operations 0.0 0.0 0.0 0.0 0.0
Reported net profit 4,371.0 5,577.0 6,437.2 6,948.4 7,621.7
Core net profit 4,066.5 5,625.0 6,437.2 6,948.4 7,621.7
Preferred Dividends (38.0) (38.0) (38.0) (38.0) (38.0)
BALANCE SHEET (SGD m)
Cash & deposits with banks 62,438.0 62,363.0 64,261.3 68,023.2 76,056.2
Sec. under resale agreements 0.0 0.0 0.0 0.0 0.0
Derivatives financial assets 17,585.0 17,029.0 18,731.9 20,605.1 22,665.6
Dealing securities 0.0 0.0 0.0 0.0 0.0
Available-for-sale securities 55,589.0 58,197.0 61,106.9 64,162.2 67,370.3
Investment securities 39,753.0 47,278.0 58,923.2 67,541.0 72,293.9
Loans & advances 323,099.0 345,003.0 366,657.5 388,605.7 414,359.3
Central bank deposits 0.0 0.0 0.0 0.0 0.0
Investment in associates/JVs 783.0 838.0 838.0 838.0 838.0
Insurance assets 0.0 0.0 0.0 0.0 0.0
Fixed assets 1,233.0 1,450.0 1,705.2 2,005.3 2,358.2
Intangible assets 5,165.0 5,175.0 5,175.0 5,175.0 5,175.0
Other assets 12,066.0 13,418.0 14,759.8 16,235.8 17,859.4
Total assets 517,711.0 550,751.0 592,158.8 633,191.3 678,975.9
Deposits from customers 373,634.0 393,785.0 420,880.0 450,273.3 481,959.3
Deposits from banks & FIs 17,803.0 22,648.0 28,811.5 36,652.5 46,627.3
Derivatives financial instruments 18,003.0 16,692.0 16,692.0 16,692.0 16,692.0
Subordinated debt 1,138.0 3,599.0 3,599.0 3,599.0 3,599.0
Other securities in issue 0.0 0.0 0.0 0.0 0.0
Other borrowings 40,716.0 45,712.0 51,321.0 52,347.4 53,394.4
Insurance liabilities 0.0 0.0 0.0 0.0 0.0
Other liabilities 16,615.0 18,440.0 18,440.0 18,440.0 18,440.0
Total liabilities 467,909.0 500,876.0 539,743.5 578,004.2 620,712.0
Share capital 11,082.0 10,898.0 10,898.0 10,898.0 10,898.0
Reserves 34,564.0 35,335.0 37,875.2 40,647.1 43,723.9
Shareholders' funds 45,646.0 46,233.0 48,773.2 51,545.1 54,621.9
Preference shares 1,812.0 2,812.0 2,812.0 2,812.0 2,812.0
Minority interest 2,344.0 830.0 830.0 830.0 830.0
Total equity 49,802.0 49,875.0 52,415.2 55,187.1 58,263.9
Total liabilities & equity 517,711.0 550,751.0 592,158.8 633,191.3 678,975.9

7
DBS Group
FYE 31 Dec FY17A FY18A FY19E FY20E FY21E
Key Ratios
Growth (%)
Net interest income 6.7 14.9 10.3 12.5 6.2
Non-interest income (1.2) 2.3 7.7 8.2 8.8
Operating expenses 4.7 11.4 5.3 13.1 6.9
Pre-provision profit 3.1 9.9 12.7 9.6 7.0
Core net profit (4.0) 38.3 14.4 7.9 9.7
Gross loans 7.3 6.7 6.2 6.0 6.6
Customer deposits 7.5 5.4 6.9 7.0 7.0
Total assets 7.5 6.4 7.5 6.9 7.2
Profitability (%)
Non-int. income/Total income 34.7 32.1 31.6 30.7 31.2
Average lending yields 2.36 2.78 3.41 3.56 3.57
Average financing yields 0.00 0.00 0.00 0.00 0.00
Average cost of funds 0.74 1.08 1.71 1.75 1.76
Net interest margin 1.70 1.80 1.86 1.95 1.94
Net income margin 34.10 42.67 44.61 43.34 44.45
Cost/income 43.7 44.0 42.3 43.1 43.1
Liquidity (%)
Loans/customer deposits 86.5 87.6 87.1 86.3 86.0
Asset quality (%)
Net NPL 0.3 0.2 0.2 0.1 0.1
Gross NPL 1.7 1.5 1.4 1.4 1.4
Net NPF 0.0 0.0 0.0 0.0 0.0
Gross NPF 0.0 0.0 0.0 0.0 0.0
(SP+GP)/average gross loans 0.6 0.2 0.2 0.2 0.2
(SP+GP)/average gross financing 0.0 0.0 0.0 0.0 0.0
Loan loss coverage 86.4 97.8 97.9 100.3 98.9
Capital adequacy (%)
CET1 13.9 13.9 13.5 13.4 13.3
Tier 1 capital 15.1 15.1 15.0 14.9 14.8
Risk-weighted capital 15.9 16.9 16.8 16.6 16.4
Returns (%)
ROAE 9.2 12.2 13.6 13.9 14.4
ROAA 0.8 1.1 1.1 1.1 1.2
Shareholders equity/assets 8.8 8.4 8.2 8.1 8.0
Source: Company; Maybank

8
DBS Group
Research Offices
REGIONAL
Sadiq CURRIMBHOY
Regional Head of Research & Economics (65) 6231 5836 [email protected]
WONG Chew Hann, CA
Regional Head of Institutional Research (603) 2297 8686 [email protected]
ONG Seng Yeow
Regional Head of Retail Research
(65) 6231 5839 [email protected]
ECONOMICS
Suhaimi ILIAS Chief Economist Malaysia | Philippines | China (603) 2297 8682 [email protected]
CHUA Hak Bin Regional Thematic Macroeconomist (65) 6231 5830 [email protected]
LEE Ju Ye Singapore | Thailand (65) 6231 5844 [email protected]
Linda LIU Singapore | Vietnam (65) 6231 5847 [email protected]
Dr Zamros DZULKAFLI (603) 2082 6818 [email protected]
Ramesh LANKANATHAN (603) 2297 8685 [email protected]
FX
Saktiandi SUPAAT Head of FX Research (65) 6320 1379 [email protected]
Christopher WONG (65) 6320 1347 [email protected]
Leslie TANG (65) 6320 1378 [email protected]
Fiona LIM (65) 6320 1374 [email protected]
STRATEGY
Sadiq CURRIMBHOY
Global Strategist (65) 6231 5836 [email protected]
Willie CHAN
Hong Kong | Regional (852) 2268 0631 [email protected]
FIXED INCOME
Winson PHOON, ACA (65) 6812 8807 [email protected]
Se Tho Mun Yi (603) 2074 7606 [email protected]
MALAYSIA
WONG Chew Hann, CA Head of Research (603) 2297 8686 [email protected] • Strategy
Desmond CH’NG, ACA (603) 2297 8680 [email protected] • Banking & Finance
LIAW Thong Jung (603) 2297 8688 [email protected] • Oil & Gas Services- Regional
ONG Chee Ting, CA (603) 2297 8678 [email protected] • Plantations - Regional
Mohshin AZIZ (603) 2297 8692 [email protected] • Aviation - Regional • Petrochem
YIN Shao Yang, CPA (603) 2297 8916 [email protected] • Gaming – Regional • Media
TAN Chi Wei, CFA (603) 2297 8690 [email protected] • Power • Telcos
WONG Wei Sum, CFA (603) 2297 8679 [email protected] • Property
LEE Yen Ling (603) 2297 8691 [email protected] • Glove • Ports • Shipping • Healthcare
Ivan YAP (603) 2297 8612 [email protected] • Automotive • Semiconductor • Technology
Kevin WONG (603) 2082 6824 [email protected] • REITs • Consumer Discretionary
Adrian WONG, CFA
(603) 2297 8675 [email protected] • Constructions
Jade TAM
(603) 2297 8687 [email protected] • Consumer Staples
Mohd Hafiz HASSAN (603) 2082 6819 [email protected] • Building Materials • Small & Mid Caps
Amirah AZMI (603) 2082 8769 [email protected] • Media • Plantations
TEE Sze Chiah Head of Retail Research (603) 2082 6858 [email protected]
Nik Ihsan RAJA ABDULLAH, MSTA, CFTe (603) 2297 8694 [email protected]
SINGAPORE
Neel SINHA Head of Research (65) 6231 5838 [email protected] • Strategy • Industrials • SMID Caps – Regional
CHUA Su Tye (65) 6231 5842 [email protected] • REITs
Luis HILADO (65) 6231 5848 [email protected] • Telcos • Transport
LAI Gene Lih, CFA (65) 6231 5832 [email protected] • Technology • Healthcare
Thilan WICKRAMASINGHE (65) 6231 5840 [email protected] • Banks
SZE Jia Min (65) 6231 5845 [email protected] • Consumer
INDIA
Jigar SHAH Head of Research
(91) 22 6623 2632 [email protected]
• Strategy • Oil & Gas • Automobile • Cement
Neerav DALAL
(91) 22 6623 2606 [email protected]
• Software Technology • Telcos
Vishal PERIWAL
(91) 22 6623 2605
• Infrastructure
INDONESIA
Isnaputra ISKANDAR Head of Research (62) 21 8066 8680 [email protected] • Strategy • Metals & Mining • Cement
Rahmi MARINA (62) 21 8066 8689 [email protected] • Banking & Finance
Aurellia SETIABUDI (62) 21 8066 8691 [email protected] • Property
Janni ASMAN (62) 21 8066 8687 [email protected] • Cigarette • Healthcare • Retail
Luthfi RIDHO (62) 21 8066 8690 [email protected] • Economics
PHILIPPINES
Minda OLONAN Head of Research (63) 2 849 8840 [email protected] • Strategy • Conglomerates
Katherine TAN (63) 2 849 8843 [email protected] • Banks • Conglomerates • Ports
Luis HILADO (65) 6231 5848 [email protected] • Telcos
Romel LIBO-ON (63) 2 849 8844 [email protected] • Property
Kayzer LLANDA (63) 2 849 8839 [email protected] • Utilities
THAILAND
Maria LAPIZ Head of Institutional Research Dir (66) 2257 0250 | (66) 2658 6300 ext 1399 [email protected] • Strategy • Consumer • Materials • Services
Teerapol Udomvej, CFA (66) 2658 6300 ext 1394 [email protected] • Healthcare
Ekachai TARAPORNTIP Head of Retail Research (66) 2658 5000 ext 1530 [email protected]
Sutthichai KUMWORACHAI Deputy Head (66) 2658 5000 ext 1400 [email protected] • Energy • Petrochem
Surachai PRAMUALCHAROENKIT (66) 2658 5000 ext 1470 [email protected] • Auto • Conmat • Contractor • Steel
Suttatip PEERASUB (66) 2658 5000 ext 1430 [email protected] • Media • Commerce
Termporn TANTIVIVAT (66) 2658 5000 ext 1520 [email protected] • Property
Jaroonpan WATTANAWONG (66) 2658 5000 ext 1404 [email protected] • Transportation • Small cap
Thanatphat SUKSRICHAVALIT (66) 2658 5000 ext 1401 [email protected] • Media • Electronics
Sorrabhol VIRAMETEEKUL Head of Digital Research (66) 2658 5000 ext 1550 [email protected] • Food, Transportation
Wijit ARAYAPISIT (66) 2658 5000 ext 1450 [email protected] • Strategist
Kritsapong PATAN (66) 2658 5000 ext 1310 [email protected] • Chartist
Apisit PATTARASAKOLKIAT (66) 2658 5000 ext 1405 [email protected] • Chartist
VIETNAM
LE Hong Lien, ACCA Head of Institutional Research (84 28) 44 555 888 x 8181 [email protected] • Strategy • Consumer • Diversified
THAI Quang Trung, CFA Deputy Head of Institutional Research (84 28) 44 555 888 x 8180 [email protected] • Real Estate • Construction • Materials
LE Nguyen Nhat Chuyen (84 28) 44 555 888 x 8082 [email protected] • Oil & Gas
QUAN Trong Thanh (84 28) 44 555 888 x 8184 [email protected] • Banks
NGUYEN Thi Ngan Tuyen Head of Retail Research (84 28) 44 555 888 x 8081 [email protected] • Food & Beverage • Oil&Gas • Banking
TRUONG Quang Binh Deputy Head of Retail Research (84 28) 44 555 888 x 8087 [email protected] • Rubber Plantation • Tyres & Tubes • Oil & Gas
TRINH Thi Ngoc Diep (84 28) 44 555 888 x 8208 [email protected] • Technology • Utilities • Construction
NGUYEN Thi Sony Tra Mi (84 28) 44 555 888 x 8084 [email protected] • Port Operation • Pharmaceutical • Food & Beverage
NGUYEN Thanh Lam (84 28) 44 555 888 x 8086 [email protected] • Technical Analysis
9
DBS Group
APPENDIX I: TERMS FOR PROVISION OF REPORT, DISCLAIMERS AND DISCLOSURES DISCLAIMERS This research report is prepared for general circulation and for information purposes only and under no circumstances should it be considered or intended as an offer to sell or a solicitation of an offer to buy the securities referred to herein. Investors should note that values of such securities, if any, may fluctuate and that each security’s price or value may rise or fall. Opinions or recommendations contained herein are in form of technical ratings and fundamental ratings. Technical ratings may differ from fundamental ratings as technical valuations apply different methodologies and are purely based on price and volume-related information extracted from the relevant jurisdiction’s stock exchange in the equity analysis. Accordingly, investors’ returns may be less than the original sum invested. Past performance is not necessarily a guide to future performance. This report is not intended to provide personal investment advice and does not take into account the specific investment objectives, the financial situation and the particular needs of persons who may receive or read this report. Investors should therefore seek financial, legal and other advice regarding the appropriateness of investing in any securities or the investment strategies d iscussed or recommended in this report.
The information contained herein has been obtained from sources believed to be reliable but such sources have not been independently verified by Maybank Investment Bank Berhad, i ts subsidiary and affiliates (collectively, “MKE”) and consequently no representation is made as to the accuracy or completeness of this report by MKE and it should not be relied upon as such. Accordingly, MKE and its officers, directors, associates, connected parties and/or employees (collectively, “Representatives” ) shall not be liable for any direct, indirect or consequential losses or damages that may arise from the use or reliance of this report. Any information, opinions or recommendations contained h erein are subject to change at any time, without prior notice.
This report may contain forward looking statements which are often but not always identified by the use of words such as “anticipate”, “believe”, “estimate”, “intend”, “plan”, “expect”, “forecast”, “predict” and “project” and statements that an event or result “may”, “will”, “can”, “should”, “could” or “might” occur or be achieved and other similar expressions. Such forward looking statements are based on assumptions made and information currently available to us and are subject to certain risks and uncertainties that could cause the actual results to differ materially from those expressed in any forward looking statements. Readers are cautioned not to place undue relevance on these forward -looking statements. MKE expressly disclaims any obligation to update or revise any such forward looking statements to reflect new information, events or circumstances after the date of this publication or to reflect the occurrence of unanticipated events.
MKE and its officers, directors and employees, including persons involved in the preparation or issuance of this report, may, to the extent permitted by law, from time to time participate or invest in financing transactions with the issuer(s) of the securities mentioned in this report, perform services for or solic it business from such issuers, and/or have a position or holding, or other material interest, or effect transactions, in such securities or options thereon, or other investments related thereto. In addition, it may make markets in the securities mentioned in the material presented in this report. One or more directors, officers and/or employees of MKE may be a director of the issuers of the securities mentioned in this report to the extent permitted by law.
This report is prepared for the use of MKE’s clients and may not be reproduced, altered in any way, transmitted to, copied or distributed to any other party in whole or in part in any form or manner without the prior express written consent of MKE and MKE and its Representatives accepts no liability whatsoever for the actions of third parties in this respect.
This report is not directed to or intended for distribution to or use by any person or entity who is a citizen or resident of or located in any locality, state, country or other jurisdiction where such distribution, publication, availability or use would be contrary to law or regulation. This report is for distribution only under such circumstances as may be permitted by applicable law. The securities described herein may not be eligible for sale in all jurisdictions or to certain categories of investors. Without prejudice to the foregoing, the reader is to note that additional disclaimers, warnings or qualifications may apply based on geographical location of the person or entity receiving this repor t.
Malaysia Opinions or recommendations contained herein are in the form of technical ratings and fundamental ratings. Technical ratings may differ from fundamental ratings as technical valuations apply different methodologies and are purely based on price and volume-related information extracted from Bursa Malaysia Securities Berhad in the equity analysis.
Singapore This report has been produced as of the date hereof and the information herein may be subject to change. Maybank Kim Eng Research Pte. Ltd. (“Maybank KERPL”) in Singapore has no obligation to update such information for any recipient. For distribution in Singapore, recipients of this report are to contact Maybank KERPL in Singapore in respect of any matters arising from, or in connection with, this report. If the recipient of this report is not an accredited investor, expert investor or institutional investor (as defined under Section 4A of the Singapore Securities and Futures Act), Maybank KERPL shall be legally liable for the contents of this report, with such liability being limited to the extent (if any) as permitted by law.
Thailand Except as specifically permitted, no part of this presentation may be reproduced or distributed in any manner without the prior written permission of Maybank Kim Eng Securities (Thailand) Public Company Limited. Maybank Kim Eng Securities (Thailand) Public Company Limited (“MBKET”) accepts no liability whatsoever for the actions of third parties in this respect.
Due to different characteristics, objectives and strategies of institutional and retail investors, the research reports of MBKET Institutional and Retail Research Department may differ in either recommendation or target price, or both. MBKET Retail Research is intended for retail investors (http://kelive.maybank-ke.co.th) while Maybank Kim Eng Institutional Research is intended only for institutional investors based outside Thailand only.
The disclosure of the survey result of the Thai Institute of Directors Association (“IOD”) regarding corporate governance is made pursuant to the policy of the Office of the Securities and Exchange Commission. The survey of the IOD is based on the information of a company listed on the Stock Exchange of Thailand and the market for Alternative Investment disclosed to the public and able to be accessed by a general public investor. The result, therefore, is from the perspective of a third party. It is not an evaluation of operat ion and is not based on inside information. The survey result is as of the date appearing in the Corporate Governance Report of Thai Listed Companies. As a result, the survey may be changed after that date. MBKET does not confirm nor certify the accuracy of such survey result.
The disclosure of the Anti-Corruption Progress Indicators of a listed company on the Stock Exchange of Thailand, which is assessed by Thaipat Institute, is made in order to comply with the policy and sustainable development plan for the listed companies of the Office of the Securities and Exchange Commission. Tha ipat Institute made this assessment based on the information received from the listed company, as stipulated in the form for the assessment of Anti-corruption which refers to the Annual Registration Statement (Form 56-1), Annual Report (Form 56-2), or other relevant documents or reports of such listed company. The assessment result is therefore made from the perspective of Thaipat Institute that is a third party. It is not an assessment of operation and is not based on any inside information. Since this assessment is only the assessment result as of the date appearing in the assessment result, it may be changed after that date or when there is any change to the relevant information. Nevertheless, MBKET does not confirm, verify, or certify the accuracy and completeness of the assessment result.
US This third-party research report is distributed in the United States (“US”) to Major US Institutional Investors (as defined in Rule 15a -6 under the Securities Exchange Act of 1934, as amended) only by Maybank Kim Eng Securities USA Inc (“Maybank KESUSA”), a broker-dealer registered in the US (registered under Section 15 of the Securities Exchange Act of 1934, as amended). All responsibility for the distribution of this report by Maybank KESUSA in the US shall be borne by Maybank KESUSA. This report is not directed at you if MKE is prohibited or restricted by any legislation or regulation in any jurisdiction from making it available to you. You should satisfy yourself before reading it that Maybank KESUSA is permitted to provide research material concerning investments to you under relevant legislation and regulations. All U.S. persons receiving and/or accessing this report and wishing to eff ect transactions in any security mentioned within must do so with: Maybank Kim Eng Securities USA Inc. 400 Park Avenue, 11th Floor, New York, New York 10022, 1-(212) 688-8886 and not with, the issuer of this report.

10
DBS Group
Disclosure of Interest
Malaysia: MKE and its Representatives may from time to time have positions or be materially interested in the securities referred to he rein and may further act as market maker or may have assumed an underwriting commitment or deal with such securities and may also perform or seek to perform investment banking services, advisory and other services for or relating to those companies. Singapore: As of 21 May 2019, Maybank KERPL and the covering analyst do not have any interest in any companies recommended in this research report. Thailand: MBKET may have a business relationship with or may possibly be an issuer of derivative warrants on the securities /companies mentioned in the research report. Therefore, Investors should exercise their own judgment before making any investment decisions. MBKET, its associates, directors, connected parties and/or employees may from time to time have interests and/or underwriting commitments in the securities mentioned in this report. Hong Kong: As of 21 May 2019, KESHK and the authoring analyst do not have any interest in any companies recommended in this research report. India: As of 21 May 2019, and at the end of the month immediately preceding the date of publication of the research report, KESI, authoring analyst or their associate / relative does not hold any financial interest or any actual or beneficial ownership in any shares or having any conflict of interest in the subject companies except as otherwise disclosed in the research report.
In the past twelve months KESI and authoring analyst or their associate did not receive any compensation or other benefits from the subject companies or third party in connection wi th the research report on any account what so ever except as otherwise disclosed in the research report.
MKE may have, within the last three years, served as manager or co-manager of a public offering of securities for, or currently may make a primary market in issues of, any or all of the entities mentioned in this report or may be providing, or have provided within the previous 12 months, significant advice or investment services in relation to the investment concerned or a related investment and may receive compensation for the services provided from the companies covered in this report.
OTHERS
Analyst Certification of Independence
The views expressed in this research report accurately reflect the analyst’s personal views about any and all of the subject securities or issuers; and no part of the research analyst’s compensation was, is or will be, directly or indirectly, related to the specific recommendations or views expressed in the report.
Reminder
Structured securities are complex instruments, typically involve a high degree of risk and are intended for sale only to soph isticated investors who are capable of understanding and assuming the risks involved. The market value of any structured security may be affected by changes in economic, financial and political factors (including, but not limited to, spot and forward interest and exchange rates), time to maturity, market conditions and volatility and the credit quality of any issuer or reference issuer. Any investor interested in purchasing a structured product should conduct its own analysis of the product and consult with its own professional advisers as to the risks involved in making such a purchase.
No part of this material may be copied, photocopied or duplicated in any form by any means or redistributed without the prior consent of MKE.
UK This document is being distributed by Maybank Kim Eng Securities (London) Ltd (“Maybank KESL”) which is authorized and regula ted, by the Financial Conduct Authority and is for Informational Purposes only. This document is not intended for distribution to anyone defined as a Retail Client under the Financial Services and Markets Act 2000 within the UK. Any inclusion of a third party link is for the recipients convenience only, and that the firm does not take any responsibility for its comments or accuracy, and that access to such links is at the individuals own risk. Nothing in this report should be considered as constituting legal, accounting or tax advice, and that f or accurate guidance recipients should consult with their own independent tax advisers.
DISCLOSURES
Legal Entities Disclosures Malaysia: This report is issued and distributed in Malaysia by Maybank Investment Bank Berhad (15938- H) which is a Participating Organization of Bursa Malaysia Berhad and a holder of Capital Markets and Services License issued by the Securities Commission in Malaysia. Singapore: This report is distributed in Singapore by Maybank KERPL (Co. Reg No 198700034E) which is regulated by the Monetary Authority of Singapore. Indonesia: PT Maybank Kim Eng Securities (“PTMKES”) (Reg. No. KEP-251/PM/1992) is a member of the Indonesia Stock Exchange and is regulated by the Financial Services Authority (Indonesia). Thailand: MBKET (Reg. No.0107545000314) is a member of the Stock Exchange of Thailand and is regulated by the Ministry of Finance and the Securities and Exchange Commission. Philippines: Maybank ATRKES (Reg. No.01-2004-00019) is a member of the Philippines Stock Exchange and is regulated by the Securities and Exchange Commission. Vietnam: Maybank Kim Eng Securities Limited (License Number: 117/GP-UBCK) is licensed under the State Securities Commission of Vietnam. Hong Kong: KESHK (Central Entity No AAD284) is regulated by the Securities and Futures Commission. India: Kim Eng Securities India Private Limited (“KESI”) is a participant of the National Stock Exchange of India Limited and the Bombay Stock Exchange and is regulated by Securities and Exchange Board of India (“SEBI”) (Reg. No. INZ000010538). KESI is also registered with SEBI as Category 1 Merchant Banker (Reg. No. INM 000011708) and as Research Analyst (Reg No: INH000000057) US: Maybank KESUSA is a member of/ and is authorized and regulated by the FINRA – Broker ID 27861. UK: Maybank KESL (Reg No 2377538) is authorized and regulated by the Financial Conduct Authority.
11
DBS Group
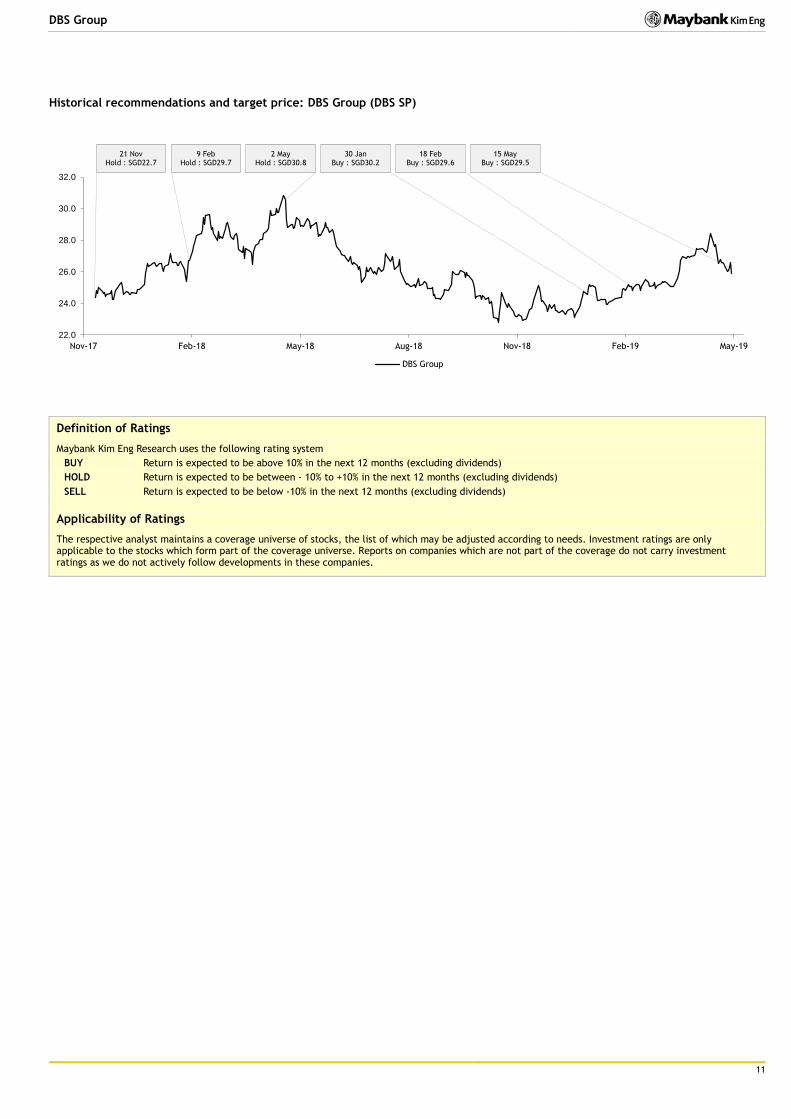
Historical recommendations and target price: DBS Group (DBS SP)
Definition of Ratings
Maybank Kim Eng Research uses the following rating system
BUY Return is expected to be above 10% in the next 12 months (excluding dividends)
HOLD Return is expected to be between - 10% to +10% in the next 12 months (excluding dividends)
SELL Return is expected to be below -10% in the next 12 months (excluding dividends)
Applicability of Ratings
The respective analyst maintains a coverage universe of stocks, the list of which may be adjusted according to needs. Investment ratings are only applicable to the stocks which form part of the coverage universe. Reports on companies which are not part of the coverage do not carry investment ratings as we do not actively follow developments in these companies.
22.0
24.0
26.0
28.0
30.0
32.0
Nov-17 Feb-18 May-18 Aug-18 Nov-18 Feb-19 May-19
DBS Group
21 Nov Hold : SGD22.7
9 Feb Hold : SGD29.7
2 May Hold : SGD30.8
30 Jan Buy : SGD30.2
18 Feb Buy : SGD29.6
15 May Buy : SGD29.5

12
DBS Group
Malaysia Maybank Investment Bank Berhad
(A Participating Organisation of
Bursa Malaysia Securities Berhad)
33rd Floor, Menara Maybank,
100 Jalan Tun Perak,
50050 Kuala Lumpur
Tel: (603) 2059 1888;
Fax: (603) 2078 4194
Singapore Maybank Kim Eng Securities Pte Ltd
Maybank Kim Eng Research Pte Ltd
50 North Canal Road
Singapore 059304
Tel: (65) 6336 9090
London Maybank Kim Eng Securities
(London) Ltd
PNB House
77 Queen Victoria Street
London EC4V 4AY, UK
Tel: (44) 20 7332 0221
Fax: (44) 20 7332 0302
New York Maybank Kim Eng Securities USA
Inc
400 Park Avenue, 11th Floor
New York, New York 10022,
U.S.A.
Tel: (212) 688 8886
Fax: (212) 688 3500
Stockbroking Business:
Level 8, Tower C, Dataran Maybank,
No.1, Jalan Maarof
59000 Kuala Lumpur
Tel: (603) 2297 8888
Fax: (603) 2282 5136
Hong Kong Kim Eng Securities (HK) Ltd
28/F, Lee Garden Three,
1 Sunning Road, Causeway Bay,
Hong Kong
Tel: (852) 2268 0800
Fax: (852) 2877 0104
Indonesia PT Maybank Kim Eng Securities
Sentral Senayan III, 22nd Floor
Jl. Asia Afrika No. 8
Gelora Bung Karno, Senayan
Jakarta 10270, Indonesia
Tel: (62) 21 2557 1188
Fax: (62) 21 2557 1189
India Kim Eng Securities India Pvt Ltd
2nd Floor, The International,
16, Maharishi Karve Road,
Churchgate Station,
Mumbai City - 400 020, India
Tel: (91) 22 6623 2600
Fax: (91) 22 6623 2604
Philippines Maybank ATR Kim Eng Securities Inc.
17/F, Tower One & Exchange Plaza
Ayala Triangle, Ayala Avenue
Makati City, Philippines 1200
Tel: (63) 2 849 8888
Fax: (63) 2 848 5738
Thailand Maybank Kim Eng Securities
(Thailand) Public Company Limited
999/9 The Offices at Central World,
20th - 21st Floor,
Rama 1 Road Pathumwan,
Bangkok 10330, Thailand
Tel: (66) 2 658 6817 (sales)
Tel: (66) 2 658 6801 (research)
Vietnam Maybank Kim Eng Securities Limited
4A-15+16 Floor Vincom Center Dong
Khoi, 72 Le Thanh Ton St. District 1
Ho Chi Minh City, Vietnam
Tel : (84) 844 555 888
Fax : (84) 8 38 271 030
Saudi Arabia In association with
Anfaal Capital
Villa 47, Tujjar Jeddah
Prince Mohammed bin Abdulaziz
Street P.O. Box 126575
Jeddah 21352
Tel: (966) 2 6068686
Fax: (966) 26068787
South Asia Sales Trading Kevin Foy
Regional Head Sales Trading
Tel: (65) 6636-3620
US Toll Free: 1-866-406-7447
North Asia Sales Trading Andrew Lee
Tel: (852) 2268 0283
US Toll Free: 1 877 837 7635
Indonesia Iwan Atmadjaja [email protected] (62) 21 8066 8555
London Greg Smith [email protected] Tel: (44) 207-332-0221
New York James Lynch [email protected] Tel: (212) 688 8886
India Sanjay Makhija [email protected] Tel: (91)-22-6623-2629
Philippines Keith Roy [email protected] Tel: (63) 2 848-5288
www.maybank-ke.com | www.maybank-keresearch.com