dc2 postmortem association pipeline. ap architecture 3 main phases for each visit –load: current...
TRANSCRIPT
DC2 Postmortem
Association Pipeline
AP Architecture
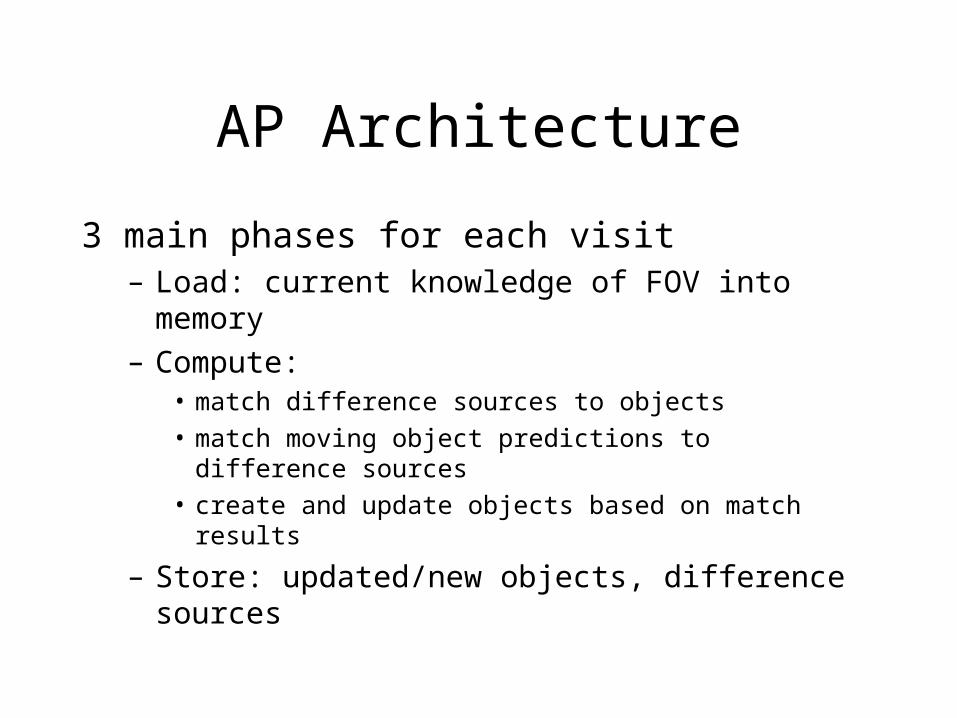
3 main phases for each visit– Load: current knowledge of FOV into memory– Compute:
• match difference sources to objects• match moving object predictions to difference sources• create and update objects based on match results
– Store: updated/new objects, difference sources
AP Architecture: Database + files
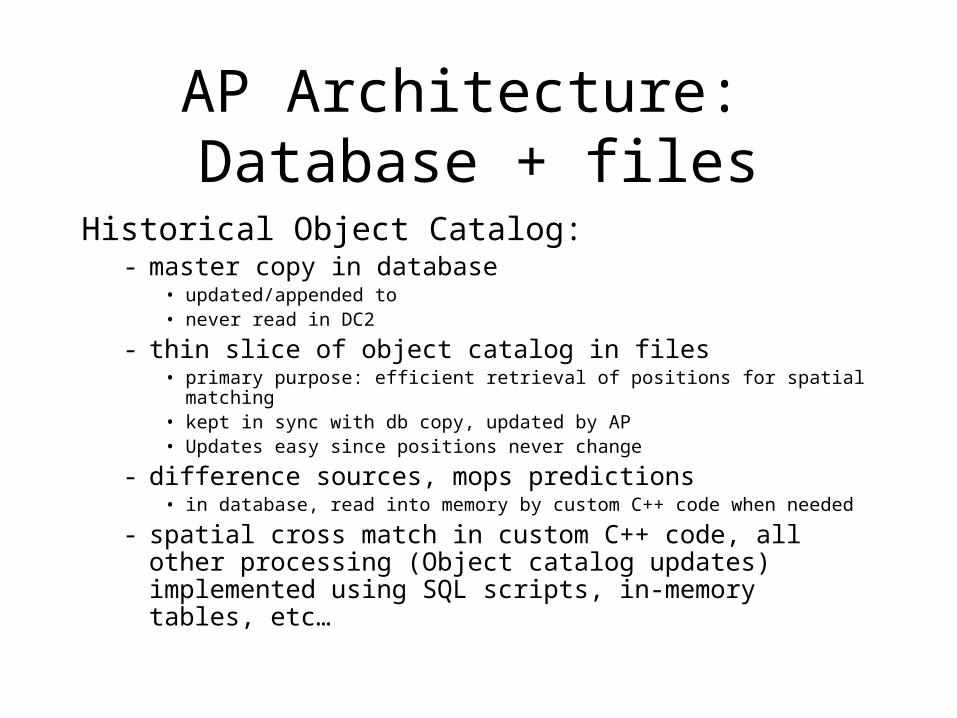
Historical Object Catalog:- master copy in database
• updated/appended to• never read in DC2
- thin slice of object catalog in files• primary purpose: efficient retrieval of positions for spatial matching• kept in sync with db copy, updated by AP• Updates easy since positions never change
- difference sources, mops predictions• in database, read into memory by custom C++ code when needed
- spatial cross match in custom C++ code, all other processing (Object catalog updates) implemented using SQL scripts, in-memory tables, etc…

AP Performance: Data Volume
DC2:• 417,327 objects in Object catalog (all in a single FOV)• FOV is ~1 deg2
• Getting 5k difference sources per FOV worst case• 22 moving object predictions worst case
Production:• Up to 10 million objects per FOV, 14 to 49 billion objects (DR1 -
DR11) total• FOV is 10 deg2
• 100k difference sources per FOV worst case• 2.5k moving object predictions per FOV worst case

AP Architecture: Load– Sky is partitioned into chunks (ra/dec boxes). For each
chunk:• 1 file stores objects from the input Object catalog (i.e. the
product of Deep Detect) within the chunk• 1 delta file stores new objects accumulated during visit
processing
– Multiple slices read these chunk files in parallel• DC2:
– one slice only– files read/written over NFS– all visits have essentially the same FOV (in terms of chunks)
– Objects are loaded into a shared memory region– Master creates a spatial index for objects on the fly
• all slices must run on the same machine as the master

AP Performance: Load
Run rlp0128
0
0.05
0.1
0.15
0.2
1 5 9 13 17 21 25 29 33 37 41 45 49 53 57 61
Visit
Time (sec)
Run rlp0130
0
0.02
0.04
0.06
0.08
0.1
0.12
1 5 9 13 17 21 25 29 33 37 41 45 49 53 57 61
Visit
Time (sec)
Reading chunk files (object positions)
• Timing included for completeness but not very meaningful
• Data lives on NFS volume - contention with other pipelines
• But, same chunks are read every visit - reads are from cache

AP Performance: Load
Building zone index for objects
• 0.33 - 0.34 seconds on average
• increases over consecutive visits since new objects are being created
• visit 1: 417,327 objects visit 62: ~450k objects (depends on run)
Run rlp0128
0.290.3
0.310.320.330.340.350.36
1 5 9 13 17 21 25 29 33 37 41 45 49 53 57 61
Visit
Time (sec)
Run rlp0130
0.29
0.3
0.31
0.32
0.33
0.34
0.35
1 5 9 13 17 21 25 29 33 37 41 45 49 53 57 61
Visit
Time (sec)
AP Architecture: Compute
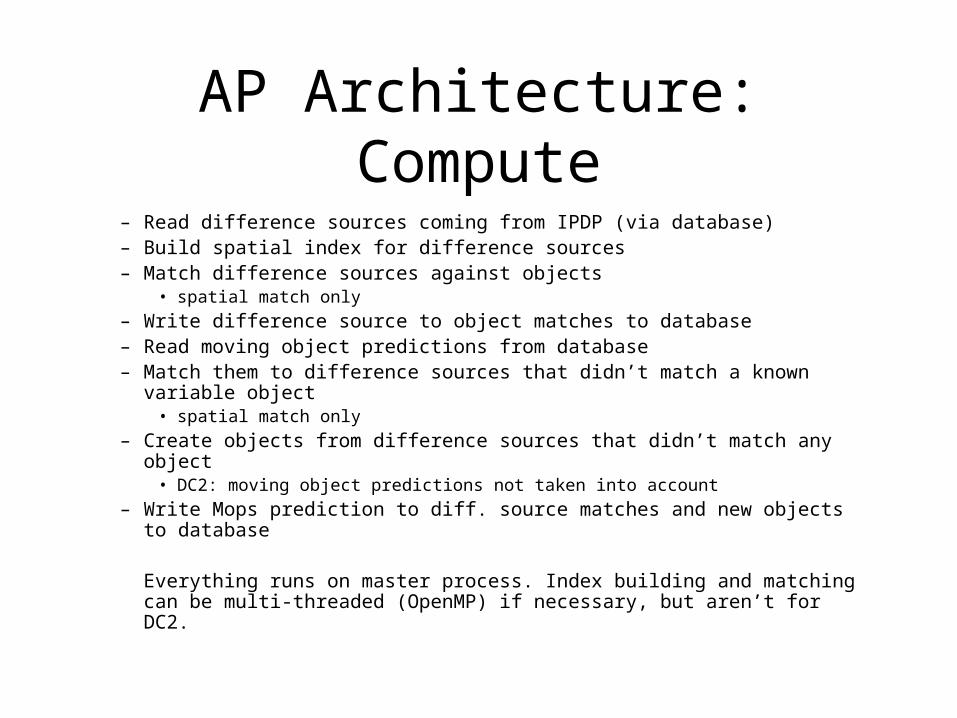
– Read difference sources coming from IPDP (via database) – Build spatial index for difference sources– Match difference sources against objects
• spatial match only
– Write difference source to object matches to database– Read moving object predictions from database– Match them to difference sources that didn’t match a known variable
object• spatial match only
– Create objects from difference sources that didn’t match any object• DC2: moving object predictions not taken into account
– Write Mops prediction to diff. source matches and new objects to database
Everything runs on master process. Index building and matching can be multi-threaded (OpenMP) if necessary, but aren’t for DC2.

AP Performance: ComputeReading difference sources from database
Run rlp0128
00.10.20.30.40.50.60.7
1 5 9 13 17 21 25 29 33 37 41 45 49 53 57 61
Visit
Time (sec)
Run rlp0128
0
1000
2000
3000
4000
5000
6000
1 5 9 13 17 21 25 29 33 37 41 45 49 53 57 61
Visit
# of sources
Run rlp0130
00.05
0.10.15
0.20.25
0.30.35
0.4
1 5 9 13 17 21 25 29 33 37 41 45 49 53 57 61
Visit
Time (sec)
Run rlp0130
0500
100015002000250030003500
1 5 9 13 17 21 25 29 33 37 41 45 49 53 57 61
Visit
# of sources
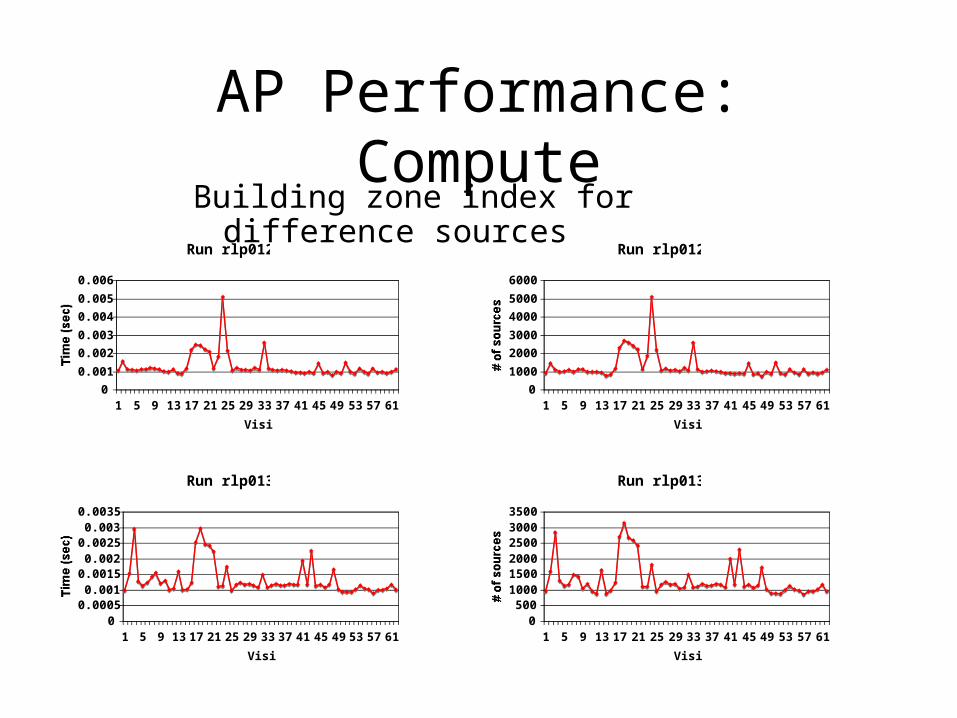
AP Performance: ComputeBuilding zone index for difference sources
Run rlp0128
0
1000
2000
3000
4000
5000
6000
1 5 9 13 17 21 25 29 33 37 41 45 49 53 57 61
Visit
# of sources
Run rlp0130
0500
100015002000250030003500
1 5 9 13 17 21 25 29 33 37 41 45 49 53 57 61
Visit
# of sources
Run rlp0128
0
0.001
0.002
0.003
0.004
0.005
0.006
1 5 9 13 17 21 25 29 33 37 41 45 49 53 57 61
Visit
Time (sec)
Run rlp0130
00.0005
0.0010.0015
0.0020.0025
0.0030.0035
1 5 9 13 17 21 25 29 33 37 41 45 49 53 57 61
Visit
Time (sec)
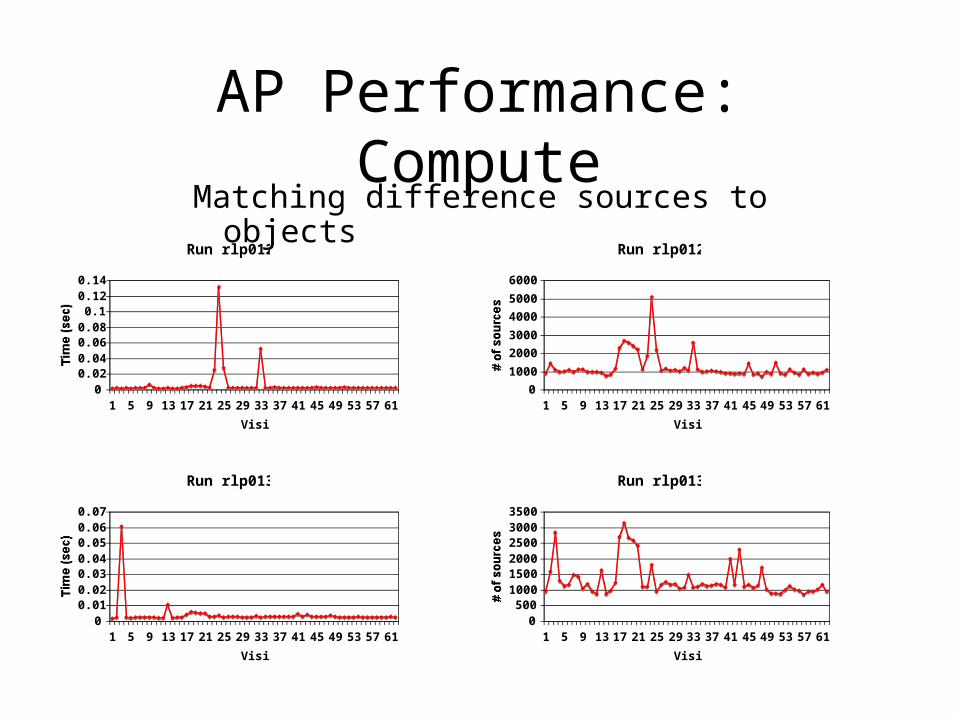
AP Performance: ComputeMatching difference sources to objects
Run rlp0128
0
1000
2000
3000
4000
5000
6000
1 5 9 13 17 21 25 29 33 37 41 45 49 53 57 61
Visit
# of sources
Run rlp0130
0500
100015002000250030003500
1 5 9 13 17 21 25 29 33 37 41 45 49 53 57 61
Visit
# of sources
Run rlp0128
00.020.040.060.08
0.10.120.14
1 5 9 13 17 21 25 29 33 37 41 45 49 53 57 61
Visit
Time (sec)
Run rlp0130
00.010.020.030.040.050.060.07
1 5 9 13 17 21 25 29 33 37 41 45 49 53 57 61
Visit
Time (sec)
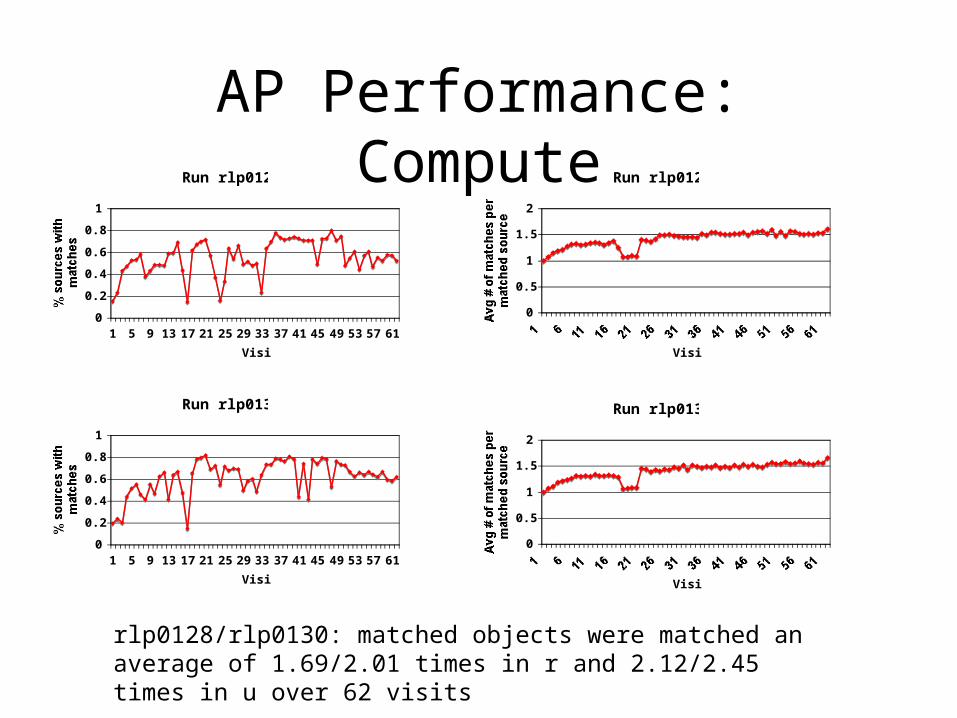
AP Performance: Compute
Run rlp0130
0
0.2
0.4
0.6
0.8
1
1 5 9 13 17 21 25 29 33 37 41 45 49 53 57 61
Visit
% sources with
matches
Run rlp0128
0
0.2
0.4
0.6
0.8
1
1 5 9 13 17 21 25 29 33 37 41 45 49 53 57 61
Visit
% sources with
matches
Run rlp0128
0
0.5
1
1.5
2
1 6 11 16 21 26 31 36 41 46 51 56 61
Visit
Avg # of matches per matched source
Run rlp0130
0
0.5
1
1.5
2
1 6 11 16 21 26 31 36 41 46 51 56 61
Visit
Avg # of matches per matched source
rlp0128/rlp0130: matched objects were matched an average of 1.69/2.01 times in r and 2.12/2.45 times in u over 62 visits
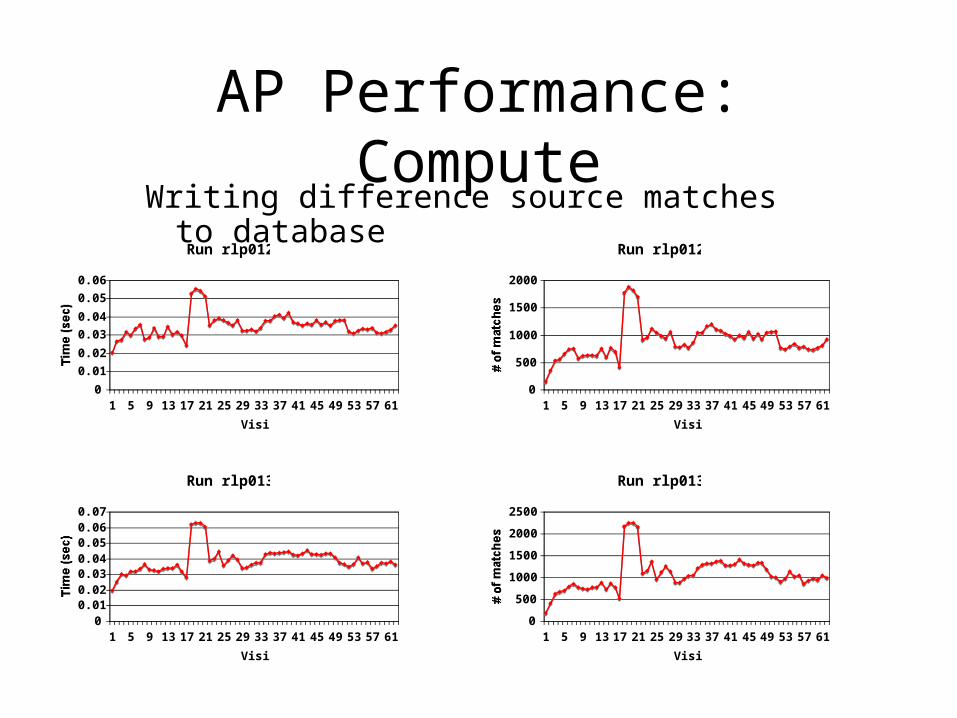
AP Performance: ComputeWriting difference source matches to database
Run rlp0128
0
500
1000
1500
2000
1 5 9 13 17 21 25 29 33 37 41 45 49 53 57 61
Visit
# of matches
Run rlp0130
0
500
1000
1500
2000
2500
1 5 9 13 17 21 25 29 33 37 41 45 49 53 57 61
Visit
# of matches
Run rlp0128
0
0.01
0.02
0.03
0.04
0.05
0.06
1 5 9 13 17 21 25 29 33 37 41 45 49 53 57 61
Visit
Time (sec)
Run rlp0130
00.010.020.030.040.050.060.07
1 5 9 13 17 21 25 29 33 37 41 45 49 53 57 61
Visit
Time (sec)

AP Performance: ComputeReading mops predictions from database
Run rlp0128
0
5
10
15
20
25
1 5 9 13 17 21 25 29 33 37 41 45 49 53 57 61Visit
# of predictions
Run rlp0128
0.012
0.013
0.014
0.015
0.016
0.017
1 5 9 13 17 21 25 29 33 37 41 45 49 53 57 61
Visit
Time (sec)
Run rlp0130
0
5
10
15
20
25
1 5 9 13 17 21 25 29 33 37 41 45 49 53 57 61
Visit
Time (sec)
Run rlp0130
0
0.005
0.01
0.015
0.02
0.025
1 5 9 13 17 21 25 29 33 37 41 45 49 53 57 61
Visit
Time (sec)

AP Performance: Compute• Matching mops predictions to diff. sources
• ~0.1 ms (~20 predictions and error ellipses are clamped to 10 arc-seconds)
• Creating new objects
Run rlp0128
0
0.001
0.002
0.003
0.004
0.005
1 5 9 13 17 21 25 29 33 37 41 45 49 53 57 61
Visit
Time (sec)
Run rlp0128
0
1000
2000
3000
4000
5000
6000
1 7 13 19 25 31 37 43 49 55 61
Visit
Count
New ObjectsDiff Sources
Run rlp0130
0
0.0005
0.001
0.0015
0.002
0.0025
1 5 9 13 17 21 25 29 33 37 41 45 49 53 57 61
Visit
Time (sec)
Run rlp0130
0500
100015002000250030003500
1 7 13 19 25 31 37 43 49 55 61
Visit
Count
New ObjectsDiff Sources

AP Performance: ComputeWriting mops predictions and new objects to
database
Run rlp0128
00.010.020.030.040.050.060.070.08
1 8 15 22 29 36 43 50 57
Visit
Time (sec)
Mops matchesNew Objects
Run rlp0130
0
0.01
0.02
0.03
0.04
0.05
1 8 15 22 29 36 43 50 57
Visit
Time (sec)
Mops matchesNew Ojects

AP Architecture: Store– Multiple slices write chunk delta files in parallel
• these files contain object positions for objects accumulated during visit processing
• DC2: 1 slice, data lives on NFS
– Master launches MySQL scripts that use database outputs of compute phase:
• Update Object catalog. For DC2 this is– # of times an object was observed in a given filter– Latest observation time of an object
• Insert new objects into Object catalog • Append difference sources for visit to DIASource table• Append various per-visit result tables to historical tables (for
debugging)• Drop per-visit tables

AP Performance: Store
Writing chunk delta files (positions for objects created during visit processing)
Run rlp0128
0
0.2
0.4
0.6
0.8
1
1.2
1 5 9 13 17 21 25 29 33 37 41 45 49 53 57 61
Visit
Time (sec)
Run rlp0130
0
0.2
0.4
0.6
0.8
1
1.2
1 5 9 13 17 21 25 29 33 37 41 45 49 53 57 61
Visit
Time (sec)
Wild swings in timing due to NFS contention
• IPDP is often loading science/template exposures as AP ends (AP was configured to write chunk deltas to NFS volume).
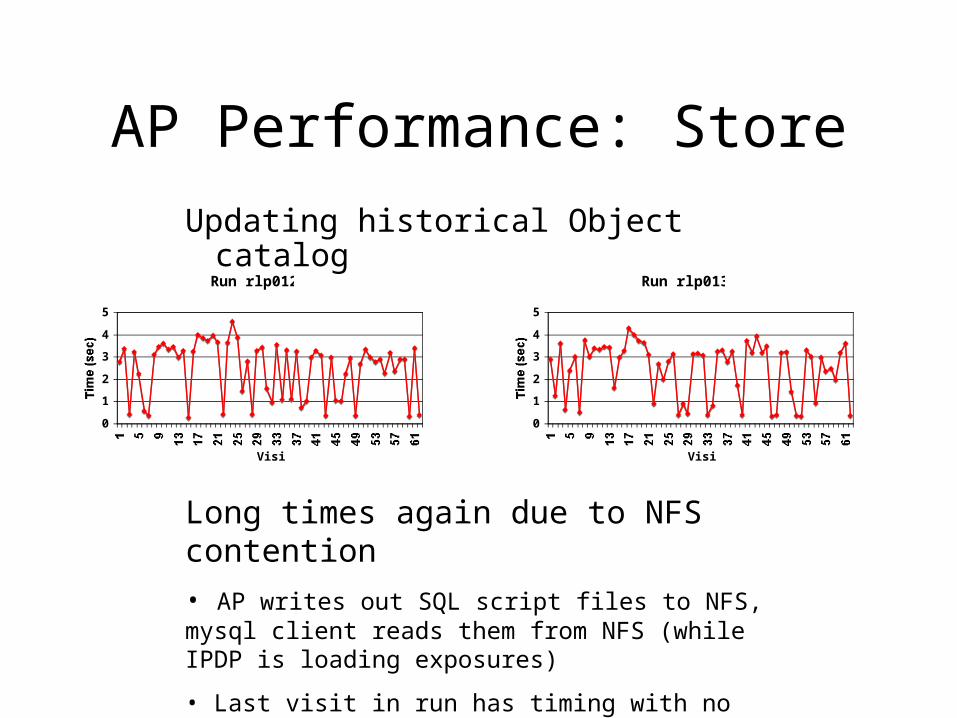
AP Performance: Store
Updating historical Object catalog
Run rlp0130
0
1
2
3
4
5
1 5 9 13 17 21 25 29 33 37 41 45 49 53 57 61Visit
Time (sec)
Long times again due to NFS contention
• AP writes out SQL script files to NFS, mysql client reads them from NFS (while IPDP is loading exposures)
• Last visit in run has timing with no interference from other pipelines (~0.4s)
Run rlp0128
0
1
2
3
4
5
1 5 9 13 17 21 25 29 33 37 41 45 49 53 57 61Visit
Time (sec)

AP Performance: StoreDatabase cleanup:• append per-visit tables to per-run accumulator tables• drop per-visit tables
Run rlp0130
0
1
2
3
4
5
1 5 9 13 17 21 25 29 33 37 41 45 49 53 57 61Visit
Time (sec)
Suspected culprit - NFS again
Run rlp0128
0
1
2
3
4
5
1 5 9 13 17 21 25 29 33 37 41 45 49 53 57 61Visit
Time (sec)
Conclusions
• For the small amounts of data in DC2, AP performs to spec (1.6s - 10s) despite some configuration problems
• Don’t use NFS• Matching is fast: but need to run with more
input data to make strong claims about performance
• Need to plug-in algorithms which make use of non-spatial data to really test the AP design