dccument resume - eric · dccument resume. 24. re 003 955. author liberman, ... nonsight set and...
TRANSCRIPT

ED 058 009
DCCUMENT RESUME
24 RE 003 955
AUTHOR Liberman, Isabelle Y.; Shankweiler, DonaldTITLE Snvestigation of Reversal Errors in Reading in Normal
and Poor Readers as Related to Critical Factors inReading Materials. Final Report.
INSTITUTION Connecticut Univ., Storrs.SPONS AGENCY Office of Education (DHEW), Washington, D.C. Bureau
of Research.BUREAU NO BR-0-A-010PUB DATE Aug 71GRANT 0EG-1-7-0007(509)NOTE 6913.
EDRS PRICE MF-$0.65 HC-$3.29DESCRIPTORS Average Students; Discrimination Learning; *Error
Patterns; *Grade 2; Letters (Alphabet); PhonologicalUnits; Reading Ability; *Reading Difficulty; ReadingMaterials; Reading Processes; *Reading Research;*Retarded Readers; Word Recognition
ABSTRACTReversals in poor and normal second-grade readers
were studied in relation to their whole phonological error pattern inreading real words and nonsense syllables. Error categories includedsequence and orientation reversals, other consonants, vowels, andtotal error. Reversals occurred in quantity only in poor readers,with large individual differences. Overall error pattern was similarfor good and poor readers. The two types of reversals wereuncorrelated in poor readers, therefore not reflecting a singleprocess. No aspect of the error patterns was found to be correlatedwith cerebral dominance assessed by an auditory rivalry technique.More errors occurred on nonsense syllables than on real words, butthe error pattern was similar, suggesting that errors reflectphonological structure more than meaning. Since confusions amongreversible letters presented in isolation occurred infrequently,their optical properties cannot he solely responsible for theirconfusions in reading. Comparisons of substitutions in the real wordand nonsense lists support this conclusion. Reading of individualsyllables was highly correlated with paragraph reading, suggestingthat the beginning reader's problems are more concerned withsynthesis of phonological segments than with strategies for scanningconnected text. Tables and a bibliography are included.(Author/VJ)

i
I --
Isabelle Y. LibermanDonald Sbankweiler
, a t-DEPARTMENi OF HEALTH, EDUCTION.,8 WELFARk
_ .
DEFIL, OF EDUCATION --
,- Uniyieraity cif' Conneotieilt , .
Storre; Conneoticut 06268 THIS kg. Ini[rIT HAS. pE.EstREPROODCED EXACTLY ASRECEIVED FROM THE
,PERSON OR OROANagoi O9IGINATi6G-I1 : POINTS° OF VIEW -OR ,OPI-NIONS 7--
STATui. DO NUTtNECESSAPLY.-REPRESENT,OFFICIALOFFICE OF EDUCATION
,POSITION CR -POLICY.
3
. _.
Final Report
:Project No. 0.-A010Grant No.' OEG-1-7-007(509)
o (L--
g< e)-A)-2/0
_
''''';''''- :1''''''' ''''''''''''-- '':'---5:'''' ijIGATION-i.oF REVERSAL.;ERNORS:,,IN-i-READING.1,Pli_NOREAL:,4411..!:?QP474$4_,, -.--- ,--, :-:-.:,..--,, ir-,7-: --.. ,t','--,- , :;--1---,:At:-,r,--4Ti--,,--;,,2.17?:",,':
:- CRITICAL It&GtOIWIN'S READING ,1441.1ERIALS;,,;-2,..--.....,,,..,-,,,-, q''...,,=:-_'2.1-,,.. s'=".-,1-4,.;,, , _, . _. _ (7,.. L--.'%=,,,-4- ,,,,,s..., b-,:v...,:. V i., ,.."-....74/=.--5,", s,..,1..-, , §', 'r, "` ..^.tlf..."--;'',-,^ 1-' *--"=,i:o''''...4 ,,, , 1. .:',.., , ,-"i '-` 3 .".- - ' '.- '
,,, , - s'Cr 4 '7', -to, ,,:,vt,...;---'1-:., ,,Kit.,-Lr ,-,,,,,,, ..-isi,,,-i: V.,,,:r. '-v. ,v,i,i' ,,' .,::,,.4 4-`-"?..t,v,
,... ,
323r
1711,t733.2,2273,,
- =

CY%
Ct,
AbstractcoLrwt
Reversals in poor and normal second-grade readers were studied
C:3 in relation to their whole phonological error pattern in reading real
words and nonsense syllables. Error.categories included sequence and
orientation reversals, other consonants, vowels, and total error.
Proficiency of paragraph reading was assessed.
Reversals occurred in quantity only in poor readers, and, even
here, there were large individual differences. Overall error pattern
was similar for good and poor readers. The two types of reversals were
uncorrelated in poor readers and therefore cannot reflect a single
process. No aspect of the error pattern was found to be correlated with
cerebral dominance assessed by an auditory rivalry technique.
More errors occurred on nonsense syllables than on real words, but
the error pattern was similar for the two lists, suggesting that errors
reflect phonological strrAure more than meaning. Since confusions among
reversible letters presented in isolation occurred infrequently, their
optical properties cannot be solely responsible for their confusions in
reading. Comparisons of substitutions in the real word and nonsense lists
support this conclusion.
Reading of individual syllables was highly correlated with paragraph
reading; suggesting alat the beginning reader's problems aze more concerned
with synthesis of phonological segments than with strategies for scanning
connected text.
2
Final Report
Project No. 0-A,010Grant No. OEG-1-7-0007(509)
INVESTIGATION OF REVERSAL ERRORS IN READING IN NORMAL AND POOR READERS
AS RELATED TO CRITICAL FACTORS IN READING MATERIALS
Isabelle Y. Liberman
Donald Shankweiler
University of Connecticut
Storrs, Connecticut
August 1971
The research reported herein was performed pursuant to a grant with the Officeof Education, U. S, Department of Health, Education, and Welfare. Contractorsundertaking such projects under Government sponsorship are encouraged to expressfreely their professional judgment in the conduct of the project. Points ofview or opinions stated do not, therefore, necessarily represent official Officeof Education position or policy.
U. S. DEPARTMENT OFIMITH, EDUCATION, AND WELFARE
Office of EducationBureau of Research
ii3

Preface
We should like to express our indebtedness to the many associates
who assisted in the experimental work of this investigation and in the
preparation of the final report.
We are especially grateful to Dr. Charles Orlando, now at Pennsylvania
State UniverSity, who did much of the testing and contributed generously of
his time, effort and experience in many other ways. He was a doctoral
candidate in Special Eduoation at the University of Connecticut at the
time the major part of the data were being collected.
Dr. Katherine Harris of the Speech Department of the Graduate Center
.of the City University of New York was extremely helpful in initial dis
cussions of the early experiments. A doctoral candidate in her department,
Frederika B. Berti, assisted in the phonetic transcriptions of reading
tapes and subsequent scoring of the error categories
Others at the University of Connecticut who assisted in scree 'ng
and in the collection and processing of the data included Mary Macary, a
rrL ',Is candidate in Special Education; Dr. Sigita Ramanauskas, who was
a doctoral candidate in Special Education at the time; and E. W. Capron,
a doctoral candidate in Clini-al Psychology. A number of other students
who provided valuable services include Janet Capron, Ann Dolman, Patricia
Tusavitz, David Calehera, and Gail Levine.
We wish to acknowledge with deep appreciation the care and diligence
with which Mary M. Nicholson prepared the final manuscript.. We are also
greatly indebted to F. William Fischer, a master's candidate in Special
Education, who was helpful in preparation of the data, and in assembling
and checking the tet and tables.
Finally, we should like to express our thanks to the University of
Connecticut Computer Center for their cooperation in processing our data
and to the many children and teachers who made the investigations possible.
We are particularly indebted to the school systems of Stafford, Tolland,
Manchester and Mansfield for their generous cooperation.
Isabelle Y. Liberman
Donald Shankweiler
iii
4

Table of Contents
Page
:Abstract
Title Page
Preface
Table of.Contents iv
Tables
Appendix Tables vi
Chapter 1: IntroduCtion
Chapter 2: EXperiment I 4
Statement of the Problem 4Method 4
Subjects 4Procedure 4
Results 7
Chapter 3: EXperiment IA 19
Statement of the ProblemMethod
SubjectsProcedure
Results
Chapter 4: EXperiment II
Statement of the ProblemNethoC,
SubjectsProcedure
Results
Chapter 5: EXperim nt III
1919191919
27
2727272727
30
Statement of the Problem 30Method 31
Subjects 31
Procedure 31
Results 32
Chapter 6: Discussion 35
Chapter 7: Conclusions 40
Bibliography 42
Appendix 45
iv

TABIE 1
TABLE 2
TABLE 3
Tables
Errors as a Function of Opportunity - Experiment
Intercorrelation Matrix - Experiment
Confusions Among Reversible Letters in Real WordList, Percentages Based on OpportunitiesEkperiment
TABLE 4 Errors as a Function of Opportunity: The Effectof Reversibility on Sight and Nonsight WordsExperiment I 16
TABLE 5 Errors as a Function of Opportunity in the J.ght-
Nonsight Set and the Reversible-Nonreversible SetExperiment I 17
TABLE 6 Test-Retest Reliability Coefficient- for the VarioUsError Measures in the Real Word and Nonsense ListsExperiment IA 20
TABLE 7 Comparison of Errors on Real V rd and Nonsense ListsExperiment IA 22
TABLE 8 Comparison of the Intereorrelation Matrices on theReal Word and Nonsense Lists - Experiment IA 23
TABLE 9 Confusions Among Reversible Letters on the NonsenseList, Peroentages_Based on Opportunities for ErrorEkperiment IA 25
TABLE 10 Interoorrelation Matrix - Experiment II 29
TABLE 11 Intercorrelation Matrix, Pooled Data for Croups 12, 3 EXperiment III 34
Page
9
iL
12

TABLE A
TABLE B
TABLE C
TABLE D
TABLE E
TABLE F
TABLE G
TABLE H
TABLE I
TABLE J
TABLE K
TABLE L
TABLE M
TABLE N
TABLE 0
TABLE P
TABLE Q
Appendix
Real Wo d List
Single Latter ach.) Answer Sheet
EXperiment I Raw Scores for Each Child
ExPeriment I Relative Frequency of Error Types
.for Each Child.: Real Word List Percentage of
Total Error
Nonsense Word List
EXperiment IA
Ekperiment IAfor Each Child:Error
Experimem II
Experiment IIfor Each Child:Error
Monaural Identi
Raw Scores for Each Child
Relative Frequency of Error Types
Nonsense List Percentage of Total
Raw Scores for Each Child
Relative Frequency of Error Types
Real Word List Percentage of Total
ation Stimuli
Dichotic Stimulw. Pairs
Group It EkperimentDichotic Index
Group 2, ExperimentDichotic Index
Group 3, EXperimentDichotic Index
III Reading Scores and
III Reading Scores and
III Reading Scores and
Group 1, Experiment III Intercorrelatien Mat ix
Group 2, Experiment III Intercorrelation Matrix
Group 31 Experiment III Intercorrelation Matrix
vi
7
Page
46
47
48
49
50
51
52
53
54
55
56
57
58
59
60
61
62

CHAPTER 1
Introduction
Reversal errors in reading and writing have been special concerns in
reading research for many years. We can see two principal reasons why
reversals have received very much more attention than other kinds of errors.
First, we can point to the dominant tendency to view reading primarily as
a problem in visual perception, leading to an almost exclusive interest in
the perceptual consequences of the optical properties of print and the
neglect of the implications of the fact that print represents segments
which form part of the linguistic code. Second, reversals are generally
thought to be of special importance for understanding reading disability.
Indeed, Orton (1925) considered reversals to be so central that he used
the term "strephosymboliali (twisted symbols) to designate specific reading
disability. Orton viewed specific reading disability as one element of a
developmental syndrome which has at its basis poorly-established cerebral
dominance. He attempted.to show that children with reading disability
tend to have poorly established or unstable lateral preferences, and that
they tend to reverse the direction of letters and words in reading and
writing. These difficulties were seen as related manifestations of a
failure of one cerebral hemisphere to become dominant. This conception
of reading disability has been challenged by some workers in the field
(Schonell, 1948; Burt, 1950; Vernon, 1960) and supperted by others
(Zangwill, 1960; Critchley, 1964). The extensive literature dealing with
the possible relation between reading disability, motor ambilaterality
and cerebral dominance has not resolved the question.
In our view, the question is premature until more is learned about
the reversal phenomenon itself. A number of preliminary questions about
reversals have not been fully answered. In the first place, it is not
known how frequently and consistently reversals occur in beginning readers
generally. Secondly, do reversals comprise a constant proportion of all
errors? If so, it would be highly misleading to count the reversals a
child makes without examining the other errors as well. Our research.has
been guided by the belief that reversals must be placed in a perspective
which can only be gained by studying all errors the beginner makes when
1

confronted vith print. Indeed we are convinced that pursuing the causes
of children's reading errors is a necessary first step to gain understanding
why learning to read is difficult and why instruction so often fails to have
its intended result.
There ie considerable agreement that after the first grade, even those
children who have made little further progress in learning to read do not
have significant difficulty in visual identification of individual lettere
(Vernon, 1960; Shankweiler, 1964; Doehring, 1968). The occurrence in the
alphabet of reversible letters may present special problems, however. The
tendency for yourg children to confuse letters of similar shape that differ
in orientation (such as b, d, R, g, q) is well-known, Gibson and her
colleagues (1962; 1965) have isolated a number of component abilities in
letter identification and studied their developmental course by the use of
letter-like forms which incorporate basic features of the alphabet. They
find that children do not readily distinguish pairs of shapes which are
160-degree transformations (i.e.1 reversals) of each other at age 5 or 6,
but by age 7 or 8, orientation has become a distinctive property of the
optical character. It is of interest, therefore, to investigate how much
reversible letters contribute o the error pattern of eight-year-old children
who are having reading difficulties.
Reversal of the direotion of letter sequenc e.g, reading "was" for
saw is another phenomenon which is usually coneidored to bo intrinsica14
related to orientation reversal. Both types of reversals, as we have said,
are often thought to be indicative of a disturbance in the visual directional
scan of print in children with reading disability (see Benton, 1962 for a
comprehensive review of the relevant research). We should ask whether rever-
sale of letter orientation and sequence loom large as obstacles to learning
to read. Do they co-vary in their occurrence, and what is.the relative
significance of the optical and linguistic components a the problem?
In view of the limitations of earlier work, we saw a need for an
experimental study of reversal errors which would take into account the
linguistic context as well as the optical properties of the stimuli and
would investigate reversals in relation to the other errors the child makes
when confronted with the printel word.
2
9

Monroe, 1932; Teagarden, 1933; Gates 1933; Hildreth, 1934; Davidson,
1935; Hill, 1936; Wolfe, 1939; Bennett, 1942) concerned themselves either
directly or tangentially with the nature of reversal errors in reading,
but, for various reasons, their results are difficult to assess. Some
considered only errors of orientation. Several discussed both types, but
did not treat the two separately in preienting their results. When they
did consider them separately, they did not investigate furthef= the relation-
ship of the two kinds of error to each other, or their relationships to
other consonant and vowel errors occurring concomitantly. Special tests
to measure reversal tendency have rarely been devised; most investigators
culled the reversals from the children's performance on diagnostic reading
paragraphs or word lists.- EVen when special tests were used, no attempt
was made to assess the reliability of the findings or to adjust the observa-
tions for the opportunities available in the material for making various
types of errors. Some studies took into account the effect of whole-word vs.
Ingle-letter presentation; usually, the possibility of different error
frequenoies in meaningful and nonsense material was not considered.
The same shortcomings listed above are found in more recent explora-
tions of reversal error patterns in reading (Hermann, 1959; Tordrup, 1966).
Thus, the relationship of sequence and orientation reversals to each other
and to_different aspects of reading mastery remains uncertains as does the
nature of the general error pattern in the disabled reader. This investiga-
tion was designed to provide a more systematic approach 'Le these questions.
We think all the questions we have outlined can be approached most
profitably by studying children who are a little beyond the earliest stages
of reading instruction. For this reason, we have avoided the first grade
and focused, in most of our work, on children of the second and third grades.
Though some of the children at this level are well on their Way to becoming
fluent in reading, a considerable proportion is still floundering and thus
provide a sizeable body of errors for examination.
We carried out three experiments. These will be described separately
in the succeeding sections followed by a general discussion and summary
of the major results.
1 0

The purpose of this experiment was to assess the part reversals play
in the problems of the poor-reading child at the end of the second year
of _instruction.
_lethod
in an attempt to evaluate the ignificanoe of reversals in the error
pattern in beginning reading, we devised a word list (presented as Table A
in the Appendix) of 60 real-word monosyllables including a selection of
primer level sight words, most of the commonly-cited reversible words,
and, in addition, a group of CVC words which provide ample opportunity for
reversing letter orientation. The child's task waS to read each word
aloud. He was encouraged.to sound out the word and to guess if unsure.
The responses were recorded by the examiner and also on magnetic tape.
Sub
The subjects for this study were selected from the second grade of
an elementary school system located in a small northeastern Connecticut
town. A 60-item word list (described abov was administered to the entire
second grade population of the school system N.59)0 Five children were
eliminated as possible subjects. These included two with speech impairment
two who moved from the district before testing could be completed, and one
who transferred to the school system after the initial segment of testing
had begun.
The 18 children chosen for further study comprised the full lower
third of the remaining group in reading proficiency as a termined by their
total error score on the word list. School records indicated that none of
the children had impaired hearing or uncorrected errors of refraction.
Fifteen were boys and 3 mere girls. Their ages ranged from 7.25 to 9.25
years mean . 8.25 years All tested within the normal range of intelli-
gence according to the Wechsler Intelligence Scale for Children IQ range:
85-126; mean - 98.6).
edure
The following tasks were given to all the subjects in the same order
on successive days.

a. 0 Ma, t I fa 1.4. ,3 11 0 mv,AL44.1. .Lum v.uuL
a black felt-tip pen on a separate 3" x white index card. The cards
were presented individually in the order in which they appear in the
list in Table A in the Appendix.
The responses were recorded on magne ic tape as well as being
transcribed duxing the administration, to check on the accuracy of trans-
cription. Each child's responses were analyzed for reversals of sequence
and of orientation, for consonant and vowel errors, and for total errors.
The word list was administered twice to each subjectonce at the
end of the (second ) school year and again in the first week of the follow-
ing school year. Data from the two presentations were combined in scoring
the responses of each subject, but were available separately for assessment
of test-retest reliability.
2. Gray Oral Reading Test, Form A. Administered by the standard
procedure. Raw paragraph scores based on Gray's system of weighting time
and number of errors were used to evaluate the subjects' performance,
rather than grade level equivalents.
3. Single-letter Test (Tach. ) List of 100 iterAs in which a given
letter was to be matched to one of a group of five, including four
reversible letters in manuscript form (b, dl g,) and one non-reversible
letter (e) which was added ao a reliability check. There were 20 such-items for each letter. The order of the resultant 100 items was randomiz d,
as was the order of the multiple-choice sequence for each item on the
answer form (see Table B in the Appendix for a sample answer form
The stand.. rd was presented tachistoseopically for matching with one
of the multiple-choice items on the answer sheets. Tachistoscopic exposure
of the 2" x 2" slides of each letter was projected for 1 125 sec. in the
center of a 9" x 12" screen mounted six feet in front of the subject. A
brief training session was provided for each child.
Error Analysis of Word Transcription
The responses to the Stimulus words were scored twicefirst, from
the transcription made at the time of the test administration, and second,
from a separate transcription by another experimenter from the tape record-
ing. Disagreements between scores were infrequent and were easily settled
by invoking the rWee listed below.
5
12

word wa_ read from rght to _eft g., when l-p was read as .pt.,
[IAA]; form as [fram].
2. Reversal of orientation RQ). Scored when b, d, 27 and E were
confused with each other, as when bad read as rda3d], rp d], or
[bmg] if bad was given as ds2b] 7it was scored as a sequence error
instead. Beth tyj'-.s of reversal were scored when nap was read as tbInj.
3. Other consonant error OC Included all consonant omissions
and additions as well as all consonant substitutions other than reversal
of orientation. A response could contain both a sequence reversal and a
consonant error, as in the case of the response [imp] for the stimulus
word pat. It could also contain both an orientation reversal and a
consonant error, as in the case of the response EtraTj for the stimulus
word tab. However, confusions among b2 d2 p2 and E were cored only as
reversals of orientation, not as consonant errors.
4. Vowel error (V). Included all vowel substitutions, such as [PIO
for 22a. A vowel error was not charged when a consonant error in the
response forced a change in the pronunciation of the vowel, provided the
vowel sound produced in the response was a legitimate pronunciation of the
original printed vowel 6-esponse [ra9t] for the stimulus word ral_
5. Total error (TE). Simply the sum of all the preceding error
types.
In general, the first concern was to assure that scoring was not
falsely prejudiced in the direction of any given error category. To this
end, certain additional rules were consistently invoked in the few instances
when scoring was not immediately selfevident. The stimulus word was viewed
in relation to its component printed vowels and consonants as written. The
response word was considered phonetically, not in terms of the orthographic
transcription of a possible target word. An exception was made when both
he stimulus and target words contained vowel digraphs. As noted above,
no vowel error was charged when a consonant error-in the response produced
a change in the pronunciation of the vowel., provided the original printed
vowel would be sounded legitimately as read in its new consonant environ
ment.
6
13

---as Ltraj, it was of course, scored simply as a sequence reversal. If
it was read as Ltre[], the r sponse was scored as both a sequence reversal
and a vowel error. Here, no account was taken of the possible target word
tray. The response [tr p] would have been scored as a sequence reversal
and a consonant error for the addition of the R). In this case, no
vowel error would be scored, since the original printed vowel would be
sounded in this way in its new consonant environment (caused by the addition
of the 2)
Where the final consonant of the stimulus word was part of a vowel
digraph as in the case of the word raw, substitutions for the w were viewed
as consonant errors e.g., raw read as [rmt] or J.. m]). Here, as was
the case of Ltra,7p] as a response for tar, no vowel error was charged,
since both the stimulus word and the possible targe ord ray) involved
vowel digraphs ([o] and Ed])
osults
114,21_94lren I_Zeverse?
ThL entire second-glade group was rank-ordered with respect to
frequency of total errors on the real word list. Nearly all of the
real errors were found in children ranking in the lower third of the
distribution. We, therefore, confined our study to these 18 children who
comprised the poorestreaders.
Test-Retest Reliability
Since our method of reading assessment was untried, we were concerned
to demonstrate its reliability. Test-retest comparisons showed that where--
as other reading errors were rather stable, reversals, and particularly
sequence reversals, were considerably less so. The test-retest reliability
coeffiient for the total error was .83; for other consonant errors (00,
it was .69; for vowel (V) errors, .64. Thus, the general error rate among
the children is stable, although they tend to give some redistribution of
the errors among consonants and vowels. Both types of reversals give
lowerreliabilitYsosiTisientsrli2=.43 for reversals of sequence or
RS' r1,2
.50 for reversals of orientation or RO), indicating that they
are not highly stable error'categories.
7
14

Jaz found that even among those poor readers, reversals accounted
for onl small proportion of tota of misread letters, though the
list was construeted to provide maximum opportunity for reversals to occur
(the raw scores of tne group appear as Table C in the Appendix). Separating
the two types of reversals, wefound that sequence reversals (RS) accounted
for only 1of the total errors made, and orientation errors (Ro) 19%,
whereas other consonant.errors (00) accounted for f the total and
vowel errors (V) 43%. Moreover, individual differences in reversal
tendency were large: rates of sequence reversal ranged from 0 to 1
rates for orientation reversal ranged from 3% to 31% (see Table D in the
Appendix
We note, then that the proportion of the two types of reversals wa
not the same for all readers. Moreover, only certain poor readers reversed
appreciably, and then not consistently. Though in the poor readers we have
studied, reversals are apparently not of great importance, it may be that
they loom larger in importance in certain children with particularly severe
and persisting reading disability. Our present data do not speak to this
question.
Since the list provided different opportunities for error in the
various error categories, it was of interest to check the proportions in
relation to opportunity. Table 1 gives frequencies of errors for RS, RO,
00, and V, each percentaged according to the opportunitiee for errors of
that type. First, we see, in agreement with classroom experience, that
letters representing vowels are far more often misread than those represent
ing consonants. Secondly, viewed in terms of opportunities for error,
orientation errors occurred less frequently than other consonant errors,
but had a greater relative frequencY of occurrence than sequence reversals.
Orientation Reversals and Reversals of Sequence: No Common Cause?
When we consider d the two types of reversals separate1y9 we found no
support for assuming that they have a common cause in children with reading
problems. RS and RO were wholly unoorrelated (r = .03), whereas V and OC
errors correlated .73. That means, of course, that an individual's frequency
of misordering letter sequences is entirely unpredictable from his frequency
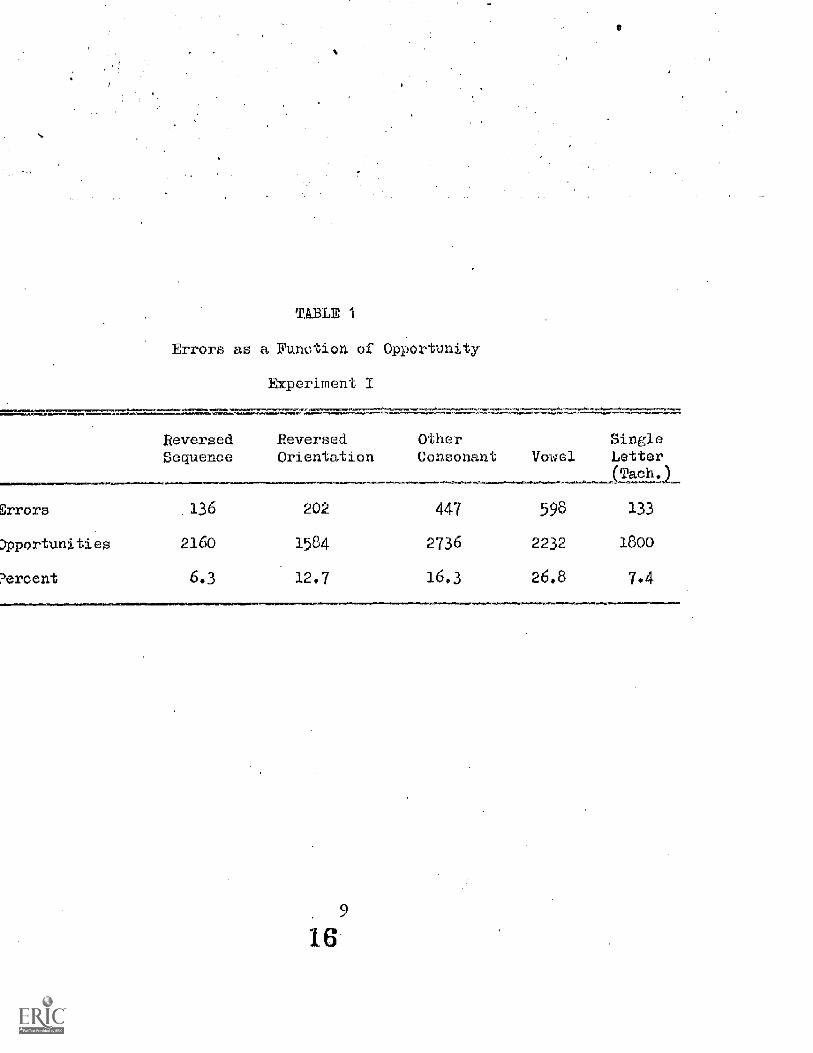
TABLE 1
Errors as a Function of Opportunity
Elperiment
Reversed ReversedSequence Orientation
OtherConsona t Vowel
SingleLetterTach.
rrors .136 202 447 598 133
Dpportunities 2160 1584 2736 2232 1800
?ercent 6.3 12.7 16.3 26.8 7.4

for regarding them both as manifestations of an underlying disturbance,
such as failure to develop a consistent automatic left-to-right pattern
of scan (Orton, 1937)
A further indication of the lack of equival nee of the two types of
reversals is that each correlated quite differently with the other error
measures. Intereorrelations among the various measures are displayed in
Table 2. It is of interest to note that sequence reversals (RS) correlated
significantly with other consonant errors 00), with vowel errors V)
and moderately with perf rmance on the Gray paragraphs- while none of these
is correlated with orientation reversals (R0).
Orientation Errors: Visual or Phonetic?_ . - _
In further pursuing the orientation erroa.s, we examined the nature
.f the sUbstitutions among the reversible letters b 41 13 and g. The
letter q was not used because it appears only in a stereotyped spelling
pattern in English words. Tabulation of these showed that the possibility
of generating another letter by a simple 180-degree transformation is
indeed a relevant factor in producing the confusions among these letters.
This is, of course, in agreement with conclusions reached by Gibson and
her colleagues (1962). At the same time, the data lead us to the further
conclusion that letter reversals may be a symptom and not a cause of
reading difficulty.
Confusions among the four reversible letters are presented as a
matrix in Table 3. The matrix showslwith respect to each 1,7rtter, the
frequency with which it was correctly read or replaced another letter.
Each row in the matrix refers to letters occtLoring in the word list and
each column refers to the responses given by the children in oral reading.
These frequencies are expressed as percentages of the total occurrences of
each letter in the list (i.e., in terms of opportunities for error).
Confusion of b and d is the reversal most commonly mentioned in the
literature and was interpreted by Orton (1937) as an instance of ysinis-
trad scan." It will be seen from Table 3, however, that in this group
of children, 2 is given for b more frequently than is d. Indeed, in the
table as a whole there were slightly fewer occurrence of 180-degree
10
17

TABLE 2
Into corrol tion Matrix
Exper ent I
Real Word List Errnrs
Reversed Reversed OtherSequence Orientation Consonant Voie1
SingleLetter(Tach. )
Errors
Gray'sParagraphsScores
Total Error
Reversed Sequence
Reversed Orientation
Other Consonant
Vowel
Tach.
73* 28
03
9
72**
09
91**
56*
20
73**
19
14
04
28
08
77*
45
15
71**
75
01
Note.--The table coltains Pearson pr u t-moment correlation coefficients. The
decImals and signs are deleted.
*p < .05
**p < .01
11

TABLE 3
Confusions Among Reversible Letters in Real Word List
Percentages Based on Opporti-ities
Experiment I
\ObtainedTotal Other
Reversals Errors
10.2 13.7 0.3 24.2
10.1 1.7 0.3 12.1 5.2
9.1 0.4 0.7 10.2 6.9
1.3 1.3 3.9 13.3
19

the vertical plane (b to 2 foi xample). Tlis does not support the
view that letter reversals arc altribut-ble to reversed direction of
scan.
We also learn from the table that errors are essentially confined
to confusions among b, d and p. The letter g is, of course, a distinc-
tive shape in all type styles, but it %as included among the reversible
letters because, historically, it has been treated as a reversible letter.
It indeed becomes reversible when hand printed with a straight segment
below the line. (Even in manuscript printing, as was used in preparing
the stimulus materials for this study, the tail of th c, is the only
distinguishing characteristic.)
Concerning the confusions among b d and ID, the truly reversible
consonants, most errors involved a single 180-degree transformation
about the vertical axis or the horizontal axis, but not both. Presumably,
the presence within the alphabet of equivalent or near-equivalent optical
shapes is one determinant of confusions among the letters bl d, 2, and,
by the same reasoning, the lack of congruence between these and account
for the rarity of the c substitution for b, d, or .E. This conclusion is
also cupported by the relatively small frequencies of nonreversal errors
(i.e. substitutions outside the set defined by the matrix ) for b, d, and
2 in contrast to
Can we make sense of the pattern of the actual distribution of errors
among the letters which differ in orientation but not in form? Table 3
shows that at least twice as many errors occurred in b as on d or p. We-may speculate on why this should be so. It may be relevant that b offers
two opportunities to make a single 180-degree transformation, whereas d
and 2 offer only one. But there could also be a phonetic reason for the
greater error rates on b, in that it offers the reader two opportunities
to err by a single articulatory feature (place or voicing) whereas d and
2 offer only one opportunity to make a single feature error. Thiz would
ba consistent with the finding that errors in perception of spoken conson-
ants tend to differ from the presented consonant in only one feature,
i.e., in voicing or place of production, but not in both iller and
Nicely, 1955)
13
20

visual or a phonetic interpretation of the error pattern, but further
data obtained in Experiment IA on a list of nonsense syllables are also
not consistent with a purely visual explanation of the pattern of b, d,
E confusions. As will be seen in the next section, g was again
rarely confused with the other three reversible letters, and b continued
to elicit the greatest number of errors. Moreover, the distribution of
b errors vas different from that which had been obtained with real words
in that b-p confusions occurred only rarely: These results suggest that
the nature of the substitutions even among reversible letters is not an
automatic consequence of the property of optical reversibility. (This
conclusion was also reached by Kolers and Perkins; 1969, froma different
analysis of the orientation problem.
We may then ask whether confusions among b, d, and 2 occur outeide
of word context. When reversible letters were presented tachistoscopically
as iselated shapest relatively few misidentifications occurred (see Appendix,
Table C) and, moreover, error rates on orientation reversals (RO) in reading
were completely uncorrelated with reversal rates on the e letters presented
tachistoscopically. If viu1 factors were primary, we would expect that
tachistoscopic exposure would have resulted in more errors, not fewer, and
that the same children who reversed appreciably in one condition would do
so in the other. Thus, we may conclude that the characteristic of letter
reversibility is not a sufficient condition for confusion. Because the
latter shapes represent segments which form part of the linguistic code, .
their perception differs in important ways from the perception of non,
linguistic forms.
Reversals and Other Characteristics of the Ward List
word list (Appendix, Table A) included a selection of primer
level sight words, some of which are reversible-into other words (e.g.,
pn-po, was,sawl now-won) and some of which are not (e.g., boy, elf, _day).
It also included a numbei-of nonsight words, some of which are reversible
(e.g., 122,ppt, lap-22.1, and some which are not g., bet,
120°we investigated the possibility that these two characteristics of
14
21

might make a dif_er- ce i- the error pattern. Table 4 shows an analysis
of the error pattern in texms of the reversibi_ity of the words. The
figures in this table represent percentages of the opportunities for
errors in the list as divided into reversible and nonreversible sets.
It can be seen that among the sight words, reversibility makes no differ-
ence whatever in the error pattern: the p rcentage,, are nearly identical
for all types of errors in the rove- sible and nonreversible sets of sight
words.
In the case of the nonsight words, the data ..re less clearcu- Here
the que-tion of the familiarity and difficulty of the particular words in
the two sets (reversible and nonreversible ) has an unknown degree'of
influence on the question of word reversibility as a factor in the error
pattern. The fact that the nonreversible set included a number of worWs
like left, felt and form which elicit internal sequence reversal errors
undoubtedly increased the number of RS errors in this set. (These words
were included in the nonreversible set because in terms of consistent
right-to-left direction of scan, they are indeed not reversible into words.)
Moreover, since these words are often confused with other words which happen
to maintain the same vowel left-felt, form-from), the relatively low vowel
error in the nonreversible set may also reflect the presence of these
particular words. In any event, it see s unlikely from the data that
reversibility as such can be considered an important factor in determination
of the error pattern. The lack of control for difficulty, in addition to
the problems just outlined, can certainly account for the differences that
are found in our data between the reversible and nonreversible sets.
The same general conclusions about the sight-nonsight and reversibl_
nonreversible categories are reached when the data for the two categories
are considered separately without regard to each other 'as presented in
Table 5. Here it can be seen that the sight word variable has generally
the same effect on all the'error types. In the first place, the sight-word
et is clearly less productive of errors of all kinds than are the nonsight
words. Moreover, the error percentage is roughly the same for all error
types among the sight set, with the possible exception of RS errors. This
15
22

TABLE 4
Errors as a Funo Lion of Opportun.tyt the Effect
-f Reversibility on Sight and Nonsight Words
&perineiit
,ftess
Reversed
Sequence
Reversed
Orientation
Other
Consonan' Vowel
Reversible Sight 4-9 7.4 7.7 8 3
Nonreversible Sight 4.8 8.3 7.0 7.3
Reversible Nonsight 5.2 11.8 21.7 41.2
Nonreversible Nonsight 10.7 16.7 30.3 30.1
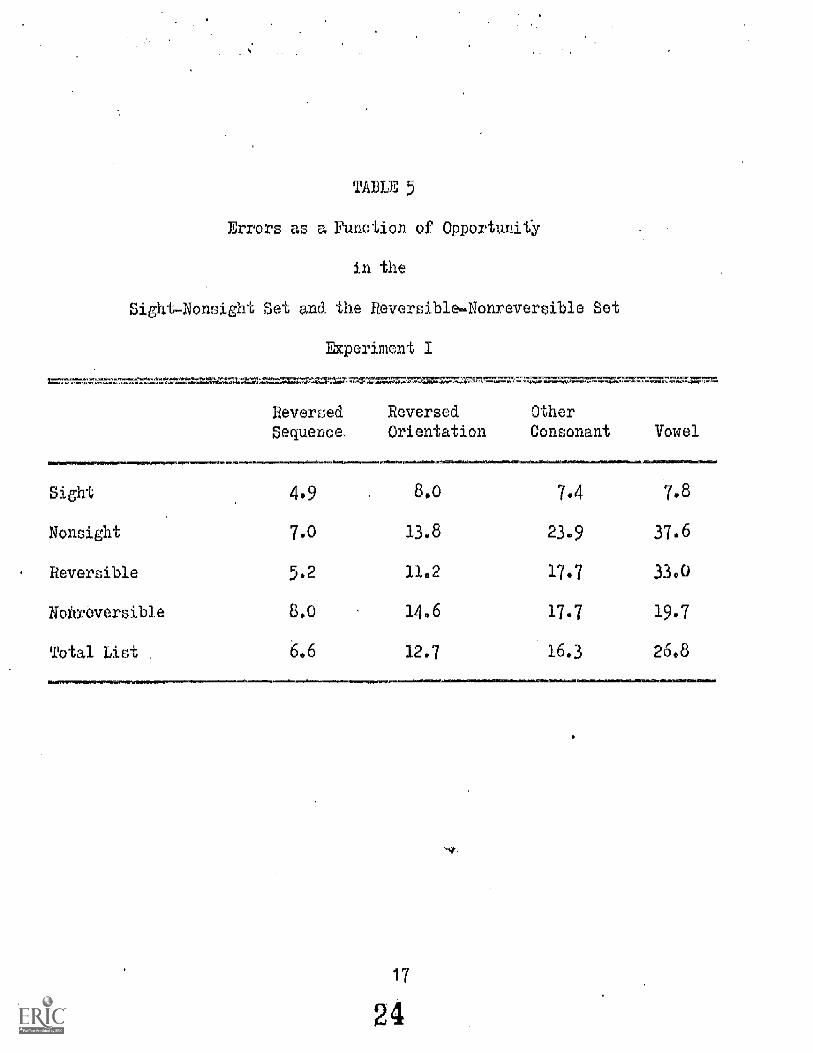
TABLE 5
Errors as a Function of Opportunjtr
in the
Sigh onsight Set and the ReversibieNonrevers1b1 e Set
Thcperiment
Reversed
Sequence
Reversed
Orientation
Other
Consonant Vowel
Sight 4.9 8.0 7.4 7.8
Nonsight 7.0 13 8 23.9 37.6
Reversible 5.2 11.2 17.7 33.0
Nonreversible 8.0 14 6 17.7 197
Total List 6.6 12.7 16.3 26.8
17
24
wian wil.,ii Adiu nonsignb suuo rinun nu ilsu is tAlViallU 11-11,Q reN-UrSiDie
- nonreversible sets, the error pattern reverts to the same general pattern
that we found in the list as a whole (wi'Ll minor variations of error level
probably ascr bable to the
set),
n general, then, the
level of 'difficulty of particular words in the
ight factor tends to level out differences
among the error types and results in a uniform percentage across error
types. Reversibility of the words appears to have no effect that can be
separated in our data from the relative difficulty of the sets of rever-
sible and nonreversible words. The pattern of error in these two sets
remains largely the same as in the test list as a whole,
In view.of these findings, it was considered unfruitful to pursue
these relationships further in our later experiments.
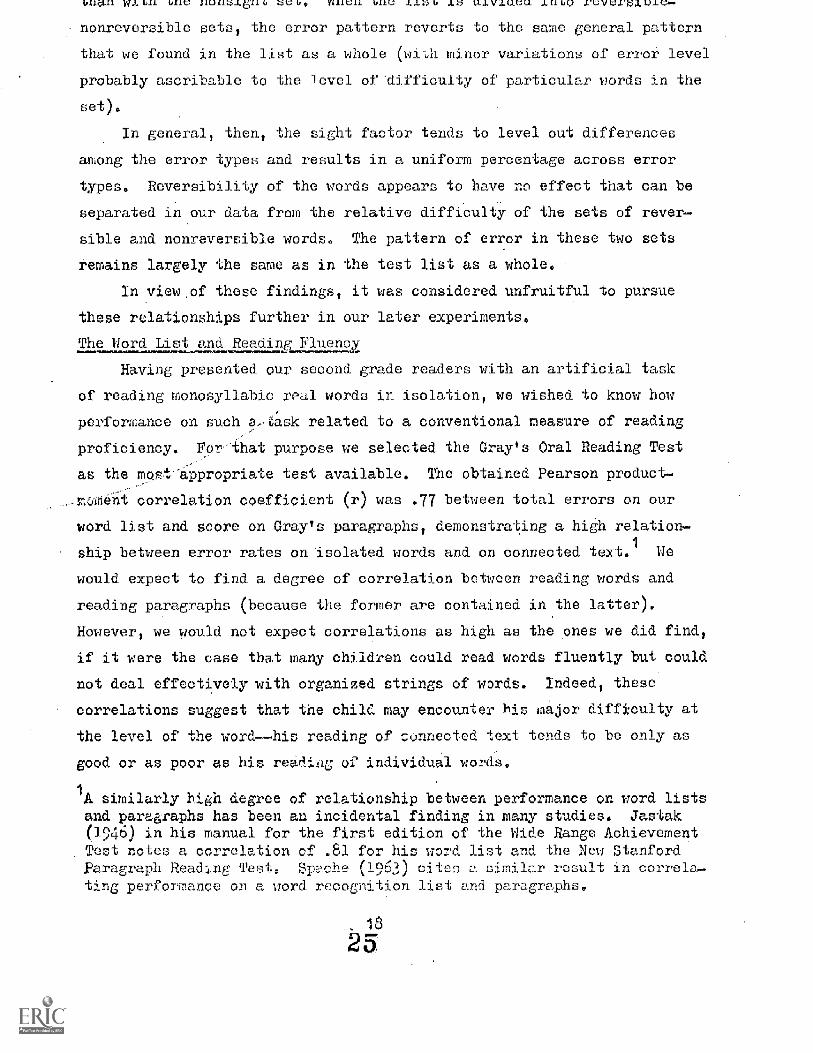
The Word List - ReadinP Flue,
Having presented our second grade readers with an artificial task
of reading monosyllabic real words in isolation, we wished to know how
performance on such a,gask related to a conventional measure of reading
proficiency. For that purpose we selected the Gray Oral Reading Test
as the mePt-appropriate test available. The obtained Pearson product-
ent correlation coefficient (r) was .77 between total errors on our
word list and score on Gray's paragraphs, demonstrating a high relation-
ship between error rates on isolated words and on connected text.1
We
would expect to find a degree of correlation between reading words and
reading paragraphs (because the former are contained in the latter).
However, we would not expect correlations as high as the ones we did find,
if it were the case that many children could read words fluently but could
not deal effectively with organized strings of words. Indeed, these
correlations suggest that the child may encounter biz injor difficulty at
the level of the word--his reading of connected text tends to be only as
good or as poor as his reaiig of individual words.
1A similarly high degree of relationship between performance on word listsand paragraphs has been an incidental finding in many studies. Jastak(1946) in his manual for the first edition of the Wide Range AchievementTest notes a correlation of .81 for his word list and the New StanfordParagraph Readlnir Pst Spche (1943) cites a eimilar result in correla,ting performance on a word recognition list and paragraphs.

The purpose of experime t was to assess the contribution of
the phonological structure to the error pattern in reading, independently
of lexical meaning.
Method
In order to view the'error pattern in the reading of non-meaningful
m:teriall we devisea a list of 60 CVO nonsense monosyllables including a
group of 30 which reverse to common real words and a'group of 30 which do
not. Both groups of 30 are of equal association value in their natural
left-to-right order according to Ahe Glaze tables Hilgard, 1962). Order
of the entire 1 st is randomized. (The list is pre ented-in Table E in
the Appendix.
Sullapts
The subjects were the same as i lkperime
Procedure
The tasks as outlined in Experiment I were utilized. In addition,
the CVO nonsense syllable list described above was administered with the
instructions that these were npretend" words, not fireal" words, and that
the children should attempt to sound them out as best they could. The
responses were transcribed by the examiner and also recorded on magnetic
tape. ,Error categories and scoring rules were the same as in Experiment I.
Results
T. .t-Rete _ Reliability
The test-retest reliability coefficients for all the error categories
in the real word and nonsense lists can be seen in Table 6. For the
nonsense list, the coefficients in all error categories except the reversals
of sequence (RS) are consistently high 'gnificant at the .01 level).
Reversals of sequence continue to be the least reliable of the error
measures; in the nonsense list, the chances for error in this caegory are
essentially random. As was the case in the real word list, the error
categories other than reversals in the nonsense list tend to be stable
over two administrations of the tee.t lists.
19

TABLE 6
Test-Retest Reliability Coefficients
for the Various Error I.lea2ures 'n the Real Word and Nonsense Lists
Experiment I&
Type of Err Real Word List Nonsense List
Reversed Sequence
Reversed Orientation
Other Consonant
Vowel
Total Error
Note.The decirna
* p .05
p < .01
delet d.
20
27
43
50*
69**
64**
834:4
5
60**
77**
79**
74**

It would be expected that, for the beginning reader, a liet of
.nonsense syllables would be more difficult to decode than a li t of
monosyllables of similar phonological structure which are known by the
child to form real words. As can be seen in Table 7, this is indeed
the case. The mean number of total errors for,the nonsense list is
roughly double that of the real word list. (The raw scores for the
nonsense list appear as Table F in the Appendix.)
Table 7 also provides a comparison between the two lists of the
proportions of the total error acCounted for by the variou- error
categories. Once again, as in the real word list the proportion of
reversal errors is small: 8% for RS and 7% for RO as compared with
errors of other kinds, 39 for, other consonant errors and 46?-4 for vowel
errors (see Table G in the Appendix). Moreover, when viewed in terms
opportunities for error, as can also be seen in Table 7, both the
pa tern and rate of error production for the two types of reversals are
remarkably similar in the two lists. The-larger number of total errors
for the nonsense syllable list appears, then, to be accounted for largely
by errors in the other co sonant and vowel categories, rather than in
reversals.
Orientation Reversals and Reversals of Sequence: No Common Cause?
A:comparison between the two lis s of the intercorrelations among
the error measures, the Tach. Te,t and the Gray Oral Reading Test appea
in Table 8. Before considering the two types of reversals separately,
it is of interest to note the close correspondence between correlations
on the two lists for most of the measures mpresented. Major differences
are found only in the reversal measures, particularly in the degree to
which they correlate with the CC category Of error.,
When we consider the two types of reyersals separately in the
nonsense list, we find as was true in the real word li t that RS and
RO arp uncorrelated (r = 12, as compare with r = .03 on the real word
list), whereas the correlation between Viand C errors is still high (r =
.68 as compared with r = .73 on the real word list). Thus, there is
added support for the view that one cannot assume a common cause b tween
21

TYpePfError
TABLE 7
Comparison of Errors on Real Word and Nonsense Lis
Ebcperiment TA
Mean Numberof
Errors
Per entageof
Total Error
Real Nonsense Real No
12
11 10
ReversedSequence
Rever edOrien ation
OtherConsonant
Vowel
TotalError
Percentageof
Opponturi ties
Re 1
10 8
7
Nonsense
10
13 15
25 56 32 39 16 32
33 66 43 46 27 55
77
Not Da-a from test and retest are combined for each list.
22
29

TABLE 8
Comparison of the Intercorrelation Matr' es
on the Real Word and Nonsense Lists
Experiment IA
- - -
ReversedSequence
Real Non-
ReveroedOrientation
Real Vans.
OtherConsonant
Real Nons.
Vowel
Real Nons.
SingleLetterTach.
Real Nons.
Lea.. aas it, It af
Gray'sParagraphs
Real Nons.
otalrror
eversed .
equence
everscdrientation
therDnsonant
Dwel
73** 50* 28 32
12
93** 89**
72** 17
40
91**
56*
20
73**
91**
44
13
68**
19
14
04
28
22
6
22
10
77**
45
15
71**
75**
70**
33
35
66**
57*
Note.--The table contains Pearson productmoment corre1aton coefficients. The
3cimals and. signs a e deleted.
* 1)4.05
23
30

%.,c&AL QVQ41 VI ulic; Ut4U-LVC1J.ULIUU
between the two types of reversals is demonstrated in the nonsense list
'by the fact that each type of reversal again correlated quite differently
with the other error measures.
Orientation Errors: Visual or Ph etic?
From the preceding analyses, it can be seen that the overall error
pattern in the beginning reader is to a large extent independent of
whether the words read are meaningful or not. Howev r, the two lists
do elicit markedly different patterns of confusions among the reversible
letters in the RO category.
Confusions among the four rev r ible letters an the nonsense list
re presented as a matrix in Table 9. The matrix shows, with respect to
each letter, the frequency with which it was correctly -read or replaced
by another letter. The frequencies are exPressed as percentages of the
:total occurrences of each letter in the YLst i e., in terms of ooportunities
for error).
As in Experiment I, the letter z was again rarely confused with the
other three reversible letters. Little information is available about
the letter 2 as a possible target for confusability because of the low
frequency of occurrence of that letter in the nonsense list. However, the
letters b and d occur in the nonsense list in good quantity and roughly
equal numbers.
Table 9 shows that- b tended to elicit many more reversal errors than
the other reversible letters, just as it did in the real word list in
Etcperiment This result, of course, again brings into question the
importance of optical reversibility as the sole determinant of substitutions
among reversible letters. Further comparison of the nature of the ubstitu-
tions in the two lists provides additional evidence that the substitutions
are not an automatic consequence of the property of optical reversibility.
In the real word lists for example, b tended to be substituted by 2
slightly more often than by d sce Table 3 in EXperiment I). In the
nonsense list, on the other hand, b'to p sub-titutions occurred only half
as frequently as b to d substitutions.
24
31

TABLE 9
Confusions among Reversible Letters on the Nonsense List
Percentages Based on Opportuniti for Error
Enperi ont IA
Obtained
Pre ent dTotalRever-a
22.0 11.1 1.0 34.1
5.8 1.4 1.4 8.6
0.0 0.0 0.0 0.0
0.3 2.2 0.3 2.8
25.

The disparity in substitution pattorn in the two li t might have
been related tr, differences in the opportunities to make words by using
a plrtieular letter. Though the instructions made it clear that the
nonserse list did not contain real words, the children's incorrect
responses on both lists often reflected an attempt to form a real word.
A check was therefore made in the two lists of the number of real word-
that could be made by reversing b to p or to d. This count revealed
that the nonsense list actually afforded more opportunities to make
words by the substitution of .21 rather than by the substitution of d.
The great r preponderance of d substitutions among the nonsense list RO
errors cannot, therefore, be attributed to inflated opportunity.
-The fact that the pattern of substitutions am-ong thereversible
letters is so markedly different in the two lists certainly points to
the conclusion that optical reversibili'y is not a sufficient cause for
1ter reversal in reading words.
The Word List and Reading ency
In Experiment I, the Pearson product-moment correlation coefficient
of .77 between total errors on the real word list and scores on the Gray's
Oral Reading Test bespoke a high relationship between error rates on
isolated words and on connected text.
As can be seen in Table 8- the correlation between total error on the
nonsense list'and ricores on the Gray's paragraphs is also high (r = .70).
Those correlations suggest again that the child's major difficulty as a
beginning reader is at the level of organization and synthesis of syllables--
his reading of connected text tends to be only as good or as bad a- his
ability to decode the syllable.

CHAPTER 4
Ekperime t 11
In this experiment, our interest was to examine, by means of the
same real word list (Table A, Appendix),the error pattern in reading in
a group in which the incidence of reading failure was expected to be low.
Because we were also interested to compare the possible effect!- of
variations ih handedness and other indications of cerebral lateralizati n
on the error pattern, the group was selected to include matched groups
of right- and left-handed boys.2
(The relationships between cerebral
lateralization of function and reading will be discus -ed in EXperiment III-)
Method
SubjfEt2
Ten left-handed boys were chosen from the second grades of four schools
in the towns Of Mansfield and Manchester Connecticut. These two groups,
comprisi g all the left-handed sample in this study, included all the left-
handed second-grade boys in the four schools except.three who were excluded
because of hearing loss or low IQ less than WISC Verbal IQ of 85). A
group of 10 right-handed boys was matched with the left handers in age,
grade and verbal IQ.
Procedure
The Gray Oral Reading Test and the Real Word List as described previous-
ly in Experiment I were administered and scored as before.
Results
As in the e,4.r1ier study, reversals accounted for a small propo tion
of the total errors made. (The ra scores for this group appear in
Table H of the Appendix.) RS and RO each accounted for 12% of the total
errors TE), other consonant 00 errors accounted for 26% of the total,
and vowel (V) errors 50% (see Table I in the Appendix)- These proportions
compare closely With those obtained in the first study, though the overall
error rate for these children averaged less than half that for the selected
poor readers in EXperiment.I.
2We are indebted to Charles Orlando, Pennsylvania State University, forthe selection of subjects and the lateralization data for this group,whioh comprised part of his subje ts for a doctoral dissertation presented,at the University of Connecticut Orlando, 1971).
27
3 4

Intercorrcla.ions of the various measures are given in Table 10.
In contrast to the poor readers of Experiment I in whom we found no
relationship between the two types of reversals, here we find them
correlated .78. Also, in contrast to Experiment I, RO and RS correlated
highly with other measures as well as with each other, suggesting that
in beginning readers who are progressing up to expectation, reveroal
errors have basically the same determinants as other types of errors.
In the main, however, the results show good agreement with the
earlier study. Total error on the word listagain correlated highly
(.70) with performance on paragraphs (the 0- ). Vowel and con
sonant error also conuinued to correlate significantly with each other
and with the total error. Thus, we find that except for reversals of
orientation (R0), the gen ral error pattern is remarkably similar in
poor readers and in satisfactory readers. This leads to the conclusion
that the problems of learning to read are much the same for beginners
whether they are progressing well or poorly. Reversible letters may
simply pose an additional source of difficulty for the poor readers.
35

TABLE 10
Inte c rrelation Matrix
Ebcperiment II - -Real Word Lis)L Errors
Gray'sParagr phs
Rever-s7e7---Yeversed OtherSequence Orientation Consonant Vowel
Total Error
Rever edSequence
ReversedOrientation
OtheConsonant
81-x* 86**
-18**
90**
70**
82**
91-x*
64**
66**
68.H*
70**
77**
72**
59**
58**
** <
29
6

C112TTER 5
Experime t III
The purpose of this.experiment was to examine the widely held idea
that there is a relationship between poor reading and cerebral ambi
laterality.
S. T, Or' n (1925, 1937) was one of the fi st tc assume a causal
connection between reversal tendency and cerebral ambilaterality as
manifested by poorlyestablished motor preferences. There is some clinical
evidence that backward readers' tend to have weak, mixed or inconsistent
hand preferences or lateral inconsistencies between the preferred hand,
foot and eye (Zangwill, 1960). Although a strong case has not yet been
made for the specific association between cerebral ambilaterality and the
tendency to reverse letters and letter sequences the possibility that
there is some connection between individual differences in lateralization
of function and readinc2' disability is supported by much clinical opinion.
This idea has remained controversial because due to various difficulties,
its implications could not be fully explored_ and tested.
It has only recently become possible to investigate the question
experimentally by some means other than the determination of handedness
eyedness and footedness. Auditory rivalry techniques provide a more
satisfactory way .of assessing hemispheric dominance for speech than hand
preferences; becauSe the right ear has a better path to the speechdominant
left cerebral hemisphere dichotically presented words tend to be more
often correctly perceived from the right ear than from the left (Kimura
1961; 1967). We follow several investigators in the use of these dichotic
techniques for assessing individual differences in hemispheric specializa
tion for speech in relation to reading ability (Kimura, personal communica
tion; Sparrow, 1968; Zurif and Carson, 1970; Bryden 1970). The chief
innovation of our approach to the problem is that we regard terebral
laterality as a continuously distributed variable rather than a dichotomous
one. (There is good reason to reject the idea of dichotomous speech repre
sentation.) fleangwill (1960) and others have pointed out that aphasia in
left handers tends to take a mild and transitory form. Experimental
determination of cerebral speech dominance by unilateral intracarotid
30
37

injection of sodium amytal also provides strong evidence for bilateral
speech representation in some left-handed and ambidextrous individuals
alner, Branch and Rasmus,' n 1966). Thus there is evidence, at least
in non-right handers, that the degree of unilateral speciali ation of the
brain for language varies from individual to individual.
method
Subjects
- The relation between reading and auditory rivalry'was assessed for
three groups of second-grade children: (1) 15 poor readers of Experiment
(the three girls in the group were omitted, because the other groups
which are pooled for this analysis contained only boys); (2) the 20
subjects of Experiment 11, which includes 10 left-:handed and 10 right-
handed boys; (3) an additional 22 subjects are included who are of ave
or above-average IQ (WISC), and who were further selected to include poor,
fair and good readers in the second-grade population of a third schoel
system. Thus, 57 subjects in all were available for this study.
Procedure-Determination of lateral cerebral dominance for speech was made by
use of an auditory rivalry.technique, which one of xs (D.S.) had employed
for this purpose in a number of previous experimenl:s Shankweiler and
Studdert-Kennedy, 1967; Kirstein and Shankweiler, )_969; Studdert-Kennedy and
Shankweiler, 1970). A two-track magnetic tape wa prepared consisting of
60 pairs of the synthetic consonant-vowel syllables /ba, dal ga, pa, ta, ka/
prepared on the parallel-foralant synthesizer at Haskins Laboratories Cooper
and Kattingly, 1969; Cooper, Rand, Music and Mattingly, 1971). Each of
the 15 possible syllable pairs of these stop-consonants-plus /a/ occurred
four times, and each syllable occurred equally often at each ear.
The order of presentation of the 60 pairs of stimuli was randomized.
The syllables in each pair, presented one to each ear, aere synchronized
in time of onset and offset. There was a five-second paus0 between pair
presentations. The tape was played back on a Sony 255 stereophonic tape
deck through earphones (Reali 33-195). On each of two testing sessions
the tape was played through twice, yieldiTig two blocks of 120 trials.
Initially, the tape was played to each subject with the phones placed on

the he-d in a given posi
earphones were reversed,
Reversal of the phones a
channels are distributed
results.
The test was administered individually by a trained examiner in aquiet testing room. .Fiefore the presentation of the dichotic tape, fifteenof the syllables were presented monaurally to each ear to make sure the
.subjects could identify the syllables correctly (the Yonaural Identifica-
tion List appears as Table ...I in the Appendix). This preliminary screeningresulted in the exclusion,of two subjects. On both the monaural pre-test
and the dichotic test (the Dichotic Stimulus Fairs are displayed in
Table K in the Appendix), the subject's task vas the save: to repeatback eaCh syllable he heard. They were not told that there would be a
different syllable arriving at each car on the dichotic trials, lut
simply that the words might now be a little harder to hear. All subjectsgave only one respon,e on each dichotic trial; none seemed aware of the
simultaneous presence of two different syllables. The examiner recordedthe responses on a standard answer sheet.
All subjects for thifl experiment received the Real Word List
described in Experiment I. Groups 1 and 2 also had the Gray Oral ReadingTest.
.r")11 the same for all subjects. Then the
the tape rewound and played a second time.
ures that any unintended differenceF bety
over ears and ereforo cannot bias the
Results
Forty-eight of the 57 subjects (84%) obtained a right ear advantage
on the dichotic task. Ear advantage was calculated according to an indexwhich had been used by Studdert-Kennedy and Shankweiler (1970): (R-L/R-I-L )1 0,
where R and L correspond to the total correct identification of syllables
presented to the right and left ears, respectively. The index thus has avalue of 0 in the condition of complete ambilaterality, positive valuesranging from 0 - 100 when there is a right ear advantage, and negative
values ranging from o - 100 when- there is a left ear advantage. (TablesLI M and N in the Appendix show values of the dichotic index and the read-
ing scores for each of the three groups.)
In order to determine whether there is ,.. relationship b
32
39

degree of speech . ralization and reading ability, we oara'ied out
intercorrelations on all measures Pears'Jn r). Correlations were
computed between each of the error counts derived from the Real Word
List and the following measures derived from the dichotic listening
task; (1) the total number, R+L, of correct identifications for both
ears, giving a measure of the level of performance which reflects
perceptual efficiency under conditions of information overload;
(2) the signed dichotic index, (R-L/R4-1, )100, giving a measure of the
degree of left brainednces; (3) the ab,olute or unsigned value of the
dichotic index, (R-L R-4-14 )1-0 giving a measure of the degree of
lateralization without rogard to which hemisphore.is dominant. (The
intercorrelations of these measures and the reading scores for Groups 1,
2 and 3 are prek:ented separately in Table- 0, P and Q in the Appendix.)
When the pooled data of the three groups are considered Table 11)
we can conclude that the measures of lateralization bear no significant
relationship to reading. The same conclusion may be drawn when the
three groups of subjects are examined separately. In Groups 1 and 2,
the Gray paragraphs score was included in the intercorrelation analysis,
also with nonsignificant results. (There is a suvestion of a relation-
ship between RL, which is not a measure of lateralization but refle6:s
overall performance on the dichotic task, and performance on the Gr y
paragraphs. ) We will consider the implications of these negative findings
in the discussion to follow.
33
40

TABLE 11
Intereorrelation Eatrix
Pooled Data for Group.. 1 2, and 3
Experiment. III
ReversedSequence
Real Word List Errors
Reversed OtherOrientati n Consonant Vow 1 RI-L
Dichotic Scores
Signed UnsignedIndex Index
TotalError 83** 77** 90** 95** - 20 04 09
ReversedSequence 68** 78** 17 .02 11
ReversedOrientation 71** 12 09 01
OtherConsonant 76** 21 07 04.
Vowel 17 01 13
Right Left 28* 38**
Signedindex 86**
Note.--The table contain- Pearson producniornent correlation coefficients..
The deci als and. signs are del ted.
*p .05
**p < 001

TER 6
Di ncussion
Reversals of letter sequence and orientation occurred in significant
quantity only among the poorer reader., in our grcs of second graders.
Even within the lower t ird of the class they accounted A Experiment I)
for only 10% and 15%,respeetively, of the total of misread letters,
whereas other consonant errors accounted for 32% of the total and vowel
errors accounted for 43%. For the nonsense word list (Experiment IA),
though the total error was much greater, the'error rates for reversals
were even less; RS and RO accounted for 8% and 7%,respectively, of the
total error. Other consonant errors -ind vowel errors accounted for 397:)
and 40X,,, respectively. Thus, the error pattern for nonsense syllables
is similar to that obtained for words, and the larger total number of
errors for the nonsense syllable list does not result from an increase
in the proportion of reversals.
Our plan of investigation also included a comparison of the error
pattern in poor readers with that in children who are progressing normally.
A secondgrade class in another school system periment 11) made less
than half as many errors ori the word list as the group consisting of poor
readers but the distribution of errors was remarkably similar in spite
of the markedly lower error rate': RS and RO each accounted for 12% of
the total error (compared with 10% and 15%, respectively, for the poor
readers of Experiment I); other consonant and vowel errors were 26% and
50% (against 32% and 30 ). Thus for the error categories we used, it
appears that the distribution of errors in beginning readers is largely
independent of the level of ability, and given that the materials are
presented as lists, largely independent of the nature of the task, since
the error pattern (in contrast to the error rate) was not greatly affected
by whether the list comprised meaningful words or semallti allyempty
syllables.
Another way to assess the importance oP reversals as error categories
is to examine their rate of occurrence in relation to the.number of
opportunities our list offers to make errC)r-s of that kind. Among the
poor readers it was found that errors as a function of opportunities for

the two type, of reversals arc quite ilar in the word list and the
nonsense list. For both lists we find that letters representing vowels
are more often misread than those representing cononants a finding
which may e linked to the more complex orthographic representation of
vowels than consonants and to fundamental differences between the percep-
tion of vowels'and consonants in speech (Liberman, Cooper- Shankweiler
and Studdert-Kennedy, 1967). Again, the close similarity in the results
for nonsense syllables and real words strongly suggests that the error
pattern in the beginning reader is more influenced by the phonological
structure of words than by their lexical meaning.
Test-retest comparisons showed that whereas other reading errors
are highly stable, reversals and particularly sequence reversals,.are
less so. Individual differences in reversal tendency are al o large;
only certain poor readers reverociappreciably. Familiarity with the
words, as in the case of sight words, appears to level out differences
among the error categories, resulting in a more uniform percentage across
types. Thus it is not the case as has sometimes been believed,
that reversal tendency, as such, is the hallmark of the poor reader.
Although we have stressed that reversals of either type do not
unt for a large proportion of the total err r in most of the children
we have studied, it may .bc that reversals loom larger in importance in
certain hildren with particularly severe and persistent
Our clinical experience suggests that this may be so and
explore the question fully in future research.
Orton (1925; 1937) was oLe.of the first to assume a causal connection
between reversal tendency and cerebral ambilaterality as manifested by
poorly-established motor preferences. It has only recently become possible
to investigate the question experimentally by some other means than the
determination of handedness, eyedness and footedness. kuditory rivalry
techniques Kimura, 1961; 1967; Shankweiler and Studdert-Kennedy, 1967;
Studdert-Kennedy and Shankweiler, 1970) provide a more satisfactory way
of assessing hemispheric dominance for speech than hand preferences. Our
findings with a dichotic method of a siilg hemispheric dominance have
been generally negative. We have not found an association between bilat
reading diffi
we intend to
ulty.
4 3

organi2, tion of speech and reversals or ony other measure of reading
difficulty. These findings are in agreement with others recently
reported (Kimura, personal unication; Sparrow, 1968; Zurif and
Carson, 1970; Bryden, 1970).
The relationship we are seeking may we I be more complex, however.
Orton (1937) stressed that inconsistent lateralization for speech and
motor functions is of special significance in diagnosis, and a recent
finding of Dryden (1970) is of great interest in this regard. He found
that boys with speech and motor functions oppositely lateralized have
a significantly higher proportion of poor readers than those who show
the typical uncrossed pattern. This suggests that it will be worth-
while to look closely at disparity in lateralization of speech and motor
function.
Eamination of the inter
showed that in the poor readi
rrelations among v-rious reading errors
group,the two typos of reversal are
wholly uncorrelated. (This was the case not only in real words but with
nonsense syllables-) This is a finding pf considerable interest since
both types of reversals were considered by Orton to be manifestations of
an inderlying tendency-to reverse the direction of scan. Th; view
cannot easily be reconciled with two additional findings: first, among
reversible letters, vertical rever.als occurred with as groat frequency
as horizontal-reversals; second, confusions among reversible letters
rarely occurred when these letters were pre,-ented singly, even when
briefly exposed in the tachistoscope.
An analysis of.the nature of substitutions amo g reversible letters
(b, d, p, g) was carried out. This showed that the possibility of generat-
ing another letter by a simple 180-degree transformation is a relevant
factor in producing a relatively high ra0 of.confusions among these
letters, in agreement with conclusions reached by Davidson (1935) and by
3A preliminary factor analysis of the pooled data for Groups 1, 2 and 3is in agreement with theintercorrelation analysis in finding no commonloading between the reading and laterality measures. However, for the15 children in Group 1, the poor reading group, there is a commonfactor represented by the RO and both the R1-1, and the signed index ofthe dichotic scores. Data on a larger group of poor readers are beingcollected to check on this findin-
37
4 4

Gibson and her assooiat 1962).
At the same time other observations indica'sd that letter rover-
sals may be a symptom and not a cause of reading difficulty. Two
observations sveciest this: first, as we have noted, confusions among
reversible letters occurred much less frequently for these same children
when the letters were presented singly, in brief tachistoscopic admin-.
istration. 'If visual factors were primary, we w uld expect that
tachistoscopic e:cposure would have resulted in m re errors, not fewer.
Secondly, the confusions among the letters during word reading were not
symmetrical: as can be seen from Table 4, h is often confused with
as ell as with d, reas d tends to be confused with b and almost
never with p.
The pattern of confusions among b, ci, and 2 could nevertheless be
explained on a visu 1 basis. It could be argued that the greater error
rate on b than on d or 2 may result from the fact that b offers two opp
tunities to make a single 180-degree transformation, whereas d and 2 offer-only one. Against this interpretation we can cite data from the nonsense
syllables. Here the distribution of b errors was different from th-t
which had been obtained with real words, in that b p confusions occurred
rarely. The children moreover, tended to err by converting a nonsense
syllable into a word, just as in their errors on the real word,lists they
nearly alwayr/proddeed words. For this reason a check was made of the
number of real words that could be made by reversing b in the two lists.
This revealed no fewer opportunities to make words by subStitution ofla
than by substitution of d. Indeed, the reverse was the case.
These findings point to the conclusion that the oharacteri c of
optical reversibility is not a sufficient condition for the errors that
are made in reading, at least among children beyond the first grade.
Because the letter shapes represent segments which form part'of the
lineuistic code, their perception differs in important ways from the
perception of nen-lingui-tic forma--there is more to the perception of
the letters in words than their shape ee Kolers1 1970 for a general
discussion of this point
Further exploration of the linguistic determinants of children's
reading errors is clearly needed. In thi- connection, the high correla-ion
38
45

between ren ding proficiency on the word list and .the paragraphs of the
Gray's Oral Reading Test suggests that for the beginning reader, at
least, an analytic to t Consisting of monosyllables can be substituted
for a te-L employing connected text. We would, of course, expect to
find a degree of corr lation between reading words and reading paragraphs
(because the former are contained in the latter), but not correlations
as high
could r
strings
as
ad
of
the ones we did find if it were the case that many children
worth- fluently but could not deal effectiVely with organized
ords. Thonc orrelations sum.est that the child may encounter
his major difficulty at the level of the wordhis reading of connected
text tends to be only as good or as poor as his reading of individual
words. Put another way, the problems of the beginning reader appear to
have more to do with the Synthesis of sy lables than with scanning of
larger chunks of connected text, This has the major implication that
methods of instruction which stress spelling-to-sound correspondences
and other aspects of decoding are more likely to succeed than those
methods which leave the child to adduce these relationships for himself.
One way or another, the would-be skilled reader must become actively
aware that letters of the alphabet represent segments of speech which
are in general smaller than the word or syllable (see Idberman, 1971,
for a discussion of this point as related to basic research in speech
perception

CH, 7
Conclueions
A concern to discover why learning to read ie difficul led to a
reexamination of reversals of letter sequence and optically-reversible
letters in beginning readers. Reversal errors have been muth studied
but rarely in relation to the whole error pattern when the beginning
reader confronts the printed word. Oar plan of investigation was to
compare the error pattern for word lists in poor-reading second graders
with that in childi;en who arc progressing normally. The error categori_
studied included sequence and orientation reversals, other consonants,
vowels and total error. Proficiency of paragraph _reading was also assessed
for both groups.
Reversals of letter sequence aid letter orientation occurred in
significaat quantity only in the poor readers among tha children we studied,
and ever among these, there were large individual differences in the tendency
te make errors of the e kinds. The distribution of errors among the various
error categories was much the same for the group of normal readers as it
was for the poor readers as a group. The two types of reversals were ufle
cor-:elated in peer readers and, therefore, cannot refleet a single proce
as Orton had implied. Neither type of reversal nor any other aspect of
the error pattern was found to be related to individual variations in
cerebral dominance for speech as assessed by an auditory perceptual rtvalry
technique.
As expected, more errors occurred on nonsense syllables than on real
words, but the overall pettern of errors was remarkably similar for the
two lists$ suggesting that in beginning readers, the errors in reading
these materials reflect the phonological structure more than lexical
meaning. Confusions among optically reversible letters did not often
occur when these were presented in isolation, suggesting that confusions
among these letters in reading are net simply an automatic sequence of
their optical properties. Differences in proportion of errors for b and
d, as well aa variations in the substitut,ions for these letters between
the word and nonsenee liste lead to the same conclusion.
Reading ability assessed by the analytic teste composed of isolated
words was highly coTelaieci with rip,cling proficiency on a conventional

pP,ragraphs test. This implies that the problems of the begirming rowler
may have moro to do with synthesis of words from phonological sec;ments
.than with strategies for scanning connected text. In other wordfi, poor
reading of connected text vith little comprehension is usually a consequence
of reading individual 1,;ords poorly.
41
48

BIBLIOGRAPHY
Bennett, A. An analysis of errors in word recogni tion made by retardedreaders. J. educ. Psychol., 1942, 331 25-38.
Benton, A. L. Dyslexia in relation to form perception and directionalsense. In Readin 1 ability J. Money Ed . Baltimore: Johns-Hopkins Press, 1962.
Bryden, M. P. Laterality effects in dichotic listening: relations withhandedness and reading ability in children. Neuropsychologia, 1970,.§.1 443-450.
Burt, C. _The Backward Child, (3rd ed.Press, 1950.
London: University of London
Cooper, F. S. ard Mattingly, I. G. Computer-controlled PCM system forinvestigation of dicho ic speech perception. J. acoust. Soo. lmer.,1969, 46, 115(A).
Cooper, F. S., Rand, T. C., Music R. S. and Mattingly, I. 0. A voicefor the laboratory computer. IEEE International C-av ntion Diges1971, 104-105.
Critchley, M. Developmental Dyslexia. London: Heineman 1964.
Davidson, H. A study of the confusing letters B, D P, and Q. J.enet,Psycho). 1935, 47, 458-468.
Doehring, D. C. patterns of Tmaairment in Specific Rea ing.Laa12121:ty-
Bloomington: Indiana University Press, 1-9M--
Gates A. I. Reversal Tendencies in Reading: Causest_Diam1:1 .7 Preventionand Correction. New York: Teacher'S College Bureau of PublicationsColumbia University, 1933.
Gibson, E. J. Learning to read. Science, 1965, 14_ 1066-1072.
Gibson, E. J. Gibson, J. J., Pick, A. D., and Osser, R. A developmentalstudy of the discrimination of letter7like forms. J._comp. physiol.EmE1121.t, 1962? 55, 807-906.
Hermann, K. Reading Disability: A Medical Study of yord Blindness andRelated Handicaps. Springfield, ill.: Charles C. Thomas, 1959.
Hildreth, G. Reversals in reading and writing. J. educ. psy: _ol 1934,;LI 1-20.
Bilgard, E. R. Methods and procedures in the study of learning. InHandbook of Enerimental Psychology
7 S. S. Stevens. New YOrk:John Wiley and 9ons, 1962.
42
4 9

Hill, M. B. A study of- the process of ination in incividualsbeginning to read. J. cduc, Res. 1936, 29, 487-500,
Jastak, J. Wide Range Achievement Test lincr's.Manua 1. WilmingtonDel.: C. L. Story Co., 1946.
Kimllry D. Cerebral dominance and the perception of visual stimuli.Canad. J. Psychol., 1961, 151 166-171.
Kimura, D. Functional asymmetry of the brain in dichoticCortex 1967
,3 163-178.
eni
Kirstein, E. and Shankweiler, D. Se1ectvc listening for dichoticallypresented consonants and vowels. Paper presented at the 40thAnnual Ueeting of the Eastern Psy-hological Association, Philad'OlphiaApril 1969.
/Ceders, P. A. Three stages of reading. In Basic Studies on ReadiH. Levin Ed.). New York: Harper and Row, 1970.
Kolers, P. A. and Perkins, D. N. Orientation of letters and their speedof recognition. Perlcsption_and psychophysics, 1969, 2/5-280.
Libc van, A. MO, Coopers F. S., Shankweiler, D., and Studdert-Kennedy, N.Perception of the speech code. psychol. Rev., 1967, 74, 431-461.
Liberman, I. Y. Basic research in speech and lateralization of language:some implications for reading,disability. Bull Orton Soc., 1971 .in press.
Miller, G. and Nicely, P. E. An analysis of perceptual confusions amongsome English consonants. J. acoust. Soc. Amer., 1955, 27, 338-52.
Milner, B., Branch, C., and Rasmussen, T. EVidence for bilateral speechrepresentation in some non-right-handers. Trans. AinerNeurol . Ass.1966, 22.,
Monroe M. Children Who Cannot Read. Chicago: University of ChicagoPr -s, 1932.
Orlando, C. P. Relationships between language'laterality and handednessin eight and ten year old boys. Unpublished doctoral dissertation,University of Connecticut- 1971.
Orton, S. T. "Word-blindness" in school children. Arch. Neurol. Psychiat.,_
1925, 14, 581-615.
Orton, S. T. Reading, Wri_tint,r and Speech. problems
W. W. Norton, 1937.
Children. New York:

Bohenoll, J, PackwaTdnen17; in -.. e,ubjects, [thEdin urgh:: Oliver and Boyd 1946.
Shankweiler, D. Developmental dyslexia: a critique and leview ofrecent evidence. Cortex, 1964,. 1, 53-62.
ShanEN,-cilor, D. and Studdert-Kennedy M. Identification of consonantsand vowels presented to left and richt ears. Quart. J. exp. Poyc1967, 19, 59-63.
chev G. D. Diagnostic eading Scales (Th:aminern itanuai. MontererCal.: California Test Bureau, 1963.
Sparrow, S. S. Reading disability: a nuuropsychological investigation.Unpublioh d doctoral dissertation, University of Florida 1968.
otuddert-Kennedyp M. and Shankweiler, D. hemispheric specialization forspeech (7.rception. J. aeoust. SoctoAmer. 1970 48, 579-594.
_
e -rden L. Toots for the tendency to reversal in reading. J. educ.Rec 1933 27 81797.
Tordrupt S. A. Reversals in reading and spelling. The Slow LearningChild, 1966, 12 173-183
Vernon, M. D, Backwardness in Read0infr.
Press, 1960.Cambridge: Cambridge University
Wolfe, L. S. An experimental study of reversals in reading. Amer.poyohol., 1939, .52, 533-561.
Zangwill, 0. L. Cerebral Dominance and its Relation to PsychologicalPunction. Edinburgh: Oliver and-BoYd, 1960.--------
Zurif, E. B. and Carson G. Dyslexia in relation tand temporal analysis. NeuropPychelogia, 1970
51
cerebral dominance8, 351-361.

APPENDIX
45
52

TABU:: A
Real Uord List
1. of 21. two 41. bat
2. boy 22. war 42. tug
3. now bed 43. form
4. tap 24. felt 44 left
5. dog 25. big 45. bay
6. lap 26. not 46. how
7. tub 27. yam 47. dip
8. day 28. Peg 46. ne
9. for 29. Ilas 49. Pig
10. bad 30. tab 50. cap
11. out 31. 51. god
12. pat 32. pot 52. top
13. tel 33. net 53. Pal
14, gut 34. pin 54. may
15. cab 35. fr 55. b-t
16. pit 36. ton 56. raw
17. saw 37. but 57. pay
18. get 38. who 58. t
19. rat 39. nip 59. dab
20. dig 40. on 60. tip
46

TABU; BSi n arz e Let 'i;e:f Tao h ) Answer Sh e et
a
DAT E SC:110W,
[ill,cl
vs...u..........e.a.............0.,....f.,"..,...a.a
_
[. .........r...x,.....,.......... ..,....,-.... z.oa........**
44 7

ABLE C
Experiment I
Raw Scor for Each Child
SubjectTotalError
Real
ReversedSequence
Word List Errors
ReversedOrientation
OtherConsonant Vol::el
SingleLetter 'Gray's(Pach.) Paragraphs
,
WISCIQ
ALB 35 6 7 5 20 7
..1a..a,a*
15 126
HAR 44 4 10 18 12 4 17 117
MGR 45 5 13 8 19 12 17 106
TIN 47 3 14 7 23 7 17 90
LOW 56 7 3 17 29 5 15 96
FON 57 10 18 16 13 2 15 99
LEG 57 11 9 15 22 16 10 102
EOR 63 7 11 21 24 6 12 94
ROM 63 7 6 25 25 9 11 115
LEE 72 9 9 13 41 7 8 98
COR 73 6 2 32 33 8 13 91
BUR 76 3 17 31 25 9 5 99
WAU 77 9 7 21 40 7 10 86
COL 91 8 15 27 41 6 16 88
WID 107 6 19 28 54 8 4 95
CRE 107 '. 6 8 41 52 5 1 91
KEL 108 8 25 54 11 10 97
SCU 201 21 13 96 71 4 0 85
Mean 76.8 7.6 11.2 24.8 33.2 7.4 10.9 98.6
1-All scores are error scores exc pt for
").:',11111 of t test combined.
its4_1
Paragraphs and WISC

TABLED
Experiment I
Relative Frequency of Error Types for Each Child: Real Word List
Percentage of Total Error.wangs_
Reveysed Reversed Other
Subject Sequence Orientation Consonant Vowel
AT,B
_
15.8 1 4 13.1 52.6
MAR 9.1 22.7 0.9 27.3
NUR 11.1 28.9 17.8 42.2
TIN 6.4 29.8 14.9 48.9
LOW 12.5 5.3 30.3 51.9
FON 17.5 31.6 28.1 22.8
LEG 19.3 15.8 26.3 38.6
NOR 11.1 17.5 33.3 38.3
ROM 11.1 9.5 39.7 39.7
LEE 12.5 .12.5 18.0 56.9
COR 8.2 2.7 43.8 45.2
BUR 3.9 22.4 40.8 3209
WAU 11.7 9.1 27.3 51.9
COL 8.8 16.5 29.7 45.0
WID 5.6 17.7 26.2 50.5
CRE 5.6 7.5 38.3 48.6
KEL 7.4 19.4 23.1 50.0
sOu 10.4 6.5 47.8 35.3
Mean 9.6 14.6 43.3
49
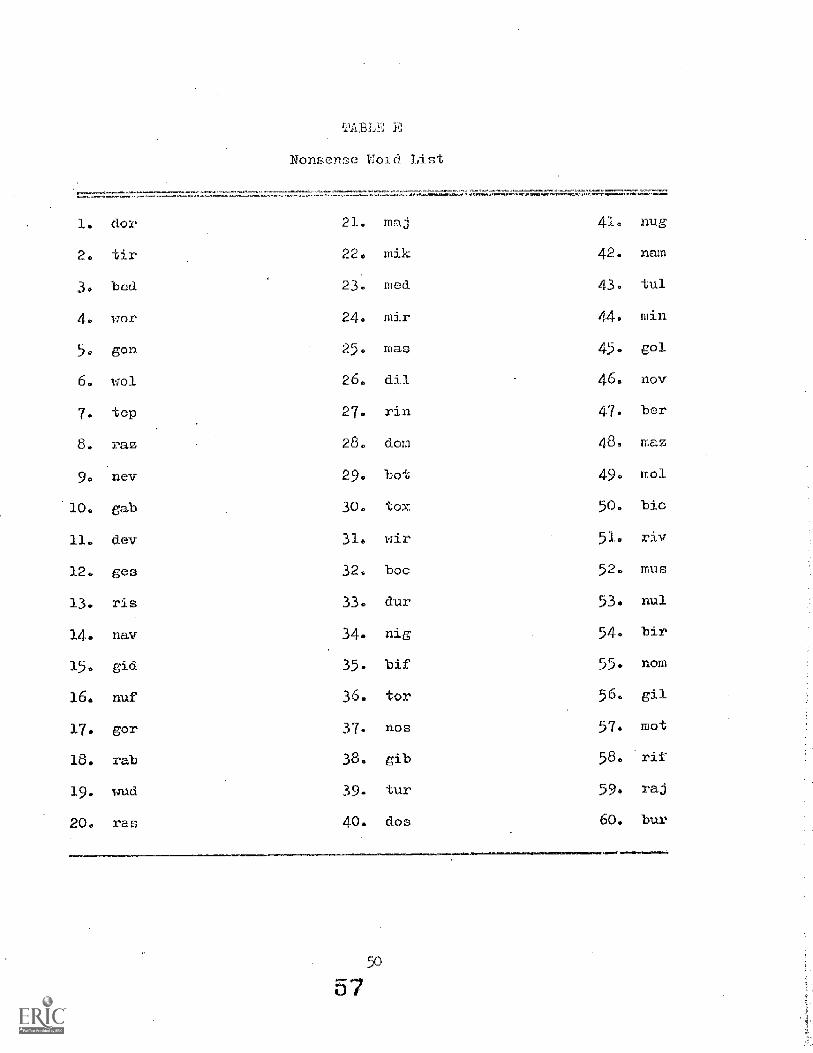
TABLE E
Nonsense Woid I,
1. dor 21. raj 4 - nug
2. tir 22. mik 42. nam
3. bed 23. med 43. tul
4. wor 24. mir 44. min
5. gon 250 mas 45. gol
6. wol 26. dil 46. nov
7. tep rin 47. ber
8. 28. dom 48. rnaz
9. nev 29. bot 49. mol
10. gab 30. tox 50. bic
11. dev 31. wir 51. riv
12. ges 32. hoc 52. rnus
13. ris 33. dur 53. nul
14. nav 34. fig 54. bir
15. gid 35. bif 55. nom
16. nuf 36. tor 56. gil
17. gor 37. flos 57. mot
18. rab 38. gib 58. rif19. laud 39. tur 59- raj
20. ra 40. do 60. bur
50

TAIL
Bricr ment IA
Raw Score s+
for Each Chdld
SubjectTotalError
'1-nfiense List rrors*
Revers_.d Reversed, OtherSequence Orientation Cononanb Vowel
SingleLetter(Toch, )
Gray'sParagraphs
WISCIQ
LB 109 3 6 37 63 7 15 126
liAR 86 5 11 38 32 4 17 117
NUR 78 5 13 30 30 12 17 106
TIN 112 0 9 41 62 7 17 90
LOW 110 1 2 33 74 5 15 96
FON 95 2 11 39 43 2 15 99
LEG 82 7 5 39 31 16 10 102
MOR 137 4 17 60 56 6 12 94
RON 131 15 5' 68 43 9 11 115
LEE 164 44 9 37 74 7 8 98
COR 192 16 10 76 90 8 13 91
BUR 185 13 9 83 80 9 5 99
WAU 124 13 8 34 69 7 10 86
COL 182 32 8 55 87 6 16 88
WID 137 3 18 50 66 8 4 95
GRE 207 26 8 75 98 5 1 91
KEL 195 8 9 88 90 11 10 97
nu 272 13 19 132 108 4 0 85
Mean 144.3 11.7 9.8 56.4 66.4 7.4 8 6
+-All scores are errox. soo except for Gray's Paragraph- and HNC Q.
*Sum of test and rctet ceares com
51

TA70,h
Experiment IA
Relative Freqw-Incy of Error 1ype8 for Each Child: Nonense List
Percenta,ge of Total Error
Reversed Reversed OtherSubject Sequence Orientation Consonant Vowel
ALB 2.8 . 5.5 33.9 57.8
HAR 5.8 12.8 44.2 37.2
nun 64 36.7 38.5 38.5
TIN 0.0 8.0 36.6 55.4
LOW 0.9 J. .8 30.0 67.3
PON 2.1 11.6 41.0 45.3
LEG 8.5 6.1 47.6 37.8
NOR 2.9 12.4 43.8 40.9
R0,4 11.4 3.8 51.9 32.8
LEE 26.8 5.5 22.6 45.1
COR 8.3 5.2 39.6 46.9
BUR 7.0 4.9 44.9 43.2
WAU 10.5 6.4 27.4 55.6
COL 17.6 4.4 30.2 47.8
WID 2.2 13.1 36.5 48.2
GRE 12.6 3.9 36.2 47.3
KEL 4.1 4.6 45.1 46.2
SCU 4.8 7.0 48.5 39.7-V
Mean 7.5 7.4 38.8 46.3
52
59

TJBLE h
Ebperinnt 11
RaW Sc-ores for Each Child
Subject
AND
BAL
BRO
BUR
OLE
Gb
TotalError
53
4
1
5
18
40
ReversedSecjueoe
0
2
10
Real Word LiL ErT0I'S
ReversedOrientation
OtherConsonant
5
1
1
6
5
Vow
19
2
0
7
21
11
1
0
4
3
4
GOU 94 12 11 39 32
LOM 4 0 0 0 4
MCD 9 1 7
RIV 59 6 3 11 39
BRA 21 1 6 14
FIT 19 2 3 2 12
BAR 33 5 5 14 9
KIN 30 3 17
IAN 25 0 0 1 24
MIS 32 3 4 14 11
NEM 95 12 26 52
TUL 99 11 9 30
TUR 1 0 0
WEA 12 7
Eean 30.7 3.5 3.7 8.1 15.4
*Sum of Let and retert scor nabined.
53

5.13T,E I
Experiment 11
Relati .., Frequency of Error Types for Each Child:
Percentage of Total Er
eversed
Real Word List
Other.RevorsedSubject Sequence Orientation Consona t Vowel
AND 15.1 20.8 28.3 35.8
BAL 0.0 25.0 25.0 50.0
BRO 0.0 0.0 0 0 100.0
BUR 0.0 8090 20.0 0.0
CLE 11.1 16.7 33.3 38.9
GIO 25.0 10.0 12.5 52.5
GOU 12.8 11.7 41.5 34.0
LOM 0.0 0.0 0.0 100.0
110D 0.0 11.1 11.1 77.8
RIV 10.2 5.1 18.6 66.1
BRA 4.8 0.0 28.6 66.7
FIT 10.5 15.8 10.5 63.2
HAR 15.2 15.2 42.4 27.3
KIN 10.0 6.7 26.7 56.7
0.0 0.0 4.0 96.0
Nis 9.4 12.5 43.8 34.4
FEK 5.3 12.6 27.4 54.7
TUL 18.6 15.3 15.3 50.8
TUR 0.0 100.0 0.0 0.0
WEA 16.7 0.0 25.0 58.3
M an 8.2 17.9 _0.7 53.2
54
61

TABLE
Honaural Identification Stimuli
1, To.
Ga2.
3. Pa
4. Ka
Da5.
6. Pa
7. Ga
. Da
9. Ga
10.
11. Pa
12. Ta
13. Pa
14. ca.
15.
55
62
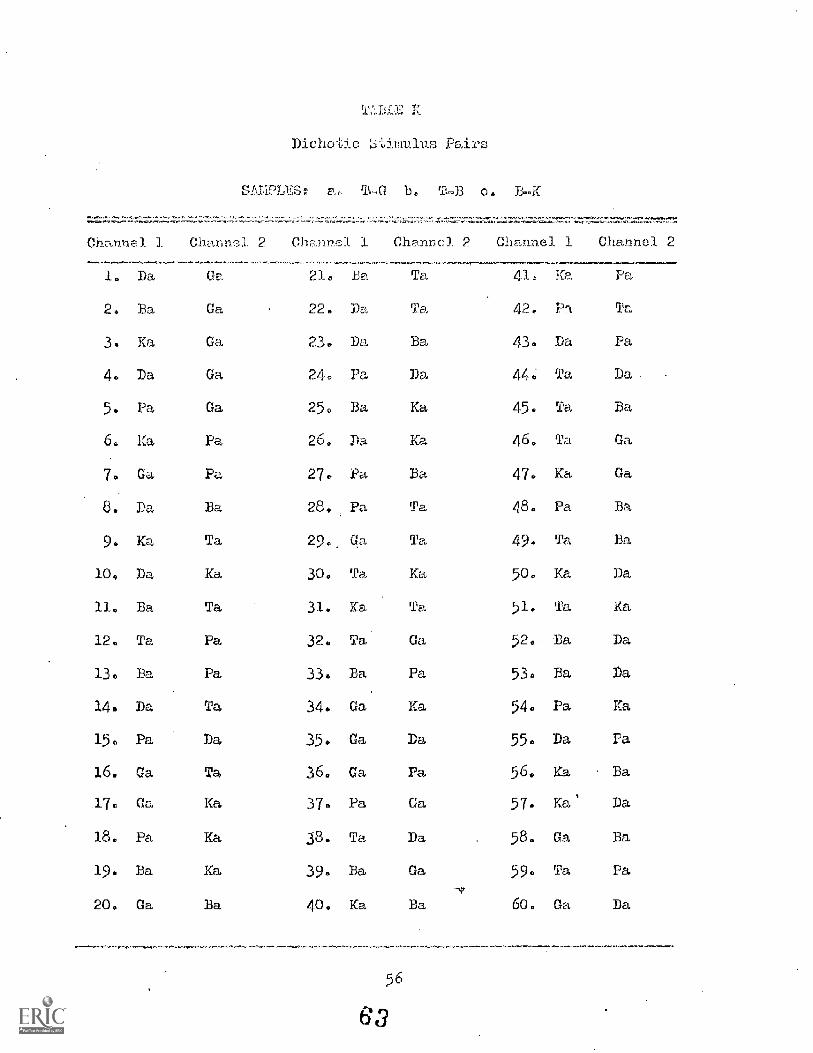
K
Diehottc LiidraTalus Pairs
EwarTLES: a. T-G b. T-D c. D-K
Channel 1 Channt7)1 2 Channal 1 Channel 2 Channel 1 Channel 2
1. Da Ca 21. Ba Ta 4L Ka Pa
2. Da Ga 22. Da Ta 42. PI Ta
3. Ka Ga 23. Da Ba 43. Da P
4, Da Ga 24. Pa Da 44. Ta Da
5. Pa Ga 25. Ba Ka 45. Ta Ba
6. Ka Pa 26. Pa Ka 46. Ta Ga
7. Ga 27. Pa Da 47. Ka Ga
. Da Ba 28. Pa wa 48. Pa Da
9. Ka Ta 29.. Ca Ta 49. Ta Da
10, Da Ka 30. Ta Ka 50. Ka Da
11, Ba Ta 31. Ka Ta 51. Ta Ka
12. Ta Pa 32. Ta Oa 52. Da Da
13. Da Pa 33. Ba Pa 53. Da Da
14. Da Ta 34. Cla Ka 54. Pa Ka
15. Pa Da 35. Ca Da 55, Da Pa
16. Ga Ta 36. Ga Pa 56* Ka Da
17. Ga Ka 370 Ga 57. Ka' Da
18. Pa Ka 3 . Da 58. Ga Ba
19. Ba Ka 39. Ba 59. Ta Pa
20. Ga Da 40. Ka 60. Ga Da
.e.saamaagiars
56

Gray's.Subject
--11-' ral"' Total Rovorsod Reversed Other R-LF.fror Sequence Orientation Consonant Vowel 141, -RAW
Croup 1, Exper:....,'Aelft III
'00Lq:3 and Dichotic Index
Real Word LiWZ. Error,s Dichotic Scores
101I
rE41:
ALB 15 38 6 7 5 20 127 8
BAR 17 44 4 10 13 12 . 183 4 4
hUR 17 45 5 13 8 19 184 47 47
TTN 17 47 3 14 7 ,,n') 181 -9 9
110x 15 57 10 18 16 13 161 5 5
LEG 10 57 11 9 15 22 150 -1 1
MOR 1e 63 7 11 21 24 159 34 34
RCN 11 63 7 6 25 25 163 19 19
LEE 8 72 9 9 13 41 164 8 8
COR 13 73 6 2 32 33 172 14 14
WAU 10 77 9 -i 21 40 191 22 22
WID 4 107 6 19 23 54 158 30 30
KEL 10 103 8 21 25 54 173 7 7
SOU 0 201 21 13 96 71 148 14 14
GRE 1 107 6 8 41 52 150 1 1
57
6 4

Group 2 Ex- oriment III
Reading Score-, and Dichotic Index
Real Word LGray's
Su j-ctParagraphs Toia1 Rovorsed Reversed OLher
Error Sequence Orientation Conoonant
Dichotic Scor ,
p.4,
I RA,
AND 8 3 8 173 13 13
BAL 26 4 0 ..1 1 2 180 21 21
BRO 35 1 0 0 0 1 181 -20 20
BUR 26 0 4 1 0 177 12 12
CLE 24 18 2 3 6 7 162 9 9
'OW 11 40 10 4 5 21 130 -6 6
GOU 11 94 12 11 39 32 140 4 4
LOM 27 4 0 0 0 4 150 -9 9
MCD 21 9 0 1 1 7 199 -16 16
Rly 23 9 6 3 11 39 133 6 6
BRA 27 21 1 0 6 14 206 6 6
FIT 23 19 2 3 2 12 190 8 8
HAR 18 33 5 5 14 9 202 56 56
KIN 21 30 3 2 8 17 163 14 14
LAN 18 25 0 0 1 24. 142 -4 4
MIS 26 32 3 4 14 11 193 16 16
NEM 18 95 5 12 26 52 167 16 16
TUL 18 59 11 9 9 30 183 3 3
TUR 30 1 0 1 0 0 183 26 26
WEA 29 12 2 0 3 7 180 30 30
58

Group 3 ElperimcnIt III
Reading Soors and Dichotic index
=;-- --
SubjectTotalError
Real Word List Errors Dichotic 3cores
Reverf4ed Reversed Other RLScquonce Orientation Consonant Vowel Pq-1, R+L
ARD 2 0 0 2 202 38 38
BER 22 4 0 1 17 181 11 11
BIS 4 0 0 4 185 13 13
22 8 5 7 148 6 6
COL 6 1 1 3 190 9 9
DOW 5 1 0 0 4 157 14 14
DUE 31 4 2 4 21 173 8 8
GOR 6 0 1 4 167 32 32
JOS 4 0 0 0 4 168 4 7
KRU 33 5 7 16 117 5 5
LOJ 3 2 0 0 1 189 2 2
MAR 10 2 2 6 130 16 16
MCL 18 2 2 11 142 5
OUL 48 9 13 19 176 38 38
PAP 20 6 3 11 . 157 7 7
PER 49 11 8 6 24 194 26 26
PET 11 0 5 5 175 13 13
RAD 31 6 0 9 16 124 0 0
RU5 16 0 0 2 14 189 31 31
IT 1 0 0 0 1 177 38 38
VIC 140 31 19 19 71 183 12 12
WEI 3 0 0 0 3 198 7 7
5 9

TilLE 0
Group 11 Experiment TIT
Intercorrolation Matrix
TotalError
ReversedSequence
ReversedOrientation
OtherConsonant
Vowel
Right+Left
SignedIndex
UnsignedIndex
ReversedSequence
77**
Real Uord List Errors
Reversed OtherOrientation Consonant
25 94**
10 78**
03
Vowel
91**
55*
22
75
RI-I,
23
34
08
25
17
Dichotic
Signedindex
03
03
05
02
04
19
Scores
UnsignedIndex
GrayParagraphScores
05
13
10
06
02
30
95**
85**
59*
07
75**
8844-x
40
01
12
Note.--The table contains Pearson product-moment correlation coefficients.
The decimals and signs are deleted*
*p < .05
**p < .01
60
6 7

f
Gr-).p 2, Experiment III
Interoorrelation Matrix
ReversedSequence
R2o.1 Uord List Erpors
Reversed Other
Orientation Consonant .Vowel RA
Dichotic Sool-es
Signed UnsignedIndex Index
GrayParagrBoores
TotalError 81** 86** 90** 28 07 25 70**
ReversedSequence 78** 7 ** 64" 33 05 22 77**
ReversedOrientati- 82** 66** 19 17 12 72**
OtherConsonant 68** 21 21 06 59"
Vowel- 27 06 37 58-x
Right+Left 34 44- 45'3 '
SignedIndex 7y* 03
Unsignedindex 22
Note.--The table contains Pearson product-moment corre ation coefficients.
The decimals and
*p < .05
**p < .01
are deleted.

Tt,BLE
Group
I i,ercorrolation
nt
-a
TotalError
ReversedSequence
ReversedOricxtatioi
OtherConsonant
Volel
R.,ght Left
Real Word Lis- Zricrs
Reversed Rerereed 0terSequence Oriontatiol Consonant
91 91**
-86**
Vowel
98-
84**
8 *
R+L
01
04
00
18
02
1-ti
SignodIndex
02
02
04
02
06
36
Unsi nedIndex
04
05
00
01
o6
41
SignedIndex
Note -The table contains Peax
The d- imals and signs are deli'-do
*P < .05
-*p <
95'.**
-on prothic t-monient correlation coef lents.
62
69