dd , and d systems - arxiv.org · 2 california institute of technology, pasadena, california 91125,...
TRANSCRIPT

arX
iv:0
903.
1597
v1 [
hep-
ex]
9 M
ar 2
009
BABAR-PUB-08/057SLAC-PUB-13560
Exclusive Initial-State-Radiation Production of the DD, D∗D, and D
∗D
∗ Systems
B. Aubert, Y. Karyotakis, J. P. Lees, V. Poireau, E. Prencipe, X. Prudent, and V. TisserandLaboratoire d’Annecy-le-Vieux de Physique des Particules (LAPP),
Universite de Savoie, CNRS/IN2P3, F-74941 Annecy-Le-Vieux, France
J. Garra Tico and E. GraugesUniversitat de Barcelona, Facultat de Fisica, Departament ECM, E-08028 Barcelona, Spain
L. Lopezab, A. Palanoab, and M. Pappagalloab
INFN Sezione di Baria; Dipartimento di Fisica, Universita di Barib, I-70126 Bari, Italy
G. Eigen, B. Stugu, and L. SunUniversity of Bergen, Institute of Physics, N-5007 Bergen, Norway
M. Battaglia, D. N. Brown, L. T. Kerth, Yu. G. Kolomensky, G. Lynch, I. L. Osipenkov, K. Tackmann, and T. TanabeLawrence Berkeley National Laboratory and University of California, Berkeley, California 94720, USA
C. M. Hawkes, N. Soni, and A. T. WatsonUniversity of Birmingham, Birmingham, B15 2TT, United Kingdom
H. Koch and T. SchroederRuhr Universitat Bochum, Institut fur Experimentalphysik 1, D-44780 Bochum, Germany
D. J. Asgeirsson, B. G. Fulsom, C. Hearty, T. S. Mattison, and J. A. McKennaUniversity of British Columbia, Vancouver, British Columbia, Canada V6T 1Z1
M. Barrett, A. Khan, and A. Randle-CondeBrunel University, Uxbridge, Middlesex UB8 3PH, United Kingdom
V. E. Blinov, A. D. Bukin, A. R. Buzykaev, V. P. Druzhinin, V. B. Golubev,
A. P. Onuchin, S. I. Serednyakov, Yu. I. Skovpen, E. P. Solodov, and K. Yu. TodyshevBudker Institute of Nuclear Physics, Novosibirsk 630090, Russia
M. Bondioli, S. Curry, I. Eschrich, D. Kirkby, A. J. Lankford, P. Lund, M. Mandelkern, E. C. Martin, and D. P. StokerUniversity of California at Irvine, Irvine, California 92697, USA
S. Abachi and C. BuchananUniversity of California at Los Angeles, Los Angeles, California 90024, USA
H. Atmacan, J. W. Gary, F. Liu, O. Long, G. M. Vitug, Z. Yasin, and L. ZhangUniversity of California at Riverside, Riverside, California 92521, USA
V. SharmaUniversity of California at San Diego, La Jolla, California 92093, USA
C. Campagnari, T. M. Hong, D. Kovalskyi, M. A. Mazur, and J. D. RichmanUniversity of California at Santa Barbara, Santa Barbara, California 93106, USA
T. W. Beck, A. M. Eisner, C. A. Heusch, J. Kroseberg, W. S. Lockman,
A. J. Martinez, T. Schalk, B. A. Schumm, A. Seiden, and L. O. WinstromUniversity of California at Santa Cruz, Institute for Particle Physics, Santa Cruz, California 95064, USA
C. H. Cheng, D. A. Doll, B. Echenard, F. Fang, D. G. Hitlin, I. Narsky, T. Piatenko, and F. C. Porter

2
California Institute of Technology, Pasadena, California 91125, USA
R. Andreassen, G. Mancinelli, B. T. Meadows, K. Mishra, and M. D. SokoloffUniversity of Cincinnati, Cincinnati, Ohio 45221, USA
P. C. Bloom, W. T. Ford, A. Gaz, J. F. Hirschauer, M. Nagel, U. Nauenberg, J. G. Smith, and S. R. WagnerUniversity of Colorado, Boulder, Colorado 80309, USA
R. Ayad,∗ A. Soffer,† W. H. Toki, and R. J. WilsonColorado State University, Fort Collins, Colorado 80523, USA
E. Feltresi, A. Hauke, H. Jasper, M. Karbach, J. Merkel, A. Petzold, B. Spaan, and K. WackerTechnische Universitat Dortmund, Fakultat Physik, D-44221 Dortmund, Germany
M. J. Kobel, R. Nogowski, K. R. Schubert, R. Schwierz, and A. VolkTechnische Universitat Dresden, Institut fur Kern- und Teilchenphysik, D-01062 Dresden, Germany
D. Bernard, G. R. Bonneaud, E. Latour, and M. VerderiLaboratoire Leprince-Ringuet, CNRS/IN2P3, Ecole Polytechnique, F-91128 Palaiseau, France
P. J. Clark, S. Playfer, and J. E. WatsonUniversity of Edinburgh, Edinburgh EH9 3JZ, United Kingdom
M. Andreottiab, D. Bettonia, C. Bozzia, R. Calabreseab, A. Cecchiab, G. Cibinettoab,
P. Franchiniab, E. Luppiab, M. Negriniab, A. Petrellaab, L. Piemontesea, and V. Santoroab
INFN Sezione di Ferraraa; Dipartimento di Fisica, Universita di Ferrarab, I-44100 Ferrara, Italy
R. Baldini-Ferroli, A. Calcaterra, R. de Sangro, G. Finocchiaro,
S. Pacetti, P. Patteri, I. M. Peruzzi,‡ M. Piccolo, M. Rama, and A. ZalloINFN Laboratori Nazionali di Frascati, I-00044 Frascati, Italy
R. Contriab, E. Guido, M. Lo Vetereab, M. R. Mongeab, S. Passaggioa, C. Patrignaniab, E. Robuttia, and S. Tosiab
INFN Sezione di Genovaa; Dipartimento di Fisica, Universita di Genovab, I-16146 Genova, Italy
K. S. Chaisanguanthum and M. MoriiHarvard University, Cambridge, Massachusetts 02138, USA
A. Adametz, J. Marks, S. Schenk, and U. UwerUniversitat Heidelberg, Physikalisches Institut, Philosophenweg 12, D-69120 Heidelberg, Germany
F. U. Bernlochner, V. Klose, and H. M. LackerHumboldt-Universitat zu Berlin, Institut fur Physik, Newtonstr. 15, D-12489 Berlin, Germany
D. J. Bard, P. D. Dauncey, and M. TibbettsImperial College London, London, SW7 2AZ, United Kingdom
P. K. Behera, X. Chai, M. J. Charles, and U. MallikUniversity of Iowa, Iowa City, Iowa 52242, USA
J. Cochran, H. B. Crawley, L. Dong, W. T. Meyer, S. Prell, E. I. Rosenberg, and A. E. RubinIowa State University, Ames, Iowa 50011-3160, USA
Y. Y. Gao, A. V. Gritsan, and Z. J. GuoJohns Hopkins University, Baltimore, Maryland 21218, USA
N. Arnaud, J. Bequilleux, A. D’Orazio, M. Davier, J. Firmino da Costa, G. Grosdidier, F. Le Diberder, V. Lepeltier,
A. M. Lutz, S. Pruvot, P. Roudeau, M. H. Schune, J. Serrano, V. Sordini,§ A. Stocchi, and G. WormserLaboratoire de l’Accelerateur Lineaire, IN2P3/CNRS et Universite Paris-Sud 11,

3
Centre Scientifique d’Orsay, B. P. 34, F-91898 Orsay Cedex, France
D. J. Lange and D. M. WrightLawrence Livermore National Laboratory, Livermore, California 94550, USA
I. Bingham, J. P. Burke, C. A. Chavez, J. R. Fry, E. Gabathuler,R. Gamet, D. E. Hutchcroft, D. J. Payne, and C. Touramanis
University of Liverpool, Liverpool L69 7ZE, United Kingdom
A. J. Bevan, C. K. Clarke, F. Di Lodovico, R. Sacco, and M. SigamaniQueen Mary, University of London, London, E1 4NS, United Kingdom
G. Cowan, S. Paramesvaran, and A. C. WrenUniversity of London, Royal Holloway and Bedford New College, Egham, Surrey TW20 0EX, United Kingdom
D. N. Brown and C. L. DavisUniversity of Louisville, Louisville, Kentucky 40292, USA
A. G. Denig, M. Fritsch, W. Gradl, and A. HafnerJohannes Gutenberg-Universitat Mainz, Institut fur Kernphysik, D-55099 Mainz, Germany
K. E. Alwyn, D. Bailey, R. J. Barlow, G. Jackson, G. D. Lafferty, T. J. West, and J. I. YiUniversity of Manchester, Manchester M13 9PL, United Kingdom
J. Anderson, C. Chen, A. Jawahery, D. A. Roberts, G. Simi, and J. M. TuggleUniversity of Maryland, College Park, Maryland 20742, USA
C. Dallapiccola, E. Salvati, and S. SaremiUniversity of Massachusetts, Amherst, Massachusetts 01003, USA
R. Cowan, D. Dujmic, P. H. Fisher, S. W. Henderson, G. Sciolla, M. Spitznagel, R. K. Yamamoto, and M. ZhaoMassachusetts Institute of Technology, Laboratory for Nuclear Science, Cambridge, Massachusetts 02139, USA
P. M. Patel, S. H. Robertson, and M. SchramMcGill University, Montreal, Quebec, Canada H3A 2T8
A. Lazzaroab, V. Lombardoa, F. Palomboab, and S. StrackaINFN Sezione di Milanoa; Dipartimento di Fisica, Universita di Milanob, I-20133 Milano, Italy
J. M. Bauer, L. Cremaldi, R. Godang,¶ R. Kroeger, D. J. Summers, and H. W. ZhaoUniversity of Mississippi, University, Mississippi 38677, USA
M. Simard and P. TarasUniversite de Montreal, Physique des Particules, Montreal, Quebec, Canada H3C 3J7
H. NicholsonMount Holyoke College, South Hadley, Massachusetts 01075, USA
G. De Nardoab, L. Listaa, D. Monorchioab, G. Onoratoab, and C. Sciaccaab
INFN Sezione di Napolia; Dipartimento di Scienze Fisiche,Universita di Napoli Federico IIb, I-80126 Napoli, Italy
G. Raven and H. L. SnoekNIKHEF, National Institute for Nuclear Physics and High Energy Physics, NL-1009 DB Amsterdam, The Netherlands
C. P. Jessop, K. J. Knoepfel, J. M. LoSecco, and W. F. WangUniversity of Notre Dame, Notre Dame, Indiana 46556, USA

4
L. A. Corwin, K. Honscheid, H. Kagan, R. Kass, J. P. Morris,
A. M. Rahimi, J. J. Regensburger, S. J. Sekula, and Q. K. WongOhio State University, Columbus, Ohio 43210, USA
N. L. Blount, J. Brau, R. Frey, O. Igonkina, J. A. Kolb, M. Lu,
R. Rahmat, N. B. Sinev, D. Strom, J. Strube, and E. TorrenceUniversity of Oregon, Eugene, Oregon 97403, USA
G. Castelliab, N. Gagliardiab, M. Margoniab, M. Morandina,
M. Posoccoa, M. Rotondoa, F. Simonettoab, R. Stroiliab, and C. Vociab
INFN Sezione di Padovaa; Dipartimento di Fisica, Universita di Padovab, I-35131 Padova, Italy
P. del Amo Sanchez, E. Ben-Haim, H. Briand, J. Chauveau,O. Hamon, Ph. Leruste, J. Ocariz, A. Perez, J. Prendki, and S. Sitt
Laboratoire de Physique Nucleaire et de Hautes Energies,IN2P3/CNRS, Universite Pierre et Marie Curie-Paris6,Universite Denis Diderot-Paris7, F-75252 Paris, France
L. GladneyUniversity of Pennsylvania, Philadelphia, Pennsylvania 19104, USA
M. Biasiniab and E. Manoniab
INFN Sezione di Perugiaa; Dipartimento di Fisica, Universita di Perugiab, I-06100 Perugia, Italy
C. Angeliniab, G. Batignaniab, S. Bettariniab, G. Calderiniab,∗∗ M. Carpinelliab,†† A. Cervelliab, F. Fortiab,
M. A. Giorgiab, A. Lusianiac, G. Marchioriab, M. Morgantiab, N. Neriab, E. Paoloniab, G. Rizzoab, and J. J. Walsha
INFN Sezione di Pisaa; Dipartimento di Fisica, Universita di Pisab; Scuola Normale Superiore di Pisac, I-56127 Pisa, Italy
D. Lopes Pegna, C. Lu, J. Olsen, A. J. S. Smith, and A. V. TelnovPrinceton University, Princeton, New Jersey 08544, USA
F. Anullia, E. Baracchiniab, G. Cavotoa, R. Facciniab, F. Ferrarottoa, F. Ferroniab, M. Gasperoab,P. D. Jacksona, L. Li Gioia, M. A. Mazzonia, S. Morgantia, G. Pireddaa, F. Rengaab, and C. Voenaa
INFN Sezione di Romaa; Dipartimento di Fisica,Universita di Roma La Sapienzab, I-00185 Roma, Italy
M. Ebert, T. Hartmann, H. Schroder, and R. WaldiUniversitat Rostock, D-18051 Rostock, Germany
T. Adye, B. Franek, E. O. Olaiya, and F. F. WilsonRutherford Appleton Laboratory, Chilton, Didcot, Oxon, OX11 0QX, United Kingdom
S. Emery, L. Esteve, G. Hamel de Monchenault, W. Kozanecki, G. Vasseur, Ch. Yeche, and M. ZitoCEA, Irfu, SPP, Centre de Saclay, F-91191 Gif-sur-Yvette, France
X. R. Chen, H. Liu, W. Park, M. V. Purohit, R. M. White, and J. R. WilsonUniversity of South Carolina, Columbia, South Carolina 29208, USA
M. T. Allen, D. Aston, R. Bartoldus, J. F. Benitez, R. Cenci, J. P. Coleman, M. R. Convery,J. C. Dingfelder, J. Dorfan, G. P. Dubois-Felsmann, W. Dunwoodie, R. C. Field, A. M. Gabareen,
M. T. Graham, P. Grenier, C. Hast, W. R. Innes, J. Kaminski, M. H. Kelsey, H. Kim, P. Kim,
M. L. Kocian, D. W. G. S. Leith, S. Li, B. Lindquist, S. Luitz, V. Luth, H. L. Lynch, D. B. MacFarlane,
H. Marsiske, R. Messner, D. R. Muller, H. Neal, S. Nelson, C. P. O’Grady, I. Ofte, M. Perl, B. N. Ratcliff,
A. Roodman, A. A. Salnikov, R. H. Schindler, J. Schwiening, A. Snyder, D. Su, M. K. Sullivan, K. Suzuki,S. K. Swain, J. M. Thompson, J. Va’vra, A. P. Wagner, M. Weaver, C. A. West, W. J. Wisniewski,
M. Wittgen, D. H. Wright, H. W. Wulsin, A. K. Yarritu, K. Yi, C. C. Young, and V. ZieglerSLAC National Accelerator Laboratory, Stanford, CA 94309, USA

5
P. R. Burchat, A. J. Edwards, and T. S. MiyashitaStanford University, Stanford, California 94305-4060, USA
S. Ahmed, M. S. Alam, J. A. Ernst, B. Pan, M. A. Saeed, and S. B. ZainState University of New York, Albany, New York 12222, USA
S. M. Spanier and B. J. WogslandUniversity of Tennessee, Knoxville, Tennessee 37996, USA
R. Eckmann, J. L. Ritchie, A. M. Ruland, C. J. Schilling, and R. F. SchwittersUniversity of Texas at Austin, Austin, Texas 78712, USA
B. W. Drummond, J. M. Izen, and X. C. LouUniversity of Texas at Dallas, Richardson, Texas 75083, USA
F. Bianchiab, D. Gambaab, and M. Pelliccioniab
INFN Sezione di Torinoa; Dipartimento di Fisica Sperimentale, Universita di Torinob, I-10125 Torino, Italy
M. Bombenab, L. Bosisioab, C. Cartaroab, G. Della Riccaab, L. Lanceriab, and L. Vitaleab
INFN Sezione di Triestea; Dipartimento di Fisica, Universita di Triesteb, I-34127 Trieste, Italy
V. Azzolini, N. Lopez-March, F. Martinez-Vidal, D. A. Milanes, and A. OyangurenIFIC, Universitat de Valencia-CSIC, E-46071 Valencia, Spain
J. Albert, Sw. Banerjee, B. Bhuyan, H. H. F. Choi, K. Hamano, G. J. King,
R. Kowalewski, M. J. Lewczuk, I. M. Nugent, J. M. Roney, and R. J. SobieUniversity of Victoria, Victoria, British Columbia, Canada V8W 3P6
T. J. Gershon, P. F. Harrison, J. Ilic, T. E. Latham, G. B. Mohanty, and E. M. T. PuccioDepartment of Physics, University of Warwick, Coventry CV4 7AL, United Kingdom
H. R. Band, X. Chen, S. Dasu, K. T. Flood, Y. Pan, R. Prepost, C. O. Vuosalo, and S. L. WuUniversity of Wisconsin, Madison, Wisconsin 53706, USA
We perform a study of the exclusive production of DD, D∗D, and D∗D∗ in initial-state-radiationevents, from e+e− annihilations at a center-of-mass energy near 10.58 GeV, to search for charmoniumand possible new resonances. The data sample corresponds to an integrated luminosity of 384 fb−1
and was recorded by the BABAR experiment at the PEP-II storage rings. The DD, D∗D, andD∗D∗ mass spectra show clear evidence of several ψ resonances. However, there is no evidence forY (4260) → D∗D or Y (4260) → D∗D∗.
PACS numbers: 13.66.Bc, 13.87.Fh, 14.40.Gx
∗Now at Temple University, Philadelphia, Pennsylvania 19122,USA†Now at Tel Aviv University, Tel Aviv, 69978, Israel‡Also with Universita di Perugia, Dipartimento di Fisica, Perugia,Italy§Also with Universita di Roma La Sapienza, I-00185 Roma, Italy¶Now at University of South Alabama, Mobile, Alabama 36688,USA∗∗Also with Laboratoire de Physique Nucleaire et de Hautes Ener-gies, IN2P3/CNRS, Universite Pierre et Marie Curie-Paris6, Uni-versite Denis Diderot-Paris7, F-75252 Paris, France††Also with Universita di Sassari, Sassari, Italy
I. INTRODUCTION
The surprising discovery of new states decaying toJ/ψπ+π− [1, 2] has renewed interest in the field ofcharmonium spectroscopy, since the new resonances arenot easy to accommodate in the quark model. In par-ticular, the BABAR experiment discovered a new broadstate, Y (4260), decaying to J/ψπ+π− in the initial-state-radiation (ISR) reaction e+e− → γISRY (4260). Thequantum numbers JPC = 1−− are inferred from the sin-gle virtual-photon production mechanism. Further struc-tures at 4.36 GeV/c2 [3, 4] and 4.66 GeV/c2 [4] havebeen observed in the ψ(2S)π+π− mass distribution fromthe reaction e+e− → γISRψ(2S)π
+π−. Charmoniumstates at these masses would be expected [5, 6] to decay

6
predominantly to DD, D∗D, or D∗D∗ [7]. It is pecu-liar that the decay rate to the hidden charm final stateJ/ψπ+π− is much larger for the Y (4260) than for excitedcharmonium states [8], and that at the Y (4260) massthe cross section for e+e− → hadrons exhibits a localminimum [9]. Several theoretical interpretations for theY (4260) have been proposed, including unconventionalscenarios: quark-antiquark gluon hybrids [10], baryo-nium [11], tetraquarks [12], and hadronic molecules [13].For a discussion and a list of references see, for example,Ref. [14].
This work explores ISR production of DD, D∗D, andD∗D∗ final states for evidence of charmonium states andunconventional structures. This follows an earlier BABARmeasurement of the DD cross section [15]. A study bythe Belle collaboration of the DD, D∗D, and D∗D∗ finalstates can be found in Refs. [16, 17]. Recent measure-ments of the e+e− cross sections can be found in Ref. [18].
We also measure for the first time branching fractionsof high mass charmonium states, other than Y (4260),for which little information exists [9], and compare ourmeasurements with theoretical expectations [5, 6, 14].
This paper is organized as follows. In Section II wegive a short description of the BABAR experiment and inSection III we describe the data selection. Section IVis devoted to the selection of the D∗D final state and inSection V, we present the mass resolution, reconstructionefficiency, and measured cross sections. In Section VI wedescribe the D∗D∗ cross section measurement while inSection VII we present the DD data. The description ofthe fit of the three channels is described in Section VIII,while Section IX is devoted to the measurements of theratios of branching fractions. Finally, in Section X, wecompute the limit on production of Y (4260) decaying toD∗D and D∗D∗, and summarize conclusions in SectionXI.
II. THE BABAR EXPERIMENT
This analysis is based on a 384 fb−1 data samplerecorded at the Υ(4S) resonance and 40 MeV belowthe resonance by the BABAR detector at the PEP-IIasymmetric-energy e+e− storage rings. The BABAR de-tector is described in detail elsewhere [19]. We mentionhere only the parts of the detector which are used inthe present analysis. Charged particles are detected andtheir momenta measured with a combination of a cylin-drical drift chamber (DCH) and a silicon vertex tracker(SVT), both operating within a 1.5 T magnetic field of asuperconducting solenoid. The information from a ring-imaging Cherenkov detector combined with energy-lossmeasurements in the SVT and DCH provide identifi-cation of charged kaon and pion candidates. Photonenergies are measured with a CsI(Tl) electromagneticcalorimeter.
III. DATA SELECTION
DD candidates are reconstructed in the seven finalstates listed in Table I. The D∗0 → D0π0 and D∗0 →D0γ decay modes are used to form D∗0D0 and D∗0D∗0
candidates. The D∗+ → D0π+ and D∗+ → D+π0 de-cay modes are used to form D∗+D− and D∗+D∗− can-didates. Table II summarizes the full decay chains usedto reconstruct the D∗D and D∗D∗ candidates.For all final states, events are retained if the number of
well-measured charged tracks, having a minimum trans-verse momentum of 0.1 GeV/c, is exactly equal to thetotal number of charged daughter particles. Photons areidentified as EMC clusters that do not have a spatialmatch with a charged track, and that have a minimumenergy of 30 MeV. Neutral pion candidates are formedfrom pairs of photons kinematically fitted with the π0
mass constraint. K0Scandidates are reconstructed, with
a vertex fit, in the π+π− decay mode. The tracks corre-sponding to the charged daughters of each D candidateare constrained to come from a common vertex. Addi-tionally, for the D0 → K−π+π0 channel, the D0 massconstraint is included in the fit, and for the D− → K0
Sπ−
channel, aK0Smass constraint is imposed. Reconstructed
D candidates with a χ2 fit probability greater than 0.1%are retained. Each DD pair is refit to a common ver-tex with the constraint that the pair originates from thee+e− interaction region. Only candidates with a χ2 fitprobability greater than 0.1% are retained. Backgroundπ0 candidates from random combinations of photons andother background channels are suppressed by requiringno more than one π0 candidate other than those at-tributed to the D0 and D∗ decays. Similarly, we requirein the event no more than one extra photon candidate,having a minimum energy of 100 MeV, apart from anyphoton attributed to D∗ or π0 decays.For D decay modes without a π0 daughter, the D-
candidate momentum is determined from the summedthree-momenta of the decay particles and its energy iscomputed using the nominal D mass value [9]. Forthe D0 → K−π+π0 channel, the 4-momentum from themass-constrained fit is used. Similarly, the D∗ momen-tum is determined from the summed three-momenta ofthe decay particles and its energy is computed using thenominal D∗ mass.The ISR photon is preferentially emitted at small an-
gles with respect to the beam axis, and escapes detec-tion in the majority of ISR events. Consequently, theISR photon is treated as a missing particle. We definethe squared mass (M2
rec) recoiling against the DD, D∗D,and D∗D∗ systems using the four-momenta of the beamparticles (pe±) and of the reconstructed D (pD) and D∗
(pD∗):
M2rec ≡ (pe− + pe+ − pD(∗) − pD(∗))2 (1)
This quantity should peak near zero for both ISR eventsand for exclusive production of e+e− → D∗D or e+e− →D∗D∗. In exclusive production the D∗D and D∗D∗ mass

7
TABLE I: List of the reconstructed DD final states.
N Channel First D decay mode Second D decay mode
1 D0D0 D0 → K−π+ D0 → K+π−
2 D0D0 D0 → K−π+ D0 → K+π−π0
3 D0D0 D0 → K−π+ D0 → K+π−π+π−
4 D0D0 D0 → K−π+π0 D0 → K+π−π+π−
5 D+D− D+ → K−π+π+ D− → K+π−π−
6 D+D− D+ → K−π+π+ D− → K+K−π−
7 D+D− D+ → K−π+π+ D− → K0Sπ
−
TABLE II: List of the D∗D and D∗D∗ reconstructed final states. The reconstructed D0 decay modes are listed in Table I forthe D∗0D and D∗0D∗0 states. The column headed “Veto” lists ambiguities with the indicated channels, “Removed” indicatesthe fraction of events removed by the veto.
N Channel First decay mode Second decay mode Veto Removed %
8 D∗0D0 D∗0 → D0γ 9-12 5.99 D∗0D0 D∗0 → D0π0 11,12 3.2
10 D∗0D∗0 D∗0 → D0γ D∗0 → D0γ 9,11 1.111 D∗0D∗0 D∗0 → D0π0 D∗0 → D0γ 8,10 0.712 D∗0D∗0 D∗0 → D0π0 D∗0 → D0π0
13 D∗+D− D∗+ → D0π+, D0 → K−π+ D− → K+π−π−
14 D∗+D− D∗+ → D+π0, D+ → K−π+π+ D− → K+π−π−
15 D∗+D− D∗+ → D0π+, D0 → K−K+ D− → K+π−π−
16 D∗+D− D∗+ → D0π+, D0 → K−π+ D− → K+K−π−
17 D∗+D− D∗+ → D+π0, D+ → K−π+π+ D− → K+K−π−
18 D∗+D∗− D∗+ → D0π+, D0 → K−π+ D∗− → D0π−, D0 → K+π−
19 D∗+D∗− D∗+ → D+π0, D+ → K−π+π+ D∗− → D0π−, D0 → K+π−
distributions peak at the kinematic limit. Thereforewe select ISR candidates by requiring DD, D∗D andD∗D∗ invariant masses below 6 GeV/c2 and |M2
rec| <1 GeV2/c4.We select D and D∗ candidates based on the candidate
D mass and the mass difference ∆m =MD∗ −MD. TheD and D∗ parameters are obtained by fitting the relevantmass spectra (see Fig. 1 for some ∆m distributions) usinga polynomial for the background and a single Gaussianfor the signal. Events are selected within ±2.5σ from thefitted central values, where σ is the Gaussian width. ForD∗+ → D0π+, the selection criterion has been extendedto ±6σ due to the presence of non-Gaussian tails.Because of our tolerance of an extra π0 and/or γ, an
ambiguity can occur for channels involving a D∗0 whichis handled as follows. Each combination is considered asa possible candidate for channels 8-12 and D0D0. MonteCarlo simulations weighted by the DD, D∗D, and D∗D∗
measured cross sections [15, 16, 17] and branching frac-tions are used to optimize the selection criteria and es-timate the feedthrough of one channel to the other. Acandidate is rejected if (a) it satisfies all the selectioncriteria for an ambiguous channel and (b) this rejectiondoes not produce any significant loss in the channel un-der study and therefore can be classified as background.The list of channels rejected in case of ambiguities are
indicated in the “Veto” column in Table II. The tablealso lists the fraction of events removed by these cuts inthe |M2
rec| < 1 GeV2/c4 region.In the case of multiple D∗0 candidates, such as D∗0D∗0
with both D∗0 → D0γ, the candidate with m(D0γ) clos-est to the nominal D∗0 mass is accepted. The chargedD∗D and D∗D∗ modes, also listed in Table II, do notrequire such a procedure because backgrounds are negli-gible.
IV. STUDY OF THE D∗
D FINAL STATE
Figure 2 shows the D∗D M2rec distributions after all
the cuts for (a) D∗0D0, D∗0 → D0γ, (b) D∗0D0, D∗0 →D0π0, and (c) D∗+D−. Clear peaks centered at zerowith little background are observed, providing evidenceof an ISR process. The number of background eventsin the |M2
rec| < 1 GeV2/c4 is estimated by fitting theM2
rec distribution for each channel. The fits are per-formed using a 2nd order polynomial for the backgroundand a signal M2
rec lineshape obtained from Monte Carlosimulations corresponding to the relative composition ofthe data. The event yields are obtained by subtract-ing the fitted backgrounds and integrating the result-ing M2
rec distributions in the |M2rec| < 1 GeV2/c4 re-

8
0
25
50
75
100
0 0.2 0.40
25
50
75
100
0.12 0.14 0.16
0
10
20
0.14 0.15 0.160
5
10
15
20
0.12 0.14 0.16
FIG. 1: ∆m distributions for D∗D candidates after applyingthe |M2
rec| < 1 GeV2/c4 and m(D∗D) < 6 GeV/c2 selections,for (a) D∗0 → D0γ, (b) D∗0 → D0π0, (c) D∗+ → D0π+ withD0 → K−π+, and (d) D∗+ → D+π0 with D+ → K−π+π+.The shaded regions indicate the ranges used to select the D∗
candidates.
gion. The resulting yields and fitted purities, definedas P = Nsignal/(Nsignal + Nbackground), for each channelare summarized in Table III.The purity of each reconstructed D∗ channel is also
demonstrated in Fig. 1, where the ∆m distribution isshown for D∗D candidates with |M2
rec| < 1 GeV2/c4 andD∗D masses below 6 GeV/c2. The final selection of theISR candidates is performed applying the ∆m selectioncriteria described above.The D∗0D0 mass spectrum is shown in Fig. 3(a), and
the D∗+D− mass spectrum is shown in Fig. 3(b). Bothspectra show an enhancement near threshold due to thepresence of the ψ(4040) resonance.The background shape for D∗0D0 candidates is ex-
plored using the M2rec sideband region, 1.5 < M2
rec <3.5 GeV2/c4. TheD∗0D0 mass spectrum for these events,normalized to the background estimated from the fit tothe M2
rec distribution, is presented as the shaded his-togram in Fig. 3(a). This background has been fittedwith a threshold function:
B(m) = (m−mth)α+βme−γm−δm2−ǫm3
, (2)
where mth is the threshold D∗0D0 mass. The D∗+D−
final state is consistent with having zero background.
TABLE III: Number of ISR candidates and purities for thedifferent channels calculated in the range |M2
rec| < 1 GeV2/c4.The last column gives the value of the average efficiency ǫB
at a mass of 4.5 GeV/c2.
Channel Signal+ Purity(%) ǫB × 10−5
Background
D0D0 654 74.3 ± 1.7D+D− 199 88.4 ± 2.3
Total DD 853 77.6 ± 1.4 25
D∗0D0, D∗0 → D0γ 460 75.4 ± 2.0D∗0D0 D∗0 → D0π0 422 84.4 ± 1.8
Total D∗0D0 882 79.7 ± 1.4 4
D∗+D− 228 100+0
−3 5
Total D∗D 1110 83.6 ± 1.1
D∗0D∗0 293 69.3 ± 3.7
D∗+D∗− 33 100+0
−3
Total D∗D∗ 326 72.1 ± 2.5 1
V. MASS RESOLUTION, EFFICIENCY, AND
D∗
D CROSS SECTION
In order to measure efficiencies and D∗D mass resolu-tions, ISR events are simulated at five different values ofthe D∗D invariant masses between 4.25 and 6.25 GeV/c2.These events are simulated using the GEANT4 detectorsimulation package [20] and are processed through thesame reconstruction and analysis chain as real events.The mass resolution is determined from the differencebetween generated and reconstructed D∗D masses. TheD∗D mass resolutions are similar for all channels andincrease with D∗D mass from 5 to 10 MeV/c2.The mass-dependent reconstruction efficiency for chan-
nel i, ǫi(mD∗D), is parameterized by a second-order poly-nomial, and is multiplied by the decay branching fractionBi [9] to define
ǫBi (mD∗D) = ǫi(mD∗D)× Bi. (3)
These values are weighted by Ni(mD∗D), the number of
D∗D candidates in channel i, to compute the averageefficiency as a function of mD∗D,
ǫB(mD∗D) =
∑ni=1Ni(mD∗D)
∑ni=1
Ni(mD∗D)
ǫBi(m
D∗D)
, (4)
where n is the number of decay modes. In this casewe have eight D∗0D0 chanels (1-4 with D∗0 → D0γand D∗0 → D0π0) and two D∗+D− channels (13, 14).Representative values of ǫB, computed at a mass of 4.5GeV/c2, are displayed in Table III. The sample sizes forthe Cabibbo-suppressed decay modes (15, 16, and 17 inTable II) are very small (32 events total) and comprise14% of the D∗+D−sample. The efficiency for these de-cay channels has not been directly computed; instead,

9
0
20
40
60
80
-5 0 50
25
50
75
100
-5 0 50
20
40
60
-5 0 5
FIG. 2: Distribution of M2rec, the mass recoiling against the D∗D system, for (a) D∗0 → D0γ, (b) D∗0 → D0π0, and (c)
D∗+D− candidates. The curves are the results from the fits described in the text.
these modes are treated as having the mean efficiencyof the Cabibbo-allowed channels 13 and 14. The tenD∗D channels, after correcting for efficiency and branch-ing fractions, have yields that are consistent within thestatistical errors.The D∗D cross section is computed using
σe+e−→D∗D(mD∗D) =dN/dmD∗D
ǫB(mD∗D)dL/dmD∗D
, (5)
where dN/dmD∗D is the background-subtracted yield.The differential luminosity is computed as [21]
dL
dmD∗D
= L2mD∗D
s
α
πx(ln(s/m2
e)−1)(2−2x+x2), (6)
where s is the square of the e+e− center-of-mass energy,α is the fine-structure constant, x = 1−m2
D∗D/s, me is
the electron mass, and L is the integrated luminosity of384 fb−1. The cross sections for D∗0D0, D∗+D−, andcombined D∗0D0 and D∗+D− are shown in Fig. 4. Aclear ψ(4040) resonance is observed.The systematic uncertainties on the cross sections,
10.9% for D∗0D0 and 9.3% for D∗+D−, include un-certainties for particle identification, tracking, photonand π0 reconstruction efficiencies, background estimates,branching fractions, and a potential inaccuracy in thesimulation of extraneous tracks, photon and π0 candi-dates. The uncertainty due to the ISR selection hasbeen estimated by narrowing the M2
rec allowed range to0.7 GeV2/c4. All contributions are added in quadrature.Systematic uncertainties are summarized in Table IV.The D∗0D0 and D∗+D− cross sections have similar
features and consistent yields. Integrating the cross sec-tions from threshold to 6 GeV/c2, we obtain
σ(D∗+D−)
σ(D∗0D0)= 0.95± 0.09stat ± 0.10syst, (7)
TABLE IV: Systematic errors, given as fractional errors ex-pressed in %, in the evaluation of the D∗D cross section.
Effect D∗0D0 D∗+D−
Background subtraction 2.6 3.0Branching fractions 7.4 4.6M2
rec cut 2.2 0.0Particle identification 1.8 2.1Tracking efficiency 2.2 3.3Extraneous tracks 5.7 5.7π0 and γ reconstruction efficiency 3.4 3.0Extraneous π0 and γ 0.5 0.8Total 10.9 9.3
consistent with unity. In this calculation systematic er-rors related to the M2
rec selection criteria and trackingefficiency have been ignored because they largely cancelin the ratio.
VI. STUDY OF THE D∗
D∗ SYSTEM
A similar analysis is carried out for D∗D∗ channels.Figure 5 shows the ∆m distributions for D∗D∗ candi-dates with |M2
rec| < 1 GeV2/c4 and D∗D∗ masses below6 GeV/c2. The peak at threshold in Fig. 5(a) is due tobackground from D∗0 → D0π0 where one γ from the lowmomentum π0 is lost.We select the two D∗ candidates and reject candidates
reconstructed in any of the modes listed in the “veto”column in Table II. Figure 6 shows the D∗0D∗0 M2
rec
distributions for channels 10-12.The total D∗0D∗0 and D∗+D∗− M2
rec distributions areshown in Fig. 7. The number of background events for

10
0
20
40
60
4 4.5 5 5.5 60
20
40
60
4 4.5 5 5.5 6
0
5
10
15
4 4.5 5 5.5 6
FIG. 3: (a)D∗0D0 and (b)D∗+D− mass spectra. The shadedhistogram in (a) is obtained from the M2
rec sideband region1.5 < M2
rec < 3.5 GeV2/c4 normalized to the backgroundestimated from the fit to the M2
rec distribution. The curve isthe result from the fit described in the text.
the D∗0D∗0 channel is estimated by fitting the M2rec dis-
tribution. The fit is performed using a 2nd-order poly-nomial for the background and a signal M2
rec lineshapeobtained from Monte Carlo simulations that reflect thecomposition of the data. The number of ISR candi-dates and purities are also summarized in Table III. TheD∗+D∗− final state has a background consistent withzero.
Due to the small D∗+D∗− sample size, the chargedand neutral mass spectra are summed in Fig. 8. TheD∗D∗ mass spectrum shows unresolved peaks at ψ(4040)and ψ(4160) and an enhancement at the position of theψ(4400) [9].
The background is explored using events in the M2rec
0
2.5
5
4 4.5 5 5.5 6
0
2.5
5
4 4.5 5 5.5 6
0
5
10
4 4.5 5 5.5 6
FIG. 4: Cross section for e+e− → (a) D∗0D0, (b)D∗+D− and(c) D∗D combined. The error bars correspond to statisticalerrors only.
sideband regions −2.5 < M2rec < −1.5 GeV2/c4 and
1.5 < M2rec < 2.5 GeV2/c4, and fitted using Eq. (2). The
D∗D∗ mass spectrum for these events, normalized fromthe fit to the M2
rec distribution, is shown as the shadedhistogram in Fig. 8.
The D∗D∗ cross section is calculated using the samemethod used to compute the D∗D cross section. Theresult, summed over the neutral and charged modes, isshown in Fig. 9. All systematic uncertainties which havebeen taken into account for the D∗D∗ mode are listed inTable V; the overall uncertainty on the cross section is12.4%.
The D∗D∗ cross section distribution exhibits a thresh-old enhancement due to the superposition of the ψ(4040)

11
0
20
40
60
0 0.2 0.40
20
40
60
0.12 0.14 0.16
0
5
10
15
0.14 0.15 0.160
2
4
6
0.12 0.14 0.16
FIG. 5: ∆m distributions for D∗D∗ candidates after applyingthe |M2
rec| < 1 GeV2/c4 and m(D∗D∗) < 6 GeV/c2 selections,for (a) D∗0 → D0γ, (b) D∗0 → D0π0, (c) D∗+ → D0π+ withD0 → K−π+, and (d) D∗+ → D+π0 with D+ → K−π+π+.The shaded regions indicate the ranges used to select the D∗
signals.
0
10
20
-5 50
10
20
30
-5 50
5
10
15
20
-5 5
FIG. 6: M2rec distributions for D∗0D∗0 for (a) D∗0 → D0γ,
D∗0 → D0γ, (b) D∗0 → D0π0, D∗0 → D0γ, and (c) D∗0 →D0π0, D∗0 → D0π0.
and ψ(4160) resonances.
0
20
40
60
-5 0 50
2
4
6
8
10
-5 0 5
FIG. 7: M2rec distributions for (a) D∗0D∗0 and (b) D∗+D∗−.
The curve in (a) is the result from the fit described in thetext.
0
10
20
30
4 4.5 5 5.5 60
10
20
30
4 4.5 5 5.5 6
FIG. 8: D∗D∗ mass spectrum. The shaded histogram is ob-tained from the M2
rec sidebands −2.5 < M2rec < −1.5 and
1.5 < M2rec < 2.5 GeV2/c4. The curve is the result from the
fit described in the text.
VII. THE DD MASS SPECTRUM
In the selection of the D0D0 sample we also apply themethod of resolving ambiguous events having an addi-tional π0 and/or γ. Here we veto all events that areambiguous with channels 8-12, obtaining a rejection of7.6 % background events in the |M2
rec| < 1 GeV2/c4 re-gion. No such procedure is applied to the D+D− sample.The DD analysis is otherwise identical to that reportedin Ref. [15]. The resulting M2
rec distributions for D0D0
and D+D− channels are shown in Fig. 10. The curves

12
TABLE V: Systematic errors, given as fractional errors ex-pressed in %, in the evaluation of the D∗D∗ cross section.
Effect Fraction (%)Background subtraction 2.1Branching fractions 9.3M2
rec cut 1.3Particle identification 2.8Tracking efficiency 2.6Extraneous tracks 5.7π0 and γ reconstruction efficiency 4.1Total 12.4
0
2.5
5
7.5
10
4 4.5 5 5.5 6
FIG. 9: Cross section e+e− → D∗D∗ for combined D∗0D∗0
and D∗+D∗−. Error bars indicate the statistical errors only.
are the results from the fits performed using a 2nd or-der polynomial for the background and a M2
rec lineshapeobtained from Monte Carlo simulations that reflect thechannel composition of the data. Again, the resultingevent yields and purities are summarized in Table III.The combined DD mass spectrum is shown in Fig. 11.The background is explored using events in theM2
rec side-band regions 1.5 < M2
rec < 3.5 GeV2/c4 and fitted usingEq. (2). This background, normalized from the fit tothe M2
rec distributions, is shown as the shaded histogramin Fig. 11. The features in the DD mass spectrum andthe resulting DD cross section have been extensively dis-cussed in our previous publication [15].
VIII. FIT TO THE MASS SPECTRA
Unbinned maximum likelihood fits to the D0D0,D+D−, D∗0D0, D∗+D−, D∗0D∗0, and D∗+D∗− mass
0
50
100
150
-5 0 50
20
40
60
-5 0 5
FIG. 10: M2rec distribution for (a) D0D0 and (b) D+D−. The
curves are the results from the fits described in the text.
0
25
50
75
100
4 4.5 5 5.5 60
25
50
75
100
4 4.5 5 5.5 6
FIG. 11: DD mass distribution. The shaded histogram isobtained from the M2
rec sideband. The curve is the resultfrom the fit described in the text.
spectra are performed. We write the likelihood functionsas
L = fǫB(m)|P (m) + c1W1(m)eiφ1 + c2√
G(m)eiφ2 + ...
+cnWn(m)eiφn |2 + B(m)(1− f),
(8)
where m is the D(∗)D(∗) mass, ci and φi are free param-eters, Wi(m) are P-wave relativistic Breit-Wigner distri-butions [9], P (m) represents the nonresonant contribu-tion, B(m) describes the background, ǫB(m) is the av-
13
erage efficiency, and f is the signal fraction fixed to thevalues obtained fitting the M2
rec distributions.The parameters of the ψ(4040), ψ(4160), and ψ(4415)
are fixed to the values reported in the Review of ParticlePhysics [9]. The parameters of the ψ(3770) are fixed tothe values obtained in our previous analysis of the DDsystem [15]. The DD data require that we include the3.9 GeV/c2 structure, as suggested in Ref. [22], whichwe parametrize empirically as the square root of a Gaus-sian times a phase factor
√
G(m)eiφ2 . The parameters ofthe Gaussian are fixed to the values obtained in our pre-vious analysis of the DD system: mG(3900) = 3943 ± 17
MeV/c2, σG(3900) = 52±8 MeV/c2 [15]. The shape of thenonresonant contribution P (m) is unknown; we thereforeparametrize it in a simple way as
P (m) = C(m)(a+ bm), (9)
where C(m) is the phase space function for D(∗)D(∗),and a and b are free parameters. Resolution effects havebeen ignored since the widths of the resonances are muchlarger than the experimental resolution.Interference between the resonances and the nonreso-
nant contribution P (m) is required to obtain a satisfac-tory description of the data. The size of the nonresonantproduction is determined by the fit.The six D0D0, D+D−, D∗0D0, D∗+D−, D∗0D∗0, and
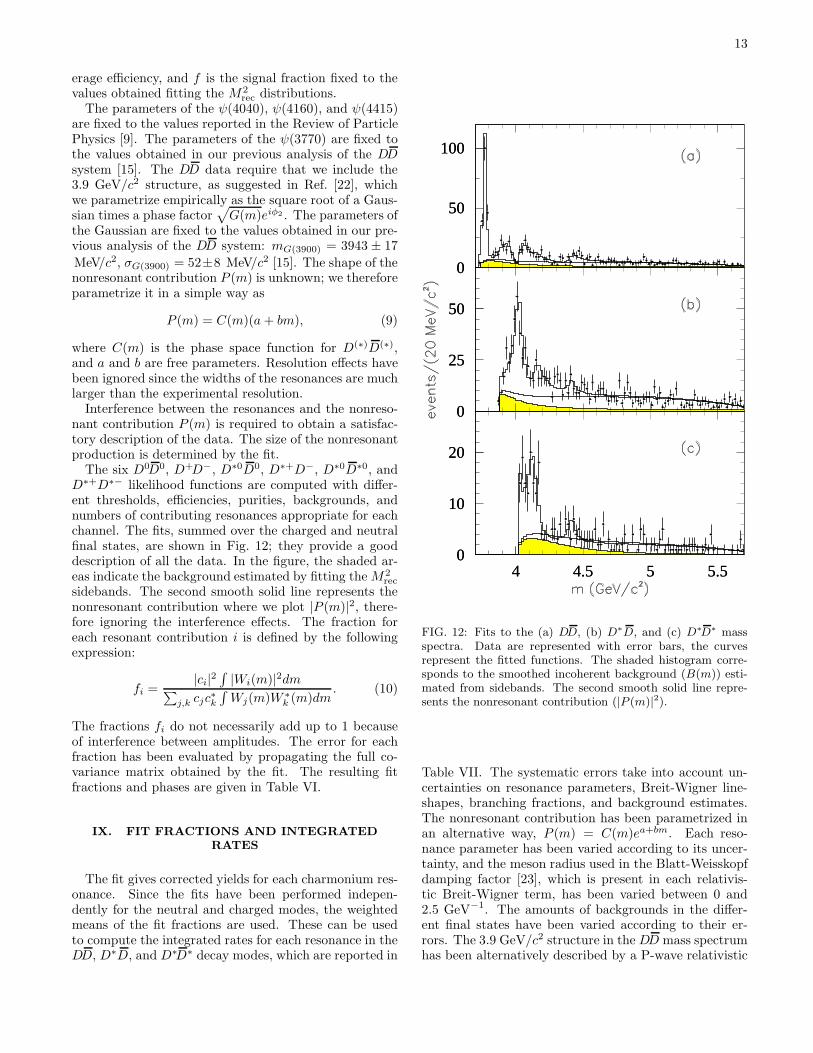
D∗+D∗− likelihood functions are computed with differ-ent thresholds, efficiencies, purities, backgrounds, andnumbers of contributing resonances appropriate for eachchannel. The fits, summed over the charged and neutralfinal states, are shown in Fig. 12; they provide a gooddescription of all the data. In the figure, the shaded ar-eas indicate the background estimated by fitting theM2
rec
sidebands. The second smooth solid line represents thenonresonant contribution where we plot |P (m)|2, there-fore ignoring the interference effects. The fraction foreach resonant contribution i is defined by the followingexpression:
fi =|ci|
2∫
|Wi(m)|2dm∑
j,k cjc∗k
∫
Wj(m)W ∗k (m)dm
. (10)
The fractions fi do not necessarily add up to 1 becauseof interference between amplitudes. The error for eachfraction has been evaluated by propagating the full co-variance matrix obtained by the fit. The resulting fitfractions and phases are given in Table VI.
IX. FIT FRACTIONS AND INTEGRATED
RATES
The fit gives corrected yields for each charmonium res-onance. Since the fits have been performed indepen-dently for the neutral and charged modes, the weightedmeans of the fit fractions are used. These can be usedto compute the integrated rates for each resonance in theDD, D∗D, and D∗D∗ decay modes, which are reported in
0
50
100
0
50
100
0
25
50
0
25
50
0
10
20
4 4.5 5 5.50
10
20
4 4.5 5 5.5
FIG. 12: Fits to the (a) DD, (b) D∗D, and (c) D∗D∗ massspectra. Data are represented with error bars, the curvesrepresent the fitted functions. The shaded histogram corre-sponds to the smoothed incoherent background (B(m)) esti-mated from sidebands. The second smooth solid line repre-sents the nonresonant contribution (|P (m)|2).
Table VII. The systematic errors take into account un-certainties on resonance parameters, Breit-Wigner line-shapes, branching fractions, and background estimates.The nonresonant contribution has been parametrized inan alternative way, P (m) = C(m)ea+bm. Each reso-nance parameter has been varied according to its uncer-tainty, and the meson radius used in the Blatt-Weisskopfdamping factor [23], which is present in each relativis-tic Breit-Wigner term, has been varied between 0 and2.5 GeV−1. The amounts of backgrounds in the differ-ent final states have been varied according to their er-rors. The 3.9 GeV/c2 structure in the DD mass spectrumhas been alternatively described by a P-wave relativistic

14
TABLE VI: DD, D∗D, and D∗D∗ fit fractions (in %) and phases. Errors are statistical only.
DD DD D∗D D∗D D∗D∗ D∗D∗
Res. fraction phase fraction phase fraction phase
|P |2 38.5 ± 7.1 0. 49.9 ± 5.6 0. 56.8 ± 9.2 0.ψ(3770) 31.3 ± 3.3 1.58 ± 0.46G(3900) 23.9 ± 5.8 5.46 ± 0.64ψ(4040) 31.2 ± 5.3 1.39 ± 0.55 34.5 ± 6.0 1.74 ± 0.33 5.7 ± 4.4 3.37 ± 0.48ψ(4160) 3.1 ± 3.3 2.75 ± 0.58 12.2 ± 3.8 2.26 ± 0.16 30.6 ± 7.3 5.94 ± 0.33ψ(4400) 2.0 ± 1.2 3.38 ± 0.37 0.6 ± 0.7 4.37 ± 0.47 3.6 ± 2.4 5.03 ± 0.45
Sum 130 ± 12 97 ± 8 97 ± 13
TABLE VII: Integrated rates (in nb·MeV) for e+e− → ψ(4040), e+e− → ψ(4160), and e+e− → ψ(4400) in the DD, D∗D, andD∗D∗ decay modes. The first error is statistical, the second systematic.
Decay mode ψ(4040) ψ(4160) ψ(4400)
DD 11.0± 1.8± 5.6 1.0± 1.3± 1.0 0.5± 0.3± 0.1D∗D 46.6± 7.0± 4.9 13.8± 4.4± 1.5 0.6± 0.8± 0.1D∗D∗ 8.3± 6.4± 1.0 40.6± 9.7± 5.0 3.6± 2.4± 0.4
Breit Wigner with free parameters. This effect domi-nates the systematic uncertainty on the ψ(4040) rate inthe DD mass spectrum. The deviations from the centralvalue are added in quadrature. Systematic effects alsoinclude the uncertainty on the total cross sections.
The corrected yields can also be used to compute thebranching fraction ratios. The results are shown in Ta-ble VIII together with predictions of models: signifi-cant discrepancies are observed, expecially with the 3P0
model [5].
X. LIMITS ON THE DECAYS Y (4260) → D∗DAND Y (4260) → D∗D∗
The D∗D and D∗D∗ mass spectra have been refit withan additional Y (4260) resonance, which is allowed to in-terfere with all the other terms.
The fit gives Y (4260) fractions of (2.2 ± 2.9stat ±2.5syst)% and (4.0 ± 2.0stat ± 4.2syst)% correspondingto 18 ± 24stat ± 21syst and 9 ± 5stat ± 10syst events for
Y (4260) → D∗D and Y (4260) → D∗D∗, respectively.Systematic errors due to uncertainties on masses andwidths of the ψ(4040), ψ(4160), ψ(4415), and Y (4260)resonances are evaluated by varying the masses andwidths by their uncertainty in the fit. The amount ofbackground in each final state is varied within its statis-tical error, and the meson radii in Breit-Wigner termsare varied between 0 and 2.5 GeV−1. Deviations fromthe central value are added in quadrature.
These Y (4260) yields in the D∗D and D∗D∗ channelsare used to compute the cross section times branchingfraction, which can then be compared to our measure-
ment from the J/ψπ+π− channel [2]. We obtain
B(Y (4260) → D∗D)
B(Y (4260) → J/ψπ+π−)< 34, (11)
and
B(Y (4260) → D∗D∗)
B(Y (4260) → J/ψπ+π−)< 40, (12)
at the 90% confidence level.Using the DD cross section measured in the earlier
BABAR work [15], we obtain the sum of the e+e− → DD,e+e− → D∗D, and e+e− → D∗D∗ cross sections shown inFig. 13: the arrow indicates the position of the Y (4260),which falls in a local minimum, in agreement with thecross section measured for hadron production in e+e−
annihilation [9].
XI. CONCLUSIONS
We have studied the exclusive ISR production of theDD, D∗D, and D∗D∗ systems. The mass spectra showproduction of the JPC = 1−− states ψ(3770), ψ(4040),ψ(4160), and ψ(4415). Fits to the mass spectra pro-vide amplitudes and relative phases for the charmo-nium states, from which first measurements of branch-ing fraction ratios are obtained. Finally, upper limitson Y (4260) → D∗D and Y (4260) → D∗D∗ decays arecomputed.If the Y (4260) is a 1−− charmonium state, it should de-
cay predominantly toDD, D∗D, andD∗D∗ [5, 6]. Withinthe present limited data sample size, no evidence is foundfor Y (4260) decays to DD, D∗D, or D∗D∗. Other expla-nations for the Y (4260) have been proposed, such as a

15
TABLE VIII: Ratios of branching fractions for the three ψ resonances. The first error is statistical, the second systematic.Theoretical expectations are from the 3P0 model [5], C3 model [6], and ρKρ model [14].
Ratio measurement 3P0 C3 and ρKρ
1) B(ψ(4040) → DD)/B(ψ(4040) → D∗D) 0.24 ± 0.05 ± 0.12 0.003 0.14 [14]2) B(ψ(4040) → D∗D∗)/B(ψ(4040) → D∗D) 0.18 ± 0.14 ± 0.03 1.0 0.29 [14]3) B(ψ(4160) → DD)/B(ψ(4160) → D∗D∗) 0.02 ± 0.03 ± 0.02 0.46 0.08 [6]4) B(ψ(4160) → D∗D)/B(ψ(4160) → D∗D∗) 0.34 ± 0.14 ± 0.05 0.011 0.16 [6]5) B(ψ(4400) → DD)/B(ψ(4400) → D∗D∗) 0.14 ± 0.12 ± 0.03 0.0256) B(ψ(4400) → D∗D)/B(ψ(4400) → D∗D∗) 0.17 ± 0.25 ± 0.03 0.14
0
5
10
15
4 4.5 5 5.5 6
FIG. 13: Sum of e+e− → DD, e+e− → D∗D, and e+e− →D∗D∗ cross sections. The arrow indicates the position of theY (4260).
hybrid, baryonium, molecule or tetraquark state. In thecase of a hybrid state, the decay rates to DD, D∗D, andD∗D∗ are expected to be small [10, 24].
XII. ACKNOWLEDGEMENTS
We are grateful for the extraordinary contributions ofour PEP-II colleagues in achieving the excellent luminos-ity and machine conditions that have made this work pos-sible. The success of this project also relies critically onthe expertise and dedication of the computing organiza-tions that support BABAR. The collaborating institutionswish to thank SLAC for its support and the kind hospi-tality extended to them. This work is supported by theUS Department of Energy and National Science Foun-dation, the Natural Sciences and Engineering ResearchCouncil (Canada), the Commissariat a l’Energie Atom-ique and Institut National de Physique Nucleaire et dePhysique des Particules (France), the Bundesministeriumfur Bildung und Forschung and Deutsche Forschungsge-meinschaft (Germany), the Istituto Nazionale di FisicaNucleare (Italy), the Foundation for Fundamental Re-search on Matter (The Netherlands), the Research Coun-cil of Norway, the Ministry of Education and Science ofthe Russian Federation, Ministerio de Educacion y Cien-cia (Spain), and the Science and Technology FacilitiesCouncil (United Kingdom). Individuals have receivedsupport from the Marie-Curie IEF program (EuropeanUnion) and the A. P. Sloan Foundation.
[1] S.-K. Choi et al., Belle Collaboration, Phys. Rev. Lett.91, 262001 (2003).
[2] B. Aubert et al., BABAR Collaboration, Phys. Rev. Lett.95, 142001 (2005).
[3] B. Aubert et al., BABAR Collaboration, Phys. Rev. Lett.98, 212001 (2007).
[4] X.L. Wang et al., Belle Collaboration, Phys. Rev. Lett.99, 142002 (2007).
[5] T. Barnes, S. Godfrey, and E.S. Swanson, Phys. Rev.D72, 054026 (2005).
[6] E.J. Eichten, K. Lane, and C. Quigg, Phys. Rev. D73,
014014 (2006).[7] Charge conjugate states are implied throughout this
work.[8] X.H. Mo et al., Phys. Lett. B640, 182 (2006).[9] C. Amsler et al., Review of Particle Physics, Phys. Lett.
B667, 1 (2008).[10] S. L. Zhu, Phys. Lett. B625, 212 (2005); E. Kou and
O. Pene, Phys. Lett. B631, 164 (2005); F. E. Close andP. R. Page, Phys. Lett. B628, 215 (2005).
[11] C.F. Qiao, Phys. Lett. B639, 263 (2006).[12] L. Maiani, F. Piccinini, A. D. Polosa, and V. Riquer,

16
Phys. Rev. D72, 031502 (2005).[13] X. Liu, X. Q. Zeng, and X. Q. Li, Phys. Rev.D72, 054023
(2005).[14] E.S. Swanson, Physics Reports 429, 243 (2006).[15] B. Aubert et al., BABAR Collaboration, Phys. Rev. D76,
111105 (2007).[16] G. Pakhlova et al., Belle Collaboration, Phys. Rev. D77,
011103 (2008).[17] G. Pakhlova et al., Belle Collaboration, Phys. Rev. Lett.
98, 092001 (2007).[18] J. Libby et al., CLEO Collaboration, Nucl. Phys. Proc.
Suppl. 181-182, 127 (2008).[19] B. Aubert et al., BABAR Collaboration, Nucl. Instrum.
Methods A479, 1 (2002).[20] S. Agostinelli et al., GEANT Collaboration, Nucl. In-
strum. Methods Phys. Res., Sect. A 506, 250 (2003).[21] M. Benayoun et al., Mod. Phys. Lett. A14, 2605 (1999).[22] E. Eichten et al., Phys. Rev. D21, 203 (1980).[23] J.M. Blatt and W.F. Weisskopf, Theoretical Nuclear
Physics, John Wiley & Sons, New York, 1952.[24] F. Iddir, L. Semlala, hep-ph/0611183.