dd tokamak
TRANSCRIPT

ANL/FPP/TM-138 ANL/FPP/TM-138
D-D TOKAMAK REACTOR STUDIES
by
K. E. Evans, Jr., C. C. Baker, J. N. Brooks,
D. A. Ehst, P. A. Finn, J. Jung,
R. F. Mattas, B. Misra, D. L. Smith,
and H. C. Stevens
; Wmm OF THIS mm is urni
FUSION POWER PROGRAM
4NU
Argtnni Natjuial Labtraltfy9700 Stuth Cass Avtnii
, Mntis 60439
Prepare*' far thaU. S. DtpartmtNt af Eaariy
•adtr Caatrtct W-31-10l-Eii|-38
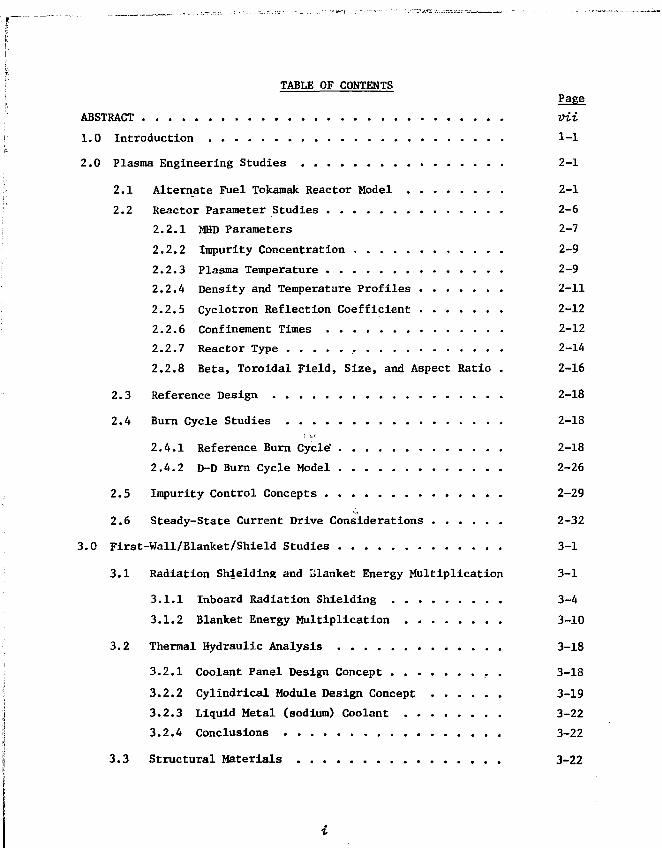
TABLE OF CONTENTS
Page
ABSTRACT vii
1.0 Introduction 1-1
2.0 Plasma Engineering Studies 2-1
2.1 Alternate Fuel Tokamak Reactor Model 2-1
2.2 Reactor Parameter Studies 2-6
2.2.1 MHD Parameters 2-7
2.2.2 Impurity Concentration . 2-9
2.2.3 Plasma Temperature 2-9
2.2.4 Density and Temperature Profiles 2-11
2.2.5 Cyclotron Reflection Coefficient 2-12
2.2.6 Confinement Times 2-12
2.2.7 Reactor Type 2-14
2.2.8 Beta, Toroidal Field, Size, and Aspect Ratio . 2-16
2.3 Reference Design 2-18
2.4 Burn Cycle Studies 2-18
2.4.1 Reference Burn Cycle' 2-18
2.4.2 D-D Burn Cycle Model 2-26
2.5 Impurity Control Concepts 2-29
2.6 Steady-State Current Drive Considerations 2-32
3.0 First-Wall/Blanket/Shield Studies 3-1
3.1 Radiation Shielding and Blanket Energy Multiplication 3-1
3.1.1 Inboard Radiation Shielding 3-4
3.1.2 Blanket Energy Multiplication 3-10
3.2 Thermal Hydraulic Analysis 3-18
3.2.1 Coolant Panel Design Concept , . 3-18
3.2.2 Cylindrical Module Design Concept 3-19
3.2.3 Liquid Metal (sodium) Coolant 3-22
3.2.4 Conclusions 3-22
3.3 Structural Materials 3-22

Page
3.4 Moderator Materials 3-25
3.5 First-Wall Surface Effects 3-27
3.5.1 Physical Sputtering 3-29
3.5.2 Electron Cyclotron Radiation 3-30
3.5.3 Plasma Disruptions 3-32
4.0 Magnet Design Studies 4-1
4.1 Ohmic Heating Coil System 4-1
4.2 Equilibrium Field Coil System 4-3
4.3 Toroidal Field Coil System 4-4
4.3.1 Choice of Peak Toroidal Field 4-5
4.3.2 Conductor 4-6
4.3.3 Conductor Support 4-8
4.3.4 Cooling 4-10
5.0 Tritium/Fuel/Vacuum Considerations for the D-D Design . . . 5-1
5.1 Fuel Cycle 5-1
5.2 Fuel Reprocessing, Fuel Supply, and Tritium Safety . 5-4
5.3 Vacuum System Analysis 5-7
5.4 Conclusions 5-7
6.0 Summary and Conclusions . . . . . . . . . . . . 6-1
6.1 General Features 6-1
6.2 Plasma Engineering Considerations 6-3
6.3 First. Wall/Blanket/Shield Considerations 6-5
6.4 Magnet Design Considerations 6-7
6.5 Tritiuw/Fuel/Vacuum Considerations 6-8
ii

Number List of Figures Page
2-1 Flux surfaces for a typical high 3, MHD equilibrium. Theplasma pressure can be shown to be constant on the fluxsurfaces. It is assumed the density and temperature areconstant on the flux surfaces as well. The global plasmamodel is obtained by spatially averaging quantities overthese surfaces 2-1
2-2 Superthermal particles produced as a consequence of thebasic deuterium-based alternate fuel reactions or froma high energy deuterium beam. The numbers refer to thereactions listed in the text 2-3
2-3 Confinement parameter as a function of Xe concentration.The quantity, otEMP> is the ratio of the required confine-ment parameter to that predicted by empirical confine-ment."' For any Xe concentration below the maximum of5.4 x 10-5, there are two possible sets of reactorparameters 2-6
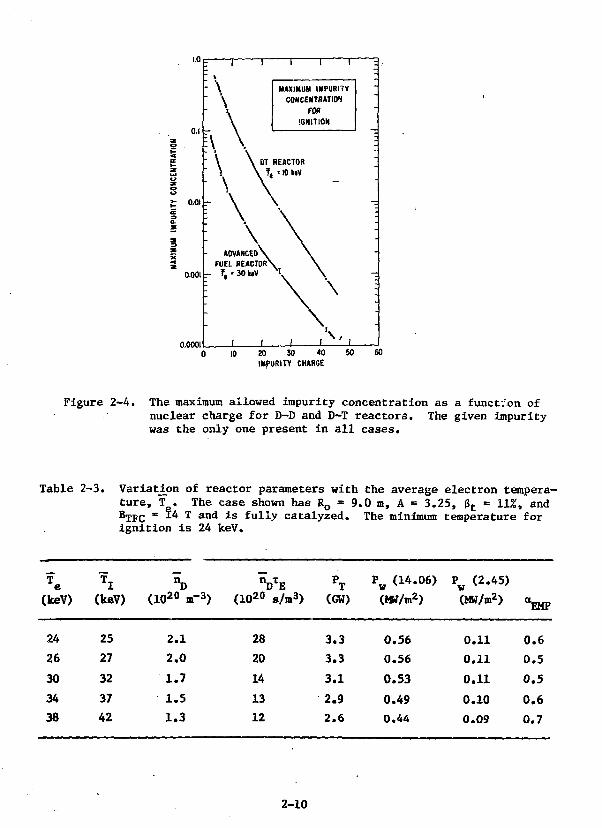
2-4 The maximum allowed impurity concentration as a functionof nuclear charge for D-D and D-T reactors. The givenimpurity was the only one present in all cases 2-10
2-5 Cross-sectional view of the reference Cat-D design . . . . 2--20
2-6 Top view of the reference design 2-21
2-7 Ohmic heating (OH) and equilibrium field (EF) waveformsfor the startup phase of the D-D burn cycle 2-22
2-8 Plasma current, ion temperature and (5 for the D-D
burn cycle 2-23
2-9 Ion densities for the D-D burn cycle 2-23
2-10 Fusion powers and rf heating for the D-D burn cycle . . . . 2-24
2-11 Major radius (dashed) and Prf for two low frequencycurrent drivers (Magnetoaonic wave (MS) and Alfven wave)versus aspect ratio. Here $t * 0.36/A, PT • 2.2 GW, T e
30 k V d B^FC 14t T e
30 keV, and B^FC - 14 T 2-32
3-1 Effect of material selection upon inboard radiationshielding for helium-cooled Cat-D designs 3-5
3-2 Effect of material selection upon inboard radiationshielding for water-cooled Cat-D designs 3-6
3-3 Impact of coolant material selection upon Cat-D plantlifetime , 3-7

Number List of Figures (cont'd) Page
3-4 Stress relaxation in first wall tube section directlyfacing plasma in STARFIRE and D-D reactors 3-25
3-5 Temperature response of Be-Coating for plasma dis-ruption time = 100 ms 3-33
3-6 Temperature response of Be-costing for plasma dis-ruption time = 200 ms 3-34
3-7 Temperatare response of structural material for plasmadisruption time = 200 ms 3-34
4-1 Cross section of TF coil 4-5
4-2 High field grade (11-15 T) conductor and support . . . . . 4-7
4-3 Low field grade (0-5 T) conductor and support 4-8
5-1 Fuel processing cycle for catalyzed D-D . . . . . 5-2
5-2 Tritium facility scenario for D-T reactor 5-3
iv

Number List of Tables Page
2-1 A comparison of the profile-averaged, MH> flux surfacemodel; 2 profile-averaged, low beta model; and a lowbeta point model. The case considered has RQ -= 8.6 m,B T F C - 14 T, Bt * 11*. q(a) - 3, and Te - 40 keV withno impurities and 100% reflection of the cyclotronradiation. The density and temperature profiles arethe saita in the profile-averaged cased 2-4
2-2 Summary of Notation 2-8
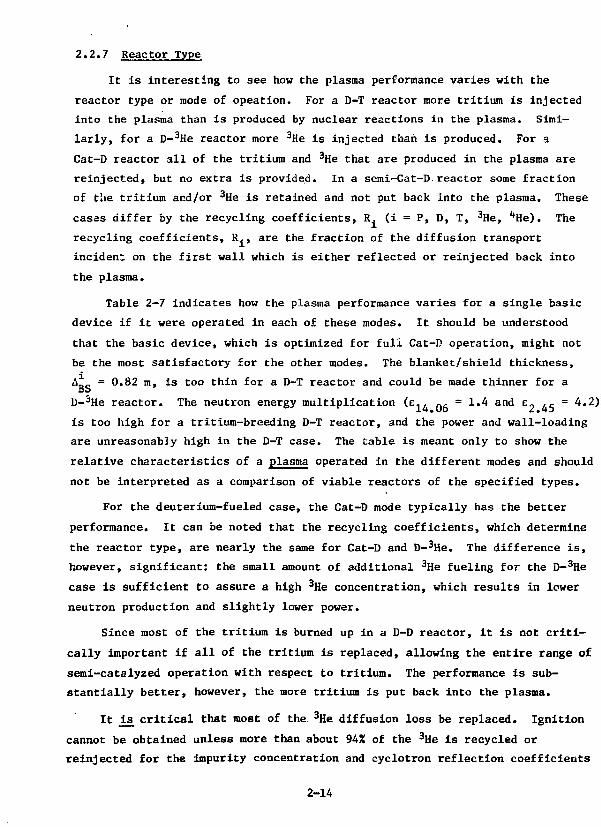
2-3 Variation of reactor parameters with the averageelectron temperature, Te. The case shown has R, *9.0 m, A = 3.25, Bt = 11%, and BxFC - 14 T and Infully catalyzed. The minimum temperature forignition is 24 keV -, 2-10
2-4 Variation of reactor parameters with the temperatureand density profiles. The case shown has RQ = 9 m,A = 3.0, 6t = 12%, and BTFc " 14 T 2-11
2-5 Variation of reactor parameters with the cyclotronreflection coefficient. The case shown has Ro = 9 m,A = 3.0, Bt = 12%, B T F C - 14 T, and T e - 30 keV 2-12
2-6 Variation of psrticls and energy confinement times.The case considered has R O » 9 J B , A * 3 . 0 , Bt = 12%,BTFC * 1 4 T» a n d Te = k e V ° 2" 1 3
2-7 Performance as a function of reactor type. The basicreactor considered has RQ » 8.6 m, A » 3.25, 8t = 11%,and Rppg = 14 T. The table is meant to show a com-parison of plasmas operated in the various modes onlyand should not be considered a comparison of viablereactors , « . . . 2-15
2-8 Variation of allowable 3He recycling. R,,jn is theminimum recycling coefficient; for which ignition occurs.A maximum fraction, f3 - (1 - R«in), of the
3Hediffusion flux incident on the wall can be divertedfor other uses. . , . 2-16
2-9 A sequence of reactor possibilities which have thesame total wall loading, Pw *• 1.60 M^/n
2, and the easeohmic heating field swing, ABOH « 16 T. The plasmabeta is assumed to scale as Bt " 0.3S/A. Theaverage temperature is T e • 30 keV. » 2-17
2-10 Tentative Reference Design 2-19
2-11 D-D Burn Cycle Parameters .._.-..... 2-22

Number List of Tables (cont*d) Page
2-12 Impurity Control System Comparison 2-30
3-1 Maximum Radiation Response Rates in Inner TFMagnets(a) , 3-9
3-2 System Energy Multiplication in a D-D-Tokeraak Reactor 3-12
3-3 A Comparison of System Energy Multiplication 3-14
3-4 A Comparison of (n,y) Reaction Rates 3-15
3-5 Potential of Snergy Multiplication by Neutron
Multipliers 3-16
3-6 System Energy Multiplication with the Be Multiplier . . . . 3-17
3-7 Summary of Analytical Results - Coolant Panel Concept . . . 3-20
3-8 Summary of Analytical Results for Cylindrical Blanket
Modules (750 psia helium inlet pressure) 3-21
3-9 Structural Materials Comparison 3-23
3-10 Design and Operating Parameters for Lifetime Analysis . . . 3-24
3-11 Physical Properties of Moderator Materials 3-26
3-12 Considerations for Selection of Coating/Cladding
Material for the First-Wall 3-283-13 Parameters for Calculation of Physical-Sputter
Yields for Candidate Wall Materials 3-30
4-1 OH Coil Locations and Currents 4-2
4-2 EF Coil Locations and Currents 4-4
4-3 Parameters for TF Magnets « 4-4
4-4 Comparison of TF Coil Parameters for Different Peak
Field Values, as Predicted by the TF Ceil Model . . . . . . . 4-6
4-5 Material in TF Coils (metric tons) 4-9
5-1 Fuel System Parameters for the Cat-D-D Reactor and the
STARFIRE D-T Reactor 5-45-2 Tritium Inventory (g) for the D-D Reactor and the
STARFIRE D-T Reactor 5-55-3 Vacuum System Parameters for the D-D Reactor and the
STARFIRE D-T Reactor 5-8Vi

ABSTRACT
A tokamak D-D reactor design, utilizing the advantages of a deuterium-
fueled reactor but with parameters not unnecessarily extended from existing
D-T designs, is presented. Studies leading to the choice of a design and
initial studies of the design are described. The studies are in the areas
of plasma engineering, first-wall/blanket/shield design, magnet design, and
tritium/fuel/vacuum requirements. Conclusions concerning D-D tokamak reactors
are stated.
vii

The densities of p, D, X, 3He, **He, and e are determined along with the Ion
and electron temperatures. (All ions are assumed to have the same tempera-
ture.) The reactions included are the deuterium-based alternate fuel
reactions:
1. D + T •*• n (14.06 MeV) + '•He (3.52 MeV)
2. D + 3He -*• p (14.67 MeV) + '•He (3.67 MeV)
3. D + D -*- p (3.03 MeV) + T (1.01 MeV)
4. D + D -»• n (2.45 MeV) + 3He (0.82 MeV).
The supertherntal fusion products are classically slowed down and in the
case of T and 3He also undergo fusion reactions as they slow down. This
superthermal fusion increases the power output. The energy of the slowing-
down particles also, however, contributes to the plasma pressure, which is
limited by MHD requirements. A schematic view of the possible superthermal
particles produced in the above reactions and for the injection of a deuterium
beam is shown in Fig. 2-2.
(2)The cyclotron radiation model follows Trubnikov and assumes uniform
profiles and homogenous wall properties. It is considered to be the best
simple model available. At the temperatures (̂ 30 keV) appropriate to D-D
tokamaks, the cyclotron loss is substantially less than losses due to
bremsstrahlung, line, and recombination radiation. The model used for these(3)
losses is the same as that used for the STARFIRE study ' and is described in
detail in Ref. 4. along with the slowing-down model and the rethermalization
model. The rf heating model assumes 90% of the rf power is given to the
electrons and the remainder to the ions.
The reactor model includes a consistent MHD treatment. The plasma
pressure distribution, safety factor, current, and magnetic flux configuration
are the result of 2-D, numerical calculations, and the equilibria are realis-
tic, high 0 equilibria with elongated and D-shaped cross sections. Account
is taken of the R"1 variation of the vacuum toroidal field. The full MHD
treatment is used because the results of actual MHD calculations for reactor-
relevant plasmas are known to be substantially different from the analytic
approximations sometimes used. The MHD calculations are of the fixed boundary
type. The calculational model is described in detail in Ref. 5.
2-2

Figure 2-2. Superthermal particles produced as a consequence of the basicdeuterium-based alternate fuel reactions or from a high energydeuterium beam. The numbers refer to the reactions listed inthe text.
2-3

The differences between a point global model and the profile-averaged-
global model, as well as the effects of the MHD calculation compared to the
low beta approximations, are shown for a typical case in Table 2-1. For
this case the more accurate treatment provides the same reactor with 20%
more power with half the required confinement. The analytic approximation
for the plasma current substantially underestimates its true value.
The reason the profile effects indicate increased performance is that
most of the fusion occurs in the high temperature center of the plasma. For
the same peak temperature the average temperature of a realistic profile is
lower, depending on the sharpness of the profile. Transport losses from the
system are more likely related to the average temperatures. For a high beta
plasma with its outwardly shifted flux surfaces, the high temperature region
occupies a larger volume toroidally than it would with concentric, circular
flux surfaces.
The reason for not using a 1-D model with realistic flux surfaces, apart
from the increased computational difficulty, is that diffusion coefficients
necessary for the 1-D transport are not known with a sufficient degree of
Table 2-1. A comparison of the profile-averaged, MHD flux surface codel;
a profile-averaged, low beta model; and a low beta point model.The case considered has R o = 8.6 m, B T F C = 14 T, Pt = 11%,q(a) = 3, and T = 40 keV with no impurities and 100% reflectionof the cyclotron radiation. The density and temperature pro-files are the same in the profile-averaged cases.
Thermal power, P_,
Confinement, IL,T_(102°s/m3) ^ E
Ion temperature, T
Deuterium density,
Plasma current, I
(GW)
j (keV)
(MA)
Full MHD/Profiles
2.4
6.5
45
1.3
29
Low Beta/Profiles
2.3
8.3
43
1.5
19
Low Beta/Point
2.0
12.7
42
1.7
19
2-4
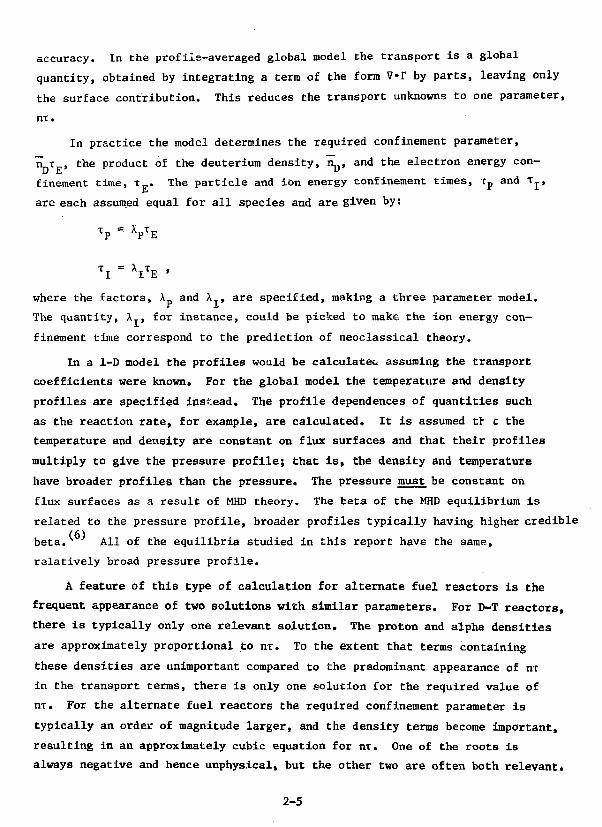
accuracy. In the profile-averaged global model the transport is a global
quantity, obtained by integrating a terra of the form V«r by parts, leaving only
the surface contribution. This reduces the transport unknowns to one parameter,
nr.
In practice the model determines the required confinement parameter,
n_T , the product of the deuterium density, n^, and the electron energy con-
finement time, T . The particle and ion energy confinement times, Tp and T^,
are each assumed equal for all species and are given by:
Ti = V E •where the factors, A and A , are specified, making a three parameter model.
The quantity, A , for instance, could be picked to make the ion energy con-
finement time correspond to the prediction of neoclassical theory.
In a 1-D model the profiles would be calculates assuming the transport
coefficients were known. For the global model the temperature and density
profiles are specified instead. The profile dependences of quantities such
as the reaction rate, for example, are calculated. It is assumed tr £ the
temperature and density are constant on flux surfaces and that their profiles
multiply to give the pressure profile; that is, the density and temperature
have broader profiles than the pressure. The pressure must be constant on
flux surfaces as a result of MHD theory. The beta of the MHD equilibrium is
related to the pressure profile, broader profiles typically having higher credible
beta.* All of the equilibria studied in this report have the same,
relatively broad pressure profile.
A feature of this type of calculation for alternate fuel reactors is the
frequent appearance of two solutions with similar parameters. For D-T reactors,
there is typically only one relevant solution. The proton and alpha densities
are approximately proportional to nT. To the extent that terms containing
these densities are unimportant compared to the predominant appearance of nt
in the transport terms, there is only one solution for the required value of
nt. For the alternate fuel reactors the required confinement parameter is
typically an order of magnitude larger, and the density terms become important,
resulting in an approximately cubic equation for nt. One of the roots is
always negative and hence unphysical, but the other two are often both relevant.
2-5

One mode has a higher confinement parameter, nx, higher proton and
alpha concentrations, more bremsstrahlung radiation losses, and higher
rethermalization rates (although lower T^), with a power balance tending
toward fusion energy production balanced only by radiation losses. This
mode is generally less attractive than the lower ni mode, for which the
power balance is fusion energy production versus comparable amounts of
radiation and diffusion losses. There is, in general, a branch point in the
solutions as a function of a given parameter. At this point the solutions
are equal, and beyond it they become complex and hence are not real physical
solutions. A typical example is shown in Fig. 2-3, where the parameter varied
is impurity concentration. Unless stated otherwise, the results shown in this
report are for the lower m: mode.
2.2 Reactor Parameter Studies
In order to understand the effects of various reactor parameters on
a D-D tokamak design, a number of parameter variation studies have been
performed. In this way the relevant ranges of the parameters can be determined,
X« CONCENTRATION. «10
Figure 2-3. Confinement parameter as a function of Xe concentration. Thequantity, <*EMP> is the ratio of the required confinementparameter to that predicted by empirical confinement.^)For any Xe concentration below the maximum of 5.4 x 10~5,there are two possible sets of reactor parameters.
2-6

and the relative importance of the parameters to the design can be under-
stood. The result of these studies is to determine a "performance envelope"
of the relevant operating regimes. Some of the parameters can be optimized
or set at values representing physical or practical limits relatively inde-
pently of the other parameters. The remaining parameters are determined by
trade-off considerations. Tb.3 notation used is summarized in Table 2-2.
It should be noted that in the parameter studies to follow, the results
may not be consistent from study to study since not all studies were done
with the same set of parameters and/or assumptions. It is only intended to
demonstrate the main features of the parameter variations.
2.2.1 MHD Parameters
The MHD considerations for D-D tokamaks are not essentially different
from those for D-T tokamaks. Consequently, many of the MHD parameters,
which have been studied previously in many places, have been chosen to be the(3)values used for STARFIRE in order to facilitate comparison. These include
the pressure profile shape exponent, a = 1.4, arid the elongation, K - 1.6.
The plasma edge is parameterized by the following equations:
R = RQ + a cos (6 + d sin e)
Z = tea sin 8.
The quantity 8 is a parameter and not the poloidal angle. The plasma
becomes more D-shaped (outwardly pointing) as d increases. The demands(ft 91
on the equilibrium field (EF) coils also increase with d. ' In
particular, for d 2: 0.25, coils in the center hole of the reactor are probably
required. For a pulsed device with a current induction solenoid, however,
center-hole cells are not practical. For this reason and to ease the demands
on the EF system, the quantity d has been taken to be 0.2 throughout this
study. The penalty for such a choice is that the MHD stability increases
somewhat with d.' * (STARFIRE has d - 0.5, near the EF coil design limit
for EF coils outside of the toroidal field (TF) coils.)
The MHD equilibria considered in this study are of a more conventional
and more studied type than used in STARFIRE. They all have q(0) = 1 and
q(a) » 3 and have more centrally peaked current profiles with moderate 0 •p
They are of the type considered in Ref. 6. The MHD equilibrium for STARFIRE
2-7
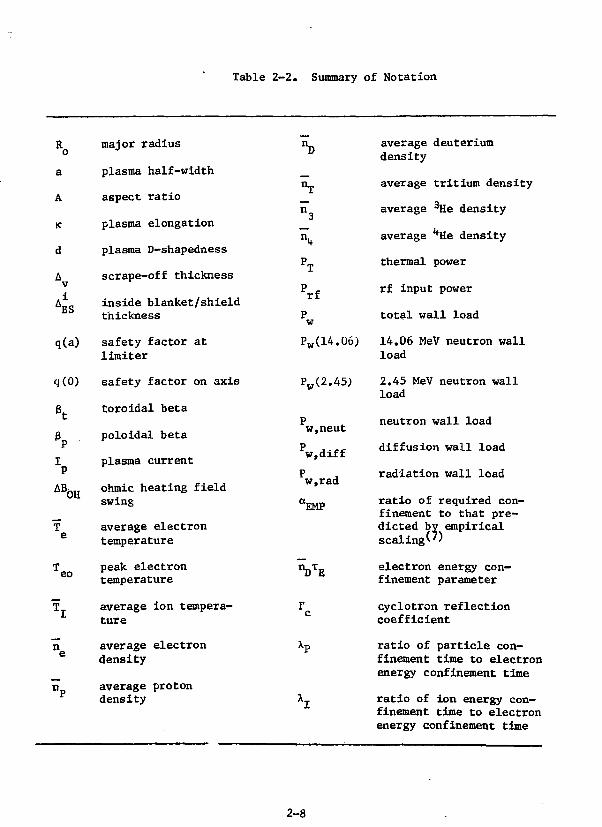
Table 2-2. Summary of Notation
Roa
A
K
d
Av
A*BS
q(a)
q(0)
major radius
plasma half-width
aspect ratio
plasma elongation
plasma D-shapedness
scrape-off thickness
inside blanket/shieldthickness
safety factor atlimiter
safety factor on axis
-D
"T
11
n.
PT1
PrfLi.Pw
Pw(14.06)
P (2.45)w
average deuteriumdensity
average tritium density
average 3He density
average **He density
thermal power
rf input power
total wall load
14.06 MeV neutron wallload
2.45 MeV neutron wallload
OH
eo
toroidal beta
poloidal beta
plasma current
ohmic heating fieldswing
average electrontemperature
peak electrontemperature
average ion tempera-ture
average electrondensity
average protondensity
w,neut
Pw,diff
w.rad
aEMP
VE
neutron wall load
diffusion wall load
radiation wall load
ratio of required con-finement to that pre-dicted by empiricalscaling^7)
electron energy con-finement parameter
cyclotron reflectioncoefficient
ratio of particle con-finement time to electronenergy confinement time
ratio of ion energy con-finement time to electronenergy confinement time
2-8
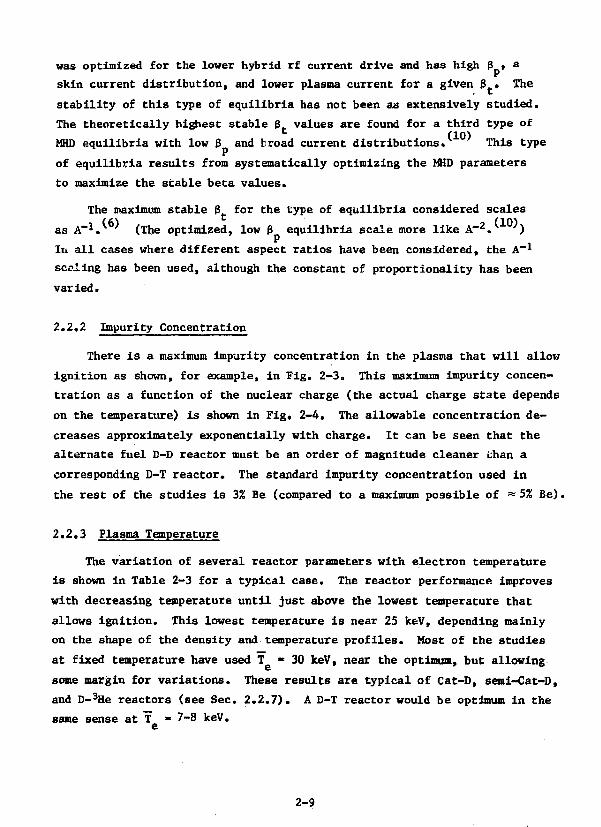
was optimized for the lower hybrid rf current drive and has high (3 , a
skin current distribution, and lower plasma current for a given 6 . The
stability of this type of equilibria has not been as extensively studied.
The theoretically highest stable B values are found for a third type of
MHD equilibria with low 6 and broad current distributions. This type
of equilibria results from systematically optimizing the MHD parameters
to maximize the stable beta values.
The maximum stable g. for the type of equilibria considered scales
as A"1/6* (The optimized, low 0 equilibria scale more like A-2.{10))
Iii all cases where different aspect ratios have been considered, the A"1
scaling has been used, although the constant of proportionality has been
varied.
2.2.2 Impurity Concentration
There is a maximum impurity concentration in the plasma that will allow
ignition as shown, for example, in Fig. 2-3. This maximum impurity concen-
tration as a function of the nuclear charge (the actual charge state depends
on the temperature) is shown in Fig. 2-4. The allowable concentration de-
creases approximately exponentially with charge. It can be seen that the
alternate fuel D-D reactor must be an order of magnitude cleaner than a
corresponding D-T reactor. The standard Impurity concentration used in
the rest of the studies is 3% Be (compared to a maximum possible of »5% Be).
2.2.3 Plasma Temperature
The variation of several reactor parameters with electron temperature
is shown in Table 2-3 for a typical case. The reactor performance improves
with decreasing temperature until just above the lowest temperature that
allows ignition. This lowest temperature is near 25 keV, depending mainly
on the shape of the density and temperature profiles. Host of the studies
at fixed temperature have used T * 30 keV, near the optimum, but allowing
some margin for variations. These results are typical of Cat-D, serai-Cat-D,
and D-3He reactors (see Sec. 2.2.7). A D-T reactor would be optimum in the
same sense at T » 7-8 keV.
2-9
1.0
0.0001
MAXIMUM IMPURITY
CONCENTRATION
FOR
IGNITION
ADVANCED
FUEL REACTOR
- T, -" 30 *«V
20 30 40
IMPURITY CHARGE
60
Figure 2-4. The maximum allowed impurity concentration as a function ofnuclear charge for D-D and D-T reactors. The given impuritywas the only one present in all cases.
Table 2-3. Variation of reactor parameters with the average electron tempera-ture, T . The case shown has Ro » 9.0 m, A = 3.25, gt = 11%, andBTFC = " T and is fullv catalyzed. The minimum temperature forignition is 24 keV.
T
(keV)
24
26
30
3438
TT(keV)
25
27
32
3742
°D(1020 m-3)
2.1
2.0
1.7
1.51.3
VE(1O20 s/m3)
28
20
14
13
12
PT(GW)
3.3
3.3
3.1
2.92.6
P w (14.06)
(WJ/tn2)
0.56
0.56
0.53
0.49
0.44
Pw (2.45)
(MW/m2)
0.11
0.11
0.11
0.10
0.09
aEMP
0.6
0.5
0.5
0.6
0.7
2-10

2.2.4 Density and Temperature Profiles
The general form of the profile-specified quantities is:
where x is the average of x and ty is related to the MID flux function, i|/, by:
magnetic axis
i limiter '
where i|>. and <|> are the values of \j> at the limiter and magnetic axis re-
spectively. The flux function is defined so that the poloidal field lines
are the lines if* = constant. The pressure can be shown to be constant on
flux lines. It is assumed the density and temperature are, also. Since
the pressure profile exponent, a , has been fixed at 1.4, the density and
temperature profile exponents, a and <*„, must satisfy a + o_ « a - 1.4.
The variation of several reactor parameters with these profile exponents
is shown in Table 2-4 for a typical case. The performance can be seen to
be best for sharp density and broad temperature profiles. Present experiments
tend to show broad density and sharp temperature profiles, however. In add ton,
refueling and/or recycling at the plasma edge should tend to favor broad
density profiles in reactor plasmas. A compromise of a * a = 0.7 is taken for
the remainder of these studies.
Table 2-4. Variation of reactor parameters with the temperature and densityprofiles. The case shown has L = 9 u, A • 3.0, p.. - 12%, andBTFC " U T«
an
0.1
0.4
0.7
1.0
1.3
°T
1.3
1.0
0.7
0.1
Teo(keV)
70
61
52
42
No
?T(GW)
2.0
2.2
2.4
2.5
solution
VE(1020 «/m3)
21
16
14
17
°EMP
0.6
0.5
0.5
0.6
2-11

2.2,5 Cyclotron Reflection Coefficient
For alternate fuel reactors with their higher temperatures, the cyclotron
radiation loss becomes important. This loss depends on the cyclotron reflec-(3)
tion coefficient, r . In the Trubnikov model used in these studies, thec J*
loss is proportional to (1-r ) . Reflection coefficients near unity tend
to minimize this loss. It is useful to see how deleterious a low value of
T may be. The variation of several reactor parameters with V for a typical
case is shown in Table 2-5. The effect on the performance is not major for
P >0.4, below which ignition is difficult to obtain. Above this value the
main effect of a low coefficient is to increase the required confinement
parameter. The results would be worse, of course, at higher temperatures.
Unless stated otherwise, the standard cyclotron reflection coefficient for the
rest of the studies is r = 0.9.c
2.2.6 Confinement Times
As described in Sec. 2.1, the ratio, X , of the particle and electron
energy confinement times and the ratio, A , of the ion energy and electron
energy confinement times can be varied. The results of such a variation
are shown in Table 2-6. The performance decreases slightly as X increases
Table 2-5. Variation of reactor parameters with the cyclotron reflectioncoefficient. The_case shown has RQ = 9 m, A = 3.0, & - 12Z,BTF(, = 14 T, and T e * 30 keV
t
r
0
0
0
0
0
1
.0
.2
.4
.6
.8
.0
PT(GW)
2.3
2.3
2.3
2.4
VE(1020 s/m3)
21
18
16
12
w,neut
«EMP ( M W / n 2 )
no solution
no solution
0.8 0.56
0.6 0.57
0.5 0.58
0.4 0.59
Pw,diff(MW/m2)
0.31
0.36
0.43
0.56
Pw,rad(MW/m2)
0.67
0.63
0.58
0.47
2-12

Table 2-6. Variation of particle and energy confinement times» The caseconsidered has RQ - 9 m, A - 3.0, &t,« 12%, B T p c » 1A T, andT - keV.
AP
0.5
1.0
1.5
2.0
1.0
1
XI
4.0
T
2.0
4.0
6.0
8.0
10.0
PT(GW)
2.2
2.2
2.1
2.0
2.1
2.2
2.2
2.2
2.2
VE(1020 s/m3)
20
21
23
27
27
21
20
19
18
aEMP
0.5
0.6
0.7
0.7
0,7
0.6
0,5
0.5
0.5
(as the particles are confined better compared to the electron energy). The
main effect is that the required electron energy confinement increases. There
is an upper limit (Ap % 2 for this case) beyond which ignition is not possi-
ble. The performance increases slightly as XT increases, again reflected in
decreased required confinement. There is a lower limit (A ^ 2 for this
case) beyond which ignition is not possible.
The standard values chosen for these ratios are Ap - 0.25 and A_ « 4.0.
The low particle confinement is balanced by high particle recyling at the wall.
(90% of the protons and 75% of the 3He are assumed recycled'. For a fully
catalyzed reactor 100% of the tritium and 3He are recycled or reinjected.;
The high ion energy confinement is a reflection of the fact that if ions
continue to be neoclassical and electrons continue to be empirical as indi-
cated in present experiments, the ion energy will be confined much better
than the electron energy. On the other hand, there is no confirmation at this
time that this will happen at temperatures as high as 30 keV in reactor-like
plasmas. For this reason the confinement times in this study are kept reason-
ably close to each other. No significant advantage is obtained for A much
larger than 10 in any event.
2-13
2.2.7 Reactor Type
It is interesting to see how the plasma performance varies with the
reactor type or mode of opeation. For a D-T reactor more tritium is injected
into the plasma than is produced by nuclear reactions in the plasma. Simi-
larly, for a D-3He reactor more 3He is injected than is produced. For a
Cat-D reactor all of the tritium and 3He that are produced in the plasma are
reinjected, but no extra is provided. In a semi-Cat-D.reactor some fraction
of the tritium and/or 3He is retained and not put back into the plasma. These
cases differ hy the recycling coefficients, R. (i = P, D, T, 3He, ''He). The
recycling coefficients, R., are the fraction of the diffusion transport
incident on the first wall which is either reflected or reinjected back into
the plasma.
Table 2-7 indicates how the plasma performance varies for a single basic
device if it were operated in each of these modes. It should be understood
that the basic device, which is optimized for full Cat-D operation, might not
be the most satisfactory for the other modes. The blanket/shield thickness,
A,,- = 0.82 m, is too thin for a D-T reactor and could be made thinner for aDO
D-3He reactor. The neutron energy multiplication (e,, „, = 1.4 and £„ ,_ = 4.2)
is too high for a tritium-breeding D-T reactor, and the power and wall-loading
are unreasonably high in the D-T case. The table is meant only to show the
relative characteristics of a plasma operated in the different modes and should
not be interpreted as a comparison of viable reactors of the specified types.
For the deuterium-fueled case, the Cat-D mode typically has the better
performance. It can be noted that the recycling coefficients, which determine
the reactor type, are nearly the same for Cat-D and D-3He. The difference is,
however, significant: the small amount of additional 3He fueling for the D-3He
case is sufficient to assure a high 3He concentration, which results in lower
neutron production and slightly lower power.
Since most of the tritium is burned up in a D-D reactor, it is not criti-
cally important if all of the tritium is replaced, allowing the entire range of
semi-catalyzed operation with respect to tritium. The performance is sub-
stantially better, however, the more tritium is put back into the plasma.
It ̂ £ critical that most of the. 3He diffusion loss be replaced. Ignition
cannot be obtained unless more than about 94% of the 3He is recycled or
reinjected for the impurity concentration and cyclotron reflection coefficients
2-14
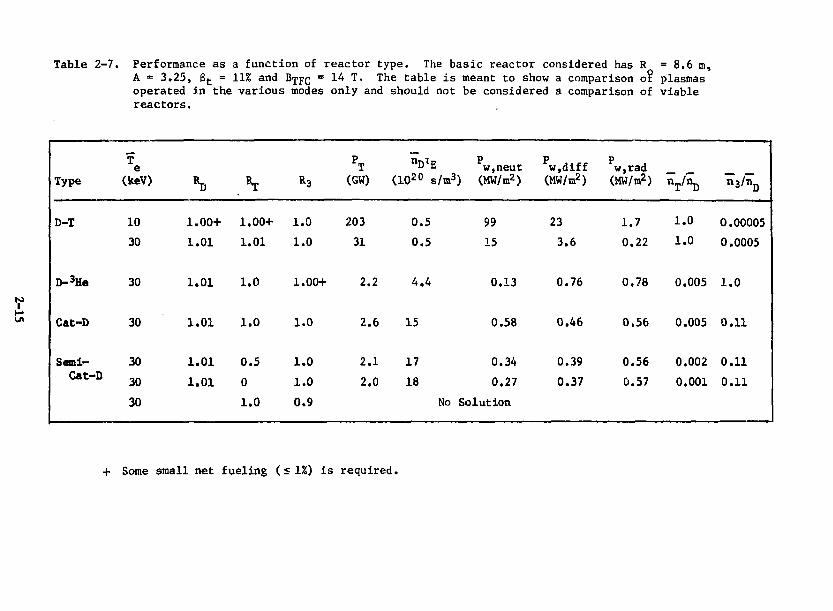
Table 2-7. Performance as a function of reactor type. The basic reactor considered has R = 8.6 m,A = 3.25, 8t = 11% and Bj-pc ~ ^ T. The table is meant to show a comparison o? plasmasoperated in the various modes only and should not be considered a comparison of viablereactors.
Type
D-T
D-3He
Cat-D
Semi-Cat-D
T
(keV)
10
30
30
30
30
30
30
1
1
1
1
1
1
.00+
.01
.01
.01
.01
.01
A1.00+
1.01
1.0
1.0
0.5
0
1.0
1
1
1
1
1
1
0
N
.0
.0
.00+
.0
.0
.0
.9
PT(GW)
203
31
2.
2.
2.
2.
2
6
1
0
nDTE(1020 s/m3
0.5
0.5
4.4
15
17
18
No
w,neut) (MW/m2)
99
15
0.13
0.58
0.34
0.27
Solution
Pw,diff(MW/m2)
23
3.6
0.76
0.46
0.39
0.37
w.rad(MW/m2)
1.7
0.22
0.78
0.56
0.56
0.57
nT/nD
1.0
1.0
0.005
0.005
0.002
0.001
n3/nD
0.00005
0.0005
1.0
0.11
0.11
0.11
+ Some small net fueling (< 1%) is required.

used in this study. This conclusion depends on some of the assumptions
made concerning the reactor parameters. Table 2-8 shows how much 3He could
be diverted under relaxed assumptions.
2.2.8 Beta. Toroidal Field. Size, and Aspect Ratio
Probably the most important three parameters are the size, characterized
by the major radius, Ro; the toroidal field, B , at the toroidal field coils;
and the plasma beta, B . The power is proportional to B* Bji R3. Most oft t Tl1 v> O
the effects of varying these parameters can be seen from these scalings.
In addition, the plasma current increases with B „ „ and R but not appreciably
with B (if the other MHD parameters are kept constant). While the general
results of varying these parameters singly is well understood, it is often
more useful to vary them together so as to keep quantities such as the wall
load, for example, constant.
In particular, when designing a conventional, pulsed tokamak reactor,
it is desirable to work at the first wall loading, P , limit and at the limitfor the ohmic heating magnetic field swing, ABnu. In comparing different
Uii
reactors, it is convenient to hold these quantities fixed. If one fixes
Table 2-8. Variation of allowable 3He recycling. Rmin is tne minimumrecycling coefficient for which ignition occurs. A maximumfraction, f3 - (1 - Rp^)» of the
3He diffusion flux incidenton the wall can be diverted for other uses.
Xe(keV)
30
40
Impurity
none
none
32 Be
3Z Be
none
none
3Z Be
3X Be
rc
1.0
0.9
1.0
0.9
1.0
0.9
1.00.9
R .min
0
0.60
0.85
0.90
0.
0.75
0.45
0.90
.00
- 0.65
- 0.90
- 0.95
00
- 0.80
- 0.50
- 0.95
0
0
0
0
00
1
.35
.10
.05
1
.20
.50
.05
*3
.00
- 0.40
- 0.15
- 0.10
.00
- 0.25
- 0.45
- 0.10
2-16

P and AB and assumes a scaling of B with A, the result is a series of
reactors with varying R Q , B T F (,, Bt> and A,
Such a series is shown in Table 2-9. The scaling for 8 is assumed to
be 6 « 0.36/A, a fairly optimistic estimate of 3 but with the scaling
established in Refo 6. All of the designs in this series should be equally
credible from an MHD standpoint. The total wall load, F « 1.60 MW/m2, is
typically composed as follows;
14.06 MeV neutron wall load, Pw(14.06) = 0.5 MW/m2;
2.45 MeV neutron wall load, Pw(2.45) = 0.1 MW/m2;
Charged particle wall load, Pw diff = 0.5 MW/m2; and
Radiation wall load, P w fad * 0,5 MW/m2.
The. first wall total surface heat flux was set at 1.0 MW/m2 for steady-
state operation and 0.8 MW/m2 for pulsed operation. The flux, A$niI, supplied
to the plasma is also shown in Table 2-9. This number is approximately the
inductive volt-seconds required; however, the EF system typically provides
about 40% of the inductive volt-seconds so that 40% of the OH contribution
is available for resistive volt-seconds (see Sees. 4.1 and 4.2).
Having fixed several of the important parameters in such a sequence of
designs, it is possible to select the best candidate, depending on the design
criteria. It can be seen that the lower aspect ratio devices have higher power,
Table 2-9. A sequence of reactor possibilities which have the same totalwall loading, Pw - 1.6G MW/m
2 aisa the same ohmic heating fieldswing, ABQJ, " 16 T. The plasma beta is assumed to scale asB. - 0.36/A. The average temperature is T - 30 keV.
A
2.4
3.0
3.25
R0(m)
13.7
9.8
9.2
BTFC(T)
11.4
13.4
14.1
0
0
0
et
.15
.12
.11
PT(GW)
6.6
2.8
2.3
Ip
(MA)
65
36
31
ttEMP
0.26
0.46
0.5'*
A*OH(V-s)
1410
670
560
2-17

lower toroidal fields, and more room in the center of the device, but are
larger and have higher plasma currents.
2.3 Reference Design
A tentative design point has been selected for this stage of the study
based on the surveys indicated in the preceding section. While there are cer-
tain advantages of alternate fuel reactors, they produce less than 5% of the
power of a D-T reactor for a given geometry, size, toroidal field and plasma
beta. This difference has to be made up primarily by increases in R , B__,^,o irC
and/or 6 , although some gains are possible due tc a thinner blanket/shield
between the toroidal coils and the plasma and by increased neutron multipli-
cation in a non-breeding blanket.
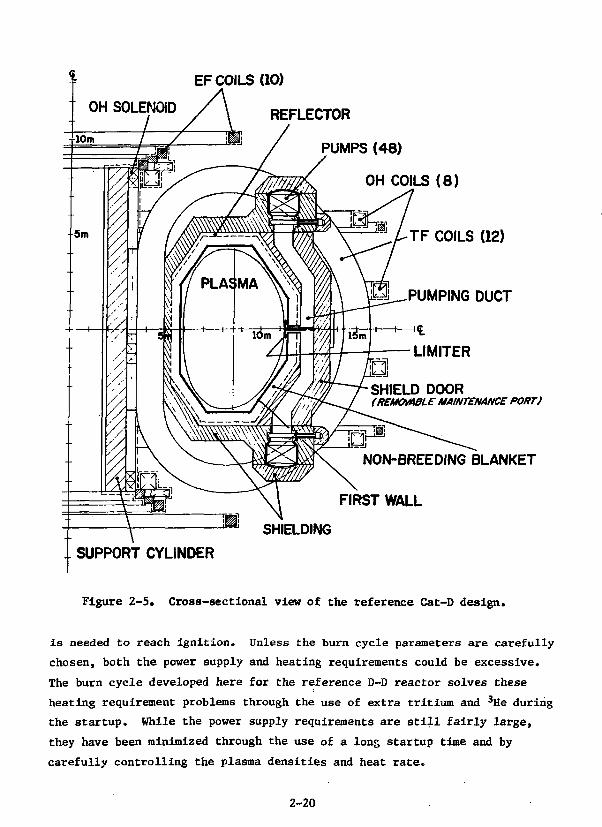
An attempt has been made to develop a reference design so that major
parameters are not extended appreciably beyond values typically used for D-T(2)
reactors; e.g., STARFIRE. The major parameters for the reference design are:
given in Table 2-10. The Xe impurity shown represents an impurity added
for thermal stability control (see Sec. 2.4.1) and could be another element
such as iodine. Both a conventional, pulsed version and an rf driven,
steady-state version have been considered for the same basic geometry. A
preliminary cross-section view of the reactor is shown in Fig. 2-5, and
a top view in Fig. 2-6.
2.4 Burn Cycle Studies
2.4.1 Reference Burn Cycle
The burn cycle of the reference D-D tokamak reactor has been studied
using the time dependent model described in Sec. 2.4.2. In developing the
D-D burn cycle, use has been made of the many studies of the D-T tokamak
cycle. (See, for example, Refs. 4 and 11 for the general features and considera-
tions involved in a pulsed D-T tokamak burn cycle.) For the D-D cycle there
appear to be two key issues, First, because of the typically larger size
of a D-D reactor, the energy stored in the OH and EF coils is large (about
20 GJ for each system for the reference reactor). The power supply require-
ments for these coils is, therefore, a major r- ncern. Secondly, because the
D-D fusion cross sections are low, particular at the temperatures when
starting the plasma, there is concern about how much external heating power
2-18

Table 2-10. Tentative Reference Design
Major radius, R
Aspect ratio, A
Peak toroidal field, B , ^
Plasma beta, 0 t
Scrape-off region, A^
Inside blanket/shield thickness, £„„
OH solenoid mean radius, R n u
Elongation, K
D-shapedness, d
Safety factor at edge, q(a)at axis, q(o)
Plasma current, I
OH field swing, ABnlI
Average electron temperature, T
Peak electron temperature, Teo
Average ion temperature, T
Average densities:
proton, n p _deuterium, ntritium, n"jhelium 3, tr3helium 4, njjelectron, n"
Impurities:
beryllium, n^ /nD
xenon, if.. /nT
Energy confinement parameter, nV.T_
14.06 MeV neutron multiplication,
e14.06
2.45 MeV neutron multiplication, e« ,c
Wall loading: total, F w
14.06 MeV neutron, Pw(14.06)2.45 neutron, Pw(2.45)charged particle, P ....radiation, P r a d
w ' d i f f
RF heating, P r f
Thermal power, P_
8.58 m
3.25
14
0.11
0.20 m
0.82 m
3.23 m
1.6
0.2
31
29.2 MA
15.2 T
30 keV
52 keV
32 keV
1.1 x 10 1 9 m"3
1.7 x 10 2 0 nT 3
7.8 x 10 1 7 m"3
1.8 x 10 1 9 m"3
4.3 x 10 1 8 m"3
2.4 x 10 2 0 m-3
0.032 - 5 x 1O-5
2.4 x 10 2 1 s/m3
1.4
4.2
1.5 - 1.7 MW/m2
0.5 MW/m2
0.1 MW/m2
0.3 MW/m2
0.7 - 0.9 MW/m2
0.8 - 1.0 MW/m2
0 - 220 MW
2.5 - 2.7 GW
2-19
EF COILS (10)
REFLECTOR
PUMPS (48)
OH COILS ( 8 )
T F COILS (12)
PUMPING DUCT
SHIELD DOOR(REMOmBLE MAINTENANCE PORT)
NON-BREEDING BLANKET
FIRST WALL
SHIELDING
SUPPORT CYLINDER
Figure 2-5. Cross-sectional view of the reference Cat-D design.
is needed to reach ignition. Unless the burn cycle parameters are carefully
chosen, both the power supply and heating requirements could be excessive.
The burn cycle developed here for the reference D-D reactor solves these
heating requirement problems through the use of extra tritium and 3He during
the startup. While the power supply requirements are still fairly large,
they have been minimized through the use of a long startup time and by
carefully controlling the plasma densities and heat rate.
2-20

VACUUM VALVES PUMP POD
PUMPS
PLASMA
NON-MEEDIIKBLANKET
OH SOLENOID
TF COILS
Figure 2-6, Top view of the reference design.
The main parameters of the burn cycle are summarized in Table 2-11.
Figures 2-7 through 2-10 show the Important coll and plasma parameters
during the startup period. In accordance with the conclusions of Ref. 11,
which treated the general subject of power supply requirements for tokamak
reactors, the startup period has been broken up into two phases: an "ohmic
heating" period and a "main heating" period. During the ohmic heating
period the OH current is ramped up to Induce the bulk of the plasma current.
During the main heating period the plasma is brought up to full density,
temperature,and current. A fairly long (18 s) OH ramp time is used to
minimize the OH power supply requirements. After the OH period an addi-
tional 27 seconds are used for the main heating period for a total startup
2-21
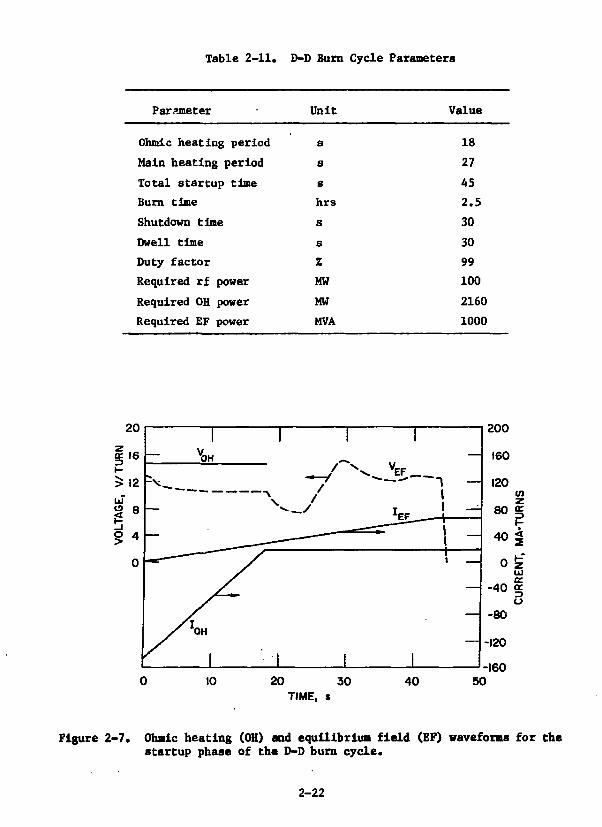
Table 2-11. D-D Burn Cycle Parameters
Parameter Unit Value
Ohmic heating period s
Main heating period s
Total startup time s
Burn time hrs
Shutdown time s
Dwell time s
Duty factor %
Required rf power MW
Required OH power MW
Required EF power MVA
18
27
45
2.5
30
30
99
100
2160
1000
-16050
Figure 2-7* Ohmic heating (OH) and equilibrium field (EF) waveforms for thestartup phase of the D-D burn cycle.
2-22

Figure 2-8. Plasma current, ion temperature and $ for the D-D burn cycle.
10
a
7
1 1
_
1 If'
1SCALE
| /
' /
/
\ 11 /
/
! 1CHANGE -
\y — '
\ /AA
i i
i
M.l
.l
-
1
10 —
K> 20 30 40 50 90 130
TIME, 1
Figure 2-9. Ion densities for the D-D burn cycle.
2-2.1

5000
10 20 30 40 50 90 130
Figure 2-10. Fusion powers and rf heating for the D-D burn cycle.
time of 45 s. This is a long time, relative to typical D-T pulsad reactors.
Together with the estimated 60 seconds needed for shutdown and dwell time,
the long startup time would require the use of thermal energy storage to
maintain a constant electrical power ouput. Such storage is warranted be-
cause of the overriding need for reasonable size power supplies. There
could be some tradeoffs between the down—time, power supply costs, and
the thermal storage costs. Similarly, further studies may indicate a more
optimum tradeoff between the OH and main heating periods. The indicated
startup time of 45 s and the division thereof should be reasonably accurate
choices, however.
The OH and EF voltage and current waveforms for the startup period
are shown in Fig. 2-7. " Prior to startup the OH coil is charged to its
full -7.6 T value. A constant voltage is then applied to the OH coil to
ramp down the OH current. After 18 seconds the OH coil has induced its
share of the plasma current,,and the OH ramp is terminated. Subsequently,
only a snail voltage is applied (not visible on the scale of Fig. 2-7) to
to make up for resistive losses in the plasma. In order to minimize the
2-24

resistive losses during startup, a lew plena density is used and some ex-
ternal heating power, assumed to be rf power, is applied to the plasma during
the OH period (see Fig. 2-10). This gradually heats the plasma, reducing
its resistance. The startup resistive volt-seconds are held to a very low
value of «= 5 V-s by this method. After 18 s the OH period ends, and
the main heating period begins. The goals for this period are as follows:
(1) to minimize the rf power required to heat the plasma, (2) to minimize
the required rate of increase in EF current and hence minimize the EF voltage,
and (3) to minimize the time needed for this period. These goals are
mutually exclusive, and some tradeoff is needed. Accordingly, various combi-
nations of fuel densities, refueling rates, and rf power levels have been
studied. The scenario shown gives reasonably good results and is probably
typical of the strategies to be employed in a D-D tokamak. In this scenario
a pulse of tritium gas is injected (at t « 18 s) by the refueling system
to create in the plasma a tritium density equal to 25 times the steady-state
tritium density during most of the burn cycle. This tritium is obtained by
withholding a very small amount of the tritium produced by the D-D reaction
during the 2-1/2 hour burn phase. The full rf power is also turned on at this
time. The minimum value of rf power needed is about 100 MW. This is an order
of r agnitude less than if no extra tritium were used. The rf power is kept
on for 5 seconds, heating the plasma enough so that substantial D-T fusion
starts to occur. At the end of this 5 s interval a ramp of the deuterium
density is begun, and a charge of 3He is added. This results in a 3He density
of about twice the final value. The resulting D-T and D-3He fusion reaction
products then heat the plasma to ignition. Towards the end of the startup
period iodine (not shown) is added to the plasma to prevent the plasma from
heating up too rapidly and placing excessive demands on the EF system. During
the heating phase the 3He density is held constant by the refueling system,
but tritium is allowed to burn up without full replacement. At 45 seconds
the plasma has for the most part reached its steady-state parameters. This
constitutes the end of the startup period. Subsequently the 3He level is
allowed to fall to its steady-state value by stopping the excess 3He fueling;
that is, the fueling system then recycles only the 3He pumped out by the
limiter/vacuum system. The plasma then gradually evolves to the full steady-
state values of the various densities and fusion powers.
2-25

This type of startup uses excess tritium and 3He for the startup and
must, therefore, compensate by using less tritium and 3He for the burn phase.
However, the reduction is negligible when spread out over the 2.5 hr burn phase.
One concern about the enhanced tritium startup is the high first wall loading
from D-T fusion during the startup.
The 2.5 hr burn tine is set by the volt-seconds available from the OH
coil after startup. Considering the total downtime, the duty factor is
~ 99%. During the burn phase the proton and **He Impurities are controlled
by the limiter/vacuum system which removes these reaction products at the
rate they are produced. The beryllium density (not shown) from sputtering
of the first wall and limiter surface is held to about 3% of the deuterium
density. An iodine density of about 0.003Z is also maintained to keep the
plasma in thermal equilibrium while radiating away as much power as possible
to the wall.
As with a D-T reactor, the power supply requirements for the D-D
reference reactor are set during startup. These requirements are as follows:
for the OH supply, a power requirement of 2160 MW, and for the EF supply,
a reactive power requirement of •* 1000 MVA. These values are about twice
as much as for a D-T reactor of about the same electrical power output, for
example, the STARFIRE reactor if it were operated in a pulsed mode. In
this respect a smaller D-D reactor would help, if it were possible, since
the OH and LJ coils could be made smaller. Steady-state operation would be a
major advantage, virtually eliminating most of the power supply costs.
2.4.2 D-D Burn Cycle Model
This model and its associated computer code solves particle and energy
balances as a function of time for a D-D tokamak fusion reactor. All relevant
terms in the balance equations are averaged over spatial profiles, these being
specified a_ priori and fixed over time as discussed in Sec. 2.1. The coupled
poloidal coil and MHD model described in Ref. 11 is also included. The
code treats eight ion species: protons (P), deuterons (D), tritons (T),
% e (3), '•He (a), beryllium (Z) from sputtering, oxygen (0) from various
sources, and Iodine (I), which Is used to control the plasma thermal stability.
The particle balance equations for the first five species are as follows:
2-26

dNDIT - ZD " NDNT <OV>DT ' NDN3
^ a - i») (2)
dN —^ - IT + h N2 <av>DDi - NDNT <av>DT - - (1 - V (3)
N
dN, N
dT " h * ND <OV>DD2 - NDN3 <aV>D3 " ^
I T " NDNT <<JV>DT + NDN3 <OV?D3 " xf (1 " V <5^
In these equations N, is the average value of the density of species j, I.
is an external source of species j to the plasma, Tp is the particle con-
tainment time, assumed equal for all species, and R, is the jth reflection
coefficient of the limiter/vacuum impurity control system. The reflection
coefficients used are K p « l L - i L « 0 . 9 and R3 - Rft - 0.75. These reflection
coefficients do not include reinjection as do those discussed in Sec. 2.2.7.
The term <ov>,, denotes the fusion reaction rate between the jth species
and the kth species, with two branches for the D-D reaction. A bar in Eqs.
(l)-(5) indicates averaging over the spatial profile. Superthermal fusions
are not included in the particle balance equations. The Be density in the
plasma is given by the following equation:
dN_ N N N N N H—Z.-B.S + _ D S + _ T _ S + _ 1 S + -£ S +~ 5
dt T p Tp D T T Tp 3 Tp a Tp(6)
T_ CX
2-27

In this equation N./T represents the flow of particles of species j to the
limiter, S. is the sputtering coefficient for species j in units of Be atoms
sputtered per incident ion of species j, and R"Z is the reflection coefficient
of Be from the limiter. The last term in Eq. (6) represents charge exchange
sputtering at the first wall by neutral deuterium, where Y is the ratio of
charge exchange neutrals hitting the first wall to deuterium ions hitting
the limiter, and S is the sputtering coefficient of the charge exchange
neutrals. Although there could be some charge exchange sputtering due to
tritium and protium, these are not included at the present time.
The oxygen concentration in the plasma is given by the model described
in Ref. 11. The iodine concentration is given by:
where I, is an external source of iodine, and Rj = 0.25 is the reflection
coefficient from the limiter. Finally, the electron density is given by
requiring charge neutrality:
where Z is the charge state of species j. For hydrogen the charge state
is always taken as 1 and for helium as 2. For the other ions the charge
state is computed from the coronal equilibrium model of Ref. 12.
The energy balance equations for ions and electrons are, respectively:
IF <! W - NDNT <0V>DT
ND
%e 2 (8>
2-28
(| NeTe) = NDNT <ov>DT
+ NDN3 <ov>D3
+ h N2 <av>DD^
+ ^ «D <OV>DD,
- K , + FT -rad rf
uE
(UE +1 2,P
t <U3,P H
, U4 3 +
3 NeTe2 TE
E .
h U1,T )
Ki,e +
In these equations N = £ N is the total ion density, and T and T are theIE
average ion and electron temperatures. The U,. , and UN terms are the
energy given to the ions and electrons, respectively, from particle j
created in reaction N. These terms include the superthermal fusion from
the reaction products as discussed in Sec. 2.1 (also see Fig. 2-2). The
K± e term is the ion-electron thermalization term as defined in Ref. 4.Kft i s t n e o n m i c heating term, Kft - nj
2, where n is the Spitzer resistivity
of the plasma (with neoclassical corrections), and J is the current density.
The term, K-Vad, is the radiation loss, including bremmstrahlung, line, and
recombination radiation from a coronal equilibrium model and cyclotron
radiation described in Ref. 4. The quantities, x and !„, are the ion andI E
electron energy confinement times, respectively. The electron energy con-
finement is taken to have Alcator scaling, x = 5 x 10~ N ica2, and ion
energy confinement is taken to be neoclassical (see Ref. 4). The common
particle containment time is taken to be i • I xE>
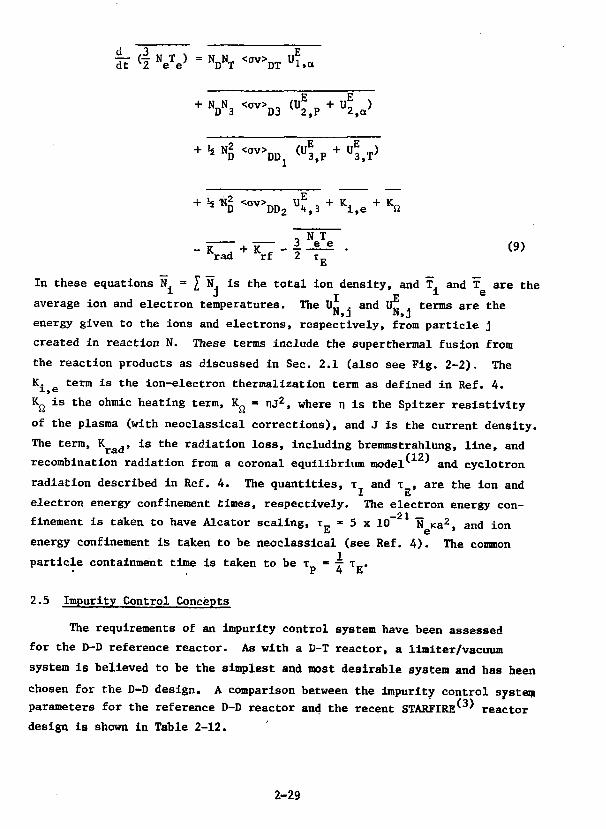
2.5 Impurity Control Concepts
The requirements of an impurity control system have been assessed
for the D-D reference reactor. As with a D-T reactor, a limiter/vacuum
system is believed to be the simplest and most desirable system and has heen
chosen for the D-D design. A comparison between the impurity control system
parameters for the reference D-D reactor and the recent STARFIRE^ reactor
design is shown in Table 2-12.
2-29
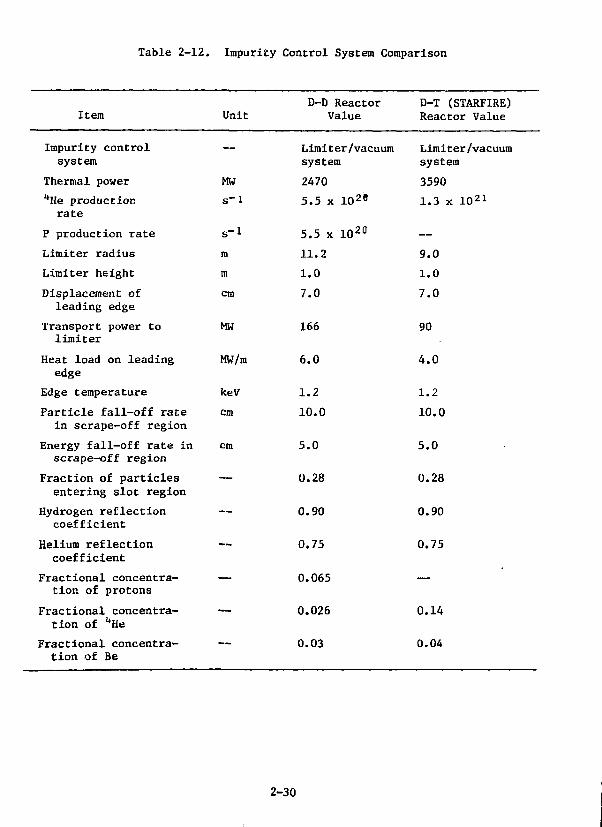
Table 2-12. Impurity Control System Comparison
Item
Impurity controlsystem
Thermal power
**He productionrate
P production rate
Limiter radius
Limiter height
Displacement ofleading edge
Transport power tolimiter
Heat load on leadingedge
Edge temperature
Particle fall-off ratein scrape-off region
Energy fall-off rate inscrape-off region
Fraction of particlesentering slot region
Hydrogen reflectioncoefficient
Helium reflectioncoefficient
Fractional concentra-tion of protons
Fractional concentra-tion of ̂ He
Fractional concentra-tion of Be
Unit
—
MW
s-1
s-1
m
m
cm
MW
MW/m
keV
cm
cm
—
—
—
—
—
D-D ReactorValue
Limiter/vacuumsystem
2470
5.5 x 10 2 8
5.5 x 10 2 0
11.2
1.0
7.0
166
6.0
1.2
10.0
5.0
0.28
0.90
0.75
0.065
0.026
0.03
D-T (STARFIRE)Reactor Value
Limiter/vacuumsystem
3590
1.3 x 10 2 1
—
9.0
1.0
7.0
90
4.0
1.2
10.0
5.0
0.28
0.90
0.75
—
0.14
0.04
2-30

In general, the impurity control requirements on a limiter/vacuum sys-
tem for D-D are fairly similar to those for D-T. The ash products to be
removed for the D-D reaction are protons and alpha particles, compared to
only alphas for D-T. The amount of p and **He to be removed for D-D is
similar to the amount of "*He for D-T if the reactors are of about the same
power class. Because of the fact that protons charge exchange, however, they
are more difficult to remove than ^He. On the other hand, protons are some-
what less troublesome than helium because they have half the number of
electrons. Sputtering of the boundary coating is a somewhat lesser problem
for a D-D reactor because the average mass of a D-D plasma is lower than the
average mass of a D-T mixture, i.e., 2.0 AMU compared to 2.5 AMU. This results
in a 20% reduction in sputtering, all other things being equal.
The question of a limiter/vacuum system is described in detail in Ref• 13.
The same basic limiter dimensions for STARFIRE are used for the D-D design
except that the limiter major radius is different. The computed edge tempera-
ture and scrape-off zone parameters are also virtually identical to STARFIRE.
Transport power to the limiter is, however, almost twice as much for the
reference D-D reactor even when as much plasma heating power as possible is
radiated to the first wall. This is basically due to the fact that propor-
tionally more of the power is in the form of charged particles for D-D than
for D-T. *>s a result of the higher transport power, the maximum heat load
for the reference design is higher than for STARFIRE, but is probably still
tolerable.
In both types of reactors the helium pumping efficiency is higher than
the hydrogen pumping efficiency. This helps a D-T machine in minimizing the
''He concentration while permitting a high tritium burnup. For D-D this
phenomena is a mixed blessing: it reduces the deuterium gas load on the
vacuum pumps, but it results in a higher proton concentration in the plasma.
The impurity concentrations in the D-D machine are acceptably low, however.
Further details of the vacuum system are given in Sec. 5.
2-31
2.6 Steady-State Current Drive Considerations
It appears possible that the toroidal plasma current in a tokamak might be
maintained in a steady-state mode with the injection of wave momentum. '
The STARFIRE reactor uses lower hybrid waves for steady-state operation
with D-T fuel, but the typically very large toroidal current in a D-D reactor
makes the rf power prohibitive for this type of current drive. Consequently,
alternative waves have been examined: both corapressional Alfven waves(17)
with u> » Q. appear tc be more efficient drivers.
with frequencies less than the ion cyclotron frequency (o> < ft.) and fast( ^
magnetosonic waves
The reason is that these low frequency waves can be broadcast with parallel
phase speeds less than the electron thermal speed, in contrast to lower(14)hybrid waves. A variety of high beta MHD equilibria of different aspect
ratios have been studied. Figure 2-11 displays the major radius and rf
current drive power required for three D-D reactors (A = 2.0, 2.5 and 3.0) with
plasma beta scaling as g = 0.36/A. In all cases the total power, P T = 2.2 GW,— TFCtemperature, T = 30 keV, and toroidal field, B = 1 4 T, are held constant.' e max '
-10 -
1.5 2.0 2.5 3.0 3.5 4.0
Figure 2-11. Major radius (dashed) and Prf for two low frequency currentdrivers (Magnetosonic wave (MS) and Alfven wave) versusaspect ratio. Here et » 0.36/A, P T - 2.2 GW, T = 30 keV,and BTFC , 14 T.
2-32

The lotfer aspect ratios have larger currents, but the electron density, which
also determines rf power requirements, is much lower at small A. The conse-
quence is that less rf power is needed at low A. In searching for waves
which minimize P -, one is constrained by the dispersion relations to select
eigenmodes of the torus. The Alfven wave is attractive since it requires
less absorbed power and because the parallel wavelengths are manageable (on
the order of one meter). The magnetosonic wave requires X = 10 cm, which may
complicate antenna design. However, the magnetosonic wave is a higher fre-
quency (100-140 MHz) wave and may permit the use of waveguide launchers.
One final caution should be noted; i.e., Fig. 2-11 displays only one
parameter - the rf power absorbed by electrons to create current density.
Additional information regarding wave generation, transmission, and coupling
to the plasma is needed before the candidate drivers can be properly compared.
References
1. D. J. Rose and M. Clark, Jr., Plasmas and Controlled Fusion (MIT Press,Cambridge, Massachusetts, 1961).
2. B. A. Trubnikov, in Plasma Physics and the Problems of ControlledThermonuclear Reactions (Pergamon Press, London, 1959), Vol. Ill, p. 122.
3. C. C. Baker, et al., "STARFIRE - A Commercial Tokamak Fusion PowerPlant Study ," Argonne National Laboratory, ANL/FPP-80-1 (September, 1980).
4. W. M. Stacey, Jr., et al., "Tokamak Experimental Power Reactor ConceptualDesign," Argonne National Laboratory, ANL/CTR-76-3 (1976).
5. K. Evans, Jr., "High &t Equilibria in Tokamaks," Argonne NationalLaboratory, ANL/FPP/TM-98 (1977).
6. A. M. M. Todd, et al., Nuclear Fusion 19_, 743 (1979).
7. D. R. Cohn, R. R. Parker and D. L. Jassby, Nuclear Fusion _16, 31 (1976);and D. L. Jassby, D. R. Cohn and R. R. Parker, Nuclear Fusion 1£, 1045(1976).
8. J. Brooks, K. Evans, Jr., H. Stevens, and L. Turner, "The EquilibriumField Coil Design for the Argonne EPR Design," Proa. 7th Symp. Engineer-ing Problems of Fusion Research, Knoxville, Tennessee (1977).
9. K. Evans, Jr., D. A. Ehst and P. Messerschmidt, "Equilibrium Field CoilConsiderations for Tokamak Reactors," Proa. 3rd Topical Mtg. on theTechnology of Controlled Nuclear Fusion, ANS Publication No. CON?-780508,Vol. 2, p. 1084 (1978).
2-33

10. L. C. Bernard and R. W. Moore, "Systematic Optimization of Tokamaks toAll Ideal MHD Modes," General Atomic Company, GA-A15694 (1980).
11. J. N. Brooks and R. L. Kustom, Nuclear Technol. hb, 61 (November, 1979).
12. D. E. Post, et al., "Steady-State Radiative Cooling Rates for Low-Dsnsity High-Temperature Plasmas," Princeton Plasma Physics Laboratory,PPPL-1352 (1977).
13. M. A. Abdou, et al., "A Limiter/Vacuum System for Plasma ImpurityControl and Exhaust in Tokamaks," 4th ANS Topical Mtg. on the Technologyof Controlled Nuclear Fusion, King of Prussia, Pennsylvania (October 14-17,1980).
14. N. J. Fisch, Phys. Review Letters 41., 873 (1978).
15. D. A. Ehst, Nuclear Fusion _1£, 1369 (1979).
16. D. A. Ehst, et al., "Lower-Hybrid Heating and Current Drive System forthe STARFIRE Tokamak," 4th ANS Topical Mtg. on the Technology of Con-trolled Nuclear Fusion, King of Prussia, Pennsylvania (October 14-17,1980).
17. N. J. Fisch and C. F. F. Karney, "Current Generation with Low-FrequencyWaves," Princeton Plasma Physics Laboratory, PPPL-1624 (1979).
18. D. K. Bhadra, et al., "RF Current Drive for a Steady-State Tokamak,"General Atomic Company, GA-A15656 (1979).
2-34

3.0 First-Wall/Blanket/Shield Studies
A preliminary study of the technological aspects of the first-wall/
blanket/shield system for a D-D tokaraak reactor has been conducted. Since
tritium breeding is not required, those materials and design constraints in
the blanket that are associated with breeding and recovery of tritium are
eliminated. The present study has focused on the neutronic, thermal hydraulic,
materials and plasma-wall interaction considerations that are unique to the
D-D tokamak reactor. The neutronic studies include an analysis of the
radiation shielding requirements and the implications of energy multiplication
in the blanket region. The thermal-hydraulic studies relate primarily to
the impacts of coolant selection. The materials assessment includes an
evaluation of both structural materials and potential moderator materials
that enhance the energy multiplication in the blanket. The surface effects
considered for the first-wall include physical sputtering, reflectivity of
cyclotron radiation and erosion or ablation of the first wall caused by
plasma disruptions. Key areas where further development and analysis are
required have been identified.
3.1 Radiation Shielding and Blanket Energy Multiplication
The fusion power density of a D-D fuel system with a 30 keV ignition
temperature is only about 1-3% of the power density of a typical D-T tokamak
for the same values of 0 and BT . Because of such an inherently lower
power performarce, the neutron power multiplication is a very important
design consideration in alternate-fuel systems. On the other hand, tritium
breeding, which id one of the primary blanket functions in D-T systems,
can be eliminated in alternate fuel system designs. This fact provides a
degree of flexibility in the latter system designs in which the blanket can
be optimized largely on the basis of energy multiplication. In D-T-Li
fuel cycles a substantial fraction of the fusion power is consumed for
tritium production through the endothennic 7Li(n,n'a)t reaction. The energy
consumption is particularly large in D-T-liquid lithium systems due to the
hard neutron spectrum inherent in such systems. In the case of solid tritium-
breeder systems, where ternary compounds such as LiA102 and L±2SiO3 are used,
a neutron multiplier is required to achieve adequate tritium production.
The neutron multiplication relies on the (n,2n) reaction with the multiplier
3-1

materials. In many cases such a neutron multiplication process by the
(n,2n) reaction contributes to an energy loss because the associated
reaction Q-value is generally higher than the Q-value for the (n,y) reac-
tion, which is the major energy multiplication mechanism for fusion neutrons.
An exception where the (n,2n) reaction is favored from the energy balance
standpoint is for beryllium or its compounds since the Be(n,2n) reaction has
an extremely low Q-value of «1.67 MeV.
The basic approach for neutronic power optimization in alternate-
fuel systems is, therefore, to focus on blanket materials that have a high
(n,y) reaction potential as well as a high energy release associated with
the reaction. In most cases the (n,y) reaction cross section is character-
ized by its "1/v" energy dependence, ' i.e., the potential for the reaction
increases as the neutron energy decreases. Consequently, a high rate of
energy moderation is an important characteristic of systems with favorable
energy multiplication. The effective neutron moderation is essential not
only for a higher (n,y) reaction, but also for minimizing various endothermic
reactions that occur at keV neutron energies.
In addition to energy multiplication, the blanket/shield system must
also be designed to provide adequate radiation shielding. The functions
of the shielding system are: (1) to protect reactor components from ex-
cessive radiation damage and nuclear heating; (2) to protect reactor personnel
as well as the general public from radiation exposure at all times during
reactor operation and after reactor shutdown; and (3) to reduce induced
activation in reactor components.
In the present study the shielding analysis is focused on the inboard
blanket/shield design since it has a large impact on the overall reactor
performance, which affects the rest of the system design. The primary concern
of the inboard blanket/shield design is related to possible radiation-induced
damage of the components of the superconducting toroidal field (TF) coils.
These components include: (1) superconductors (Nb3Sn and NbTi); (2) the
normal conductor or stabilizer (Cu); (3) electrical and thermal insulator
(epoxy-base G10); and (4) structural material (stainless steel: SS). Among
several radiation-induced damage effects, the property degradation of the
organic insulator is considered to be the most limiting design constraint
by the fact that the damage is irreversible. Other radiation damage effects
3-2

such as changes in the critical properties of the superconductor and changes
in the resistivity of the stabilizer are partially recoverable by magnet(2 3)
annealingv ' ' at room temperature or slightly higher temperatures.
There exists, however, some speculation * ' about the effect and the
practicability of magnet annealing at high temperatures for recovering the
critical properties of Nb3Sn and NbTi. Therefore, the radiation damage
to the superconductors should also be regarded as permanent and cumulative with
neutron fluence. A recent study has shown that organic insulators such
as G10CR and Kapton H can withstand an absorbed gamma dose of up to « 108 Gy
at a cryogenic temperature. The study has also found that the fast neutron
(> 0.1 MeV) fluence up to 8.7 x 10 2 2 m"2 has very little effect upon the
electrical and mechanical property changes in the insulators. Considering
the fact that most of the dose in the epoxy-base insulator in the TF-coils
is attributable to the energy deposition caused by tne neutron interaction,
it appears adequate to use a total dose of 108 Gy as the insulator damage
criterion.
The analysis in this section is oriented toward identifying: (1) the
impact of material selection on the inboard radiation shielding, and (2) the
blanket energy multiplication mechanism, both based on a catalyzed D-D system.
The neutron wall loads and power breakdown are assumed to be:
Source Neutron Wall Load (MW/ra2) Neutron Power (MW)
14.06 MeV 0.4830 710
2.45 MeV 0.0967 142
The neutronic model used in the analysis is an infinite cylinder with
a wall radius of 4.14 m, which is equivalent to a wall area of 26 m2/unit
length in the toroidal direction (or a total wall area of 1470 m2 for a torus
with a 9 m major radius). The plasma scrape-off region is assumed to be 0.2 m.
The particle transport calculations were carried out using ANISN with
the S8-P3 approximation. The transport cross section library and the re-
sponse function library, VITAMIN-C^ and MACKLIB-IV, ̂ both based on
E:TOF-B/IV, were utilized in the 46-neutron/21-gamma group structure.
3-3

3.1.1 Inboard Radiation Shielding
The most critical design constraint on the inboard shield is the large
sensitivity of the reactor performance and economics to the radial thickness,
A_o, from the first wall to the location of the maximum magnetic field.
According to a sensitivity study carried out for a reference system where
the reactor power, P , the major radius, R , the maximum toroidal field, B ,o o max
the scrape-off, A , and the aspect ratio, A,are defined as 2.35 GW, 9 m, 14 T,V i
0.2,m and 3, respectively, a 1% decrease in a one meter A,._ results in:
AP ~ + 0.9% for fixed R , Bo o max
AR = - 0.3% for fixed P , Bo o max
AB = - 0.2% for fixed P , R .max o o
These results clearly indicate the substantial dependence of the overall
reactor performance upon the shielding design and that the selection of
A_c and shielding materials to be used must evolve from a careful optimization.DO
One of the important design decisions is the coolant selection. Since
the D-D system does not need to breed tritium, use of lithium coolant
is not considered. Two candidate coolants, pressurized light water
and helium gas, are considered in the present analysis, along with
four candidate shielding materials, viz., stainless steel (PCA), tungsten,
TiH^, and water. A detailed analysis of the PCA (similar to Type 316 SS
neutronically) structure design has been already shown in Ref. (11) in compari-
son with other candidate alloys such as V15Cr5Ti and Ti4381. In the present
analysis an attempt is made to compare the shielding performance of different
non-structural materials. In all the cases studied the primary structural
material is assumed to be PCA. Tungsten is considered because of its ex-
cellent shielding performance. Although there are some concerns about the
use of tungsten, such as the resource limitation and the high material cost,
the possible reduction in A__ with tungsten may compensate for the associated
penalty. In addition it should be emphasized that the inboard shield volume
is small (typically « 10% of the total) and that tungsten is an intrinsically
low-activation material,and hence, a large part of the tungsten shield is
expected to be recyclable on a reasonably short time scale after its
3-4
(12)
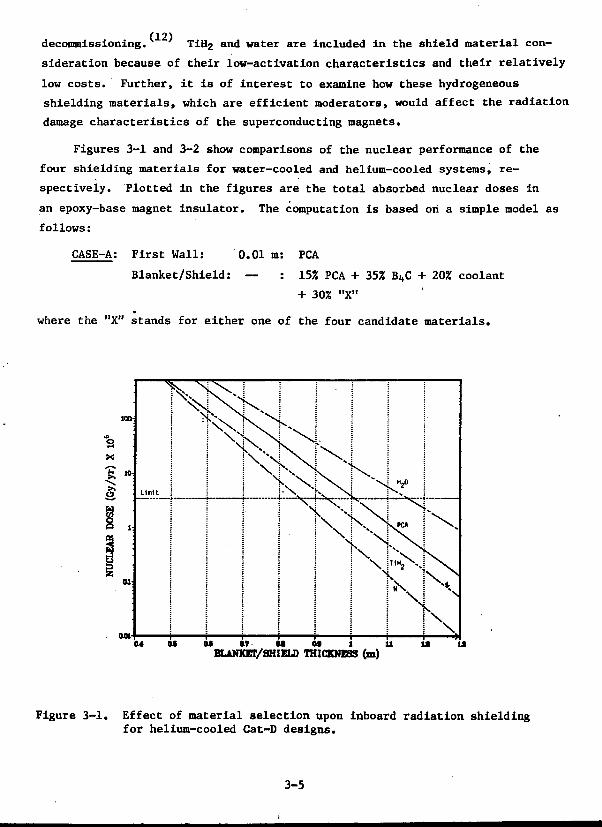
decommissioning. TiH2 and water are included in the shield material con-
sideration because of their low-activation characteristics and their relatively
low costs. Further, it is of interest to examine how these hydrogeneous
shielding materials, which are efficient moderators, would affect the radiation
damage characteristics of the superconducting magnets.
Figures 3-1 and 3-2 show comparisons of the nuclear performance of the
four shielding materials for water-cooled and helium-cooled systems, re-
spectively. Plotted in the figures are the total absorbed nuclear doses in
an epoxy-base magnet insulator. The computation is based oh a simple model as
follows:
CASE-A; First Wall: 0.01 m: PCA
Blanket/Shield: — : 15% PCA + 35% Bi,C + 20% coolant
+ 30% "X"
where the "X" stands for either one of the four candidate materials.
u M M M «• 1 UBLANKET/SHIELD THICKNESS (m)
Figure 3-1. Effect of material selection upon inboard radiation shieldingfor helium-cooled Cat-D designs.
3-5

< u a s a s a.7 a s 0 9 I 1 1 1 2 1 aBLANKET/SHIEUD THICKNESS (m)
Figure 3-2. Effect of material selection upon inboard radiation shieldingfor water-cooled Cat-D designs.
It is found that for a dose range of interest, the shielding perform-
ance in the helium-cooled systems is graded as W > TiH2 > pCA > H2O com-
pared to the order, W > PCA > TiH2 > H2O in the water-cooled systems. The
better shielding performance with TiH2 compared to PCA in the helium coolant
designs reflects the fact that the relatively hard neutron spectrum is
significantly softened by hydrogen in TiH2 which improves the absorption
in BjjC. The variance in the shielding performance yields an increase in
the required shield thickness relative to the tungsten design as follows:
Helium-Coolant Case
0.07 m (TiH2) < 0.14 m (PCA) < 0.29 m (H20)
Water-Coolant Case
0.09 m (PCA) < 0.12 m (TiH2) < 0.27 m (H20)
The calculation here is based on the dose limit of 108 Gy over a 40-yr plant
lifetime with 75% availability (annual dose limit of = 3.3 x 10⁶,Gy/yr).
It is noted that the use of water in a large quantity substantially degrades
the shielding performance. As expected, the use of tungsten, in particular,
3-6

along with the water coolant, significantly reduces the shield thickness
required for magnet protection.
Figure 3-3 shows the impact of coolant selection on the shielding design
as a function of plant lifetime. In the cases of both the PCA and W shields,
the increase in /\*s caused by the use of helium is %0.2n for a broad range
of the plant lifetime. Also shown in the figure for comparison is the case
of the D-T-fueled STARFIRE^13' design in which the LiA102 solid breeder is
placed in the inboard blanket. The STARFIRE design is similar to the H2O/W
case in terms of the shielding material composition. It is seen that the
elimination of tritium breeding requirement in the Cat-D design can bring
about » 0.4 m reduction in the inboard shield thickness. Note that the
first walls of both STARFIRE and the present D-D system are designed for
approximately the same non-neutron surface heat load of <* 1 MW/m2.
This study led to the following inboard blanket/shield design for more
detailed analysis.
CASE-B: First Wall: 0.01 m: 50% PCA + 50% H20
Blanket: 0.30 m: 85% PCA + 15% H20
Shield: 0.41 m: 15% Fel422 + 15% H20 + 35% B4C + 35% W
PUNT LirE-TIME (jrr)
Figure 3-3. Impact of coolant material selection upon Cat-D plant l i fet ime.
3-7

The total ARC, thickness of 0.72 m does not include a space allowance which
is required for isolating the high temperature blanket from the low tempera-
ture shield, isolating the magnet thermal dewar from the liquid helium vessel,
or other allowances. Based on the STARFIRE design, a total radial distance
of 0.1 m is set aside for the space allowances, leading to the actual inboard
AJL thickness of 0.82 m. The Fel422^14' in the shield is a non-magnetic
iron-base alloy that contains 14 wt % Mn, 2 wt % Ni,and 2 wt % Cr as the major
constituents. The application of Fel422 to the shield is very attractive
compared to more conventional iron-base alloys such as Type 316 SS and Type
304 SS. The potential advantages are: (1) the reduced use of resource
limited chromium and (2) reduced long-term activation caused by nickel.
The possible increase in activation due to the increased Mn content results
primarily from a larger production of 56Mn. Since 56Mn has a decay half-life
of 2.6 hr, it will become trivial in several hours after reactor shutdown.
Table 3-1 summarizes the maximum damage response rates in the inner
TF-magnets based on the effective shield thickness of 0.72 m. As mentioned
earlier, the total dose in the insulator is 108 Gy over a 40 yr plant lifetime
with 75% availability. About 90% of the dose is contributed by the neutron
interaction. The anticipated maximum nuclear heating rate of % 10"1* MW/m3
is substantially lower than the heat removal capacity in the system provided
for Joule-loss heat removal. ' The resistivity increase of 2.4 x 10~10 fl-m
in the Cu stabilizer is lower than the magnetoresistivity increase in the high
field region, which is estimated to be = 6 x 10~8 n-n/16'17^ at 14 T. The esti-
mate is based on a commercial grade copper having a residual resistivity ratio
(RRR) of =» 100. The non-radiation-induced resistivity increase will be further
enhanced during operation due to the cyclic strain effects at the cryogenic
temperature if the system is operated in a pulsed mode. In any event, the
resistivity increase of 2.4 x 10~10 Si-m does not seem to require magnet
annealing over the whole plant lifetime. The neutron fluence shown in Table 3-1
includes the total neutron contribution. The fast neutron (> 1 MeV) fluence
is « 1.4 x 10²² m~2 at the end of plant life. According to Ref. 20, no
appreciable property deterioration of Nb3Sn is observed at a magnetic field
of 4 T under the neutron fluence in question. Although Refs. 20 and 21 show
a very rapid decrease in the Nb3Sn critical current density with magnetic
field strength applied, the fast neutron fluences used for the measurements
3-8

Table 3-1. Maximum Radiation Response Rates in Inner TF Magnets
1. Neutron fluence (m~2) 2.0 x 10²²
2. Photon fluence (nr2) 6.5 x 10²²
3. Critical current density decrease in 9Nb3Sn (%)
4. Resistivity increase in Cu stabilizer 2.4 x 10~10
(fi-m)<b>
5. Atomic displacement in Cu stabilizer (dpa) 4.4 x 10"3
6. Dose in insulator (Gy)
Neutron 9.0 x 10⁷
Photon 1.0 x 10⁷
Total 1.0 x 10⁸
7. Atomic displacement in Type 304 SS 3.0 x 10~3
structure (dpa)
8. Nuclear heating (MW/m3)
Stabilizer 1.3 x lO"*1
Superconductor 8.3 x 10~5
Structure 1.1 x 10"1*
Insulator 1.6 x 10"1*
Based on:
Neutron Wall Load (MW/m2): 14.06 MeV source: 0.483
2.45 MeV source: 0.0967
Total: 0.5797
Plant Lifetime (yr): 40
Plant Availability (%): 75
See References (18,19).
3-9

are significantly higher uhan the present case. In addition, there is some(19 21)
evidence ' that the critical current density in NbaSn increases as a
function of irradiation fluence in a certain range. If the experimental data
of Rer. 23, based on neutron fluences of 10 2 3 - 102lf m~2, are extrapolated
to the present case, the critical current density change is expected to be a(22)
decrease of » 9% of the unirradiated value at 14 T. It is conceivable,
therefore, that near the end of plant life, the extent of the radiation damage
in the Nb3Sn superconductors would reach a non-trivial level. It should be
noted, however, that the decrease in the critical current density can be
accommodated by adding more Nb^Sn to offset the decrease and produce the(19)
same required ampere-turns. Therefore, the radiation damage in ttt^Sn
is amenable to an economic tradeoff between the increased magnet cost and
the increased inboard shield thickness required to reduce the damage level.
By virtue of the graded magnet design, the NbTi superconductors do not appear
to pose any serious radiation damage problems.
3.1.2 Blanket Energy Multiplication
Distinction between the inboard and outboard blanket/shield designs is
necessary as the design objectives and constraints are quite different in
the two regions. As already discussed, the volume of the inboard section is
typically * 10% of the total blanket/shield volume. The implication is that
most of the important blanket functions, such as fusion energy conversion,
heat removal, and tritium breeding (if any), must occur in the outboard section.
This fact leads us to take a quite different design approach for the outboard
blanket/shield than for the inboard blanket/shield, which was designed to
minimize A__. In addition the fact that the space of the outboard
section is not so restrictive as that of the inboard section provides another
consideration with respect to the material selection for the outboard blanket
design. For example, use of a tungsten shield that may be justified for the in-
board region may not be the best for the outboard region because of the high ma-
terial cost involved. Less effective, but less expensive, shielding materials
may be sufficient to perform the required radiation shielding for the outboard
shield.
In this section the analysis is focused on the neutronic power
optimization in the outboard blanket. Nuclear design and its optimization
for reactor components beyond the outboard blanket require additional study
3-10

and analysis. Within the framework of the one—dimensional analysis, the
same infinite cylinder model as that used in the previous section is assumed
for the present analysis. We define a reference outboard blanket/shield
system of 1.0 m as follows:
CASE C: First Wall: 0.01 m: 502 PCA + 502 H20
Blanket: 0.30 m: 85% PCA + 152 H20
Shield: 0.69 m: 502 Fel422 + 152 H20 + 352 B^C
Table 3-2 shows the nuclear energy deposition in the reference system.
More than 97% of the nuclear energy is deposited in the * 0.3-m-thick
first wall/blanket. The energy leakage into the shield region, which is
considered to be non-recoverable because of its low-grade heat, is quite
small. The energy multiplication factor of 1.47 (1.43 in the first wall/blanket
only) by the 14.06 MeV source is substantially higher than a typical energy(14)amplification in D-T-fueled tokamaks. For example, the D-T STARFIRE
yields a gross nuclear (neutron + gamma) power of 3200 MWth out of the 2810
MWth fusion neutron power input to the first-wall/blanket, resulting in a
blanket power amplification factor of 1.14. The high blanket energy gain in
the D-D system examined above results from the significant neutron energy
moderation by the water-coolant and the (n,y) reaction in the FCA-structure.
Despite the facts that the (n,y) reaction Q-value of PCA is modest (* 7.9 MeV)
and the (n,2n) reaction (Q-value of * 9.9 MeV) probability is fairly high, the
PCA structure can provide substantial energy multiplication because of the
relatively high (n,y) reaction probability. For example, an energy loss from
the (n,2n) reaction takes place at a rate of * 0.21 per 14.06 MeV source
neutron in the PCA blanket. This figure is compared to the total (n,y)
reaction rate in the blanket of * 0.99 per 14.06 MeV neutron, indicating
that approximately 802 of the neutrons derived from the 14.06 MeV source
eventually undergo the (n,y) reaction.
One of the most outstanding features of the D-D system is associated
with its extremely high energy multiplication potential by the 2.45 MeV
source neutrons. Due to the fact that the source energy is below most of
the threshold energies for endothermic neutron reactions, the 2.45 MeV
source neutrons and their descendent neutrons possess a. higher probability
for inducing the (n,y) reaction. In fact, the energy multiplication factor
3-11

Table 3-2. System Energy Multiplication in a D-D-Tokamak Reactor (a)
First Wall
Blanket
Shield
TOTAL
(1) per (14.06 + 2.45)(e)
(2) per 14.06(f)
(3) per 2.45<g)
Nuclear Energy Deposition (MW)
14.06 + 2.45(b) 14.06 Only(c)2.45 Only(d)
152 98 54
1461 918 543
39 26 13
1652 1042 610
Energy Multiplication Factor
14.06 + 2.45 14.06 Only 2.45 Only
1.94 1.22 0.72
1.47
4.30
(a) First Wall: 0.01 m: 50% PCA + 50% H20
Blanket: 0.30 m: 85% PCA + 15% H20
Shield: 0.69 m: 50% Fel422 + 15% H2O + 35%
(b) Both 14.06 MeV and 2.45 MeV source neutrons.
(c) 14.06 MeV source neutron only.
(d) 2.45 MeV source neutron only.
(e) Energy multiplication per 852 MW (= 710 + 142) fusion neutron power.
(£) Energy multiplication per 710 MW fusion neutron power.
(g) Energy multiplication per 142 MW fusion neutron power.
3-12

of w 4.3 for the 2.45 MeV source shown in Table 3-2 is very close to the
maximum energy amplification that one can theoretically expect. It is re-
markable that the initial fusion neutron power of 852 MW (- 710 + 142) is
eventually amplified to 1652 MW, resulting in a total system energy of
3150 MW (system energy multiplication factor of =1.34) based on the total
fusion power of 2350 MW including a non-neutron fusion power of 1498 MW.
The long-term radioactivity is an important design consideration for
future fusion commercialization as it may result in long-terra storage require-
ments and depletion of some resource-limited materials. For example,
construction of a very large number of reactors in which the PCA steel is
used in a large quantity, would eventually pose a serious chromium resource( 23}
availability problem because of the lack of recycling potential of PCA
due to its associated high-level long-term activation. Note that the PCA
activation is not due to chromium on a long time-scale, but primarily is dueQ2)
to Ni and Mo. It is, therefore, critical to select itrinsically low-
activation materials or reasonably abundant materials for a mature fusion
power economy.
Table 3-2 compares the system energy multiplication for several blanket
systems. Three refractory materials (CrN, Si3Ntj and SiC) are considered
because of their relatively low-induced activation (or natural abundance)
and high potentials for high energy release by the (n,y) reaction. For
example, the reaction Q-values of Cr, N, and Si are = 9.2 MeV, = 10.8 MeV
and » 8.8 MeV, respectively, which can be compared to * 7.9 MeV for the PCA-
steel. Unfortunately, however, light elements, such as N, Si and C, typically
have small (n,Y) reaction probabilities. In addition, there exist several
endothermic reactions, which have relatively low threshold energies with
the light elements. For instance, the reaction Z-value for the N(n,o) reaction
is only % 160 keV indicating that even the 2.45 MeV source neutron dissipates
its energy through the (n,a) reaction.
According to the results of Table 3-3, the energy multiplication in the
S13N4 system is appreciably lower than inlthe other systems. The power generation
in the PCA, CrN and SiC systems is comparable, and the maximum difference is
only «150 MW. As shown in Table 3-4, the primary energy deposition in the
blanket relies on PCA and/or chromium in CrN. The contribution from the
light elements themselves is small. They serve primarily as moderators for
3-13
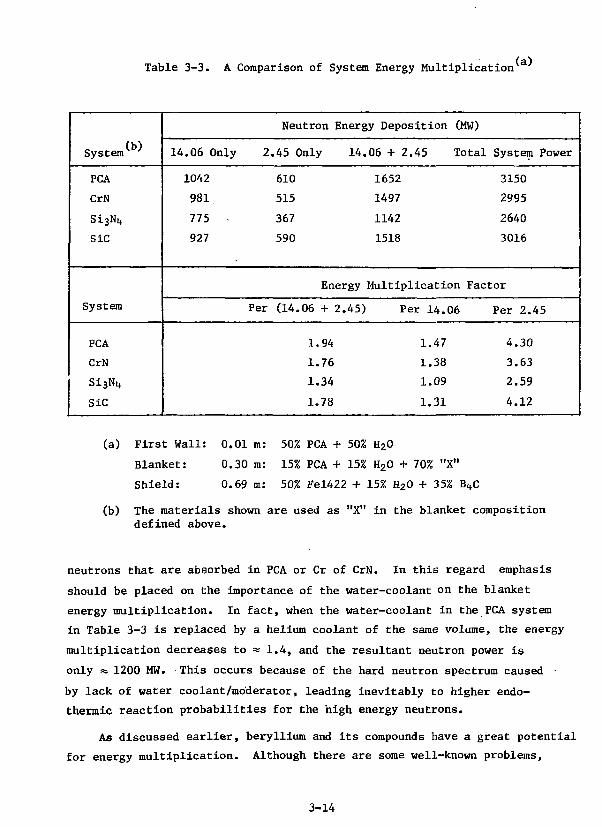
Table 3-3. A Comparison of System Energy Multiplication
System(b)
PCA
CrN
Si3Nit
SiC
System
PCA
CrN
Si3Ni,
SiC
14.06 Only
1042
981
775 .
927
Neutron Energy Deposition (MW)
2.45 Only 14
610
515
367
590
Per (14.
Energy
06 + 2.45)
1.94
1.76
1.34
1.78
06+2.45 Total
1652
1497
1142
1518
System Power
3150
2995
2640
3016
Multiplication Factor
Per 14.06
1.47
1.38
1.09
1.31
Per 2.45
4.30
3.63
2.59
4.12
(a) First Wall: 0.01 m: 50% PCA + 50% H20
Blanket: 0.30 m: 15% PCA + 15% H20 + 70% "X"
Shield: 0.69 m: 50% Fel422 + 15% H20 + 35%
(b) The materials shown are used as "X" in the blanket compositiondefined above.
neutrons that are absorbed in PCA or Cr of CrN. In this regard emphasis
should be placed on the importance of the water-coolant on the blanket
energy multiplication. In fact, when the water-coolant in the PCA system
in Table 3-3 is replaced by a helium coolant of the same volume, the energy
multiplication decreases to « 1.4, and the resultant neutron power is
only s& 1200 MW. This occurs because of the hard neutron spectrum caused
by lack of water coolant/moderator, leading inevitably to higher endo-
theraic reaction probabilities for the high energy neutrons.
As discussed earlier, beryllium and its compounds have a great potential
for energy multiplication. Although there are some well-known problems,
3-14

Table 3-4. A Comparison of (n,y) Reaction Rates^
ComponentMaterial
H2O
PCA
CrN
S13N1,
SiC
BlanketTotal
0
0
0
14
PCA
.013
.976
—
.989
.06 MeV
0
0
0
0
CrN
.012
.153
.463
—
—
.628
Reaction Rate/Source
Source
Si
0.
0.
-
0.
0.
•3»U
017
213
-
044
274
Blanket System'1^
0
0
0.
0.
SiC
.048
576
—
082
707
PCA
0.013
0.932
—
—
—
0.945
Neutron
2.45 MeV Source
CrN
0.013
0.169
0.511
—
—
0.693
Si3N,
0.025
0.307
—
0.063
—
0.395
SiC
0.
0.
0.
0.
064
761
108
933
(a) Blanket: 0.30 m: 15% PCA + 15% H20 + 70% "X"
(b) Materials shown stand for component "X".
(24)chemical toxicity, and radiation-inducedsuch as resource limitation,
swelling, regarding the use of Be in fusion reactors; it is of interest
to assess its potential for energy multiplication. Consider a case where one
14.06 MeV source neutron undergoes a neutron multiplication process by the (n,2n)
reaction with a given multiplier, M, while the secondary neutrons induce the
(n,y) reactions with given absorber materials Al and A2. The energy balance
involved in the sequence of events described above can be well predicted by
a simple formula for the multiplication factor, f:
E - QM(n,2n) + QA1(n,Y) + QA2(n,Y)
E_
3-15

where
Es is the source neutron energy, 14.06 MeV.
QM(n,2n) is the (n,2n) reaction Q-value of the multiplier, M, in MeV.
y) is the (n,y) reaction Q-value of the absorber, A, in MeV.
It is expected that the equation given here can predict the energy
amplification by the 14.06 MeV source neutron in an actual situation, provided
that: (1) the (n,2n) reaction by the multiplier has a high probability,
(2) the secondary neutrons do not undergo any further endothermic reactions,
and (3) the contributions from other reaction processes are trivial.
Table 3-5 presents a matrix of the potential energy amplification factor
f for Be and Pb multipliers with several absorber elements. It is assumed
that both of the secondary neutrons are absorbed by a single kind of ab-
sorber (i.e., Al = A2). It is noted from Table 3-5 that: (1) in general,
the energy multiplication is significantly enhanced by the multipliers, (2)
the Be-multiplier system can yield a higher energy multiplication than the
Pb-multiplier system, and (3) the absorption event by the multiplier material
itself lowers the otherwise possible energy multiplication. The lower energy
Table 3-5. Potential of Energy Multiplication by Neutron Multipliers
Absorber
Be
Pb
Cr
N
Si
PCA
Energy Multiplication Factor
Be-Multiplier
1.85
—
2.20
2.42
2.13
2.00
Pb-Multiplier
—
1.29
1.84
2.06
1.77
1.64
Based on:
Jl,
14.06 - QM(n,2n) + 2QA(n,y)14.06
Q(n,2n): the (n,2n) reaction Q-value of multiplier (in MeV)
the (n,y) reaction Q-value of absorber (in MeV).QA(n,Y):
3-16

multiplication with Pb stems from the higher Pb(n,2n) Q-value (-6.73 MeV)
than the Be(n,2n) Q-value (-1.66 MeV). Obviously, the extent to which the
system energy is actually multiplied strongly depends upon the macroscopic
reaction cross section of each element and the geometrical layout of these
elements. However, it is very probable that in a system making use of a
Be-multiplier, the energy amplification of the 14.06 MeV source would
be = 2.0 or higher in many actual combinations of the candidate blanket ma-
terials (PCA, SiC, CrN, Si3Nj,).
Table 3-6 shows the effect of the energy enhancement by a Be-multiplier
of 0.1 m placed between the first wall and the blanket. The energy multipli-
cation factor of the 14.06 MeV source (multiplication per 14.06 in the
table) shows good agreement with our prediction. The energy enhancement by
Table 3-6. System Energy Multiplication with the Be Multiplier
*System
PCA
CrN
Si3N^
SiC
PCA (no Be)
System
PCA
CrN
Si 3 ^
SiC
PCA (no Be)
14.06 Only
1335
1337
1284
1216
1042
Per
Neutron
2.45 Only
601
595
568
533
610
Energy
(14.06 + 2.
2.27
2.27
2.18
2.05
1.94
Energy Deposition (MW)
14.06 + 2.45
1936
1932
1854
1749
1652
Multiplication
45) Per 14.06
1.88
1.88
1.81
1.71
1.47
Total System Power
3434
3430
3352
3247
3150
Factor
Per 2.45
4.23
4.19
4.00
3.76
4.30
First Wall: 0.01 m: 50% PCA + 50% H20
Multiplier: 0.1 m: Be (70% density factor)
Blanket: 0.3 m: 15% PCA + 15% H20 + 70% "X
Shield: 0.59 m: 50% Fel422 + 15% H20 + 35%
3-17

the multiplier varies from a 0.25 to =K 0.85 in the multiplication factor per
(14.06 + 2.45) and from « 250 MW to »700 MW in the system power output.
It is important to note that the difference in the system power output pro-
duced by different blanket materials in the absence of a multiplier is greatly
smeared out in the case where beryllium is used. This finding provides
another degree of design flexibility upon the material selection for the D-D
outboard blanket design.
3.2 Thermal Hydraulic Analysis
An examination of some of the preliminary design data for an alternate
fuel (D-D) fusion reactor shows that from a thermal hydraulics viewpoint
the first wall/blanket system presents some unique design and cooling con-
cepts. For example, due to no tritium breeding requirements, a variety of
blanket and cooling concepts may be perceived based on an array of heat
transport fluids and structural and blanket material combinations. The lower
wall loadings for the current D-D reactor design (e.g., 1.6 MW/m2 for the
D-D reactor vs. 3.5 MW/m2 for STARFIRE ) results in less severe demands
on the heat transport system, although the surface heat fluxes on the first
wall are about the same (e.g., 1.02 MW/m2 for the D-D reactor vs. 0.9 MW/m2
for STARFIRE). A series of thermal hydraulic analyses was carried out for
two first wall/blanket design concepts (e.g., a coolant panel-type first
wall attached to monolithic blanket blocks and cylindrical modules with
hemispherical front end) with water, helium and sodium as the heat transport
fluids. The analytical studies presented herein are limited to three blanket
materials: silicon nitride, silicon carbide, and chromium nitride. The re-
sults of the parametric investigations in terms of coolant inlet and outlet
conditions, coolant velocities, maximum temperature of the structural material
and the blanket material, coolant channel dimensions, and the pumping power
losses are summarized below.
3.2.1 Coolant Panel Design Concept
In this design concept the coolant panels form the first wall are
attached to blanket blocks. The coolant enters the first wall, flows in*a
direction parallel to the toroidal field, and then returns through the blanket
blocks which contain a set of 2.54-mm (0.1-in) diameter coolant channels
3-18

located at 25.4-ram (1.0-in) centers. The analytical results with water and
helium as the coolants are summarized in Table 3-7. The results show that
fairly narrow coolant channels with stainless steel as the structural material
and water as the coolant provide an acceptable first wall design. However, for a
helium-cooled first wall it would not only be necessary to use shorter and
larger coolant channels to minimize pumping power losses, but also it would
be necessary to use refractory metals to withstand the higher operating
temperature.
3.2.2 Cylindrical Module Design Concept
In this design the coolant (helium at 750 psia) enters the modules
through an outer annulus (space between the container and blanket material)
and, after reaching the hemispherical front end (first-wall), returns through
a set of coolant channels (2.54-mm diameter located at 25.4-mm centers).
During these scoping studies, the thermal hydraulic calculations were con-
fined to the return leg of the coolant through the blanket. (Note: cooling
of the casing and hemispherical head is similar to the analyses presented in the
previous section). Table 3-8 summarizes the results for three blanket ma-
terials — silicon nitride (SiN), silicon carbide (SiC), and chromium nitride
(CrN), based on 30-cm thick blanket modules. As the maximum operating tempera-
ture for the nitride blanket is limited to = 1000°C, CrN does not appear to be
a viable blanket material. The pumping power losses for this design are quite
small, being less than 1%. However, because of the small module size (10 to
20 cm in diameter), blanket design and manifolding a large number of such units
may present a formidable task.
The gap between the cylindrical modules must be filled with a filler
material to prevent neutron streaming. An analysis was carried out for two
sizes of cylindrical modules (10-cm diameter and 20-cm diameter) to assess
whether the uncooled filler elements will present any hot spot problems for
the container wall. The maximum gap for closely-packed modules of the above
two cylinder sizes was found to be 1.57 mm and 3.14 mm, respectively. The maxi-
mum temperature of the filler elements was calculated based on the assumption
that only 20% of the surfaces are in contact, and the interfacial gap con-
ductance between the filler elements and the cylindrical modules is
3-19

Table 3-7. Summary of Analytical Results - Coolant Panel Concept
CoolantVelocity
Coolant m/s
Water 7
Helium 277
. 198
139
92
69
55
Coolant InletTemp. andPressure
280 °C2200 psia
225 "C750 psia
225 °C1250 psia
CoolantOutlet Temp.
°C
320 °C
425 °C
CoolantChannelSize
4 mm x 12 mmx 3.5 m long
4 mm x 12 mmx 3.5 m long
4 mm x 12 mm'x 2.5 m long
4 mm x 12 mmx 1.75 m long
6 mm x 12 mx 1.75 m long
8 mm x 12 mmx 1.75 m long
6 mm x 12 nunx 1.75 tn long
Max. StructuralMaterialTemp. °C
423
563
581
607
646
683
646
Pumping PowerLoss (% of Thermal
Power
< 1
65
31
7
4.2
2.2
2.5

Table 3-ii. Summary of Analytical Results for Cylindrical BlanketModules (750 psia helium inlet pressure)
Helium InletTemperature
°C
225
250
275
300
325
350
HeliumOutlet Temp.
°C
400
425
450
475
500
525
HeliumVelocitym/s
22
MaximumBreeder Temp.
°C
SiN
544
570
596
622
649
675
CrN
995
1028
1056
1083
1110
1136
SiC
511
537
563
590
617
643
Pumping Power Loss(% of Thermal
Power
< 1
0.452 W/cra2-cC (800 Btu/hr«ft2R). The results, based on the maximum nuclear
heat generation rate (i.e., nuclear heat generation rate near the first wall),
are summarized below.
Module Size
10-cm diameter
20-cm diameter
Filler ExcessTemperature, °C
SiN
44
103
CrN
81
255
SiC
40
87
Since the coolant enters the modules through the annular gap at 225°C, and
the temperature rise between the coolant inlet point and the hemispherical
section will not exceed 50°C, hot-spots at the filler elements may not pose
serious material problems depending, of course, on the choice of the struc-
tural material.
3-21

3.2.3 Liquid Metal (sodium) Coolant
One of the serious limitations on the choice of a conducting fluid as
coolant is the MHD interactions in high magnetic fields giving rise to large
pressure losses. Because of the superior heat transfer characteristics of
sodium, cooling of the first wall or heat removal from the blanket regions
is not a problem. Hence, only an estimate of the pressure losses for a set
of coolant channel and coolant manifold layouts was carried out. The results
show that the pumping power losses for the blanket and the inlet/outlet mani-
fold are of the order of 2.5%. Since a detailed inlet and outlet mani-
fold layout and the details of the sodlium-cooled blanket modules have
not been worked out, the above results should be considered as preliminary.
3.2.4 Conclusions
Because of the relative low energy levels for the current D-D reactor
design, no serious thermal hydraulics problems are envisioned. Water,
helium, and liquid metals appear as viable coolants. The choice of the
coolant depends on the selection of the blanket and structural materials,
compatibility of coolants with the structural material, and the maximum
operating temperature limits. The choice of blanket module design is dic-
tated by economic considerations.
3.3 Structural Materials
The structural material requirements, which are similar to the re-
quirements for a D-T reactor, are that the material should be resistant to
radiation damage, capable of elevated temperature operation, and environ-
mentally compatible with its surroundings. In addition, it is desirable that
the material exhibit low activation and that its properties should not be
affected by the formation of transmutation products. The number of potential
structural materials is large, and surveys have been conducted previously toC13 25)
evaluate their viability for D-T reactors. ' This evaluation focuses
upon the comparison of two of the more attractive material candidates for the
particular conditions expected in a D-D fueled reactor. The first candidate
is an advanced austenitic stainless steel known as PCA (Prime Candidate Alloy),
and the second candidate is the vanadium alloy, V-20T1.
3-22

A summary of the properties of the two materials is given in Table 3-9.
The primary concern for PCA is its poor thermophysical properties, which could
result in large thermal and stress gradients in the first wall. Under steady
state conditions the thermal stresses are expected to relax due to creep
and therefore should not pose a significant problem. However, if the reactor
operates in a cyclic mode, the same stresses do result in fatigue that can
lead to premature crack failures. The mechanical properties of both ma-
terials are adequate for the temperature (< 500°C) and stress conditions
expected in a pressurized water system. The effect of radiation on the swelling
and mechanical properties of both materials is expected to be within acceptable
limits. In fact, vanadium-titanium alloys have been found to be among the
most radiation resistant materials tested. A major concern in the use
of V-20Ti is a potentially higher corrosion rate caused by the water coolant.
The corrosion rate of pure vanadium is unacceptably high in pressurized water to
be considered for this system. However, alloying with strong oxide formers,
such as titanium, should reduce the rate of corrosion. Additional experimental
Table 3-9. Structural Materials Comparison
Property PCA V-20Ti
Thermophysieal
Mechanical
Swelling
Corrosion
Fabrication
Activation
Poor. Susceptible tohigh temperature andstress gradients. Cannot withstand highcyclic heat fluxes.
Strength adequate to* 500°C. Retains ade-quate ductility withirradiation.
Low. Estimated to be* 1/10 the swelling of20% CW 316 SS.
Low for pressurizedH2O systems.
Established technology.Easily fabricated.
Long-term activation.
Good. Capable of with-withstanding high heatfluxes.
Strength adequate to« 650°C. Retains ade-quate ductility withirradiation.
Low. No measurableswelling has been ob-served .
H20 corrosion of purevanadium is high, butalloying could reducecorrosion levels.
Somewhat difficult.Welding requires inertcover gas.
Low long-term activation.
3-23

effort is required to quantify the effect of alloying on the water corrosion
of vanadium alloys. Austenitlc stainless steels, like FCA, are generally
considered to be easily fabricated, whereas additional care must be taken
in the fabrication of vanadium alloys, particularly for welding, in order
to prevent the impurity buildup of oxygen, nitrogen, or carbon.
In order to determine if PCA is capable of an acceptable lifetime for
the operating conditions of a D-D reactor, a lifetime analysis has been per-
formed. The analysis, based upon a model developed for the STARFIRE study,
considers a tubular first wall that receives a uniform neutron flux and a heat
flux from one side. The interactions of swelling, creep, and crack growth
are followed in two dimensions for a chosen set of operating conditions.
The conditions used for the lifetime analysis of the D-D reactor are given
in Table 3-10. Crack growth to failure is of particular concern in a D-D
reactor because of the relatively high heat flux and the cyclic burn cycle.
In the present case, however, little or no crack growth for times to 60,000 h
is predicted for an initial flaw size of 100 pm. It should be noted that
fatigue and crack growth could still be a problem for PCA if the reactor were
Table 3-10. Design and Operating Parameters for Lifetime Analysis
Tube Diameter (mm) 20
Wall Thickness (mm) 1.5
Coolant Pressure (psig) 2000
Coolant Temperature (°C) 320
Neutron Wall Load (MW/m2) 0.9
Surface Heat Flux (MW/m2) 0.5
dpa Rate (dpa/MW-yr/m2) 17.7<4)
(4)Helium Generation Rate 125 v /
(appm/MW-yr/m2)
Initial Crack Length (urn) 100
Burn Time (h) 2
Dwell Period (s) 30
Startup/Shutdown Time (s) 30
3-24

operated with a burn cycle considerably shorter than 2 h or if the surface heat
load were higher. Swelling and creep are predicted to have a smaller effect in
this D-D reactor than in STARFIRE due to the significantly lower neutron flux.
This effect is illustrated in Fig. 3-4, which shows that the stress relaxation
is much slower in the D-D reactor than in STARFIRE. Swelling also occurs at
a lower rate, and therefore the total dimensional changes in the first wall
of a D-D reactor are lower.
Based upon this analysis, PCA should have an adequate lifetime and has
been chosen as the primary candidate for the structural material. If the
operating parameters of heat load or operating cycle were changed, the struc-
tural material choice would have to be re-evaluated, and the selection of a
refractory metal, such as V-20Ti, might be necessary.
3.4 Moderator Materials
Three moderator materials, CrN, Si3Nt,, and SiC, have been considered
in the blanket, and representative values of their physical properties are(27-29)
given in Table 3-11. The desirable properties of moderator ma-
terials that would provide the greatest flexibility in the blanket design
1000 2000 3000
TIME, h
4000 5000
Figure 3-4. Stress relaxation in first wall tube section directly facingplasma in STARFIRE and D-D reactors.
3-25

Table 3-11. Physical Properties of Moderator Materials
Material
CrN
Si3Ni,
SiC
M.P.°C
1500 ( b )
1871 ( b )
2827
Density^g/m3
6.1
3.2
3.2
ThermalW/m
3.5
22
31
Cond.(a)
KSpecific
J/kg
795
1100
1150
Heat ( a )
KThermal Exp.
x 106/K
3
3
5
1
6
7
^ @ 500"C
Decomposes(c)
Is room temperature
are high values for the melting point, thermal conductivity, and specific
heat along with a low density that would minimize the weight of the blanket.
Based upon these criteria, CrN exhibits the least desirable properties,
whereas SiC exhibits the most desirable properties. Since SiC also provides
the greatest energy multiplication of the three materials, it is the only
material considered further.
The crystal structure of SiC is cubic (3) at low temperatures, but the(27)
structure slowly changes to hexagonal (a) when it is heated above 1650cC.
SiC has been fabricated by several processes including reaction sintering,
hot pressing, and chemical vapor deposition. Reaction sintered SiC usually
contains both a and B phases with from 0 to 10% free carbon and/or silicon.
The amount of porosity can vary from 0.1 to « 20%. Commercial hot-pressed
SiC may contain up to 5 wt % of sintering aids, usually AI2O3. The grain
sizes can vary from 0.5 jim to 20 ym depending on the amount of AI2O3 and the
hot pressing temperature. Like other refractory materials, the mechanical
and thermophysical properties can be strongly influenced by the manufacturing
method.
The effects of neutron irradiation have only been investigated up to
a neutron fluence of * 2 x 10 2 2 n/cm2 (E > 0.1 MeV). The limited amount
of data indicate that the effects of radiation on several properties examined
at temperatures < 104C°C appear to saturate. The saturation level of radia-
tion induced expansion is * 1Z at room temperature. The saturation level
decreases linearly with temperature and reaches * 0.05% at 1000°C. At
3-26

temperatures > 1200°C, void swelling similar to swelling in metals, is observed.
At temperatures < 650°C, effects on mechanical properties also saturate with
fluence. Both the fracture strength and Young's Modulus for reaction
bonded SiC decrease rapidly up to a dose of 1-3 x 10²⁰ n/cm2 and then begin
to increase. Saturation is reached at 7-10 x 1020 n/cm2, but the property
values are still less than the unirradiated values. The degradation of the
mechanical properties has been attributed to internal cracking generated by
radiation induced misfit strains between the a and $ phases as well as the
impurities in the material. Further experimentation is required to determine
if the saturation of property values extends to the fluence and temperature
conditions of a D-D reactor.
3.5 First-Wall Surface Effects
Selection of the material that serves as the first physical barrier to
the plasma is a critical consideration in the design of the first-wall. Low-Z
materials appear essential since high-Z impurities eroded from the first
wall and plasma chamber components, e.g., the limiter, can severely impact
the plasma performance. Also, impurities eroded from the first wall can be-
come energetic ions that subsequently strike the limiter. Since higher-Z
ions produce sputtering yields greater than unity at modest energies (of the :
order of 100 eV), excessive erosion of the limiter is predicted if the first
wall is constructed of other than low-Z materials.
A significant fraction of the energy emitted from the plasma is in the
form of cyclotron radiation. In order to attain an acceptable plasma energy
balance it is essential that a large fraction, e.g., possibly 90% or greater,
of this cyclotron radiation be reflected by the wall back into the plasma
where it can be absorbed. The surface morphology and structure of the wall
are important considerations in designing for high reflectivity.
It is also concluded that portions of the first wall must survive a
modest number of large transient surface heat fluxes that result from plasma
disruptions. Significant amounts of wall material ablated or vaporized during
a disruption will most likely deposit at other regions of the plasma chamber.
Because of the extensive material redistribution in the plasma chamber that
arises both from sputtering during normal operation and ablation during a
disruption, a single material for all plasma chamber components provides
3-27

Important advantages that may be essential. Deposition of a material, such
as graphite, on a metal first wall could substantially affect erosion rates or
the integrity of the metal wall. Likewise, deposition of elements from a com-
pound, e.g., TiC or TiB2, could result in a nonstoichiometric surface layer with
properties much different than the ideal compound. It is concluded in the
present design study that all first wall components, including the limiter,
should be constructed of the same material and that the surface material should
be a single element with a low-Z (probably < 10).
The recommended approach for incorporating low-Z materials into the
first wall is the low-Z coating (cladding) concept originally advocated(32)
in the ANL Experimental Power Reactor Study. A major advantage of this
concept relates to the greater flexibility of materials choices in that
the surface material or coating can be selected primarily on the basis
of its surface properties while the substrate can be selected primarily on
the basis of its structural and compatibility characterisics. This concept
permits use of low-Z materials that would not otherwise be viable candidates.
Table 3-12 summarizes the important considerations in the selection of
the primary candidate coating/cladding materials.
Table 3-12. Considerations for Selection of Coating/Cladding Materialfor the First-Wall
Atomic number (Z)
Physical sputtering yields
Chemical reactivity with hydrogen
Blistering erosion
Compatibility with candidate substrate materials
Melting temperature
Vapor pressure
Elemental composition
Thermal conductivity
Radiation damage resistance
Thermal expansion coefficient
Electronic conductivity
Fabricability
3-28
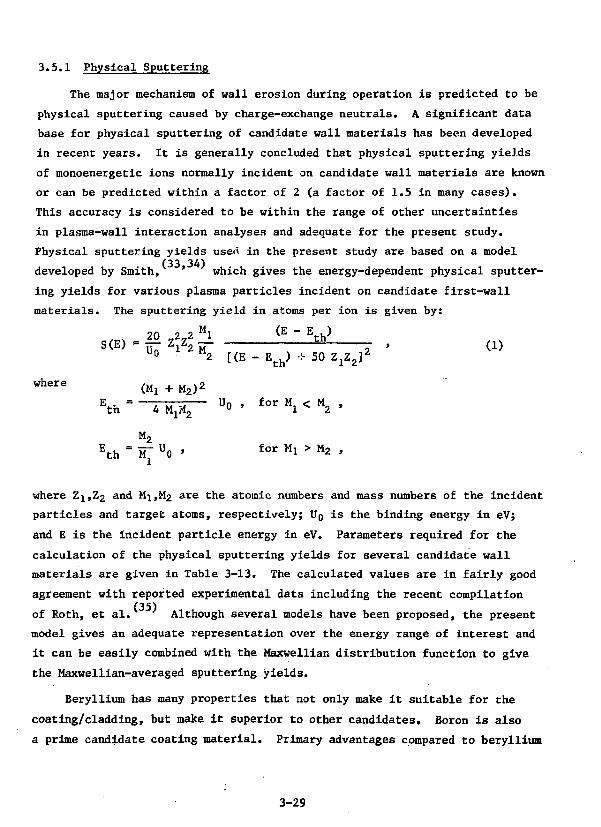
3.5.1 Physical Sputtering
The major mechanism of wall erosion during operation is predicted to be
physical sputtering caused by charge-exchange neutrals. A significant data
base for physical sputtering of candidate wall materials has been developed
in recent years. It is generally concluded that physical sputtering yields
of monoenergetic ions normally incident on candidate wall materials are known
or can be predicted within a factor of 2 (a factor of 1.5 in many cases).
This accuracy is considered to be within the range of other uncertainties
in plasma-wall interaction analyses and adequate for the present study.
Physical sputtering yields used in the present study are based on a model(33 34)
developed by Smith, ' which gives the energy-dependent physical sputter-
ing yields for various plasma particles incident on candidate first-wall
materials. The sputtering yield in atoms per ion is given by:20 2 2 Ml <E " Erv)U° *2 [<E - Eth) + 50 ZjZ2]
2
w h e r e (Mj + M 2 )2
Eth -
M2
Eth = M^ U0 ' f o r
where Zj,Z2 and Mi.Mj are the atomic numbers and mass numbers of the incident
particles and target atoms, respectively; UQ is the binding energy in eV;
and E is the incident particle energy in eV. Parameters required for the
calculation of the physical sputtering yields for several candidate wall
materials are given in Table 3-13. The calculated values are in fairly good
agreement with reported experimental data including the recent compilation(35)
of Roth, et al. Although several models have been proposed, the present
model gives an adequate representation over the energy range of interest and
it can be easily combined with the Maxwellian distribution function to give
the Maxwellian-averaged sputtering yields.
Beryllium has many properties that not only make it suitable for the
coating/cladding, but make it superior to other candidates. Boron is also
a prime candidate coating material. Primary advantages compared to beryllium
3-29

Table 3-13. Parameters for Calculation of Physical-Sputter Yieldsfor Candidate Wall Materials
WallMaterial
Be
B
C
Al
V
Fe
Nb
Mo
W
Z
4
5
6
13
23
26
41
42
74
M
9.0
10.8
12.0
27.0
50.9
55.9
92.9
95.9
183.9
u0,eV
3.4
5.7
7.4
3.4
5.3
4.3
7.6
6.8
11.1
include slightly lower physical sputtering yields and a higher melting tempera-
ture. The major disadvantages relative to beryllium are a much lower thermal
conductivity and a higher hydrogen solubility and permeability.
3.5.2 Electron Cyclotron Radiation
Electron cyclotron radiation poses a serious power loss problem for
reactors employing the D-D reaction. In order to maintain an energy balance
in the plasma, most of this radiation must be reflected from the first wall.
The reflectivity of the first wall will depend on the frequency of the
radiation, as well as the electromagnetic properties of the first wall.
The primary frequency, v, of the radiation is given by
where B is the magnetic field strength, e is the electron chare, and m
is the electron rest mass. For the reference design the maximum magnetic
field in the plasma is 11.6 Tesla, and therefore, the primary frequency
of the cyclotron radiation is 3.25 x 10¹¹ Hz. Higher frequency radia-
tion is also expected to be present to a lesser degree. A value of
3-30

Rt20 times the primary frequency, or 6.5 x 10¹² Hz, is estimated to be
the cutoff frequency of the radiation.
The reflectivity of metals to the cyclotron radiation can be estimated
from standard electromagnetic theory. For an incident polarized wave
in a vacuum, with its E vector normal to the plane of incidence, the ratio
of the incident electric field intensity, E., to the reflected electric
field intensity, E , is given by
E. K cose - j (1-j)
__ _ , a)Er
where K is the relative magnetic permeability of the. metal, 6. is the anglem i
of incidence, \ is tne wavelength of the incident wave, 6 is the skin depth
of the metal, and j = /—I. The skin depth, 6, is given by
x 1/25 = W ' <«where a is the electrical resistivity and y is the magnetic permeability.
Using property values of autenitic stainless steel in Eq. (3) (K = 1.0,
\ = 4.6 x 10~5 m, a = 106 (Ohm-m)"1, y = 1.26 x 10~6 Henry/m, v = 6.5 x 10 1 2
Hz, and J * 2 x 10~7 m) yields E./E = - 1. Since the reflectivity, R, is
the square of this number, almost total reflection is expected. The result
is thi° same for an incident wave polarized with its E vector parallel to
the plane of incidence.
During normal operation, the first wall is likely to have a thin oxide
layer on the surface. The impact of the oxide on the reflectivity of the
material is, however, expected to be small. A normally incident wave will
be transmitted through a non-conductive oxide and then be reflected at the
oxide-metal interface. The reflected wava will be re-transmitted through the
oxide and emerge back into the vacuum. The only change expected is a
phase change in the wave vector of the reflected wave . This phase change
will depend upon the oxide thickness and its electromagnetic properties.
3-31

3.5.3 Plasma Disruptions
One of the serious problems that may be encountered during operation of
fusion reactors is the problem of plasma disruption which gives rise to energy
fluxes of several hundred times the steady state value. Energy fluxes of
the order of 200 to 400 KW/m2 over a short period (e.g., 25 to 250 ms) of
time will lead to melting and evaporation of the first wall. A number of
studies (Refs. 38-31) of D-T fueled fusion reactors have recently been con-
ducted to assess the seriousness of unstable plasma behavior leading to an
energy dump over a small portion of the first wall surface. Since the energy
dump leads to complex physical and thermodynamic processes, and since the
nature of energy dump is not well defined, all of these studies of necessity
have been limited in scope. However, the results of these studies indicate
that an understanding of a plasma dump is an important aspect of the first
wall design. In contrast to D-T burning fusion reactors, the problems
associated with a plasma dump appear to be even more serious for the D-D
fueled fusion reactor. For example, the plasma energy deposited per unit
area on the first wall of the reference D-D reactor will be more than four
times the plasma energy deposited in a typical D-T fueled fusion reactor such
as STARFIRE.
Because of the limited scope of the present study, a detailed plasma
dump analysis has not been conducted. However, preliminary results summarized
in the following section show the seriousness of the problem. The major
parameters to be considered include the following:
Total Plasma Energy: 8 x 10⁸ J
Total Surface Area of the 1250 m2
First Wall:
Thickness of Be Cooling: 1 mm
It is assumed that the plasma energy is dumped over 30% of the surface area,
and that the Be coating is thermally insulated from the substrate (first
wall). The above assumption leads to complete melting of the coating and to
vaporization of « 31% of the coating. This is an over-simplified analysis
and represents an upper limit on the amount of Be coating evaporated
As mentioned earlier, the nature of the plasma dump has not been well
understood, and hence no consensus exists on the duration of a plasma dump.
3-32

Some of the previous analyses have shown plasma dump duration to be of the
order of 5 to 100 ms. A conservative approach was taken during this analysis
to see what happens to the temperature response of the Be coating based on a
100 ms plasma dump. The first wall was assumed to be cooled by sodium entering
at 275°C. The 1-mra thick Be coating was divided into five 0.2 mm thick layers
(Nodes 59-63) to calculate the temperature response. A time/temperature history
of the Be coating is shown in Fig. 3-5. As the melting point of Be is * 1285°C
and the first wall is exposed to high vacuum environment, ablation of the first
wall will occur before these calculated temperatures are approached. An
analysis was conducted to determine whether the plasma dump becomes a less
serious problem if the plasma dump time is increased by 100%, i.e., plasma
dump time is increased to 200 ms from 100 ms. The temperature response of the
Be coating is shown in Fig. 3-6. From Fig. 3-6 it is apparent that even if
the plasma dump times can be as long as 200 ms, a plasma dump is a serious
problem,and it needs further careful analysis. Figure 3-7 shows the tempera-
ture response of the stainless steel substrate (Node 56, 57, and 58) and the
coolant (Node 55).
4200
3700-6910D-NOOE
o-NOOE 60J-N00C 61• -N00E 62x-NOOE 63
2000.00 0.0S 0.10 0.1S 0.20 0.2S 0.30
TIME (SECONDSJFigure 3-5. Temperature response of Be-Coating for plasma disruption time
100 ms.
3-33

3400
200
S630LEGEND
°- NODE 59°- NODE 60»- NODE* - NODE 62* - NODE 63
4000.0 0.1 0.2 0.3 0.4 O.S 0.6
TIME (SECONDS)
Figure 3-6. Temperature response of Be-coating for plasma disruption time200 ms.
2500 0.7S 1.50 2.2S 3
TIME (SECONDS)3.7S 4.S0
Figure 3-7. Temperature response of structural material for plasma disruptiontime - 200 ms.
3-34

From the results presented in this section and although the analysis
presented above is an oversimplification of the physical phenomena, it may
be concluded that a plasma dump for D-D reactors appears to be more serious
than the plasma dump in D-T reactors. A detailed analysis is necessary to
more accurately assess the seriousness of the problem.
References
1. S. Glasstone and A. Sesonske, Nuclear Reactor Engineering, D. Van NostrandCompany, Ltd., p. 79 (1963).
2. R. Bett, Cryogenias JW, 361 (1974).
3. J. R. Horak and T. H. Blewitt, "Isocronal Recovery of Fast NeutronIrradiated Metals," J. Nuel. Mater., 49, 161 (1973/74).
4. E. Seibt, "Irradiation and Annealing Effects of Deuteron IrradiationNbTi and V3Ga Multifilamentary Composite Wires at Low Temperature,"IEEE Transactions on Magnetics, Vol. MAG-11, No. 2, p. 174 (1974).
5. R. P. Smith, personal communication, Argonne National Laboratory (1979).
6. R. R. Coltman, Jr., et al., "Effects of Radiation at 5 K on OrganicInsulators for Superconducting Magnets," Proc. 8th Symp. on EngineeringProblems of Fusion Research, Vol. Ill, p. 1694 (1979).
7. "ANISN-ORNL: Multigroup One-Dimensional Discrete Ordinates TransportCode with Anisotropic Scattering," Oak Ridge National Laboratory,RSIC/CCC-254 (1973).
8. R. W. Roussin, et al., "VITAMIN-C: The CTR Processed Multigroup CrossSection Library for Neutronics Studies," Oak Ridge National LaboratoryORNL/RSIC-37 (ENDF-296) (1980).
9. Y. Gohar and M. Abdou, "MACKLIB-IV: A Library of Nuclear ResponseFunctions Generated with the MACK-IV Computer Program from ENDF/B-IV,"Argonne National Laboratory, ANL/FPP/TM-106 (1978).
10. D. Garken (compiler), "ENDF/B Summary Documentation," BrookhavenNational Laboratory, BNL-17541 (1975).
11. C. C. Baker, "The Impact of Alternate Fusion Fuels on Fusion ReactorTechnology - An Initial Assessment Study," Argonne National Laboratory,ANL/FPP/TM-128 (1979).
12. J. Jung and M. Abdou, "Importance of Shield Design in MinimizingRadioactive Material Inventory in Tokamaks," to be published in theProc. of the 4th ANS Topical Meeting on the Technology of ControlledNuclear Fusion (October, 1980).
3-35

13. C. C. Baker, et al., "STARFIRE - A Commercial Tokamak Fusion PowerPlant Study," Argonne National Laboratory, ANL/FPP-80-1 (1980).
14. "Kobe Steel's Non-magnetic Steel Plate NONMAGNE-30," No. A-78B20,Kobe Steel, Ltd., Kakogawa Works, Japan (1979).
15. C. M. Lederer and V. S. Shirley, eds., Table of Isotopes, 7th ed.,John Wiley and Sons, Inc., New York (1978).
16. F. S. L. Hsu and J. E. Kunzler, "Magnetoresistance Probe for MeasuringMagnetic Field Intensity in a Small Space," Rev. Soi. Instr. 34,297 (1963).
17. E. S. Fisher, et al., "Effects of Cyclic Strains on Transport Propertiesof a Superconducting Composite: Phase 1, Degradation of ElectricalConductivity in Copper at 4.2°C," Argonne National Laboratory,ANL-77-50 (1977).
18. B. S. Brown, et al., "Low-Temperature Fast-Neutron Radiation DamageStudies in Superconducting Materials," J. Nuol. Mater. _52, 215 (1974).
19. M. A. Abdou, "Radiation Considerations for Superconducting FusionMagnets," Argonne National Laboratory, ANL/FPP/TM-92 (1977).
20. D. M. Parkin and A. R. Sweedler, "Neutron Irradiation of Nb3Sn and NbTiMultifilamentary Composites," IEEE Transactions on Magnetics,MAG-11, No. 2, p. 166 (1974).
21. M. Soell, "The Influence of Low Temperature Neutron Irradiation on theProperties of Hard Superconductors," Proc. of the 8th Symposium onFusion Technology, The Netherlands, p. 965 (1974).
22. H. Ullmair, "Radiation Damage in CTR Magnet Component," Proc. of theInternational Conf. on Radiation Effects and Tritium Technology forFusion Reactors, CONF-750989, Vol.-II, Tennessee, p. 11-403 (1975).
23. J. L. Morning, et al., "Chromium: Mineral Commodity Profiles MCP-10,"the Bureau of Mines, U.S. Department of the Interior (1978).
24. B. Petkof, "Beryllium: Mineral Commodity Profiles," the Bureau of Mines,U.S. Department of the Interior (1978).
25. D. L. Smith, et al., "Fusion Reactor Blanket/Shield Design Study," ArgonneNational Laboratory, ANL/FPP-79-1 (1979).
26. R. E, Gold, et al», "Technical Assessment of Vanadium-Base Alloys forFusion Reactor Applications," Vol. 2, COO-4540-1 (1978).
27. L. H. Rovner, "Fusion Reactor Studies: Potential for Low-Z Materialson the First Wall," Electric Power Research Institute, EPRI 115-2 (1975).
28. Y. S. Touloukian, ed., Thermophysical Properties of High Temperature SolidMaterials, MacMillian Company, New York (1976).
3-36

29. Engineering Properties of Selected Ceramics, Vol. 1, Nitrides, BattelleColumbus Laboratories, MCIL-HB-07 (1976).
30. R. J. Price, J. Nual. Mater. J13, 17 (1969).
31. R. B. Mathews, J. Nual. Mater. 51, 203 (1974).
32. W. M. Stacey, Jr., et al,, "Tokamak Experimental Power Reactor ConceptualDesign," Argonne National Laboratory, ANL/CTR-76-3 (1976).
33. D. L. Smith, J. Nual. Mater. 21. 20 (1978).
34. D. L. Smith, Proc. Workshop on Sputtering Caused by Plasma SurfaceInteractions, CONF-79-07-75 (1979).
35. J. Roth, et al., "Data on Low Energy Light Ion Sputtering," Max-PlanckInstitut fur Plasmaphysik, IPP 9/26 (1979).
36. C. Boley, private communication.
37. D. Corson and P. Lovain, Introduction to Electromagnetic Fields andWaves, W. H. Freeman and Co., San Francisco (1962).
38. D. L. Smith and I. Charak, "Thermal Responses of Tokamak First-WallDuring Cyclic 'lasma Burns," Proc. 7th Symposoium on Engineering Prob-lems of Fusion Research, Knoxville, IEE Publication No. 77CH1267-4-NPSp. 1465 (1977).
39. J. A. Fillo, "First Wall Thermal Hydraulic Models for Fusion Blankets,"ASME Paper No. 80-HT-51 (1980).
40. R. J. Onega, W. R. Becraft and E. A. Kukeilka, "The Thermal Consequencesto the First Wall of a Deuterium-Tritium-Fueled Tokamak due to a MajorPlasma Disruption," Nual. Eng. Design, 25, 243-257 (1980).
41. L. L. Leobel and W. G. Wolfer, "Evaporation Under Intense Energy De-position," University of Wisconsin, UWFDM-370, (1980).
3-37

3-3S

4.0 Magnet Design Studies
The magnets for a D-D tokamak reactor will likely be larger in size and
of a higher magnetic field than those of a D-T reactor. Thus their design
is, in general, an extrapolation beyond the magnets of D-T reactor design
studies. It should be noted that the magnets of a D-T design are themselves
an extrapolation from existing superconducting magnets. However, with the
successful completion of the Large Coil Project and the 12 Tesla Coil Develop-
ment Program and with the testing of the magnets for the Fusion Engineering
Device or a similar facility, the extrapolation of toroidal field coils to
a D-T reactor or beyond to a D-D reactor will be put on a firm footing. On
the other hand, as pointed out by the INTOR study, ' the status of the world
program for the development of fast-pulsed superconducting coils, such as the
ohmic heating (OH) coils and equilibrium field (EF) coils, is less adequate.
4.1 Ohmic Heating Coil System
The OH coil system, perhaps more properly called the current induction
coil system, induces and maintains the plasma current. If noninductive plasma
current drive concepts are developed, then the requirements on the OH system
can be significantly reduced. During the first phase of this D-D reactor
study, both pulsed operation and steady-state current drive operation have
been considered. The rest of this section describes the requirements for an
OH coil system for pulsed operation without noninductive current drive.
The OH coil system consists of a central solenoid and several other
circular coils, all located outside the toroidal field (TF) coils. The total
flux swing required of the OH coil system is determined from the required
inductive volt seconds, the required resistive volt seconds, and the contri-
bution of the EF coil system. The flux swing is given by the product of the
effective area within the solenoid and the average field swing, AB-U, in theOn
solenoid. The area within the solenoid, 33 m2, permits a flux swing of500 V-s for the reference design with a field swing, AB_U = 15.2 T, which is
Un
achievable with a field reversal from -7.6 to +7.6 T. Such fields probably
are achievable with cabled conductors made of NbTi and copper.
The OH coils are located outside the TF coil system so that the winding
can be arranged to minimize the ac superconducting field on the TF coil. Since
the OH coil is at full negative value before the onset of plasma startup, the
4-1

OH coil windings must also be distributed so that the field produced by the
OH coils in the plasma is less than 10 G or so. This requirement must be
fulfilled in order to guarantee a stable startup. Considerations for coil
locations are similar to those of the ANL experimental power reactor (EFR)(2 3)
designs. ' The system consists of a central solenoid (//I), three coils out-
ward and upward from the top of the solenoid (#2, #3, #4), a coil above the top
of the TF coils (#5), and a coil outboard of the TF coils (#6), plus similar
coils below the midplane of the reactor. The solenoid supplies the required
flux change linked by the plasma, and the other coils cancel any field in
the plasma region due to the solenoid. In particular, coils #2, #3, and #4
reduce the large field gradient at the inner side of the plasma from the
solenoid alone; coil #5 cancels the linear field gradient from the solenoid
across the plasma; and coil #6 cancels the nearly uniform field across the
plasma due to the other coils. An approximate method of determining the
OH coil locations and currents is described in Appendix H of Ref. 4. The
coil locations and currents found from the approximate method have been found
to provide zero field throughout the plasma within an RMS error of 2 x 10"1*
relative to the EF field.
The locations of the coil centerlines and the individual coil currents
are listed in Table 4-1. The coils are also shown in the cross-sectional
view in Fig. 2-5. The stored energy in the OH system is a maximum of 20 GJ.
Table 4-1. OH Coil Locations and Currents
Coil #
1
2
3
4
5
6
Radial Position(m)
3.23
3.73
4.23
4.73
8.05
16.23
Axial Position(m)
+ 4.25
± 8.65
± 8.95
± 9.25
£L0.08
+ 5.33
*Current(MAT)
- 58.48
- 3.44
- 3.44
- 3.44
- 4.27
- 1.54
The sign is relative to the plasma current.
4-2

Coil #1, the central solenoid, has a thickness of 0.5 m (extending from
2.98 m to 3.48 m) and a .half-height of 8.5 m. The other coils are sized
to have a current density of 18 MA/m2.
4.2 Equilibrium Field Coil System
The EF coils provide the bulk of the equilibrium field necessary to keep
the plasma positioned in the vacuum chamber with the desired cross-sectional
shape and pressure and current distributions. These coils are outside of
the TF coils in order to ease the assembly, maintenance, and reliability
of the coils, even though this means larger coil currents and stored ̂ .iergy.
The required equilibrium field can be determined from the MHD calcu-
lations discussed in Sees. 2.1 and 2.2.1. (This required field is the
total field of the equilibrium minus the field of the plasma current alone.)
The EF coils must produce this required field to a reasonable level of
accuracy. In order to do this a tentative set of EF coil locations is
chosen and the currents in the coils are calculated so as to make a least
squares fit to the external field calculated from the MHD equilibrium.
The energy of the EF system is simultaneously minimized to the extent that
the error of the least squares fit does not exceed an RMS value of 3 x 10"1*.
(This value has been found from experience to adequately reproduce the
equilibrium and the plasma boundary shape.) The method is described in
detail in Ref. 5. The coil locations can then be chosen to be those which
have the lowest stored energy for the given accuracy of fit, subject to any
engineering restrictions on the coil placement. The method can be further
constrained to determine currents such that the EF and the OH systems are
decoupled; that is, the mutual inductance, M.,,, „, is negligibly small. Thefir— Un.
EF and OH coils are approximately 1 m from the TF coils in order to reduce
eddy current losses and stray fields which would effectively lower the
usable peak field in the TF coils and to reduce out-of-plane forces.
The OH system provides 500 V-s to the plasma, and the EF system provides
an additional 195 V-s. The inductive flux necessary to induce the plasma
current for the reference design is 500 V-s, leaving 195 V-s to maintain
the plasma current against resistive losses. The EF system has a maximum
stored energy of 22 GJ with 67 MAT total current. The EF coil locations
and currents are shown in Table 4-2.
4-3

Table 4-2. EF Coil Locations and Currents
Coil #
1
2 .
3
4
Radial Position(m)
4.20
4.80
15.09
16.66
Vertical Position(m)
± 8.00
± 8.60
± 5.79
± 2.04
*Current(MAT)
10.85
6.42
-7.47
-8.67
The sign is relative to the plasma current.
4.3 Toroidal Field Coil System
The primary differences between the TF coils for a D-D tokamak reactor
and those for a D-T tokamak reactor are the larger size and higher field
typically required for the D-D reactor. These in turn make conductor design
and support more difficult than for a D-T reactor. Parameters for the TF
coils for the reference design appear in Table 4-3.
Table 4-3. Parameters for TF Magnets
Number of coils
Total ampere turns
Total stored energy
Total inductance
Peak field:
designoperational
Current
Average conductor current
12
360 MA-turns
250 GJ
490 H
15 T14 T
32 kA
3000 A/cm2
density
Ay •':ige overall currentdensity
Coil cooling
Conductor:
superconductorstabilizerconfiguration
Structural material
850 A/cm2
Liquid He Bath, 4.2 K
Nb3Sn, NbTiCopperCable
Austenitic SS
4-4

The cross section of an inner leg of a TF coil is shown in Fig. 4-1. Each
coil contains 940 pancake wound turns.
4.3.1 Choice of Peak Toroidal Field
Since the reactor thermal power is proportional to the fourth power of
the toroidal field, a high field is desirable. However, increasing the field
causes an increase in the cost and size of the TF coils, and especially an
increase in the amount of support material required. In particular, the
coil thickness increases rapidly with field, leading either to an unacceptable
shrinking of the area within the OH solenoid or to an increase in the plasma
major radius with a consequent increase in the overall size of the reactor.
A study of the effect of varying the toroidal field was carried out using
the ANL TF coil model. ' The values of several TF coil system parameters
for fields of 14 T, 15 T, and 16 T are shown in Table 4-4. In each case,
a major radius of 9.0 m and aspect ratio of 3.0 were assumed. The values(A)
predicted for the STARFIRE D-T reactor study (which are in good agreement
with those actually adopted for the STARFIRE TF coils system ) also appear
in Table 4-4 for comparison.
-VACUUM TANK• LIQUID NITROGEN SHIELD
•HELIUM VESSEL
•COIL (60 TURNS/FULL LAYER)30 TURNS
Figure 4-1. Cross section of TF coil.
4-5

Table 4-4. Comparison of TF Coil Parameters for DifferentPeak Field Values, as Predicted by the TF CoilModel
Parameter
Design Peak Field (T)
Coil Thickness (m)
Stored Energy (GJ)
Copper Stabilizer(103 metric ton)
Stainless Steel SupportMaterial (103 metricton)
STARFIRE
11
0.91
62
2.05
1.59
14 T
141.48
205
4.57
5.06
15 T
15
1.70
249
5.15
5.94
16 T
161.94
301
5.79
6.92
OH Flux Swing with 266 267 177 91AB0H = 16 T (V-s)
The choice of operational peak was made based on considerations of the
advantages of high field vs. the accompanying disadvantage of large size and
cost. The toroidal coils have been designed for a maximum field of 15 T
with operation expected to be at 14 T.
4.3.2 Conductor
A three level, unsoldered, uninsulated "Rutherford" .cable has been
chosen as the-conductor. Four grades of conductor, two employing Nb3Sn
(11-15 T and 8-11 T) and two employing NbTi (5-8 T and 0-5 T) are envisioned.
However, no attempt has been made to optimize the grading; a different
grading scheme, perhaps employing six grades, might result in considerable
savings of space and material.
From dimensional considerations, the Nb3Sn cable was chosen to consist
of sixteen 2000 A cables, and the NbTi cable was chosen to consist of twenty
1600 A cables. Each cable consists of six subcables surrounding a central
copper subcable.
4-6

In the highest field grade (11-15 T) cable, each subcable consists of
six Nb3Sn-Cu composite strands about a Cu strand (see Fig. 4-2). In the
other Nb3Sn cable, only three of the substrands are composite. The 5-8 T
grade cable also has three composite substrands, in this case NbTi-Cu
composite. The low-field grade (0-5 T) cable has six Cu strands about
a NbTi-Cu composite strand (see Fig. 4-3).
A cabled design was chocen to simplify conductor fabrication, to minimize
ac losses from the poloidal field system and/or plasma disruptions, to maxi-
mize wetted perimeter for cryostability, and to minimize longitudinal strain
in the Nb3Sn composite. The Nb3Sn is reacted after conductor cabling but
before coil fabrication.
This design is extrapolated from the conductor design for the STARFIRE(8)
reactor study, which in turn is related to the GA/MCA design for the ETF(9)
(Engineering Test Facility) 12 T coil development program. The GE/IGC
conductor design, which also consists of Nb3Sn-Cu cables individually
housed in a stainless steel support structure with graded radial support,
might also be extrapolated to 14 T operation.
3.12
0.60
2000 AMP CABLE
t-0.60
© = NbjSN COMPOSITE STRANO: 0.14 DIAMETER
O = COPPER STRAND: 0.14 OIAMETER
' _ SUBCABLE: 0.378 OIAMETER' "• 10 % COMPACTEO '
ALL DIMENSIONS IN cm
Figure 4-2. High field grade (11-15 T) conductor and support.
4-7

2.52 4\ Q.Q25
1.71
-9.74 •
-6.32-
\\\\\\\\\m1.71
G-10 INSULATION 0.05 —
r0.60
JT"*-0.60
ALL DIMENSIONS IN cm
© = NbTi COMPOSITE STRAND:0.0B5 DIAMETER
O = COPPER STRAND:0.085 DIAMETER
!= SUBCABlE: 0.231 DIAMETER10% COMPACTED
Figure 4-3. Low field grade (0-5 T) conductor and support.
4.3.3 Conductor Support
In a cable conductor design, the copper stabilizer contributes very
little to supporting the hoop stress arising from the magnetic forces the
TF coi.l system exerts upon itself. Moreover, in the region of the inner
leg, the cable should not have to support the radial forces, lest the cable
be compressed and the surface contact with helium coolant be reduced. Conse-
quently, the conductor is surrounded by a support frame made of stainless
steel strips, which carry almost all the hoop and radial forces generated
in the coil. This support frame appears in Figs. 4-2 and 4-3. It is de-
signed for a combined stress of 550 MN/m2 (80,000 psi).
In the curved portion of the coil each support frame generally carries
the tension of its conductor, and radial loads are low. In the straight
inner leg poicion the radial force accumulates radially inward, away from
the plasma region. Thus, the radial lead is largest and the most stainless
steel support material is needed in the turns where the toroidal field is
lowest and where the least copper stabilizer and superconductor are needed.
4-8
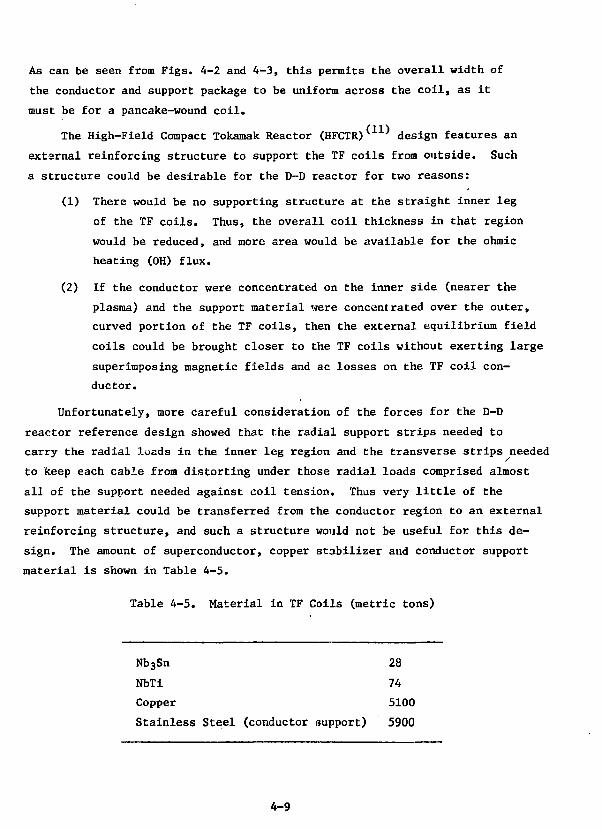
As can be seen from Figs. 4-2 and 4-3, this permits the overall width of
the conductor and support package to be uniform across the coil, as it
must be for a pancake-wound coil.
The High-Field Compact Tokamak Reactor (HFCTR) design features an
external reinforcing structure to support the TF coils from outside. Such
a structure could be desirable for the D-D reactor for two reasons:
(1) There would be no supporting structure at the straight inner leg
of the TF coils. Thus, the overall coil thickness in that region
would be reduced, and more area would be available for the ohmic
heating (OH) flux.
(2) If the conductor were concentrated on the inner side (nearer the
plasma) and the support material were concentrated over the outer,
curved portion of the TF coils, then the external equilibrium field
coils could be brought closer to the TF coils without exerting large
superimposing magnetic fields and ac losses on the TF coil con-
ductor.
Unfortunately, more careful consideration of the forces for the D-D
reactor reference design showed that the radial support strips needed to
carry the radial loads in the inner leg region and the transverse strips needed
to keep each cable from distorting under those radial loads comprised almost
all of the support needed against coil tension. Thus very little of the
support material could be transferred from the conductor region to an external
reinforcing structure, and such a structure would not be useful for this de-
sign. The amount of superconductor, copper stabilizer and conductor support
material is shown in Table 4-5.
Table 4-5. Material in TF Coils (metric tons)
Nb3Sn
NbTi
Copper
Stainless Steel (conductor support)
28
74
5100
5900
4-9

4.3.4 Cooling
The TF coils are bath cooled by liquid helium at 4.2 K. Passages through
the insulation between the cable and the support frame, through the support
frame itself, and through the insulation between the support frames of
neighboring turns and neighboring pancakes, permit the free passage of
liquid helium and helium vapor.
References
1. INTOR Group, "International Tokamak Reactor," Nual. Fusion 20_,349-388 (1980).
2. L. R. Turner, S. T. Wang, J. R. Purcell, "Superconducting Ohmic-HeatingCoils for the Argonne TEPR Design Study," Proc. 6th Symposium onEngineering Problems of Fusion Research, San Diego, pp. 1089-1092,(1975).
3. L. R. Turner, S. T. Wang, S. H. Kim, Y. C. Huang, and R. P. Smith,"Superconducting Magnet Systems for the ANL EPR Design," Proc. 7thSymposium on Engineering Problems of Fusion Research, Knoxville,pp. 746-750 (1977).
4. C. C. Baker, et al., "STARFIRE - Commercial Tokamak Fusion Power PlantStudy," Argonne National Laboratory, ANL/FPP-80-1 (1980).
5. K. Evans, Jr., D. A. Ehst, and P. Messerschmidt, "Equilibrium Field CoilConsiderations for Tokamak Reactors," Proc. 3rd Topical Meeting on theTechnology of Controlled Nuclear Fusion, ANS Pub. No. CONF-780508, Vol. 2,p. 1084 (1978).
6. L. R. Turner and M. A. Abdou, "Computational Model for SuperconductingToroidal-Field Magnets for a Tokamak Reactor," Proc. 7th Symposiumon Engineering Problems of Fusion Research, Knoxville, pp. 762-766(1977).
7. L. R. Turner and M. A. Abdou, "Computational Model for SuperconductingToroidal-Field Magnets for a Tokamak Reactor," Argonne NationalLaboratory, ANL/FPP/TM-88 (1977).
8. J. S. Alcorn, L. R. Turner, and S. T. Wang, "Superconducting ToroidalField Coil System for STARFIRE," Fourth ANS Topical Meeting on theTechnology of Controlled Nuclear Fusion. King of Prussia, Pennsylvania(1980).
9. J. S. Alcorn, J. R. Purcell, W. Y. Chen, Y-H. Hsu, "Status of theGA/MCA 12 Tesla Coil Development Program," 1980 Applied SuperconductivityConference, Santa Fe, New Mexico (1980).
10. J. P. Heinrich, et al., "Scoping Study of a 12 T Toroidal Field Coilfor the Fusion Engineering Test Facility," ibid.
4-10

11. D. R. Cohn, et al., "High Field Compact Tokamak Reactor (HFCTR) Conceptual
Design," MIT Plasma Fusion Center, RR-78-2 (1978).
4-11


5.0 Tritium/Fuel/Vacuum Considerations for the D-D Design
A catalyzed D-D reactoi burns large quantities of tritium and 3He, both
of which are produced in the plasma by D-D fusion reactions. The tritium
exhaust handled by the impurity control system is reduced from that in a D-T
reactor, but tritium reprocessing systems are still necessary to purify and
recycle the tritium exhaust. Tritium breeding and associated processing
systems are not used in the D-D reactor. The general tritium handling
philosophy presented in the STARFIRE D-T design is applicable for the D-D
design and is necessary in order to ensure both worker and public safety.
The impurity control system for the LHD design handles a somewhat larger
gas load than does a typical D-T reactor; therefore, the vacuum system has
to be appropriately larger. In addition, reprocessing systems have to be pro-
vided- which purify and isotopically enrich the deuterium and the reinjected
% e and remove the protium and **He.
The fuel handling and reprocessing systems for the D-D design are pre-
sented and compared to those in the STARFIRE D-T design. Both designs use
a limiter/vacuum system for impurity control, utilizing a high recycling of
the deuterium and tritium with a consequently high fractional burnup.
5.1 Fuel Cycle
A schematic of the fuel reprocessing cycle for the D-D reactor is shown
in Fig. 5-1. The exhaust from the plasma is removed with compound cryopumps
which are part of the limlter/vacuum system. Upon regeneration of the vacuum
pumps, the fuel is processed for chemical purification, isotopic enrichment,
storage, and refueling. The chemical purification subsystem is designed to
remove all condensible impurities (CD , D20, N2, etc.). The helium is
separated from the D2 fuel by a falling film condenser, after which the(1-3}
helium is isotopically enriched by means of cryogenic distillation.
Separation factors for helium are reportedly higher than those for the(4)
cryogenic distillation of hydrogen isotopes. The hydrogen isotopes are
separated by means of cryogenic distillation at » 20 K. The protium waste
stream is primarily HD; the fuel stream can consist of D2/D-T or separate
D2, T2 streams depending on fueling requirements. The components of the fuel
reprocessing cycle are quite similar to those in a D-T fuel processing cycle
(Fig. 5-2) with the additional feature of isotopic enrichment of helium.
5-1

/beams SE\
IDIST
1.6 K
'He
(yVaste Pr)
WastePr)HP I
ST
2 S K
sTOR
STOR
Figure 5-1. Fuel processing cycle for catalyzed D-D.
5-2
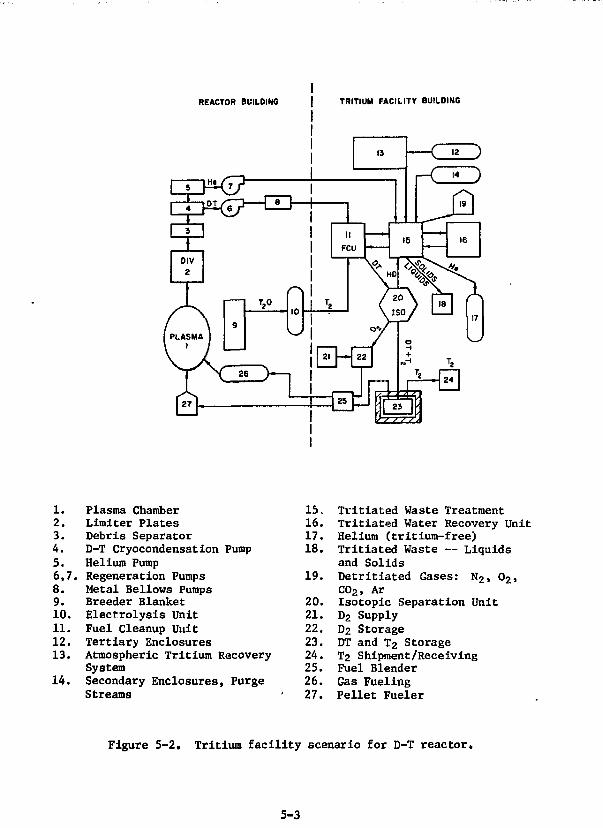
REACTOR BUILDING TRITIUM FACILITY BUILDING
1.2.3.4.5.6,7.8.9.10.11.12.13.
14.
Plasma ChamberLimiter PlatesDebris SeparatorD-T Cryocondensation PumpHelium PumpRegeneration PumpsMetal Bellows PumpsBreeder BlanketElectrolysis UnitFuel Cleanup UnitTertiary EnclosuresAtmospheric Tritium RecoverySystemSecondary Enclosures, PurgeStreams
15.16.17.18.
19.
20.21.22.23.24.25.26.27.
Tritiated Waste TreatmentTritiated Water Recovery UnitHelium (tritium-free)Tritiated Waste ~ Liquidsand SolidsDetritiated Gases: N2, 02,CO2, ArIsotopic Separation UnitD2 SupplyD2 StorageDT and T2 StorageT2 Shipment/ReceivingFuel BlenderGas FuelingPellet Fueler
Figure 5-2. Tritium facility scenario for D-T reactor.
5-3

Mass flow rates in the fuel reprocessing cycle have been determined for
both the reference D-D and the STARFIRE D-T design. They are presented in
Table 5-1. For the D-D system the fractional burnup for deuterium is 0.17;
for tritium it is 0.87. Each day 2.4 kg of deuterium, 1.0 kg of 3He, 0.3 kg of
"*He, 80 g of protium, and 17 g of tritium are exhausted. In addition, 2.9 kg of
deuterium, 1.0 kg of 3H«, and 17 g of tritium are injected into the plasma by
the fueling system.
5.2 Fuel Reprocessing, Fuel Supply, and Tritium Safety
Tritium inventories, shown in Table 5-2, are determined on the basis
of the mass flow rates shown in Table 5-1. The "vulnerable" inventory is that
portion of the tritium which is located in the reactor building. Tritium
physically located in the separate fuel reprocessing building or in the
Table 5-1. Fuel System Parameters for the Cat-D-D Reactor andthe STARFIRE D-T Reactor
Plant and Plasma Parameters
Power (MW)Plant AvailabilityIon Density (1020 ions/m3)Plasma Volume (m3)Evacuation Volume (m3)Surface Area (m2)Particle Confinement Time (s)Reflection CoefficientFractional Burnup (Deuterium)Fractional Burnup (Tritium)
Mass Flow Parameters (g)
Deuterium Burned Per DayDeuterium Exhausted Per DayDeuterium Fueled Per Day
Protium Exhausted Per Day
He-4 Exhausted Per Day
He-3 Burned Per DayHe-3 Exhausted Per DayHe-3 Fueled Per Day
Tritium Burned Per DayTritium Exhausted Per DayTritium Fueled Per DayTritium Bred Per Day
D-D
27000.751.661850399012503.70.90.170.87
48223902872
79
319
125994994
1011717——•-
D-T
40000.750.87839507551.80.90.420.42
360506866
10
712
—__
5367601296562
5-4

Table 5-2. Tritium Inventory (g) for the D-D Reactorand the STARFIRE D-T Reactor
!"Vulnerable" Tritium Inventory
Vacuum Pump
Fuelers
Blanket Processing
TOTAL
"Non-Vulnerable" Tritium Inventory
Breeder Blanket
Storage
Fuel Processing
TOTAL
D-D
2
2
A
34
17
51
D-T
63
54
281
398
* 10,000
1,071
154
11,225
storage area has a much lower potential for release to the environment.
For the D-D system, two days of tritium fueling (34 g) is assumed to be in
storage: for the STARFIRE D-T system, two days of tritium burnup
(1.1 kg) is in storage. The "non-vulnerable" inventory for the D-D system
is approximately two orders of magnitude smaller than that for the D-T
reactor. The tritium inventory classified as "vulnerable" is also two
orders of magnitude smaller than that for the D-T reactor, but since one
gram of tritium is equivalent to 9600 Curies, it still represents an important
safety concern.
In the D-D design, as in the STARFIRE design, the goal is to contain
all tritium releases whether due to normal leakage or to accidental releases
within the confines of the plant. To accomplish this, the following safe-
guards, similar to those used in STARFIRE, are utilized. The outer walls
of all potential tritium containing areas are lined with a tritium barrier
(stainless steel or aluminum). The materials and equipment used in a tritium
area are selected to minimize surface adsorption. Tritium areas are operated
at reduced atmospheric pressure to minimize tritium out-leakage. The atmos-
pheric tritiated water (HTO) level in all areas is maintained at < 5 uCi/m3.
5-5
Tritium systems utilize triple containment where reasonable and practical;
double containment is used throughout. The number and length of lines
used to transport tritium between different buildings are minimized. Multiple,
discrete flow paths between units are used to partition the tritium inventory
and thus reduce the magnitude of a tritium release. The tritium waste generated
is minimized by (1) processing tritiated water, (2) minimizing use of organics,
(3) minimizing the contamination of organics where they are functionally
necessary, (4) using all metal seals in valves, pumps, etc., and (5) repro-
cessing tritiated waste. Any waste generated within the plant is packaged
in as small a volume as possible. The impact of a tritium release from the
coolant system is minimized by: (1) maintaining the tritium inventory in
the coolant at levels below 1 Ci/&; (2) minimizing leaks in the primary
coolant system; and (3) recovering all tritiated water. Timely decontamina-
tion of potential tritium spills within the containment is provided by: (1)
dedicating an appropriately sized atmospheric tritium recovery unit (ATR) to
each tritium containing area; and (2) interfacing the heating, ventilating,
and air conditioning systems with the ATR systems to prevent a tritium release
to the outside environment:.
Fuel reprocessing and storage are handled in a separate building from
the reactor building. This building, designed for contact maintenance, has
an air environment and is free of gamma and neutron radiation. All units are
under remote, independent computer control; the computer is equipped with an
uninterruptible power supply to ensure that all systems can be shut-down in
the event of a power failure. All processing units are of modular design to
facilitate replacement. Multiple units are provided and full redundancy is
built into the fuel reprocessing facility to ensure maximum reliability and
availability. The tritium storage area is sited in the fuel reprocessing
building. It consists of a shielded area in which an inert cover gas is used
for fire protection. Because of the small amount of stored tritium (34 g),
low-pressure gaseous storage in tanks is provided.
The deuterium required for two days fueling (6 kg) is stored in the fuel
reprocessing building. No resource problems are foreseen.
5-6

A kilogram of 3He ii» required for Initial startup. In addition, a
two day fuel supply (2 kg) is stored in the fuel reprocessing building to
insure plant operation in the event of a failure in the fuel reprocessing
systems. The cost of producing 3He and its availability are the main reasons
for recovering it in the fuel reprocessing system. Potential available U.S.
resources of 3He are estimated at 200-500 kg. If the 3He were not recycled,
the D-D reference design would consume the U.S. resources in one year. The
amount of 3He consumed could be lowered by re-design (see Sec. 2.2.7) but
would still amount to a large fraction of the available resources.
5.3 Vacuum System Analysis
The total gas load for the D-D system is 44.4 Pa m3/s which is 2.4 times
that of the STARFIRE ' design. As a first approximation, the sizes of the
limiter duct, and the plenum region of the D-D design (see Fig. 2-5), are
assumed to be approximately the same as in the STARFIRE design. As shown for
the STARFIRE llmiter/vacuum system, the major impedance in the vacuum design
is in the 24 vacuum ducts. Their impedance is twice that of the rest of the
vacuum system (limiter duct, plenum, vacuum pumps). The vacuum system for
the D-D reactor is designed so that the steady-state pressure in the limiter
slot is the same as that in the D-T design. To accomplish this, the vacuum
ducts are both decreased in length and increased in diameter to increase the
pumping speed at the limiter. The cryopanel surface area in each cryopump
has to be increased by a factor of 2.4 to handle the increased helium gas
load. The vacuum system parameters for the D-D system are presented in
Table 5-3 as are those for the STARFIRE D-T design.
5.4 Conclusions
The tritium handlings fuel reprocessing, and vacuum pumping require-
ments for the Cat-D-D reactor fuel system can be compared to the STARFIRE
D-T reactor systems. The significant conclusions are:
1. Fuel reprocessing for both are generally similar and present no
major technological difficulties.
5-7

Table 5-3. Vacuum System Parameters for the D-D Reactorand the STARFIRE D-T Reactor
Fractional Burnup (deuterium)Gas Load (Pa m3/s)Pressure in Limiter Slot (Pa)Hydrogen Pressure in LimiterSlot (Pa)
Helium Pressure in LimiterSlot (Pa)
Limiter Pumping Speed (m3/s)Limiter Helium Speed (m3/s)Vacuum Pumps (on line/total)Rated Helium Speed/Pump (m3/s)Rated D-T Speed/Pump (m3/s)Regeneration Time (hr)Limiter Duct Conductance (m3/s)Plenum Conductance (m3/s)Vacuum Duct Conductance (m3/s)Number of DuctsDuct Diameter (m)Effective Duct Length (m)Tritium Inventory/Pump (g)
D-D
0.1744.40.040.024
0.016
1110111024/48120200
2*4090*137003830241.22
0.08
D-T
0.4218.70.040.024
0.016
48049024/481202002
409013700730241102.6
The assumption is made that the conductances of thecomponents of the D-D limiter/vacuum system are equiva-lent to those of the STARFIRE D-T design.
The "vulnerable" tritium inventory is reduced by two orders of
magnitud 'a the D-D system as compared to the STARFIRE D-T design.
This reduces the risk associated with a tritium release.
Although the risk is reduced, all of the tritium safety systems
required in the D-T design are also required in the D-D design
to ensure worker and public safety.
5-8

4. Total tritium and fuel reprocessing costs for a D-D fusion
reactor are approximately the same as for a D-T reactor. Vacuum
pumping requirements are somewhat higher.
5. Since 3He availability is limited, fuel reprocessing of this fuel
is required.
6. The exhaust from the plasma can be adequately handled by a limiter/
vacuum design using compound cryopumps.
References
1. C. C. Baker, et al., "STARFIRE - Commercial Tokamak Fusion Power PlantStudy," Argonne National Laboratory, ANL/FPP-80-1 (1980).
2. W. R. Wilkes, "Distillation of He Isotopes," Proc, of ICEC-4, Eindhoven,1972, IPC Science and Technology Press, p. 119-121 (1972).
3. W. R. Wilkes, '^He-^He Distillation Apparatus," Mound Laboratory,MLM-2005, p. 15 (March, 1973).
4. T. Ben Rhinehammer and Layton J. Wittenberg, "An Evaluation of the FuelResources and Requirements for the Magnetic Fusion Energy Program,"Mound Laboratory, MLM-2419, p. 102 (October, 1978).
o
5. W. R. Wilkes, Mound Laboratory, private communication.
5-9

5-10

6.0 Summary and Conclusions
This report has presented the results of studies leading up to an
initial design of a tokamak fusion reactor operating on a D-D fuel cycle.
The approach has been to make as much use as possible of the beneficial
features of a D-D fuel cycle, but not to extrapolate unnecessarily from ex-
tensively studied, D-T reactor designs, in particular the STARFIRE commercial
reactor design. In this way a fair comparison of the advantages and penalties
of a D-D reactor relative to a D-T reactor can be made.
The present report only deals with the studies that have led to a choice
of a D-D reactor configuration and some of the initial studies of this refer-
ence design. A complete analysis of the reference design and a complete
comparison with a D-T reactor will be presented in a future report. For this
reason some of the conclusions that are presented here are tentative, but
sufficient study has been made to put most of them on a relatively firm basis.
6.1 General Features
The choice of the tokamak configuration has been made for essentially
the same reasons as it usually is made for a D-T device; that is, the tokamak
is closer to reactor viability than any other concept, and it has been
studied more than ;.ny other concept. The D-D device is very similar to a D-T
device: Approximately half of the neutrons produced are 14 HeV neutrons
from the D-T reaction, and most of the energy comes from these D-T neutrons.
It is in fact largely a D-T reactor operated without tritium fueling.
The principal advantages of the D-D reactor arise from the lack of
necessity to breed tritium. This feature makes the use of lithium and
lithium compounds unnecessary. In addition the blanket/shield can be
optimized for reactor power performance rather than for tritium breeding.
In particular the inboard section can be made thinner, leading to better
utilization of the toroidal magnetic field, and increased neutron energy
multiplication can be achieved, leading to a greater power output. The
tritium levels in a D-D reactor appear to be as much as two orders of mag-
nitude less than in a comparable D-T reactor. However, there is still
sufficient tritium that it is not possible to eliminate any major components
of a D-T reactor if worker and public safety is to be assured.
The principal disadvantage of a D-D reactor is that the power pro-
duction is less, than 5% of that of a tritiua-fueled reactor for the same
6-1

beta, toroidal field, and physical size. As a consequence, a D-D reactor must
necessarily be substantially larger and/or operate at substantially higher
fields or higher plasma betas than a D-T reactor of comparable thermal power.
The design of larger devices and higher-field magnets is of course more
difficult. Moreover, since the auxilliary systems, such as plasma heating,
current drive, magnet power supplies, and vacuum pumping are then typically
larger, the parasitic power losses represent a larger fraction of the thermal
power resulting in lower efficiency and even further reduced net electric
power. It is also possible that the larger energy stored in the plasma may
be a more serious problem in the event of a plasma disruption.
A second disadvantage is that a D-D reactor must likely operate at
higher temperatures (25 - 30 keV compared to 8 - 10 keV for a typical D-T
system). Cyclotron and bremsstrahlung radiation losses both increase with
temperature. It is not known if diffusion losses increase or decrease with
temperature in these temperature ranges, but there are models such as ripple
diffusion and trapped particle modes which show losses increasing strongly
with temperature. These factors affect the achievement of ignition. Using
the assumptions made in the present study, ignition in a D-D reactor appears
to require an order of magnitude larger confinement parameter, nx, and an
order of magnitude fewer impurities compared to a D-T reactor.
A third feature of a D-D reactor is that a larger fraction of the power
coming out of the plasma is in the form of heat (charged particles or radia-
tion) rather than neutrons. If neutron damage of the first-wall/blanket/
shield system were the limiting factor, this would be an advantage. For the
type of design considered in this report (and for STARFIRE), howe/er, the
heat load is the limiting factor, and this becomes a disadvantage for a D-D
reactor. STARFIRE, for example, supports a total wall load of 3.6 MW/m2
with a heat load of 0.9 MW/m2, while the pulsed version of the reference D-D
design is limited to 1.5 MW/m2 with a heat load of 0.8 MW/m2.
It is especially difficult to overcome the disadvantage of lower power
production, and it would seem that D-D reactors would not be built for power
production if it were possible to utilize D-T reactors. If, however, D-T
reactors (because of problems associated with tritium fueling and/or breeding
or lifetime limitations due to neutron damage effects) were not feasible, then
D-D reactors could likely be built in their place with reasonable extra-
polations of parameters considered adequate for D-T reactors.
6-2

It can be seen that the D-T reactor with full tritium fueling and the
D-D reactor with no tritium fueling (beyond that produced in the plasma) are
at opposite ends of a possible contiuum. It is conceivable that an optimum
design might have some fraction of full tritium fueling and hence be some-
where between D-D and D-T reactors as defined in this report.
6.2 Plasma Engineering Considerations
A steady-state power and particle balance model has been developed to
do parametric, design optimization, and sensitivity studies for reactors with
deuterium-based fuels. This model uses profile-averaged equations with
specified profiles and utilizes a coordinate system based on numerically
calculated magnetohydrodynamic (MHD) equilibria. The model takes account of
superthermal fusions. It has not been considered reasonable to make use of
1-0 calculations, since the diffusion coefficients cannot be considered to
be accurately known. A feature of this model in the range of interest of
D-D reactors is the appearance of more than one solution for a given set of
parameters.
Conventional MHD equilibria with relatively broad pressure profiles,
moderate elongation and D-shapedness, and safety factor values of 1.0 at
the axis and 3.0 at the limiter have been considered. The maximum credible
beta has been assumed to scale as A"1. The scaling, 3 * .36/A, has
been the standard choice.
It has been found that the maximum impurity concentration allowable for
ignition decreases approximately exponentially with the nuclear charge of the
impurity and that the allowable concentration is an order of magnitude less
than that for a D-T reactor.
The reactor performance improves with decreasing temperature until just
above the lowest temperature, typically 25-30 keV, that allows ignition.
Bremsstrahlung is the largest power loss, followed by cyclotron radiation.
The pressure must be constant on flux lives, and the stability of the
MHD equilibrium improves with broader pressure profiles. The density and
temperature have been assumed to be constant on flux lines, also. Perfor-
mance favors sharp density and broad temperature profiles, but there are
indications broad density and sharp temperature profiles are more likely. A
compromise of equally sharp density and temperature profiles has been used as
a standard case.
6-3

Cyclotron radiation has been calculated from the Trubnikov model with
a standard reflection coefficient, V - 0.9. The major effect of lower re-
flection coefficients on the performance is to raise the nT required for
ignition. Below V £ 0.4, ignition becomes very difficult.
As a standard case the particle confinement time has been taken to be
one-fourth the electron energy confinement time, and the ion energy confine-
ment time has been taken to be four times the electron energy confinement
time. In conjunction with the low particle confinement, high recycling at
the wall has been assumed. The major effect of changing the ratios of the
confinement times is to change the required confinement parameters, although
ignition is not obtained if the particles are too well confined or if the
ion energy is not confined well enough with respect to the electron energy.
The reference case has been taken to be a fully catalyzed D-D reactor;
that is, all of the tritium and 3He that diffuse out of the plasma is rein-
jected. Although the performance degrades, operation is possible if none of
the tritium is reinjected. For the reference configuration, however, at
least 95% of the 3He must be reinjected. This fraction could be lower with
relaxed assumptions on impurity content and on the cyclotron reflection co-
efficient, but it does not appear likely that significant 3He could be
diverted to run a D-^He reactor, for example.
The bulk of the design studies have kept the first-wall loading (in
particular the heat load) and the ohmic heating magnetic field swing fixed
at values that are considered to be their limits (%0-.8 MW/m2 for the heat
load for the first-wall concepts considered in this report and % 15-16 T for
the field swing). (There is no field swing limitation for a steady-state,
current-driven reactor. However, the parasitic power loss for current drive
be impractically large for a D-D reactor, and the conventional, pulsed
case has been treated more extensively for this report.) If these quantities
are kept constant, a sequence of reactors with different sizes, toroidal
fields, and aspect ratios is found. The small aspect ratios have larger
sizes, lower peak toroidal fields, larger plasma currents, and greater power
outputs.
A reference design has been chosen from such a series with the objective
of not extending any of the major parameters (size, peak toroidal field,
plasma beta, or thermal power) any more than necessary from the values used
for STARFIRE. The resulting device has an 8.6 m major radius, 14 T peak
6-4
toroidal field, 11Z beta, and 2.5 GW thenal power. (Additional parameters
are given in Table 2-10 on page 2-19.) The remainder of the studies have
been made primarily for this reference device.
The burn cycle of the reference design has been studied using a time-
dependent model with features similar to the power and particle bnlance model.
Extra tritium and 3He are injected during the startup to minimize the amount
of auxilliary heating needed, and a long startup is used to minimize the
power supply requirements.
The burn cycle consists of (1) the "ohmic heating" period (18 s) during
which the ohmic heating coils are ramped up and a small amount of auxilliary
heating is applied, (2) the "main heating period"(27 s) during which there
are 5 s of 100 MW of auxilliary heating followed by a ramp of the deuterium
density accompanied by higher-than-steady-state values of the tritium and3He densities, (3) a "steady-state" period (2.5 hr) during which a small
iodine density is maintained to insure thermal stability and enhance plasma
radiation, (4) a "shut-down" period (30 s), and (5) a "dwell" period (30 s).
The latter two periods have not yet been treated in detail.
A limiter/vacuum system similiar to that for STARFIRE has been chosen
for impurity control. The requirements for this system are fairly similiar
to those for STARFIRE except that transport power to the limiter is about
twice as much, and the total gas load is about 2.4 times as much.
Several options (lower hybrid waves, compressional Alfven waves, and
magnetosonic waves) have been investigated for steady-state current drive.
Alfven and magnetosonic waves appear to be more efficient for driving
current, but there are engineering problems such as antenna design that need
to be resolved. Further study is needed to define a system with sufficiently
low parasitic power to be viable for a D-D reactor.
6.3 First Wall/Blanket/Shield Considerations
Since there is no tritium breeding in a D-D reactor, the blanket/shield
can be optimized to (1) maximize the neutron energy multiplication and (2)
minimize the inboard blanket/shield thickness subject to the constraint that
adequate shielding of the toroidal field coils is provided. The neutronic
model used has been an infinite cylinder with particle transport calculated
using ANISN with a 46-neutron/21-gaaaa group structure using the VITAMIN-C
and MACKLIB-IV libraries. The focus has been on materials with a high (n,y)
6-5

reaction potential and a high energy release for this reaction.
It is important to make the inboard blanket/shield as thin as possible
to increase the magnetic field in the plasma and hence increase the power
output. A neutronic analysis of the inboard blanket/shield has been con-
ducted for two candidate coolants (pressurized light water and helium gas)
and four candidate shielding materials (PCA, tungsten, TiHj, and water).
The primary structural material in all cases has been an advanced austentic
stainless steel (PCA). The minimum blanket/shield thickness is obtained for
tungsten with a water coolant. Tungsten produces no long-term activation
products; however, resources are limited, and its cost is relatively high.
A blanket/shield constructed of tungsten would be 82 cm thick or about
40 cm thinner than the STARFIRE blanket/shield, which contains low-density
LiA102 for tritium breeding.
Since the thickness of the outboard blanket/shield is less critical,
the outboard blanket can be designed to increase neutron energy multiplica-
tion. Four candidate materials for the blanket have been considered. PCA
has been taken as the reference case, but PCA could pose a chromium resource
problem owing to high-level, long-term activation, precluding recycling.
Three refractory materials (CrN, Si3Nt,., and SiC) have been considered for
their relatively low activation and/or ; atural abundance. The total neutron
energy multiplciation varies from 1.94 for PCA to 1.34 for SisNt*. If
helium is used instead of water for the coolant, the energy multiplication
for PCA drops to 1.4. Water coolant appears to be essential for energy
multiplication. Use of a 10-ctn thick beryllium multiplier could increase the
multiplication by an additional 0.2 - 0.8, depending on the blanket material.
A series of thermal hydraulic analyses has been carried out for two
first wall/blanket concepts: (1) a coolant panel-type first wall attached to
monolithic blanket blocks and (2) cylindrical modules with hemispherical
front ends. Water, helium, and sodium have been considered as heat transport
fluids, and silicon nitride, silicon carbide, and chronium nitride have been
considered as blanket materials. For the coolant panels fairly narrow cool-
ant channels with stainless steel as the structural material and water as
the coolant provide an acceptable design. Helium cooling would require
shorter and larger channels and refractory metals to withstand the higher
operating temperature. The pumping power losses for the cylindrical module
design are quite small. Because of the small module size, however, blanket
6-6

design and manifolding a large number of such units may be difficult.
Chromium nitride does not appear to be viable for this design because of the
high operating temperature. Hot spots in the filler elements between modules
do not seem to be a problem.
Preliminary results indicate pumping losses are 2.5% for a sodium
coolant compared to less than 1% for water coolant.
The structural material evalttations have focussed on two candidates,
PCA and V-20T1. The concerns are the poor thermophysical properties of PCA
and the potentially high corrosion rate of V-20Ti in a water coolant. PCA
appears to have an adequate fatigue lifetime for the reference first-wall
heat fluxes provided the burn cycle is greater than 5000 s.
The physical properties of the moderator materials, CrN, Si3^, and SiC,
have been surveyed. For the operating conditions of a D-D reactor, SiC has
the most desirable properties, whereas CrN has the least desirable. The
available data indicate that bulk radiation effects should saturate at low
levels for the present operating temperatures. High fluence data is needed
to confirm this prediction.
A consideration of first wall surface effects indicates that for the
reference design all first wall components and the limiter should be
constructed of the same material and that the surface material should be a
single element with Z £ 10. The low-Z coating (cladding) concept is re-
commended. On an overall basis beryllium appears to be a superior candidate
for the first-wall coating. Boron is also a prime candidate.
Calculations indicate almost total reflection of cyclotron radiation
from a stainless steel first wall. Presence of a thin oxide layer should
not affect this conclusion.
Preliminary studies have been made of the effect of a plasma disruption
on the first wall. Because of the higher amount of stored energy in the
plasma, a plasma disruption in a D-D reactor could melt and vaporize the
first-wall coating even for disruption times as long as 200 ms. Further
analyses are required to devleop a first wall concept that would withstand
projected plasma disruptions.
6.4 Magnet Design Considerations
Although a steady-state version of the reference design has been studied
in a preliminary fashion, most of the effort for this report has been directed
toward the conventional, ohmically-driven version. The ohmic heating (OH)
6-7

system, which is primarily responsible for inducing the plasma current,
consists of a central solenoid and five pairs of circular coils all outside
the toroidal field (TF) coils. The OH system provides 500 V-s with a field
swing from -7.6 T to + 7.6 T. It is held at full negative field just before
startup and ramped to full positive value during the 18 sec "ohmic heating"
period. At full field the field produced in the plasma by the OH system is
zero within an RMS error of 2 x 10"1* relative to the full equilibrium field
(EF). The maximum stored energy in the OH system is 20 GJ.
The EF system, which provides the bulk of the equilibrium field necessar;
to keep the plasma positioned in the chamber with the desired cross-sectional
shape and pressure and current distributions, consists of four pairs of
circular coils, also all outside of the TF coils. In addition to maintain-
ing the plasma equilibrium, the EF system provides 195 v-s to help induce
the plasma current. Of the total 695 V-s supplied to the plasma, 500 V-s
are needed to inductively initiate the current, and 195 V-s are available to
maintain the plasma against resistive losses. The EF system has a maximum
stored energy of 22 GJ with 67 MAT of current. The EF'and the OH systems
are completely decoupled, so that changes in one system do not induce
voltages in the other.
The TF system consists of twelve constant tension coils designed for a
peak field of 15 T with operation expected to be at 14 T. Designs of 14, 15,
and 16 T were considered. The conductor is a three level, unsoldered,
uninsulated, "Rutherford" cable with four grades of conductor. The two high-
field grades employ NbsSn, and the two low-field grades employ NbTi as
superconductor. The conductor is copper stabilized with the loop stresses
supported by a support frame made of stainless steel strips. The design is
similiar to that used in the STARFIKE studies but extrapolated to higher
field.
6.5 Tritium/Fuel/Vacuum Considerations
No major technological difficulties are expected in the design of the
fuel reprocessing systems for the D-D reference design. Fueling requirements
per day are 2.9.kg of deuterium, 1 kg cf % e , and 17 g of tritium. The
exhaust consists of 2.4 kg of deuterium, 1 kg of 3He, 17 g of tritium,
0.3 kg of 4He, and 80 g of protium.
The D-D design both produces and burns tritium in the plasma. No
6-8

outside tritium breeding capability is required, and the tritium exhaust is
reduced from a comparable D-T design. As a consequence, the tritium inven-
tories, both "vulnerable" and "non-vulnerable", are two orders of magnitude
smaller than in a similar D-T reactor. The tritium still represents a
significant safety concern; therefore, the tritium safeguards proposed in
the STARFIRE design are necessary in the D-D design.
Reprocessing of the 3He is easily accommodated within the fuel repro-
cessing system. Reprocessing is required from U.S. resource considerations
if additional sources are not available.
The limiter/vacuum system is designed to maintain the pressure in the
limiter at %0.04 Pa, the same as in the STARFIRE design. Because the D-D
design has a gas load 2.4 times that in STARFIRE, the vacuum ducts are
decreased in length and increased in diameter to provide the additional
conductance required. In addition, the cryopanel surface area is increased
to handle the additional load.
6-9