d:documents and … · pubblicato da journal of environmental science and health part b (2007) 42,...
TRANSCRIPT

Pubblicato da Journal of Environmental Science and Health Part B (2007) 42, 823-833.
1 di 31
Pesticide Residues in Italian Ready-Meals and dietary intake estimation during 2005.
Michele Lorenzin*
Provincial Agency for Environmental Protection, Autonomous Province of Trento, Trento, Italy
ABSTRACT
The investigations carried out by state-run Italian laboratories within the framework of controls
seeking pesticide residues monitoring in foodstuffs involve quantifying the levels of such residues
in fruit and vegetable produce and their processed products: oil, wine and fruit juices.
The Italian Ready-Meal Residue Project, promoted by the pesticides working group of Italian
Environmental Agencies, seeks to asses the quantity of pesticides in pre-prepared (read-to-eat)
lunches (comprising a first course, side dish, fruit, bread and wine), and to quantify the amounts
consumed and compare with the ADIs.
The data provided by 16 laboratories which analysed 50 complete meals in 2005 (samples taken on
8 February, 26 May, 24 October, 21 December 2005) showed residues in 39 lunches, with an
average number of 2.4 pesticides in each meal and a maximum of 10 pesticides.
*Address correspondence to Michele Lorenzin, Agenzia Provinciale per la Protezione
dell’Ambiente, Provincia Autonoma di Trento, Via Lidorno, 1 -38100 - Trento, Italy;
Phone:+390461493039, Fax: :+390461493003; E-mail: [email protected]

Pubblicato da Journal of Environmental Science and Health Part B (2007) 42, 823-833.
2 di 31
The most often found substances were: pirimiphos-methyl (20 times), procymidone (17),
pyrimethanil (7), iprodione (7), cyprodinil (7), fenitrothion (6), diphenylamine (6), chlorpyrifos (6),
metalaxyl (5) and chlorpyrifos-methyl (5).
The distribution of residues between each dish of the meal was also examined, and the results
showed that: 77.3% of the residues were present in the fruit, 14.9 % in the wine, 3.0 % in the main
course, 2.8 % in the bread and 2.1 % in the side dish.
Assuming that two meals are consumed per day, the daily intake of pesticide residues was
calculated on a daily basis, in relation to normal body weight (60 kg for an adult, 40 kg for a
teenager, 20 kg for a child) and compared with the ADI values established by the European Union.
In the case of adults, the average daily intake of pesticides in relation to ADI was 2.6 % with a
maximum of 73.3 %; for teenagers it was 4.9 % with a maximum of 109 % and for children it was
9.8 % with a peak of 219 %.
Key Words: pesticide residues; daily intake of pesticide residues, dietary exposure to pesticides,
dietary intake of pesticide residues.
INTRODUCTION
Monitoring studies have been carried out regularly in Italy with the scope of checking pesticide

Pubblicato da Journal of Environmental Science and Health Part B (2007) 42, 823-833.
3 di 31
residue levels in food: fruit, vegetables, cereals, wine and oils. The Decree of the Ministry of 23
December 1992 [1]
sets out the minimum number of samples to be analysed annually for the
different categories of foodstuff for each region and autonomous province.
According to the Recommendations of the Commission (last Recommendation of 18 January 2006
[2]), the European Union establishes European community monitoring programmes to guarantee that
the maximum quantities of pesticide residues in products of vegetable origin are not exceeded. The
Recommendations of the Commission establish the number of samples for each member state and
the product/pesticide combinations that must be monitored.
Using the data for pesticide residues found in foodstuffs, it is possible to calculate the estimated
daily intake (EDI) of pesticides from food, on the basis of knowledge of the diet and factors relating
to the processing of the food, bearing in mind preparation (cooking, for example) and the removal
of certain parts (for example the skin of bananas and oranges).
In Italy numerous studies [3-5]
have been carried out to evaluate EDI and long-term (chronic) hazards
resulting from ingestion of levels of pesticide residues in the diet. Total Diet Studies as defined by
the WHO [6]
,consisting of analysis of a representative `market basket’ of foods, usually prepared for
normal consumption have not been carried in Italy.
The results of Total Diet Studies carried out in the United States [7,8]
and in Japan [9]
are available.
Food and Drug Administration (FDA) [7,8]
staff shop in supermarket or grocery stores four times a

Pubblicato da Journal of Environmental Science and Health Part B (2007) 42, 823-833.
4 di 31
year, once in each of four geographical regions of the country. Shopping in three cities from each
region, they buy the same foods, selected from nationwide dietary survey data, to typify the
American diet. Foods from the market baskets are then prepared as the consumer would prepare
them. The prepared foods are analysed for pesticide residues.
For estimation of the dietary intake of pesticide residues in France [10]
the duplicate diet method was
applied, consisting of analysis of exact duplicates of prepared meals eaten and drunk during a
period varying from 1 to 7 days,.
The purpose of the Australian Total Diet Survey (ATDS) [11]
is to estimate the level of dietary
exposure of the Australian population to a range of pesticide residues, contaminants and other
substances that can be found in the food supply. This is estimated by determining the mean level of
the substance in foods by direct analysis of samples collected for the ATDS. The levels are then
multiplied by the amount of food consumed to estimate dietary exposure.
With the New Zealand Total Diet Survey (NZTDS) [12]
exposure is estimated by multiplying mean
concentration data by the amount of food consumed.
The APAT-ARPA-APPA Pesticides Working Group (abbreviated to AAAF in Italian) devised,
planned and performed the “Italian Ready-Meal Residue Project”, which set itself the objective of
estimating the intake of pesticide from residues present in the diet. This paper presents the results of
pesticide residues in Italian Ready-Meal samples, collected during the year 2005.
Pubblicato da Journal of Environmental Science and Health Part B (2007) 42, 823-833.
5 di 31
Sixteen Italian laboratories were involved in sampling and analysing first courses, side dishes, fruit,
bread and wine.
The intake per meal was calculated taking into consideration the concentration of pesticide residues
found and the quantities of the first course, side dish, fruit, bread and wine in kg, consumed during a
meal. Considering that two meals per day are normally consumed, the daily intake was obtained by
multiplying the intake per meal by two.
In order to compare this calculated daily intake with the acceptable daily intake (ADI), we
considered an adult weighing 60 kg, a teenager of 40 kg and a child of 20 kg.
The values for the daily intake per kg of body weight calculated were compared with ADI levels
established by the European Union doc. 3010 [13]
and by the Australian Government in the ADI list
[14].
MATERIALS AND METHODS
Laboratories Participating in the Italian Ready-Meal Residue Project
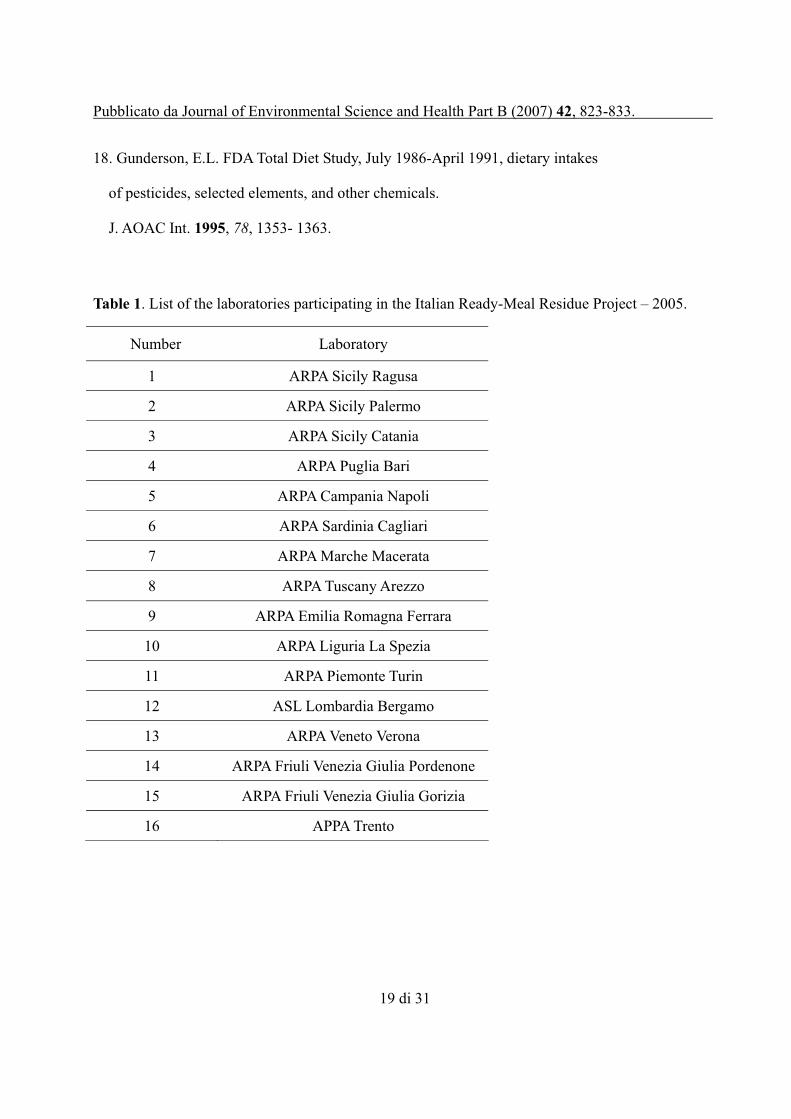
During 2005 the analytical data for the Italian Ready-Meal Residue Project was supplied by the 16
public Italian laboratories as listed in Table 1.
The laboratories analysed products of vegetable origin, seeking pesticide residues within the context

Pubblicato da Journal of Environmental Science and Health Part B (2007) 42, 823-833.
6 di 31
of official monitoring of foodstuffs provided for by the Ministerial Decree of 23 December 1992 [1]
.
To participate in the project, each laboratory had to demonstrate that it had carried out the
proficiency tests organised by the European Commission as established by article 28, paragraph 3 of
Regulation (EC) No. 396/2005 [15]
.
Two analytical methods were adopted: with the first method [16]
, used by 14 laboratories, the sample
mixed with diatomaceous earth is extracted with dichloromethane or ethyl acetate; the second
method [16]
provides for SPE purification with con C-18 after extraction with acetone/methanol.
Sampling
In planning the Italian Ready-Meal Residue Project the AAAF group chose to analyse the meals
prepared and supplied by company cafeterias and by schools, hospitals and rest homes. Cafeterias,
particularly school cafeterias, which declared that they obtained products from organic farms were
excluded from the survey.
A typical Italian meal is made up of a first course (pasta, risotto or soup), a second course (meat,
fish, cheese or cured meats), a vegetable side dish (raw or cooked), bread, fruit and wine.
The second course was not analysed as products of animal origin are less likely to contain pesticide
residues.
Pubblicato da Journal of Environmental Science and Health Part B (2007) 42, 823-833.
7 di 31
The samples were collected at four different times during the year: in February, May, October and
December, and on different days of the week. Sampling of the meals took place as follows: 1st
sample on Tuesday 8 February 2005; 2nd
sample on Thursday 26 May 2005; 3rd
sample on Monday
24 October; 4th
sample on Wednesday 21 December 2005.
In many of the cafeterias where sampling was carried out wine was not available; in these cases the
sample of wine analysed was purchased at a supermarket.
Sample Preparation and Analysis
The AAAF group supplied all the laboratories participating in the Italian Ready-Meal Residue
Project with a procedure for the preparation of samples to be analysed and for data reporting .
The procedure involved the laboratory weighing and recording the weight of the first course, the
side dish, fruit and bread. The quantity of wine used for the calculation of the intake of pesticide
residues was 0.250 kg per meal.
It was also necessary to check and record the composition of each dish; for example, mixed salad
made up of carrot, lettuce and tomato.
In order to be able to calculate the real intake, it is necessary to analyse the part of the food which is
actually consumed and thus the inedible parts were eliminated: for example, bananas and oranges
Pubblicato da Journal of Environmental Science and Health Part B (2007) 42, 823-833.
8 di 31
were peeled and weighed, recording the weight of the fruit without the skin.
After preparation the sample was homogenised using a laboratory cutting chopper; in many cases
the food was first roughly chopped with a knife.
The homogenised sample was stored in the freezer (-20 °C) up to the time of analysis.
The procedure established that each laboratory determines the amount of pesticide residues using
the method used in the proficiency tests organised by the European Commission, with a detection
limit equal to, or less, than 0.01 mg/kg and confirmation with mass spectrometry.
Pesticides found in products of vegetable origin in italian monitoring carried out in previous years
were sought: azinphos-methyl , bromopropylate, bupirimate, buprofezin, captan, carbaryl,
chlorothalonil, chlorpropham, chlorpyrifos, chlorpyrifos-methyl, cyprodinil, DDD, DDE, DDT,
diazinon, dichlofluanid, dicloran, dimethoate, diphenylamine, ensodulfan (alpha, beta, sulfate),
ethoxyquin, fenhexamid, fenitrothion, fludioxonil, imazalil, iprodione, kresoxim methyl, malathion,
metalaxyl, methidathion, metoxychlor, myclobutanil, nuarimol, penconazole, pendimethalin,
2-phenylphenol, phosalone, piperonyl butoxide, pirimicarb, pirimiphos-methyl , procymidone,
prometryn, pyrimethanil, tetrachlorvinphos, thiabendazole, tolclofos-methyl, tolylfluanid.
Calculation of the Daily Intake of Pesticide Residues.

Pubblicato da Journal of Environmental Science and Health Part B (2007) 42, 823-833.
9 di 31
The laboratory participating in the Italian Ready-Meal Residue Project determined the concentration
(in mg/kg) of pesticides in the first course, side dish, fruit, bread and wine.
The quantity of pesticides (in mg) present in the first course, side dish, fruit, bread and wine was
calculated by multiplying the concentration found (in mg/kg) by the weight (in kg) recorded in the
prepared sample.
If the pesticide was present in two or more dishes of the meal, the overall quantity was equivalent to
the sum of the quantities present in the individual dishes.
The quantity found in wine was not considered in calculations for the teenagers and children, as it
was assumed (or rather hoped) that wine is not consumed by these categories.
In order to calculate the daily intake of pesticide residues, the AAAF group considered an average
of two complete meals a day, ignoring breakfast and any snacks consumed in the morning or
afternoon.
The daily intake per kg of body weight (in mg/ kg bw) was calculated by dividing the data for the
daily intake by the average weight of an adult (60 kg), teenager (40 kg) and child (20 kg).
The calculation was performed for each pesticide found in the meal.
Calculation of the Ratio between the Daily Intake of Pesticide Residues and ADI.
Pubblicato da Journal of Environmental Science and Health Part B (2007) 42, 823-833.
10 di 31
The values for the estimated daily intake per kg of body weight (in mg/ kg bw) for each pesticide
was compared with the ADI levels established by the European Union in document 3010[13]
.
The comparison was undertaken by dividing the figures for the daily intake by the kg of body
weight, and comparing this result with the ADI levels for each of the pesticides found.
A comparison was also made with the ADI levels established by the Australian Government[14]
.
RESULTS AND DISCUSSION
Pesticides in Meals
In 2005 the 16 laboratories participating in the Italian Ready-Meal Residue Project analysed 50
meals, determining pesticide residues in the first course, side dish, fruit, bread and wine.
In the first group of samples collected in February, pesticide residues were found in 13 meals,
whereas no residues were found in 2 meals; in the second sampling 10 meals with pesticide residues
and 3 without pesticide residues were found; in the third sampling 8 meals with pesticide residues
and 3 without pesticide residues were found; in the fourth sampling 8 meals with pesticide residues
and 3 without pesticide residues were found.
Overall pesticide residues were measured in 39 out of 50 meals, with a maximum of 10 different
Pubblicato da Journal of Environmental Science and Health Part B (2007) 42, 823-833.
11 di 31
pesticides (Laboratory Code 13) and a minimum of 1 (Laboratory Codes 5, 6, 8, 10, 12, 16)
pesticide per meal with an average number of 2.4 pesticide found for each meal.
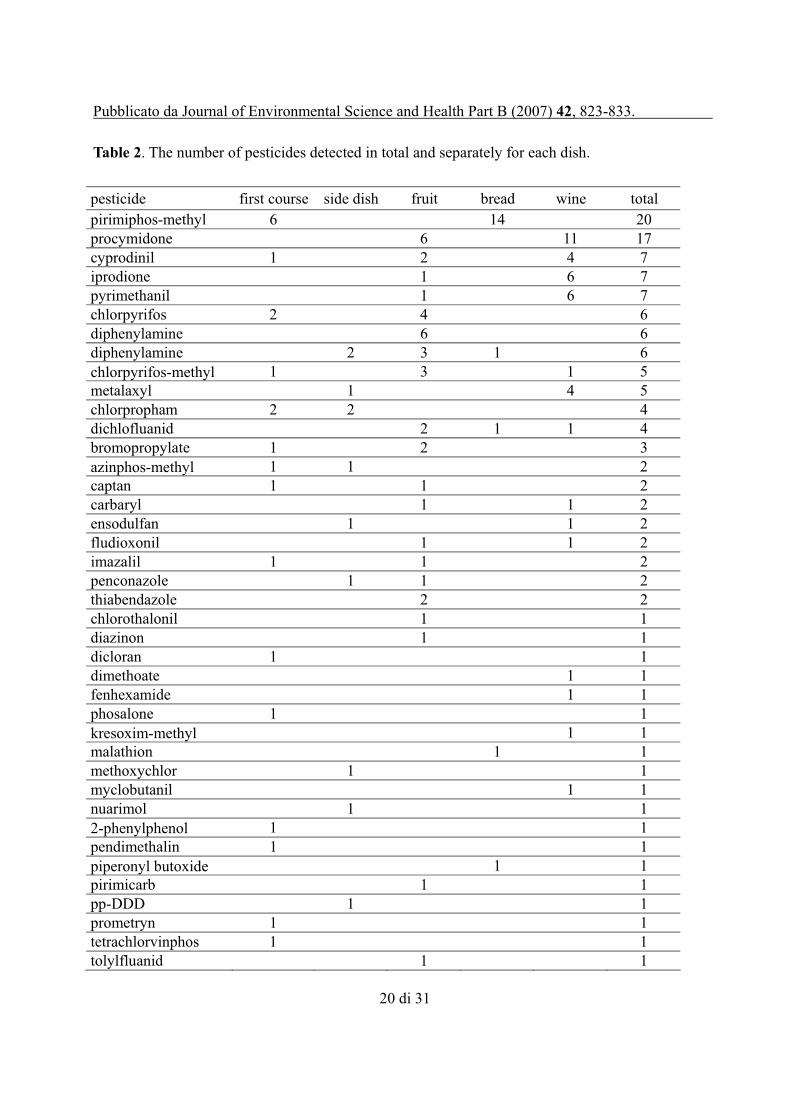
In Table 2 the number of pesticides detected in total and separately for each dish are given.
Pirimiphos-methyl is the pesticide most frequently found in the meal as a whole (20 times), in bread
(14 times) and in the first course (4 times). The pesticide most frequently found in wine is
procymidone (11 times), which was also found most frequently in fruit (6 times), together with
diphenylamine. In the side dish the pesticides most frequently found were diphenylamine and
chlorpropham, on 2 occasions.
By multiplying the concentration of pesticide residues by the weight of the food, the quantity of
pesticides in the first course, side dish, fruit, bread and wine was obtained: the data obtained was
used to calculate the arithmetic mean.
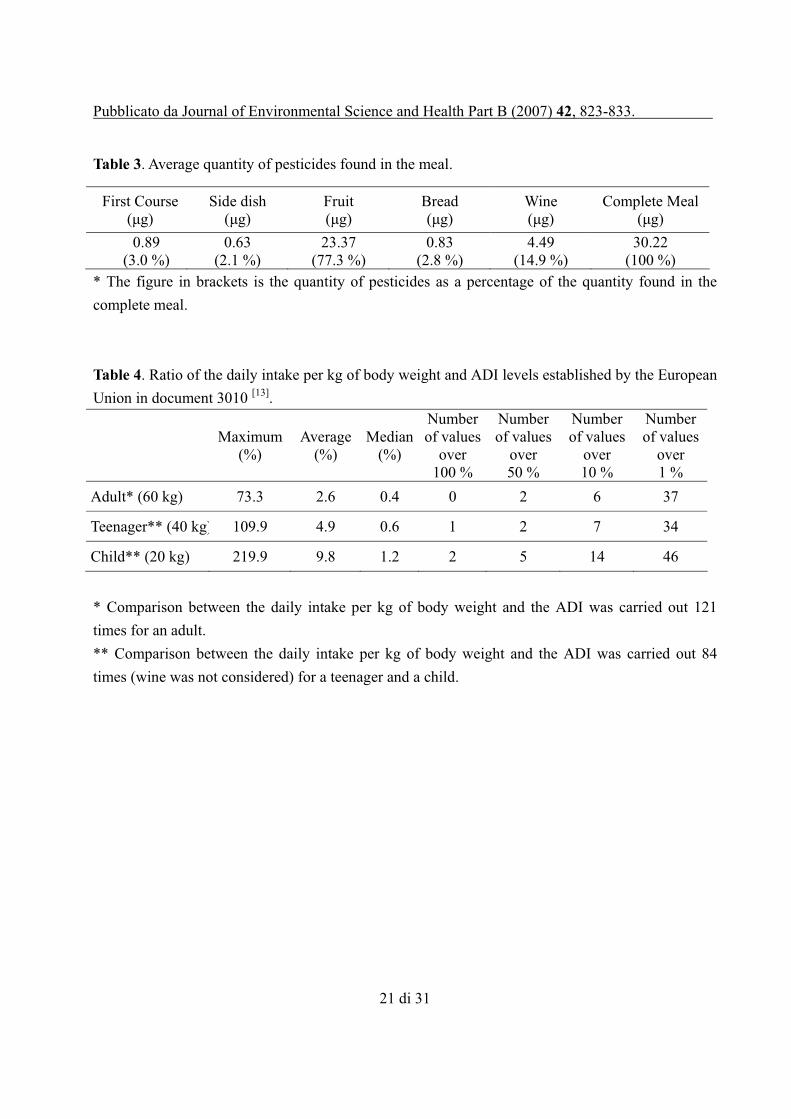
Table 3 gives the average figures of pesticides found in the first course, side dish, fruit, bread and
wine; as such these quantities have no toxicological meaning, as the residues of the individual
pesticide must be compared with ADI levels, but they are useful for highlighting the contribution of
the different dishes.
The data shows that 77.3% of the total quantity of pesticides found was consumed from the fruit,
followed by wine (14.9 %), the first course (3.0 %), bread (2.8 %) and the side dish (2.1 %).
To calculate the intake of pesticides for a teenager and child the contribution from wine
Pubblicato da Journal of Environmental Science and Health Part B (2007) 42, 823-833.
12 di 31
consumption was not considered. The average number of pesticide residues thus reduced from 2.4
to 1.7. For a teenager and the child 90.8 % of pesticides were consumed from the fruit, 3.6 % from
the first course, 3.2% from the bread and 2.4% from the side dish.
Comparison of the Daily Intake of Pesticide Residues with ADI
The daily intake per kg of body weight for each individual pesticide must be compared with the
ADI for that pesticide.
The result obtained, expressed as a percentage of ADI,. Values greater than 100% indicate that the
ADI has been exceeded, whereas values lower than 100 %, indicate that the daily intake per kg of
body weight is less than the ADI.
The results of the analysis carried out in 2005 allowed comparison between the daily intake per kg
of body weight and the ADI, 121 times in the case of the adult and 84 times for a teenager and a
child. The difference in the number of comparisons depends on the fact that the contribution of wine
was not considered for a teenager and a child.
The data comparing the daily intake per kg of body weight and the ADI established by the European
Union in document 3010 [13]
gives a maximum figure of 73.3% for the adult, an average figure of
2.6% and a median level of 0.4 %. In the teenager the maximum figure was 109 %, the average
Pubblicato da Journal of Environmental Science and Health Part B (2007) 42, 823-833.
13 di 31
figure 4.9 % and the median level 0.6 %. In the child the maximum figure was 219 %, the average
9.8 % and the median level 1.2 %.
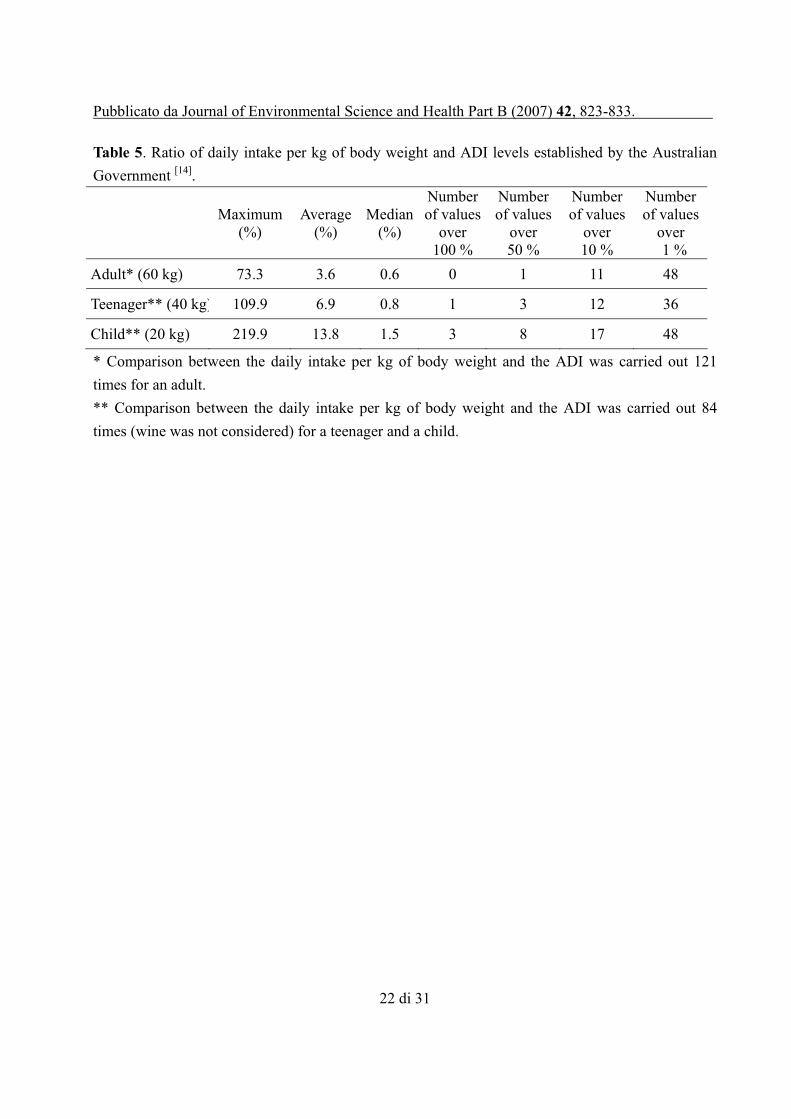
The data is presented in Table 4, whereas Table 5 shows the ratio between the estimated daily intake
per kg of body weight and the ADI established by the Australian Government [14]
.
The data presented in Tables 3 and 4 shows that the maximum figures do not change, whereas the
average and median figures are higher when comparison between the daily intake per kg of body
weight is done with the ADI levels established by the Australian Government.
The number of figures exceeding 100%, 50%, 10% and l.1% (Tables 4 and 5, columns 5-8), is
higher as compared to the ADI levels established by the Australian Government than as compared to
ADI levels established by the European Union.
The three cases in which the ADI was exceeded in the child are as follows:
A – 1st sample – sample of apple (weight of peeled apple 0.180 g) containing 0.130 mg/kg of
pirimicarb – daily intake per kg of body weight 0.00234 mg/kg bw – ADI 0.002 mg/kg bw –
relationship 117%;
B – 2nd
sample – sample of peach (weight of peeled peach 0.246 g) containing 0.715 mg/kg of
carbaryl – daily intake per kg of body weight 0.0175 mg/kg bw – ADI 0.008 mg/kg bw –
relationship 219%;
C – 3rd
sample– sample of grapes (weight of grapes 0.290 g) containing 0.810 mg/kg of cyprodinil –
Pubblicato da Journal of Environmental Science and Health Part B (2007) 42, 823-833.
14 di 31
daily intake per kg of body weight 0.02349 mg/kg bw – ADI 0.02 mg/kg bw – relationship 117%;
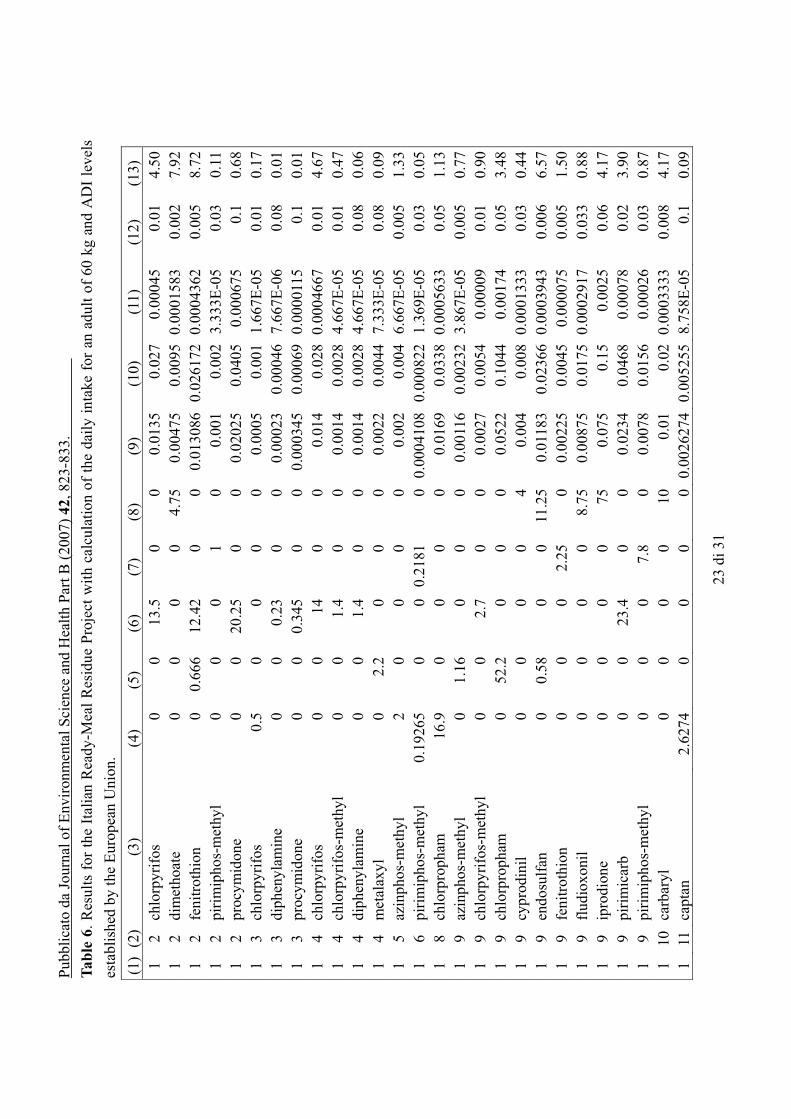
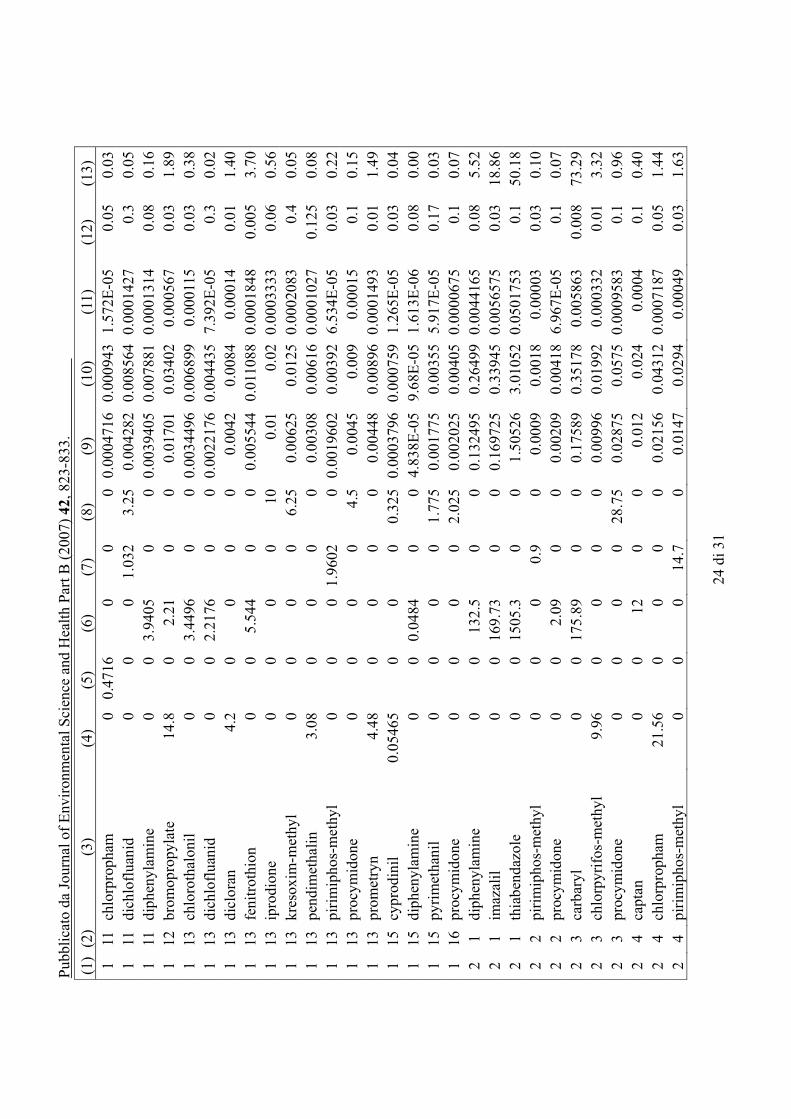
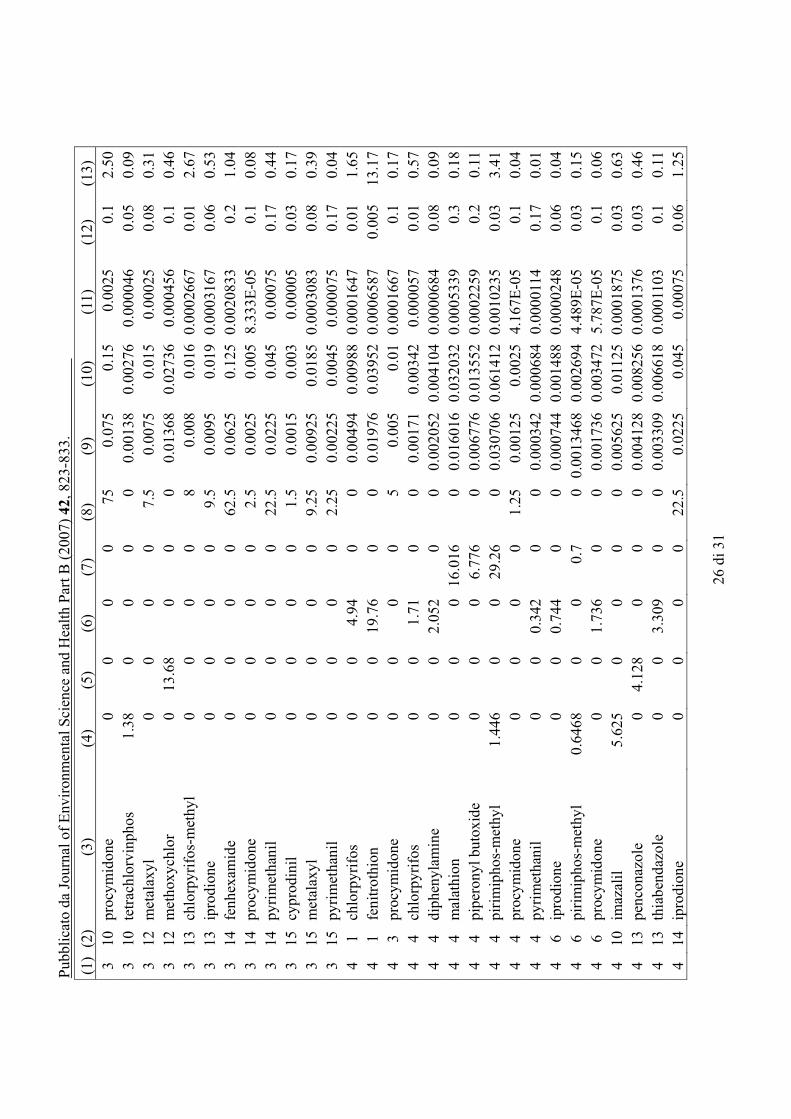
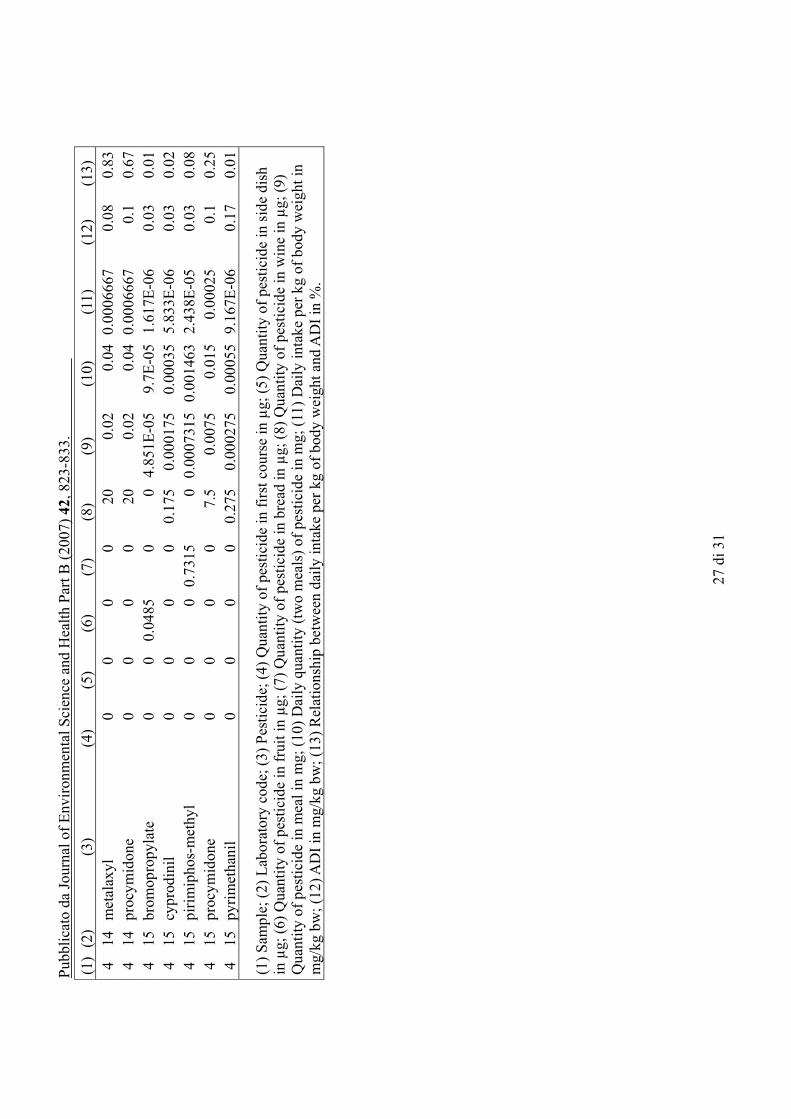
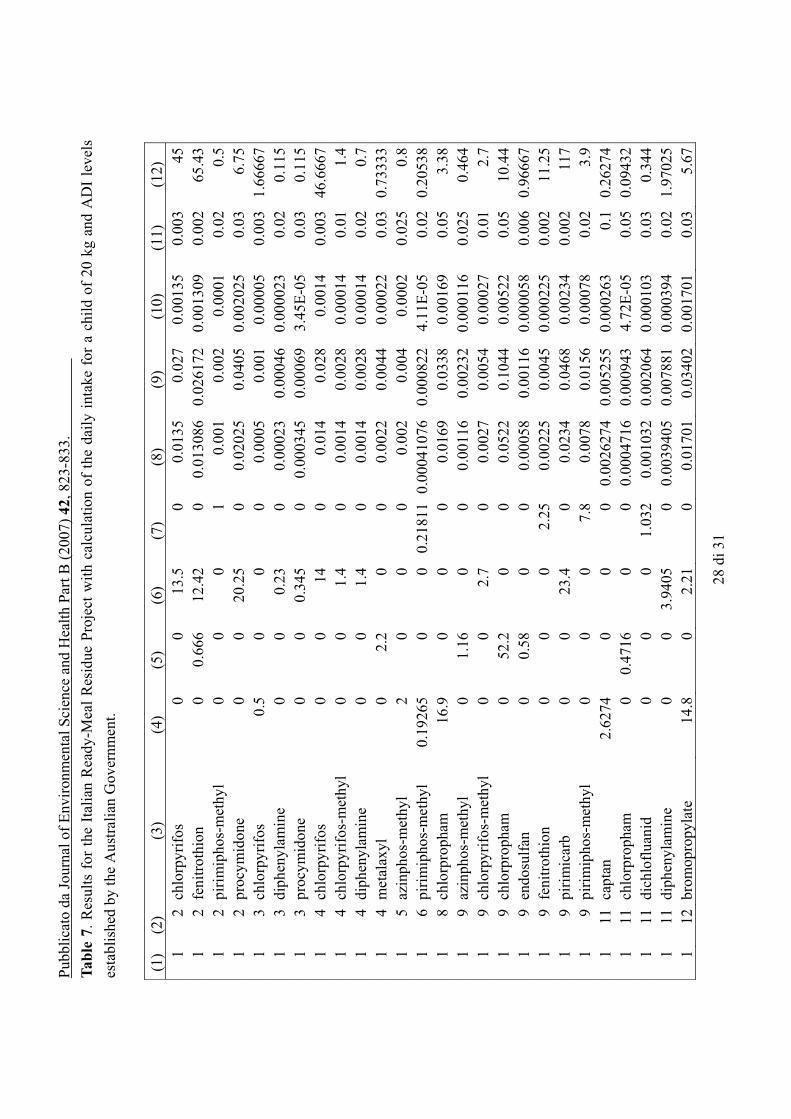
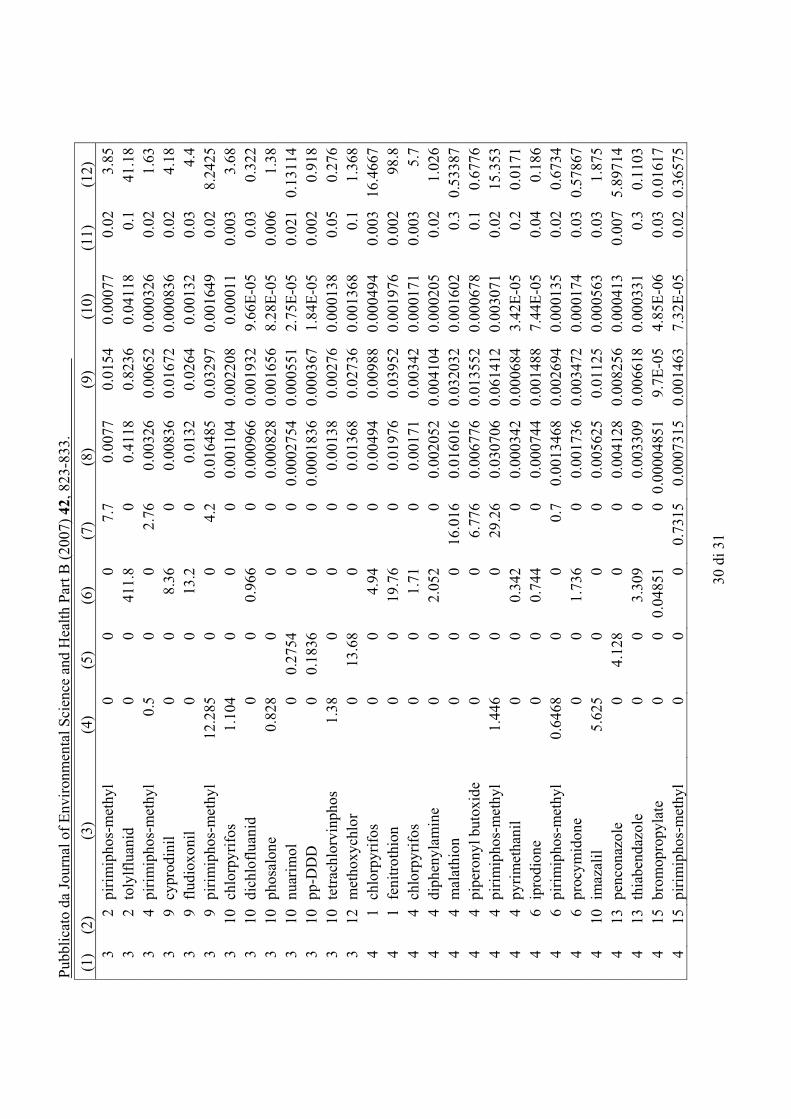
Table 6 gives the 2005 Italian Ready-Meal Residue Project results, with comparison (as a
percentage of ADI) between the daily intake per kg of body weight for an adult of 60 kg and the
ADI levels established by the European Union, whereas Table 7 shows the comparison between the
daily intake per kg of body weight for a child of 20 kg and was performed using the ADI levels
established by the Australian Government.
Comparison of the results of the Italian Ready-Meals Residue Project with the results of studies to
calculate the National Estimated Daily Intake (NEDI) of Total Diet Studies and Total Diet Surveys
is very difficult because different calculation systems have been used. It is possible to compare the
average daily intake as a percentage of ADI estimated by the Italian Ready-Meals Residue Project
and the maximum figure, as a percentage of ADI, estimated by other studies.
The average daily intake for man (as a percentage of ADI) established for 2005 in Italy (Table 4,
column 3) is very similar to the NEDI/ADI ratio figures calculated by Camoni et. al [3,4]
from 1993
to 1997. The maximum figures for NEDIs, as a percentage of ADIs relative to pesticide residues for
official monitoring studies, has been estimated at 4.8 % in 1995, whereas the other NEDI/ADI ratio
figures are almost always less than 1%.
Similar considerations can be made as regards comparison of the figures for the NEDI/ADI ratio
estimated by Gaidano and Fabbrini [5]
with pesticide residues from private organisations, which
Pubblicato da Journal of Environmental Science and Health Part B (2007) 42, 823-833.
15 di 31
obtain data comparable with the data of Camoni et. al [3,4]
.
In the study (duplicate diet method) carried out in France [10]
for 10 pesticides in 1998-1999, the
daily intake estimates are generally low, representing a maximum of only 4% of the ADI for
pesticide residues. The maximum figure is very similar to the average daily intake as a percentage
of ADI for man estimated in Italy (2.6 % -Table 4, column 3).
In Japan [9]
, the Total Diet Study for 14 pesticides from 1977 to 2002, highlighted average levels of
daily intake as a percentage of ADI in 2002 which are much lower than the average figure
established for 2005 with the Italian Ready-Meals Residue Project.
FDA Total Diet Studies [17,18]
have estimated the mean daily intake for eight age-sex groups from
1984 to 1991. In the first study (1984-1986) the maximum figure for the mean daily intake
estimated for the male, aged 14-16 group (body weight 60 kg) was 5.8 % as a percentage of ADI,
whereas in the second study (1986-1991) the maximum figure was 3 % as a percentage of ADI.
These levels are very similar to the average figure (2.6 %) estimated for man in 2005 in Italy.
The Australian Total Diet Survey [11]
carried out in 2000-2001, estimated maximum levels of mean
estimated daily dietary exposure to pesticide residues as a percentage of the ADI based on mean
analytical results, as between 5 % -15 % depending on the six age-sex groups.
Maximum figures closer to the average figure established for 2005 with the Italian Ready-Meals
Residue Project (Table 4, column 3) have been estimated in New Zealand. The New Zealand Total
Pubblicato da Journal of Environmental Science and Health Part B (2007) 42, 823-833.
16 di 31
Diet Survey [12]
carried out in 2003-2004, estimates maximum levels of mean estimated daily
dietary exposure to pesticide residues as a percentage of the ADI (excluding dithiocarbamates), as
between 2 % - 4 % depending on the six age-sex groups.
CONCLUSIONS
The Italian Ready-Meal Residue Project devised and planned by the AAAF group allows the intake
of pesticide residues through diet to be estimated, by analysing the first course, side dish, fruit,
bread and wine.
In 2005 50 meals were analysed by 16 laboratories and the data shows an average presence of 2.4
pesticide residues per meal.
Comparison between the estimated daily intake and the ADI shows a level higher than the ADI only
in the case of a teenager and a child. The average value, considering the ADI levels established by
the European Union, was 2.6%, 4.9% and 9.8 % respectively for the adult, teenager and child.
ACKNOWLEDGMENTS
We thank those responsible for collaboration at the laboratories participating in the Italian
Ready-Meal Residue Project: Dr Maria Lucia Antoci, Dr Vittoria Giudice, Dr Sabrina Finocchiaro,
Dr Francesco Fiume, Dr Dario Mirella, Dr Elena Cocco, Dr Giusy Mariotti, Dr Patrizia Bolletti, Dr
Marco Morelli, Dr Marco Filippelli, Dr Paolo Branca, Dr Gemma Molinari, Dr Francesca Daprà, Dr
Pubblicato da Journal of Environmental Science and Health Part B (2007) 42, 823-833.
17 di 31
Clorinda Del Bianco, Dr Marco Dizorz.
REFERENCES
1. Italian Ministry of Health. Decree 23 December 1992 (implementation of the
EU Directive n. 90/642/CEE). Italian Gazzetta Ufficiale. 1992, n. 305, 46-61.
2. Commission Recommendation of 18 January 2006 concerning a coordinated
Community monitoring programme for 2006.
Official Journal of the European Union. 2006, L19, 23-29.
3. Camoni, I.; Di Muccio, A.; Fabbrini, R. Assessment of the daily intake
of pesticide residues through the diet in Italy from survey data (1993±1996).
Abstracts of the 9th International Congress Pesticide Chemistry.
London, United Kingdom. 1998, 8A-019..
4. Camoni, I.; Fabbrini, R., Attias, L., Di Muccio, A.; Cecere, E.; Consolino, A., Roberti, F.
Estimation of dietary intake of pesticide residues by the Italian population during 1997.
Food Addit. Contam. 2001, 18 (10), 932-936.
5. Gaidano, R.; Fabbrini, R. Estimation of the daily intake of pesticide residues
through the diet in Italy (based on data from private organizations).
Ital. J. Food Sci. 2000, 12 (3), 291-301.
6. WHO. World Health Organization. Guidelines for predicting dietary intake of pesticide residues.
Geneva, Switzerland. 1997, WHO/FSF/FOS/97.7.
7. Pennington, J.A.T.; Gunderson, E.L. History of the Food and Drug Administration’s
Total Diet Study - 19617-1987. J. Assoc. Off. Anal. Chem. 1987, 70, 772-782.
8. Pennington, J.A.T.; Capar, S.G.; Parfitt, C.H.; Edwards, C.W.
History of the Food and Drug Administration’s Total Diet Study (Part II), 1987-1993.
Pubblicato da Journal of Environmental Science and Health Part B (2007) 42, 823-833.
18 di 31
J. AOAC Int. 1996, 79, 163-170.
9. Maitani, T. Evaluation of exposure to chemical substances through foods.
Exposure to pesticides, heavy metals, dioxins, acrylamide and food additives
in Japan. J. Healh Sci. 2004, 50(3),205-209.
10. Leblanc, C.; Malmauret, L.; Guerin, T.; Bordet, F.; Boursier, B.; Verger, P.
Estimation of the dietary intake of pesticide residues, lead, cadmium, arsenic
and radionuclides in France. Food Addit. Contam. 2000, 17 (11), 925-932.
11. FSANZ (Food Standards Australia New Zealand). The 20th Australian Total Diet Survey.
Camberra, Australia. 2003. ISBN 0 642 345910.
12. NZFSA (New Zealand Food Safety Authority). 2003/04 New Zealand Total Diet Survey.
Wellington, New Zealand. 2005. ISBN 0-478- 980 -3.
13. Document 3010 Status of active substances under EU review
http://ec.europa.eu/food/plant/protection/pesticides/index_en.htm
14. Australian Government ADI list, As of 30 June 2006
http://www.tga.gov.au/docs/html/adi.htm
15. Regulation (EC) n. 396/2005 of the European Parliament and the Council
of 23 February 2005 on maximum residue levels of pesticides in or on food and feed
of plant and animal origin and amending Council Directive 91/414/EEC
Official Journal of the European Union. 2005, L70, 1-16.
16. Anonymous. Multiresidue methods for the analysis of pesticide residues in vegetable products.
Rapporti ISTISAN. Reports of Istituto Superiore di Sanità (National Institute of Health).
Rome, Italy. 1997, n.23, 1-95.
17. Gunderson, E.L. Dietary intakes of pesticides, selected elements, and other chemicals:
FDA Total Diet Study June 1984-April 1986. J. AOAC Int.1995, 78, 910-921.
Pubblicato da Journal of Environmental Science and Health Part B (2007) 42, 823-833.
19 di 31
18. Gunderson, E.L. FDA Total Diet Study, July 1986-April 1991, dietary intakes
of pesticides, selected elements, and other chemicals.
J. AOAC Int. 1995, 78, 1353- 1363.
Table 1. List of the laboratories participating in the Italian Ready-Meal Residue Project – 2005.
Number Laboratory
1 ARPA Sicily Ragusa
2 ARPA Sicily Palermo
3 ARPA Sicily Catania
4 ARPA Puglia Bari
5 ARPA Campania Napoli
6 ARPA Sardinia Cagliari
7 ARPA Marche Macerata
8 ARPA Tuscany Arezzo
9 ARPA Emilia Romagna Ferrara
10 ARPA Liguria La Spezia
11 ARPA Piemonte Turin
12 ASL Lombardia Bergamo
13 ARPA Veneto Verona
14 ARPA Friuli Venezia Giulia Pordenone
15 ARPA Friuli Venezia Giulia Gorizia
16 APPA Trento
Pubblicato da Journal of Environmental Science and Health Part B (2007) 42, 823-833.
20 di 31
Table 2. The number of pesticides detected in total and separately for each dish.
pesticide first course side dish fruit bread wine total
pirimiphos-methyl 6 14 20
procymidone 6 11 17
cyprodinil 1 2 4 7
iprodione 1 6 7
pyrimethanil 1 6 7
chlorpyrifos 2 4 6
diphenylamine 6 6
diphenylamine 2 3 1 6
chlorpyrifos-methyl 1 3 1 5
metalaxyl 1 4 5
chlorpropham 2 2 4
dichlofluanid 2 1 1 4
bromopropylate 1 2 3
azinphos-methyl 1 1 2
captan 1 1 2
carbaryl 1 1 2
ensodulfan 1 1 2
fludioxonil 1 1 2
imazalil 1 1 2
penconazole 1 1 2
thiabendazole 2 2
chlorothalonil 1 1
diazinon 1 1
dicloran 1 1
dimethoate 1 1
fenhexamide 1 1
phosalone 1 1
kresoxim-methyl 1 1
malathion 1 1
methoxychlor 1 1
myclobutanil 1 1
nuarimol 1 1
2-phenylphenol 1 1
pendimethalin 1 1
piperonyl butoxide 1 1
pirimicarb 1 1
pp-DDD 1 1
prometryn 1 1
tetrachlorvinphos 1 1
tolylfluanid 1 1
Pubblicato da Journal of Environmental Science and Health Part B (2007) 42, 823-833.
21 di 31
Table 3. Average quantity of pesticides found in the meal.
First Course
( g)
Side dish
( g)
Fruit
( g)
Bread
( g)
Wine
( g)
Complete Meal
( g)
0.89
(3.0 %)
0.63
(2.1 %)
23.37
(77.3 %)
0.83
(2.8 %)
4.49
(14.9 %)
30.22
(100 %)
* The figure in brackets is the quantity of pesticides as a percentage of the quantity found in the
complete meal.
Table 4. Ratio of the daily intake per kg of body weight and ADI levels established by the European
Union in document 3010 [13]
.
Maximum
(%)
Average
(%)
Median
(%)
Number
of values
over
100 %
Number
of values
over
50 %
Number
of values
over
10 %
Number
of values
over
1 %
Adult* (60 kg) 73.3 2.6 0.4 0 2 6 37
Teenager** (40 kg) 109.9 4.9 0.6 1 2 7 34
Child** (20 kg) 219.9 9.8 1.2 2 5 14 46
* Comparison between the daily intake per kg of body weight and the ADI was carried out 121
times for an adult.
** Comparison between the daily intake per kg of body weight and the ADI was carried out 84
times (wine was not considered) for a teenager and a child.
Pubblicato da Journal of Environmental Science and Health Part B (2007) 42, 823-833.
22 di 31
Table 5. Ratio of daily intake per kg of body weight and ADI levels established by the Australian
Government [14]
.
Maximum
(%)
Average
(%)
Median
(%)
Number
of values
over
100 %
Number
of values
over
50 %
Number
of values
over
10 %
Number
of values
over
1 %
Adult* (60 kg) 73.3 3.6 0.6 0 1 11 48
Teenager** (40 kg) 109.9 6.9 0.8 1 3 12 36
Child** (20 kg) 219.9 13.8 1.5 3 8 17 48
* Comparison between the daily intake per kg of body weight and the ADI was carried out 121
times for an adult.
** Comparison between the daily intake per kg of body weight and the ADI was carried out 84
times (wine was not considered) for a teenager and a child.
Pub
bli
cato
da
Journ
al o
f E
nv
iron
men
tal
Sci
ence
and
Hea
lth
Par
t B
(20
07
) 42
, 823
-833.
23
di
31
Ta
ble
6.
Res
ult
s fo
r th
e It
alia
n R
eady
-Mea
l R
esid
ue
Pro
ject
wit
h c
alcu
lati
on
of
the
dai
ly i
nta
ke
for
an a
du
lt o
f 60
kg
an
d A
DI
lev
els
esta
bli
shed
by
the
Euro
pea
n U
nio
n.
(1)
(2)
(3)
(4)
(5)
(6)
(7)
(8)
(9)
(10
) (1
1)
(12
) (1
3)
1
2
chlo
rpy
rifo
s
00
13
.50
0
0.0
135
0.0
27
0.0
0045
0.0
14
.50
1
2
dim
etho
ate
00
00
4.7
5
0.0
0475
0.0
095
0.0
00
1583
0.0
02
7.9
2
1
2
fen
itro
thio
n
00
.666
12
.42
00
0
.01
3086
0.0
26
172
0.0
00
4362
0.0
05
8.7
2
1
2
pir
imip
ho
s-m
ethy
l 0
00
10
0
.001
0.0
02
3.3
33
E-0
50
.03
0.1
1
1
2
pro
cym
idone
0
020
.25
00
0
.02025
0.0
405
0.0
00675
0.1
0.6
8
1
3
chlo
rpy
rifo
s
0.5
00
00
0
.0005
0.0
01
1.6
67
E-0
50
.01
0.1
7
1
3
dip
hen
yla
min
e
00
0.2
30
0
0.0
0023
0.0
0046
7.6
67
E-0
60
.08
0.0
1
1
3
pro
cym
idone
0
00
.345
00
0
.00
0345
0.0
0069
0.0
00
0115
0.1
0.0
1
1
4
chlo
rpy
rifo
s
00
14
00
0
.014
0.0
28
0.0
00
4667
0.0
14
.67
1
4
chlo
rpy
rifo
s-m
ethy
l
00
1.4
00
0
.0014
0.0
028
4.6
67
E-0
50
.01
0.4
7
1
4
dip
hen
yla
min
e
00
1.4
00
0
.0014
0.0
028
4.6
67
E-0
50
.08
0.0
6
1
4
met
alax
yl
02
.20
00
0
.0022
0.0
044
7.3
33
E-0
50
.08
0.0
9
1
5
azin
pho
s-m
ethy
l
20
00
0
0.0
02
0.0
04
6.6
67
E-0
50
.00
51
.33
1
6
pir
imip
ho
s-m
ethy
l 0
.1926
50
00
.2181
0
0.0
00
4108
0.0
00
822
1.3
69
E-0
50
.03
0.0
5
1
8
chlo
rpro
ph
am
16
.90
00
0
0.0
169
0.0
338
0.0
00
5633
0.0
51
.13
1
9
azin
pho
s-m
ethy
l
01
.16
00
0
0.0
0116
0.0
0232
3.8
67
E-0
50
.00
50
.77
1
9
chlo
rpy
rifo
s-m
ethy
l
00
2.7
00
0
.0027
0.0
054
0.0
0009
0.0
10
.90
1
9
chlo
rpro
ph
am
052
.20
00
0
.0522
0.1
044
0.0
0174
0.0
53
.48
1
9
cyp
rod
inil
00
00
4
0.0
04
0.0
08
0.0
00
1333
0.0
30
.44
1
9
end
osu
lfan
00
.58
00
11
.25
0
.01183
0.0
2366
0.0
00
3943
0.0
06
6.5
7
1
9
fen
itro
thio
n
00
02
.25
0
0.0
0225
0.0
045
0.0
00075
0.0
05
1.5
0
1
9
flu
dio
xonil
00
00
8.7
5
0.0
0875
0.0
175
0.0
00
2917
0.0
33
0.8
8
1
9
ipro
dio
ne
0
00
075
0
.075
0.1
50
.0025
0.0
64
.17
1
9
pir
imic
arb
0
023
.40
0
0.0
234
0.0
468
0.0
0078
0.0
23
.90
1
9
pir
imip
ho
s-m
ethy
l 0
00
7.8
0
0.0
078
0.0
156
0.0
0026
0.0
30
.87
1
10
carb
ary
l
00
00
10
0
.01
0.0
20
.000
3333
0.0
08
4.1
7
1
11
capta
n
2.6
27
40
00
0
0.0
02
6274
0.0
05
255
8.7
58
E-0
50
.10
.09
Pub
bli
cato
da
Journ
al o
f E
nv
iron
men
tal
Sci
ence
and
Hea
lth
Par
t B
(20
07
) 42
, 823
-833.
24
di
31
(1)
(2)
(3)
(4)
(5)
(6)
(7)
(8)
(9)
(10
) (1
1)
(12
) (1
3)
1
11
chlo
rpro
ph
am
00
.47
16
00
0
0.0
00
4716
0.0
00
943
1.5
72
E-0
50
.05
0.0
3
1
11
dic
hlo
flu
anid
00
01
.032
3.2
5
0.0
04282
0.0
08
564
0.0
00
1427
0.3
0.0
5
1
11
dip
hen
yla
min
e
00
3.9
405
00
0
.003
9405
0.0
07
881
0.0
00
1314
0.0
80
.16
1
12
bro
mop
ropyla
te
14
.80
2.2
10
0
0.0
1701
0.0
3402
0.0
00567
0.0
31
.89
1
13
chlo
roth
alo
nil
0
03
.4496
00
0
.003
4496
0.0
06
899
0.0
00115
0.0
30
.38
1
13
dic
hlo
flu
anid
00
2.2
176
00
0
.002
2176
0.0
04
435
7.3
92
E-0
50
.30
.02
1
13
dic
lora
n
4.2
00
00
0
.0042
0.0
084
0.0
0014
0.0
11
.40
1
13
fen
itro
thio
n
00
5.5
44
00
0
.00
5544
0.0
11
088
0.0
00
1848
0.0
05
3.7
0
1
13
ipro
dio
ne
0
00
010
0
.01
0.0
20
.000
3333
0.0
60
.56
1
13
kre
sox
im-m
ethy
l 0
00
06
.25
0
.00625
0.0
125
0.0
00
2083
0.4
0.0
5
1
13
pen
dim
eth
alin
3
.08
00
00
0
.00308
0.0
0616
0.0
00
1027
0.1
25
0.0
8
1
13
pir
imip
ho
s-m
ethy
l 0
00
1.9
602
0
0.0
01
9602
0.0
0392
6.5
34
E-0
50
.03
0.2
2
1
13
pro
cym
idone
0
00
04
.5
0.0
045
0.0
09
0.0
0015
0.1
0.1
5
1
13
pro
met
ryn
4
.48
00
00
0
.00448
0.0
0896
0.0
00
1493
0.0
11
.49
1
15
cyp
rod
inil
0.0
546
50
00
0.3
25
0
.000
3796
0.0
00
759
1.2
65
E-0
50
.03
0.0
4
1
15
dip
hen
yla
min
e
00
0.0
484
00
4
.838
E-0
59
.68
E-0
51
.613
E-0
60
.08
0.0
0
1
15
py
rim
eth
anil
0
00
01
.775
0
.00
1775
0.0
0355
5.9
17
E-0
50
.17
0.0
3
1
16
pro
cym
idone
0
00
02
.025
0
.00
2025
0.0
0405
0.0
00
0675
0.1
0.0
7
2
1
dip
hen
yla
min
e
00
132
.50
0
0.1
32495
0.2
6499
0.0
04
4165
0.0
85
.52
2
1
imaz
alil
00
169
.73
00
0
.16
9725
0.3
3945
0.0
05
6575
0.0
31
8.8
6
2
1
thia
ben
daz
ole
00
1505
.30
0
1.5
0526
3.0
1052
0.0
50
1753
0.1
50
.18
2
2
pir
imip
ho
s-m
ethy
l 0
00
0.9
0
0.0
009
0.0
018
0.0
0003
0.0
30
.10
2
2
pro
cym
idone
0
02
.09
00
0
.00209
0.0
0418
6.9
67
E-0
50
.10
.07
2
3
carb
ary
l
00
175
.89
00
0
.17589
0.3
5178
0.0
05863
0.0
08
73
.29
2
3
chlo
rpy
rifo
s-m
ethy
l
9.9
60
00
0
0.0
0996
0.0
1992
0.0
00332
0.0
13
.32
2
3
pro
cym
idone
0
00
028
.75
0
.02875
0.0
575
0.0
00
9583
0.1
0.9
6
2
4
capta
n
00
12
00
0
.012
0.0
24
0.0
004
0.1
0.4
0
2
4
chlo
rpro
ph
am
21
.56
00
00
0
.02156
0.0
4312
0.0
00
7187
0.0
51
.44
2
4
pir
imip
ho
s-m
ethy
l 0
00
14
.70
0
.0147
0.0
294
0.0
0049
0.0
31
.63

Pub
bli
cato
da
Journ
al o
f E
nv
iron
men
tal
Sci
ence
and
Hea
lth
Par
t B
(20
07
) 42
, 823
-833.
25
di
31
(1)
(2)
(3)
(4)
(5)
(6)
(7)
(8)
(9)
(10
) (1
1)
(12
) (1
3)
2
4
pro
cym
idone
0
00
06
.5
0.0
065
0.0
13
0.0
00
2167
0.1
0.2
2
2
6
pro
cym
idone
0
01
.80
0
0.0
018
0.0
036
0.0
0006
0.1
0.0
6
2
8
2-p
hen
ylp
hen
ol
1
.5023
20
00
0
0.0
01
5023
0.0
03
005
5.0
08
E-0
50
.40
.01
2
9
dia
zinon
0
01
.73
00
0
.00173
0.0
0346
5.7
67
E-0
50
.00
22
.88
2
9
fen
itro
thio
n
00
.92
00
0
0.0
0092
0.0
0184
3.0
67
E-0
50
.00
50
.61
2
9
pir
imip
ho
s-m
ethy
l 0
00
1.7
60
0
.00176
0.0
0352
5.8
67
E-0
50
.03
0.2
0
2
13
ipro
dio
ne
0
00
01
2.5
0
.0125
0.0
25
0.0
00
4167
0.0
60
.69
2
13
pen
conaz
ole
0
03
.7376
00
0
.003
7376
0.0
07
475
0.0
00
1246
0.0
30
.42
2
15
my
clobu
tan
il
00
00
2.5
0
.0025
0.0
05
8.3
33
E-0
50
.03
0.2
8
2
15
pir
imip
ho
s-m
ethy
l 2
.29
60
00
.8565
0
0.0
03
1525
0.0
06
305
0.0
00
1051
0.0
30
.35
2
15
py
rim
eth
anil
0
00
05
0
.005
0.0
10
.000
1667
0.1
70
.10
2
16
chlo
rpy
rifo
s-m
ethy
l
00
60
0
0.0
06
0.0
12
0.0
002
0.0
12
.00
2
16
pro
cym
idone
0
06
00
0
.006
0.0
12
0.0
002
0.1
0.2
0
3
2
cyp
rod
inil
00
234
.90
0
0.2
349
0.4
698
0.0
0783
0.0
32
6.1
0
3
2
pir
imip
ho
s-m
ethy
l 0
00
7.7
0
0.0
077
0.0
154
0.0
00
2567
0.0
30
.86
3
2
toly
lflu
anid
0
0411
.80
0
0.4
118
0.8
236
0.0
13
7267
0.0
81
7.1
6
3
4
met
alax
yl
00
00
2
0.0
02
0.0
04
6.6
67
E-0
50
.08
0.0
8
3
4
pir
imip
ho
s-m
ethy
l 0
.50
02
.76
0
0.0
0326
0.0
0652
0.0
00
1087
0.0
30
.36
3
4
pro
cym
idone
0
00
01
0
.001
0.0
02
3.3
33
E-0
50
.10
.03
3
4
py
rim
eth
anil
0
00
01
0
.001
0.0
02
3.3
33
E-0
50
.17
0.0
2
3
9
cyp
rod
inil
00
8.3
60
0
0.0
0836
0.0
1672
0.0
00
2787
0.0
30
.93
3
9
flu
dio
xonil
00
13
.20
0
0.0
132
0.0
264
0.0
0044
0.0
33
1.3
3
3
9
ipro
dio
ne
0
00
065
0
.065
0.1
30
.002
1667
0.0
63
.61
3
9
pir
imip
ho
s-m
ethy
l 12
.28
50
04
.20
0
.01
6485
0.0
3297
0.0
00
5495
0.0
31
.83
3
10
chlo
rpy
rifo
s
1.1
04
00
00
0
.001104
0.0
02
208
0.0
00
0368
0.0
10
.37
3
10
dic
hlo
flu
anid
00
0.9
66
00
0
.00
0966
0.0
01
932
0.0
00
0322
0.0
12
50
.26
3
10
pho
salo
ne
0
.82
80
00
0
0.0
00828
0.0
01
656
0.0
00
0276
0.0
20
.14
3
10
nu
arim
ol
00
.27
54
00
0
0.0
00
2754
0.0
00
551
9.1
8E
-06
0.0
21
0.0
4
3
10
pp
-DD
D
00
.18
36
00
0
0.0
00
1836
0.0
00
367
6.1
2E
-06
0.0
10
.06
Pub
bli
cato
da
Journ
al o
f E
nv
iron
men
tal
Sci
ence
and
Hea
lth
Par
t B
(20
07
) 42
, 823
-833.
26
di
31
(1)
(2)
(3)
(4)
(5)
(6)
(7)
(8)
(9)
(10
) (1
1)
(12
) (1
3)
3
10
pro
cym
idone
0
00
075
0
.075
0.1
50
.0025
0.1
2.5
0
3
10
tetr
ach
lorv
inpho
s
1
.38
00
00
0
.00138
0.0
0276
0.0
00046
0.0
50
.09
3
12
met
alax
yl
0
00
07
.5
0.0
075
0.0
15
0.0
0025
0.0
80
.31
3
12
met
hoxy
chlo
r
013
.68
00
0
0.0
1368
0.0
2736
0.0
00456
0.1
0.4
6
3
13
chlo
rpy
rifo
s-m
ethy
l
00
00
8
0.0
08
0.0
16
0.0
00
2667
0.0
12
.67
3
13
ipro
dio
ne
0
00
09
.5
0.0
095
0.0
19
0.0
00
3167
0.0
60
.53
3
14
fen
hex
amid
e 0
00
06
2.5
0
.0625
0.1
25
0.0
02
0833
0.2
1.0
4
3
14
pro
cym
idone
0
00
02
.5
0.0
025
0.0
05
8.3
33
E-0
50
.10
.08
3
14
py
rim
eth
anil
0
00
02
2.5
0
.0225
0.0
45
0.0
0075
0.1
70
.44
3
15
cyp
rod
inil
00
00
1.5
0
.0015
0.0
03
0.0
0005
0.0
30
.17
3
15
met
alax
yl
00
00
9.2
5
0.0
0925
0.0
185
0.0
00
3083
0.0
80
.39
3
15
py
rim
eth
anil
0
00
02
.25
0
.00225
0.0
045
0.0
00075
0.1
70
.04
4
1
chlo
rpy
rifo
s
00
4.9
40
0
0.0
0494
0.0
0988
0.0
00
1647
0.0
11
.65
4
1
fen
itro
thio
n
00
19
.76
00
0
.01976
0.0
3952
0.0
00
6587
0.0
05
13
.17
4
3
pro
cym
idone
0
00
05
0
.005
0.0
10
.000
1667
0.1
0.1
7
4
4
chlo
rpy
rifo
s
00
1.7
10
0
0.0
0171
0.0
0342
0.0
00057
0.0
10
.57
4
4
dip
hen
yla
min
e
00
2.0
52
00
0
.00
2052
0.0
04
104
0.0
00
0684
0.0
80
.09
4
4
mal
ath
ion
00
01
6.0
16
0
0.0
16016
0.0
32
032
0.0
00
5339
0.3
0.1
8
4
4
pip
ero
ny
l bu
tox
ide
00
06
.776
0
0.0
06776
0.0
13
552
0.0
00
2259
0.2
0.1
1
4
4
pir
imip
ho
s-m
ethy
l 1
.44
60
029
.26
0
0.0
30706
0.0
61
412
0.0
01
0235
0.0
33
.41
4
4
pro
cym
idone
0
00
01
.25
0
.00125
0.0
025
4.1
67
E-0
50
.10
.04
4
4
py
rim
eth
anil
0
00
.342
00
0
.00
0342
0.0
00
684
0.0
00
0114
0.1
70
.01
4
6
ipro
dio
ne
0
00
.744
00
0
.00
0744
0.0
01
488
0.0
00
0248
0.0
60
.04
4
6
pir
imip
ho
s-m
ethy
l 0
.646
80
00
.70
0
.001
3468
0.0
02
694
4.4
89
E-0
50
.03
0.1
5
4
6
pro
cym
idone
0
01
.736
00
0
.00
1736
0.0
03
472
5.7
87
E-0
50
.10
.06
4
10
imaz
alil
5.6
25
00
00
0
.00
5625
0.0
1125
0.0
00
1875
0.0
30
.63
4
13
pen
conaz
ole
0
4.1
28
00
0
0.0
04128
0.0
08
256
0.0
00
1376
0.0
30
.46
4
13
thia
ben
daz
ole
00
3.3
09
00
0
.00
3309
0.0
06
618
0.0
00
1103
0.1
0.1
1
4
14
ipro
dio
ne
0
00
02
2.5
0
.0225
0.0
45
0.0
0075
0.0
61
.25
Pub
bli
cato
da
Journ
al o
f E
nv
iron
men
tal
Sci
ence
and
Hea
lth
Par
t B
(20
07
) 42
, 823
-833.
27
di
31
(1)
(2)
(3)
(4)
(5)
(6)
(7)
(8)
(9)
(10
) (1
1)
(12
) (1
3)
4
14
met
alax
yl
00
00
20
0
.02
0.0
40
.000
6667
0.0
80
.83
4
14
pro
cym
idone
0
00
020
0
.02
0.0
40
.000
6667
0.1
0.6
7
4
15
bro
mop
ropyla
te
00
0.0
485
00
4
.851
E-0
59
.7E
-05
1.6
17
E-0
60
.03
0.0
1
4
15
cyp
rod
inil
00
00
0.1
75
0
.00
0175
0.0
0035
5.8
33
E-0
60
.03
0.0
2
4
15
pir
imip
ho
s-m
ethy
l 0
00
0.7
315
0
0.0
00
7315
0.0
01
463
2.4
38
E-0
50
.03
0.0
8
4
15
pro
cym
idone
0
00
07
.5
0.0
075
0.0
15
0.0
0025
0.1
0.2
5
4
15
py
rim
eth
anil
0
00
00
.275
0
.00
0275
0.0
0055
9.1
67
E-0
60
.17
0.0
1
(1)
Sam
ple
; (2
) L
abo
rato
ry c
od
e; (
3)
Pes
tici
de;
(4
) Q
uan
tity
of
pes
tici
de
in f
irst
co
urs
e in
µg;
(5)
Quan
tity
of
pes
tici
de
in s
ide
dis
h
in µ
g;
(6)
Qu
anti
ty o
f p
esti
cid
e in
fru
it i
n µ
g;
(7)
Qu
anti
ty o
f p
esti
cid
e in
bre
ad i
n µ
g;
(8)
Qu
anti
ty o
f p
esti
cid
e in
win
e in
µg
; (9
)
Qu
anti
ty o
f p
esti
cid
e in
mea
l in
mg
; (1
0)
Dai
ly q
uan
tity
(tw
o m
eals
) o
f p
esti
cid
e in
mg
; (1
1)
Dai
ly i
nta
ke
per
kg
of
body
wei
gh
t in
mg
/kg
bw
; (1
2)
AD
I in
mg
/kg
bw
; (1
3)
Rel
atio
nsh
ip b
etw
een
dai
ly i
nta
ke
per
kg
of
bod
y w
eight
and
AD
I in
%.
Pub
bli
cato
da
Journ
al o
f E
nv
iron
men
tal
Sci
ence
and
Hea
lth
Par
t B
(20
07
) 42
, 823
-833.
28
di
31
Ta
ble
7.
Res
ult
s fo
r th
e It
alia
n R
eady
-Mea
l R
esid
ue
Pro
ject
wit
h c
alcu
lati
on
of
the
dai
ly i
nta
ke
for
a ch
ild
of
20
kg
and
AD
I le
vel
s
esta
bli
shed
by
the
Au
stra
lian
Gov
ern
men
t.
(1)
(2)
(3)
(4)
(5)
(6)
(7)
(8)
(9)
(10
) (1
1)
(12
)
12
chlo
rpy
rifo
s
00
13
.50
0
.0135
0.0
27
0.0
0135
0.0
03
45
12
fen
itro
thio
n
0
0.6
66
12
.42
0
0.0
13
086
0.0
26172
0.0
01309
0.0
02
65
.43
12
pir
imip
ho
s-m
eth
yl
00
01
0
.001
0.0
02
0.0
001
0.0
20
.5
12
pro
cym
ido
ne
0
020
.25
0
0.0
2025
0.0
405
0.0
02025
0.0
36
.75
13
chlo
rpy
rifo
s
0.5
00
0
0.0
005
0.0
01
0.0
0005
0.0
03
1.6
6667
13
dip
hen
yla
min
e
00
0.2
30
0
.00
023
0.0
0046
0.0
00023
0.0
20
.115
13
pro
cym
ido
ne
0
00
.345
0
0.0
00
345
0.0
0069
3.4
5E
-05
0.0
30
.115
14
chlo
rpy
rifo
s
00
14
0
0.0
14
0.0
28
0.0
014
0.0
03
46
.6667
14
chlo
rpy
rifo
s-m
eth
yl
0
01
.40
0
.0014
0.0
028
0.0
0014
0.0
11
.4
14
dip
hen
yla
min
e
00
1.4
0
0.0
014
0.0
028
0.0
0014
0.0
20
.7
14
met
alax
yl
02
.20
0
0.0
022
0.0
044
0.0
0022
0.0
30
.73333
15
azin
ph
os-
met
hy
l
20
00
0
.002
0.0
04
0.0
002
0.0
25
0.8
16
pir
imip
ho
s-m
eth
yl
0.1
9265
00
0.2
1811
0
.00041
076
0.0
00822
4.1
1E
-05
0.0
20
.20538
18
chlo
rpro
pham
16
.90
00
0
.0169
0.0
338
0.0
0169
0.0
53
.38
19
azin
ph
os-
met
hy
l
01
.16
00
0
.00
116
0.0
0232
0.0
00116
0.0
25
0.4
64
19
chlo
rpy
rifo
s-m
eth
yl
0
02
.70
0
.0027
0.0
054
0.0
0027
0.0
12
.7
19
chlo
rpro
pham
052
.20
0
0.0
522
0.1
044
0.0
0522
0.0
510
.44
19
endo
sulf
an
00
.58
00
0
.00
058
0.0
0116
0.0
00058
0.0
06
0.9
6667
19
fen
itro
thio
n
0
00
2.2
5
0.0
0225
0.0
045
0.0
00225
0.0
02
11
.25
19
pir
imic
arb
0
023
.40
0
.0234
0.0
468
0.0
0234
0.0
02
117
19
pir
imip
ho
s-m
eth
yl
00
07
.8
0.0
078
0.0
156
0.0
0078
0.0
23
.9
111
cap
tan
2
.6274
00
0
0.0
026
274
0.0
05255
0.0
00263
0.1
0.2
6274
111
chlo
rpro
pham
00
.4716
00
0
.0004
716
0.0
00943
4.7
2E
-05
0.0
50
.09432
111
dic
hlo
flu
anid
00
01
.032
0
.001
032
0.0
02064
0.0
00103
0.0
30
.344
111
dip
hen
yla
min
e
00
3.9
405
0
0.0
039
405
0.0
07881
0.0
00394
0.0
21
.97025
112
bro
mop
ropyla
te
14
.80
2.2
10
0
.01
701
0.0
3402
0.0
01701
0.0
35
.67

Pub
bli
cato
da
Journ
al o
f E
nv
iron
men
tal
Sci
ence
and
Hea
lth
Par
t B
(20
07
) 42
, 823
-833.
29
di
31
(1)
(2)
(3)
(4)
(5)
(6)
(7)
(8)
(9)
(10
) (1
1)
(12
)
113
chlo
roth
alon
il
00
3.4
496
0
0.0
034
496
0.0
06899
0.0
00345
0.0
13
.4496
113
dic
hlo
flu
anid
00
2.2
176
0
0.0
022
176
0.0
04435
0.0
00222
0.0
30
.7392
113
dic
lora
n
4
.20
00
0
.0042
0.0
084
0.0
0042
0.0
70
.6
113
fen
itro
thio
n
0
05
.544
0
0.0
05
544
0.0
11088
0.0
00554
0.0
02
27
.72
113
pen
dim
eth
alin
3
.08
00
0
0.0
0308
0.0
0616
0.0
00308
0.1
0.3
08
113
pir
imip
ho
s-m
eth
yl
00
01
.9602
0
.0019
602
0.0
0392
0.0
00196
0.0
20
.9801
113
pro
met
ryn
4.4
80
00
0
.00
448
0.0
0896
0.0
00448
0.0
31
.49333
115
cypro
din
il
0.0
5465
00
0
5.4
646
E-0
50
.00
0109
5.4
6E
-06
0.0
20
.02732
115
dip
hen
yla
min
e
00
0.0
4838
0
4.8
384
E-0
59
.68
E-0
54
.84
E-0
60
.02
0.0
2419
21
dip
hen
yla
min
e
00
132
.495
0
0.1
32
495
0.2
6499
0.0
1325
0.0
266
.2475
21
imaz
alil
00
169
.725
0
0.1
69
725
0.3
3945
0.0
16973
0.0
356
.575
21
thia
ben
daz
ole
00
1505
.26
0
1.5
0526
3.0
1052
0.1
50526
0.3
50
.1753
22
pir
imip
ho
s-m
eth
yl
00
00
.9
0.0
009
0.0
018
0.0
0009
0.0
20
.45
22
pro
cym
ido
ne
0
02
.09
0
0.0
0209
0.0
0418
0.0
00209
0.0
30
.69667
23
carb
ary
l
00
175
.89
0
0.1
7589
0.3
5178
0.0
17589
0.0
08
219
.863
23
chlo
rpy
rifo
s-m
eth
yl
9
.96
00
0
0.0
0996
0.0
1992
0.0
00996
0.0
19
.96
24
cap
tan
0
012
0
0.0
12
0.0
24
0.0
012
0.1
1.2
24
chlo
rpro
pham
21
.56
00
0
0.0
2156
0.0
4312
0.0
02156
0.0
54
.312
24
pir
imip
ho
s-m
eth
yl
00
01
4.7
0
.0147
0.0
294
0.0
0147
0.0
27
.35
26
pro
cym
ido
ne
0
01
.80
0
.0018
0.0
036
0.0
0018
0.0
30
.6
28
2-p
hen
ylp
hen
ol
1
.50
232
00
0
0.0
0150
232
0.0
03005
0.0
0015
0.4
0.0
3756
29
dia
zinon
0
01
.73
0
0.0
0173
0.0
0346
0.0
00173
0.0
01
17
.3
29
fen
itro
thio
n
0
0.9
20
0
0.0
0092
0.0
0184
0.0
00092
0.0
02
4.6
29
pir
imip
ho
s-m
eth
yl
00
01
.76
0
.00
176
0.0
0352
0.0
00176
0.0
20
.88
213
pen
conaz
ole
0
03
.7376
0
0.0
037
376
0.0
07475
0.0
00374
0.0
07
5.3
3943
215
pir
imip
ho
s-m
eth
yl
2.2
96
00
0.8
565
0
.0031
525
0.0
06305
0.0
00315
0.0
21
.57625
216
chlo
rpy
rifo
s-m
eth
yl
0
06
0
0.0
06
0.0
12
0.0
006
0.0
16
216
pro
cym
ido
ne
0
06
0
0.0
06
0.0
12
0.0
006
0.0
32
32
cypro
din
il
00
234
.90
0
.2349
0.4
698
0.0
2349
0.0
2117
.45
Pub
bli
cato
da
Journ
al o
f E
nv
iron
men
tal
Sci
ence
and
Hea
lth
Par
t B
(20
07
) 42
, 823
-833.
30
di
31
(1)
(2)
(3)
(4)
(5)
(6)
(7)
(8)
(9)
(10
) (1
1)
(12
)
32
pir
imip
ho
s-m
eth
yl
00
07
.7
0.0
077
0.0
154
0.0
0077
0.0
23
.85
32
toly
lflu
anid
0
0411
.80
0
.4118
0.8
236
0.0
4118
0.1
41
.18
34
pir
imip
ho
s-m
eth
yl
0.5
00
2.7
6
0.0
0326
0.0
0652
0.0
00326
0.0
21
.63
39
cypro
din
il
00
8.3
60
0
.00
836
0.0
1672
0.0
00836
0.0
24
.18
39
flud
ioxo
nil
00
13
.20
0
.0132
0.0
264
0.0
0132
0.0
34
.4
39
pir
imip
ho
s-m
eth
yl
12
.285
00
4.2
0
.016
485
0.0
3297
0.0
01649
0.0
28
.2425
310
chlo
rpy
rifo
s
1.1
04
00
0
0.0
01
104
0.0
02208
0.0
0011
0.0
03
3.6
8
310
dic
hlo
flu
anid
00
0.9
66
0
0.0
00
966
0.0
01932
9.6
6E
-05
0.0
30
.322
310
pho
salo
ne
0
.828
00
0
0.0
00
828
0.0
01656
8.2
8E
-05
0.0
06
1.3
8
310
nu
arim
ol
00
.2754
00
0
.0002
754
0.0
00551
2.7
5E
-05
0.0
21
0.1
3114
310
pp
-DD
D
00
.1836
00
0
.0001
836
0.0
00367
1.8
4E
-05
0.0
02
0.9
18
310
tetr
ach
lorv
inph
os
1.3
80
00
0
.00
138
0.0
0276
0.0
00138
0.0
50
.276
312
met
ho
xy
chlo
r
013
.68
00
0
.01
368
0.0
2736
0.0
01368
0.1
1.3
68
41
chlo
rpy
rifo
s
00
4.9
40
0
.00
494
0.0
0988
0.0
00494
0.0
03
16
.4667
41
fen
itro
thio
n
0
019
.76
0
0.0
1976
0.0
3952
0.0
01976
0.0
02
98
.8
44
chlo
rpy
rifo
s
00
1.7
10
0
.00
171
0.0
0342
0.0
00171
0.0
03
5.7
44
dip
hen
yla
min
e
00
2.0
52
0
0.0
02
052
0.0
04104
0.0
00205
0.0
21
.026
44
mal
ath
ion
00
016
.016
0
.016
016
0.0
32032
0.0
01602
0.3
0.5
3387
44
pip
eron
yl
buto
xid
e 0
00
6.7
76
0
.006
776
0.0
13552
0.0
00678
0.1
0.6
776
44
pir
imip
ho
s-m
eth
yl
1.4
46
00
29
.26
0
.030
706
0.0
61412
0.0
03071
0.0
215
.353
44
py
rim
eth
anil
0
00
.342
0
0.0
00
342
0.0
00684
3.4
2E
-05
0.2
0.0
171
46
ipro
dio
ne
0
00
.744
0
0.0
00
744
0.0
01488
7.4
4E
-05
0.0
40
.186
46
pir
imip
ho
s-m
eth
yl
0.6
468
00
0.7
0
.0013
468
0.0
02694
0.0
00135
0.0
20
.6734
46
pro
cym
ido
ne
0
01
.736
0
0.0
01
736
0.0
03472
0.0
00174
0.0
30
.57867
410
imaz
alil
5.6
25
00
0
0.0
05
625
0.0
1125
0.0
00563
0.0
31
.875
413
pen
conaz
ole
0
4.1
28
00
0
.004
128
0.0
08256
0.0
00413
0.0
07
5.8
9714
413
thia
ben
daz
ole
00
3.3
09
0
0.0
03
309
0.0
06618
0.0
00331
0.3
0.1
103
415
bro
mop
ropyla
te
00
0.0
4851
0
0.0
0004
851
9.7
E-0
54
.85
E-0
60
.03
0.0
1617
415
pir
imip
ho
s-m
eth
yl
00
00
.7315
0
.0007
315
0.0
01463
7.3
2E
-05
0.0
20
.36575
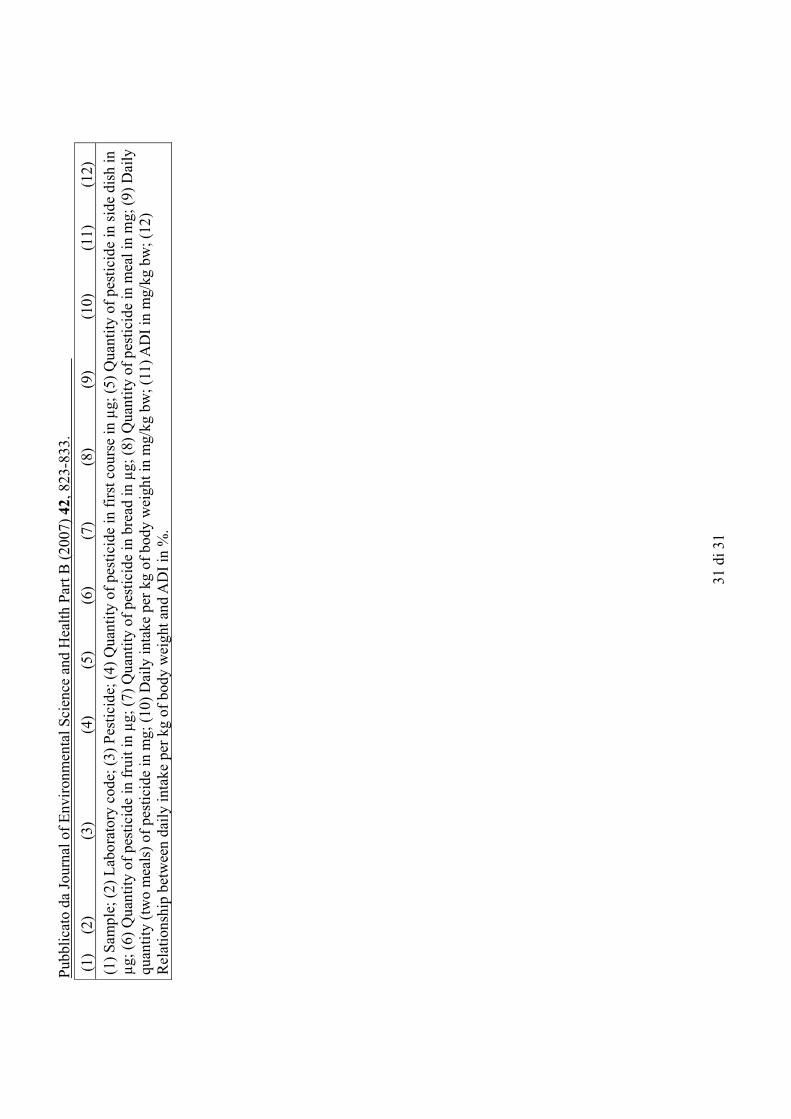
Pub
bli
cato
da
Journ
al o
f E
nv
iron
men
tal
Sci
ence
and
Hea
lth
Par
t B
(20
07
) 42
, 823
-833.
31
di
31
(1)
(2)
(3)
(4)
(5)
(6)
(7)
(8)
(9)
(10
) (1
1)
(12
)
(1)
Sam
ple
; (2
) L
abo
rato
ry c
od
e; (
3)
Pes
tici
de;
(4
) Q
uan
tity
of
pes
tici
de
in f
irst
co
urs
e in
µg
; (5
) Q
uan
tity
of
pes
tici
de
in s
ide
dis
h i
n
µg;
(6)
Qu
anti
ty o
f pes
tici
de
in f
ruit
in
µg
; (7
) Q
uan
tity
of
pes
tici
de
in b
read
in
µg
; (8
) Q
uan
tity
of
pes
tici
de
in m
eal
in m
g;
(9)
Dai
ly
qu
anti
ty (
two
mea
ls)
of
pes
tici
de
in m
g;
(10)
Dai
ly i
nta
ke
per
kg
of
body w
eigh
t in
mg
/kg
bw
; (1
1)
AD
I in
mg/k
g b
w;
(12
)
Rel
atio
nsh
ip b
etw
een
dai
ly i
nta
ke
per
kg
of
body
wei
ght
and
AD
I in
%.