de minimis - fluoride action network
TRANSCRIPT
1
Comments of Objectors Fluoride Action Network, Environmental Working Group, and Beyond Pesticides on the United States
Environmental Protection Agency Proposed Rule to Withdraw Sulfuryl Fluoride Tolerances
Sulfuryl Fluoride: Second Request for Comment on Proposed Order Granting Objections to Tolerances and Denying Request for a Stay
EPA-HQ-OOP-2005-0174; FRL-9343-6
Federal Register, Vol. 77, No. 84, Tuesday, May 1, 2012
Perry E. Wallace, Esq. 631 Symphony Woods Drive
Silver Spring, MD 20901 (301) 593-8260 [email protected] Counsel for Objectors
2
I. Introduction
Objectors Fluoride Action Network (FAN), Environmental Working Group (EWG), and Beyond Pesticides (BP) hereby submit these Comments in response to the United States Environmental Protection Agency’s (EPA) Second Request for Comment on Proposed Order Granting Objections to Tolerances and Denying Request for Stay.1 (EPA Second Request)
Objectors reaffirm their support for EPA’s Proposed Order Granting Objections to Tolerances and Denying Request for a Stay: Sulfuryl Fluoride.2 (Proposed Order) In so doing, and in response to the questions posed in the EPA Second Request, Objectors make the following points, which will be discussed fully in these Comments:
• The FFDCA, as Amended by the FQPA, Does Not Support
Application of the De Minimis Doctrine
o Any Application of the De Minimis Doctrine Must Respect Congress’s Intent that “Aggregate” and “Cumulative” Exposures to Fluoride Be Taken into Account in Administering the FFDCA. Together, These Exposures Are Clearly Not Insignificant.
o The Contribution from SF Exposure Alone Is Not Insignificant,
Given Present Knowledge About Fluoride’s Acute and Chronic Toxicity
• In Enacting the FQPA Congress Intended That EPA Establish
Pesticide Chemical Residue Tolerances by Taking into Account a Full Range of Fluoride Exposures
o The Plain Language of the “Aggregate” and “Cumulative” Terms in the FQPA Reflects a Congressional Intent That the Overall Impact of All Fluoride Exposures on Human Health Be Part of the Determination of Tolerances. The Purposes and Objectives of the FQPA Provide Further Support for the Intent Expressed in the Act’s Plain Language
o The Use of Numerous Provisions in the FQPA Requiring “Aggregate” and “Cumulative” Consideration of Various Fluoride Exposures, as well as the Significant Implications of Those Terms’s Use, Reflects a Congressional Intent that EPA Should
1 Sulfuryl Fluoride; Second Request for Comment on Proposed Order Granting Objections to Tolerances and Denying Request for a Stay,” EPA-HQ-OPP-2005-0174; FRL-9343-6, 77 Fed. Reg.25661 (May 1, 2012) (EPA Second Request), available at http://www.regulations.gov/#!documentDetail;D=EPA-HQ-OPP-2005-0174-0249. 2 Order Granting Objections to Tolerances and Denying Request for a Stay: Sulfuryl Fluoride, EPA-HQ-OPP-2005-0174-0113, 76 Fed. Reg.3422 (Wednesday, January 19, 2011) (Proposed Order), available at http://www.regulations.gov/#!documentDetail;D=EPA-HQ-OPP-2005-0174-0113.
3
Consider the Overall Impact of Fluoride from All Sources. If Congress Had Not Intended for Fluoride Exposures to Be Taken Into Account In Toto, It Would Not Have Used the Terms “Aggregate” and “Cumulative” So Prominently and So Pervasively in the FQPA
• Obligations Under the Montreal Protocol Neither Excuse Nor Diminish EPA’s Obligations under the FQPA. Indeed, the Clean Air Act Provision Incorporating the Protocol into Law Supports the Proper Administration of Those and Other Federal Environmental Laws
o A Treaty-Inspired Law Is, in General, Not Inherently Superior to a Domestically-Initiated Federal Law. Therefore, Any Conflicts or Tensions Between Laws from the Two Categories Must, Absent Special Circumstances, Be Reconciled So as to Promote, to the Greatest Extent Possible, the Interests of Both Laws
o The Montreal Protocol and the Clean Air Act Require the Development of Environmentally Safe Alternatives
• Sulfuryl Fluoride Is a Potent Greenhouse Gas, and This Further
Obligates EPA to Reduce Its Usage
o Sulfuryl Fluoride is a Potent Greenhouse Gas and the Cumulative Effects of Its Continued Use Increase Its Potential for Significant Adverse Impacts
o Prospects for Greenhouse Gas Regulation in the United States Continue to Advance and Thus Sulfuryl Fluoride Could Pose Yet Another Major Environmental Regulatory Challenge
After discussing these points, Objectors present a Conclusion and Recommendations for EPA’s use in making its final decision with respect to the tolerances.
II. The FFDCA, as Amended by the FQPA, Does Not Support Application of the
De Minimis Doctrine The de minimis doctrine, if adopted by EPA in this matter, would empower the
agency to decline to apply the specific requirements of the FQPA to sulfuryl fluoride and fluoride tolerances. By its very nature, such an action would be extraordinary, and it would also be portentous. Indeed, EPA itself agrees that this step would be “precedential regarding other pesticides.”3 It is not surprising, therefore, that applicable law imposes rigorous elements and standards before allowing an agency, in effect, to systematically 3 EPA Second Request, 77 Fed. Reg. 25663.
4
avoid implementation of clear statutory requirements.
The discussion below addresses these elements and standards, concluding that the doctrine is inapplicable to regulatory actions under the FQPA.
A. Elements of Analysis As the EPA Notice observes, the courts have identified three elements that must
be present when an agency adopts a de minimis exception:
• Congress cannot have been “extraordinarily rigid” in setting forth the statutory scheme and providing for its implementation;
• The exception cannot “thwart a statutory command; it must be interpreted with a
view to implementing the legislative design”;
• Regulation under the terms of the statute must (absent application of the doctrine) “yield a gain of trivial or no value.”4
In effect, these elements reflect the high regard that the law accords to the language,
purposes, and objectives of congressional enactments. It is a regard imposed as a fundamental tenet of the American constitutional system, one that applies strictly to the other two governmental branches as they engage with those enactments. These elements must be satisfied before an agency can adopt a de minimis exception that would survive the scrutiny of judicial review.
B. Authoritative Statements about the Creation of De Minimis
Exceptions The courts have provided useful expressions of the contours, limitations, and outcomes of the de minimis exception. The discussion below summarizes some of these pertinent statements.
As the Court of Appeals for the District of Columbia Circuit noted in EDF v. EPA, a fundamental admonition of the courts in reviewing de minimis exceptions is that it “cannot stand if it is contrary to the express terms of the statute.5 In effect, an agency may not "second-guess Congress's calculations.”6 These and other points were made in the guidance provided by the court in Alabama Power Co. v. Costle: 4 EPA Second Request, 77 Fed. Reg. 25663, citing Public Citizen v. FTC, 869F.2d 1541, 1557 n. 33 (D.C. Cir. 1989); Alabama Power Co. v. Costle, 636 F.2d 323, 360 (D.C. Cir. 1979); Public Citizen v. Young, 831 F.2d 1108, 1113 (D.C. Cir. 1987); EDF v. EPA, 82 F.3d 451, 466–467 (D.C. Cir. 1996); and Ohio v. EPA, 997 F.2d 1520, 1534–35 (D.C. Cir. 1993). 5EDF v. EPA, 82 F.3d 451, 466–467 (D.C. Cir. 1996). See, also. Public Citizen v. Young, 831 F.2d 1108 (D.C. Cir. 1987) (rejecting agency's attempt to create de minimis exemption for certain chemicals that caused cancer in animals but posed only minuscule risk to humans, because statute barred listing of chemicals causing cancer ). 6 Shays v. FEC, 414 F.3d 76, 115 (2005), quoting Public Citizen v. FTC, 869 F.F.2d 1541(D.C. Cir. 1989).
5
The ability …to exempt de minimis situations from a statutory command is not an ability to depart from the statute, but rather a tool to be used in implementing the legislative design …While the difference is one of degree, the difference of degree is an important one. Unless Congress has been extraordinarily rigid, there is likely a basis for an implication of de minimis authority to provide exemption when the burdens of regulation yield a gain of trivial or no value. That implied authority is not available for a situation where the regulatory function does provide benefits, in the sense of furthering the regulatory objectives, but the agency concludes that the acknowledged benefits are exceeded by the costs.7
As case law authorities discussed make clear, the extraordinary step by an agency of establishing a de minimis exception will fail where it cannot be demonstrated that such an exception is consistent with--and indeed in furtherance of--Congress’s purposes and objectives in enacting the applicable statute.
These Comments will demonstrate that adoption of a de minimis exception would lack the proper legal foundation set out in case law, and such a step would also introduce an avenue for avoidance of EPA’s statutory mandate under the FQPA of unknown implications. This, in turn, would render that action vulnerable to reversal by a federal court.
C. Standard of Judicial Review and Burden of Proof 1. Standard of Judicial Review The adoption by EPA of a de minimis exception “does not escape judicial
scrutiny.”8 The federal courts are empowered, in appropriate circumstances, to review final administrative actions of that agency and others under the standard set forth in the Administrative Procedure Act (APA). But those decisions must possess a proper evidentiary and legal foundation: "Unless [EPA] describes the standard under which [it] has arrived at this conclusion, supported by a plausible explanation, we have no basis for exercising our responsibility to determine whether [EPA's] decision is arbitrary, capricious, an abuse of discretion, or otherwise not in accordance with law."9
Objectors will demonstrate in these Comments that there is no basis for the creation of a de minimis exception for sulfuryl fluoride tolerances. And therefore any such attempt by EPA to do so could be successfully overturned by a federal court.
7 Alabama Power Co., 636 F.2d 360-61. 8 Ober v. Whitman, 243 F.3d 1190, 1195 (2001). 9 American Lung Ass'n v. EPA, 328 U.S. App. D.C. 232, 134 F.3d 388, 392-93 (D.C. Cir. 1998).
6
2. Burden of Proof
EPA would bear the burden of proof that its decision to adoption a de minimis rule is a valid exercise of its authority and discretion. As the court stated in Alabama Power Co.:
Determination of when matters are truly de minimis naturally will turn on the assessment of particular circumstances, and the agency will bear the burden of making the required showing.10
Objectors’ position in these Comments is that there is no basis, either in law or in fact, for EPA to fashion a de minimis exception to its duties under applicable law with regard to sulfuryl fluoride. Accordingly, EPA cannot meet the burden of proof required by law in proceeding with such an action.
D. Any Application of the De Minimis Doctrine Must Respect Congress’s Intent that “Aggregate” and “Cumulative” Exposures to Fluoride Be Taken Into Account in Administering the FFDCA. Together, These Exposures Are Clearly Not Insignificant.
In order to provide proper emphasis and treatment as to this important issue,
Objectors’ position regarding the meaning of the terms “aggregate” and “cumulative” in the FQPA is discussed separately in Section III of these Comments.
E. The Contribution from SF Exposure Alone Is Not Insignificant, Given Present Knowledge About Fluoride’s Acute and Chronic Toxicity
1. Acute Fluoride Toxicity Is a Significant Health Threat
Despite claims to the contrary, the sulfuryl fluoride tolerances are not a de
minimis source of fluoride exposure. This is evident when considering the risk that the tolerances create for episodes of acute fluoride toxicity.11 Acute fluoride toxicity causes nausea, stomach pain, vomiting, headache, fatigue, and other flu-like symptoms. As Objectors have long maintained, foods fumigated with sulfuryl fluoride can produce doses of fluoride in a single sitting that are sufficient to produce these effects of acute toxicity.
Although EPA is to be credited for its proposed order to phase out the tolerances,
the current challenges that this order faces may be the result of the agency’s failure to fully examine and explain the threat of acute fluoride toxicity that the tolerances create. In this section, therefore, Objectors will reiterate and expand upon their previous discussions concerning the risk of acute toxicity posed by the tolerances.
10 Alabama Power Co., 636 F.2d 360. 11 The references for all in-text citations throughout this brief are provided in the Appendix.
7
Our analysis begins first by explaining the errors that led EPA to forego conducting a risk assessment for acute fluoride toxicity. In its March 4, 2005 notice of filing of Dow’s petition to establish tolerances for sulfuryl fluoride, the EPA stated that the lowest dosage that can cause acute fluoride toxicity is 5 mg/kg, but that this dosage only applies “for the lowest third percentile of the infant population.” (EPA 2005). There are two demonstrable errors with this assertion.
First, the 5 mg/kg threshold, known as the “Probable Toxic Dose” (PTD) is not limited to infants. The PTD was established by Gary Whitford in 1987 based on the reported death of a 2-year-old child, and Whitford applied it to children of all ages. (Whitford 1987). In fact, the word “infant” does not appear once in Whitford’s discussion of the PTD.
Second, acute fluoride toxicity can be caused at dosages that are far lower than the PTD. The PTD is the dosage that can cause “death”; thus, as Whitford has explained, “even if it is only suspected that 5 mg F/kg has been ingested, it should be assumed that an emergency exists and that immediate treatment and hospitalization are required.” (Whitford 1990). The dosage that can kill a child is, as one would expect, higher than the dosage that can cause the early symptoms of acute fluoride toxicity, including nausea, stomach pain, vomiting, and headache. Whitford, in fact, specifically warned that dosages below 5 mg/kg should not be considered “innocuous.” (Whitford 1990). Consistent with Whitford’s warning, numerous studies have documented the occurrence of acute fluoride toxicity at dosages well below 5 mg/kg. In 1980, Spoerke showed that acute fluoride toxicity, including nausea, vomiting, and diarrhea, regularly occurred at dosages lower than 1 mg/kg. In 1982, Eichler showed that dosages less than 0.5 mg/kg can cause nausea, vomiting, and fatigue. In 1994, a study in the New England Journal of Medicine showed that a dosage as low as 0.3 mg/kg caused nausea, vomiting, abdominal pain, diarrhea, and headache. (Gessner 1994). And, in 1997, Akiniwa discussed a range of studies where acute fluoride toxicity occurred at dosages as low as 0.1 mg/kg.
A third error underlying EPA’s decision to forego an acute risk assessment is the agency’s assertion that the poisonings periodically caused by malfunctioning water fluoridation equipment involved “extremely high concentrations” of fluoride that “fall far outside the realm of expected exposures” from sulfuryl fluoride fumigation. (EPA 2006). This statement is, again, incorrect. Gessner’s study in the New England Journal of Medicine found that the water fluoridation accident in Hooper Bay, Alaska, caused acute fluoride poisoning at dosages as low as 0.3 mg/kg. (Gessner 1994). In Akiniwa’s comprehensive 1997 review, Gessner’s findings were found to be consistent with the findings of other studies on fluoridation accidents. (Akiniwa 1997). A subsequent study, published in Public Health Reports, further buttresses this conclusion. (Penman 1997). The study, which examined a fluoridation accident in Mississippi, found that adults (average age = 29) who drank less than one glass of water with 48 ppm fluoride suffered “acute nausea, vomiting, abdominal cramps, or diarrhea” as well as “headaches,” and “burning sensations in the throat or chest.” The authors estimated that the total ingested dose producing these symptoms was just 5 to 9 mg. Assuming an average body weight of

8
70 kg, this represents a toxic dosage ranging from just 0.07 to 0.13 mg/kg, or an average dosage of 0.1 mg/kg.
Based on these studies, it is clear that fluoride can cause acute toxicity at dosages as low as 0.1 to 0.3 mg/kg. This is significant because, as Objectors will demonstrate, these dosages can be produced by consumption of foods fumigated with sulfuryl fluoride. This is particularly evident with respect to both dried eggs and wheat flour. We begin first with the 900 ppm tolerance for dried eggs.
As can be seen in the following table, the consumption of just 2 fumigated dried eggs with allowable levels of fluoride residue produces a dose of 22.5 mg of fluoride, while the consumption of 4 fumigated dried eggs produces a dose of 45 mg/day. When converted into dosages, both of these doses would be more than sufficient to produce acute symptoms in the average weighing adult (70 kg). Specifically, a dose of 22.5 mg would produce a dosage of 0.32 mg/kg, while a dose of 45 mg would produce a dosage of 0.64 mg/kg. The problem, of course, would be even more severe for children. According to the CDC, the average six-year-old weighs about 20 kg.12 If a six-year-old child were to consume two fumigated dried eggs, the dosage would exceed 1 mg/kg. This is up to 10 times greater than the dosage that can cause acute fluoride toxicity.
Risk of acute fluoride toxicity posed by fumigated dried eggs Data on which calculations are based
F residue level in dried eggs* 900 ppm or 900 mg/kg Average weight of one large fresh egg: 50 g (American Egg Board 2005) Conversion factor from dried egg to fresh egg:
1 part by weight dried egg to 3 parts by weight water (USDA 2003; American Egg Board 2005)
USDA standard serving size: 2 eggs 90th percentile large serving: 4 eggs (FDA 1995; 90th percentile is double
the mean)
Calculations 12.5 g dried egg mixed with 37.5 g water gives 50 g reconstituted egg 12.5 g X 900 mg/kg X 0.001 kg/g = 11.25 mg per fresh egg equivalent
2 egg equivalents X 11.25 mg/egg equivalent = 22.5 mg fluoride per serving 4 egg equivalents X 11.25 mg/egg equivalent = 45 mg fluoride per serving
* Our calculation is based on whole dried eggs. These are the types of eggs most likely to be used as a direct replacement for fresh eggs in recipes like scrambled eggs and omelets.
The risk of acute fluoride toxicity also exists with the 125 ppm tolerance for wheat flour. As we will demonstrate here, this concentration is sufficient to induce acute
12 All childhood weight data provided herein are based on the Centers for Disease Control’s “Clinical Growth Charts,” available online at: http://www.cdc.gov/growthcharts/clinical_charts.htm.
9
fluoride toxicity in children eating just two slices of bread or a single serving of pancakes. Although we recognize that Dow’s field tests have reported the average residue level on wheat flour to be 31.4 ppm, it is inappropriate to assess the risk of acute toxicity on the basis of the average level. According to EPA, “using average values is inappropriate for acute risk assessments . . . because in assessing acute exposure situations it matters how much of each treated food a given consumer eats in the short-term and what the residue levels are in the particular foods consumed.”13 (EPA 2011). Our calculations here, therefore, focus mainly on EPA’s 125 ppm tolerance level. Nevertheless, we will also demonstrate that the risk of acute fluoride toxicity exists even with respect to wheat flour fumigated at the average level of 31 ppm. We begin first with bread.
According to the USDA, a typical slice of bread contains 14.75 grams of wheat flour. (USDA 2008). If this typical slice is made with fumigated wheat flour, it would contain 1.84 mg of fluoride; two slices would contain 3.68 mg. If consumed by a three-year old child (average weight = 15 kg), these doses would be sufficient to cause acute fluoride toxicity (dosage range = 0.1 - 0.24 mg/kg). The situation would be even worse for breads containing more than 14.75 grams of flour. A quick search on the internet shows that it is not infrequent for bread to contain over 20 grams of wheat flour per slice. In bread containing 20 grams of wheat flour per slice, two slices of the bread would contain 5 mg of fluoride if made with fumigated flour. A 3-year-old child consuming these two slices would receive a dosage of 0.33 mg/kg; a 6-year-old child would receive a dosage of 0.25 mg/kg. Both of these dosages are sufficient to cause acute fluoride toxicity in some children.
A similar poisoning danger exists with other common types of wheat products, including pasta or pancakes. A review of online pasta and pancake recipes shows that it is common for a single serving to use a half-cup of flour. According to the USDA, a half cup of flour equals 60 grams. If these 60 grams were fumigated with sulfuryl fluoride at the allowable level, the resulting dose from a single serving of pasta or pancakes would be 7.5 mg. If consumed by the average weighing 6-year-old child (20 kg), this would produce a dosage of 0.375 mg/kg. Again, this is more than sufficient to cause acute fluoride toxicity.
The risk of acute fluoride toxicity from consuming fumigated flour in pasta or pancakes exists even where the flour contains the average residue level of 31.4 ppm. Sixty grams of this flour would contain 1.88 mg. If this were consumed by the average-weighing 5 year old child (18.2 kg), or the 25th percentile 6-year old child (18.8 kg), the resulting dosage would equal or exceed 0.1 mg/kg.
Based on these calculations, it is evident that food fumigated with legally allowable levels of sulfuryl fluoride can cause food poisoning in the form of acute fluoride toxicity. Such poisoning incidents can hardly be described as de minimis,
13 Although the EPA stated “it is unlikely that a person would consume at a single meal multiple food components bearing high-end residues,” this observation does not apply to our calculations since they are limited to single food components: wheat flour and dried eggs.
10
particularly since children (due to their low bodyweights) will be the primary population at risk for such incidents. Accordingly, because EPA has no authority to carve out a de minimis exception if enforcement of the FQPA produces a gain of more than trivial value, the risk of acute fluoride toxicity provides a sufficient basis, without more, to bar the exercise of the de minimis doctrine in this case.
2. Chronic Fluoride Toxicity Is a Significant Health Threat The risk of acute fluoride toxicity is not the only reason the EPA should reject the
claim in some comments that the tolerances are a de minimis source of fluoride. For example, in considering Dow’s current contention that sulfuryl fluoride can be safely added to our nation’s food supply in small amounts, it is worth noting Dow’s previous statements on this subject. In 1963, Dow stated that:
"Under no conditions should sulphuryl fluoride be used on raw agricultural food commodities, or on foods, feeds or medicinals destined for human or animal consumption.” (Bond 1984) (emphasis added).
It is also worth noting that this remains the clear prevailing view of nearly all
western, industrialized countries, even those that have approved the use of sulfuryl fluoride as a fumigant in food processing facilities. As summarized by Dow scientists in 2010:
"ProFume is currently approved on emptied flour mills and emptied silos in the following European countries: Austria, Belgium, Germany, France, Greece, Italy, Ireland, Switzerland and UK . . . ."14
Not only does Europe require the removal of all food products prior to
fumigation, it also requires measures to ensure that fluoride residues on the mill machinery do not contaminate food when production resumes. According to a 2010 risk assessment from the European Food Safety Authority (EFSA):
“Even though uses on the fumigation of food items (dried fruits, nuts) were withdrawn during the peer review procedure and only uses for structural treatments remain, there is still the potential for consumer exposure to inorganic fluoride through contaminated products, such as flour and bran that remained in the mill machinery during fumigation, or grain stored in silos in the mill. Available data show that high fluoride residue levels in flour and bran occurred after the production in a treated mill structure had been taken up again. Therefore, if in practice contamination per se cannot be avoided, then measures to avoid contaminated cereal products entering the food chain are necessary.” (EFSA 2010) (emphasis added).
In accord with the EFSA report, the UK government has imposed the following
terms of use on ProFume’s Product Label:
14 http://pub.jki.bund.de/index.php/JKA/article/download/635/1558.
11
Emptying and cleaning Mills: The mills should be emptied of flour and cleaned. Mill machinery
should be run to remove flour retained within the equipment. Flour storage areas and connecting pipes should be emptied or effectively sealed. Bagged flour must be removed to prevent gas penetration.
Contact of ProFume with flour should be avoided.
Food Processing and Storage Facilities: The food processing facility should be emptied of product and cleaned. Food processing machinery should be free of food material within the equipment. Food storage areas, machinery, equipment and connecting pipes should be opened up and or effectively sealed or emptied. All packaged food material including raw ingredients and finished products must be removed or sealed to prevent gas penetration.
Contact of ProFume with other food material should be avoided.
Re-Starting the Mill
Mills: Flour and bran produced in the first flush (i.e. the 10 minutes after restart of full flow of flour) must be collected and sent for disposal/discarded. The next 50 minutes of production must be collected and recycled through the production process. Discarded flour must not be used for human or animal consumption.
Food Processing Facilities: All production lines must be inspected and any residual food material collected and sent for disposal/discarded. Discarded material must not be used for human or animal consumption.15 Canada has taken a similar approach. As EPA noted in its Proposed Order,
“Canada has imposed restrictions on the use of sulfuryl fluoride for the fumigation of food processing facilities that are designed to insure that no residues result in food." (Emphasis added)
The notion, therefore, that contaminating foods with sulfuryl fluoride is merely a de minimis matter has been implicitly, if not explicitly, rejected by most western nations. The consensus among these nations is that the marginal increase in costs associated with removing all food prior to fumigation is not sufficient to justify allowing sulfuryl fluoride to enter the food supply. EPA’s proposed order is consistent with this consensus.
It is particularly important that sulfuryl fluoride not be added to food in the United States because, unlike children in the European countries that disallow food-based tolerances, children in the United States have extensive exposure to fluoride from 15 This text is taken from ProFume’s product label in the UK, available online at http://msdssearch.dow.com/PublishedLiteratureDAS/dh_044a/0901b8038044aaac.pdf?filepath=/uk/pdfs/noreg/011-01325.pdf
12
fluoridated drinking water. Indeed, according to the EPA’s latest document on fluoride exposure, children in the United States are already being chronically overexposed to fluoride. Based on the most recent data, “some children drinking water at the 90th percentile intake level up to about age 7 are being exposed to fluoride on a daily basis at levels at or higher than estimated acceptable intake levels when the concentration of fluoride in their drinking water is at or above 0.87 mg/L.” (EPA, 2010b, p.104). Even if all municipal water systems were to lower the level of fluoride to 0.7 mg/L, as has been suggested recently by the Department of Health and Human Services, the upper limit (UL) for fluoride exposure (IOM, 1997) would still be exceeded by about 10% of children under the age of 4 years, even without any contribution from sulfuryl fluoride.16 (EPA, 2010b, Table 7-1, p.98 and Table 8-2, p.104).
Reflecting this over-exposure, the latest national survey by the CDC found that 41% of American adolescents now have dental fluorosis (Beltrán-Aguilar et al., 2010). This includes 8.6% with mild dental fluorosis (up to 50% of enamel impacted) and 3.6% with moderate or severe dental fluorosis (100% of the enamel impacted). The latter category is recognized by the NAS as an adverse health effect. (NRC, 2006) The rate of moderate/severe fluorosis is highest among African American and Mexican American children (Beltrán-Aguilar, et al., 2005, tbl. 23), which implicates EPA’s stated policy goals regarding environmental justice.17 There is a reasonable expectation that even a small additional contribution of fluoride from sulfuryl fluoride residues will lead some children to develop severe dental fluorosis who would not otherwise develop this adverse health effect. Accordingly, there is simply no safe room for the additional exposure to fluoride that will result from sulfuryl fluoride tolerances.
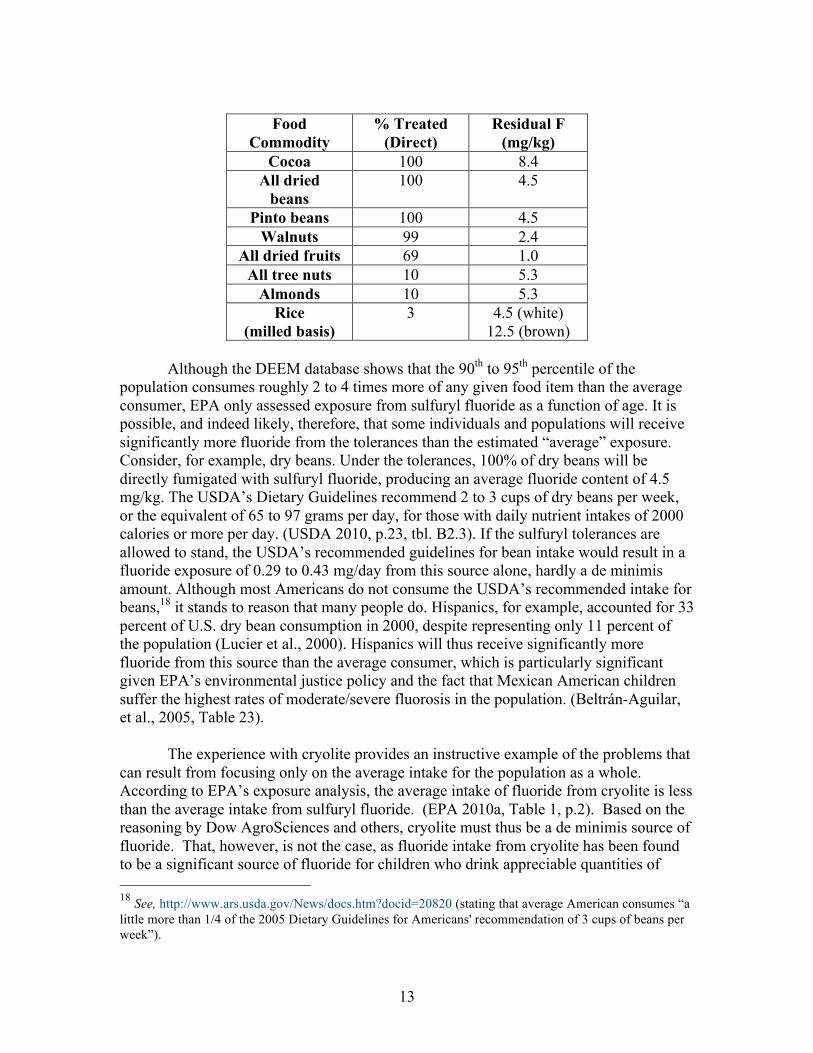
Although the fluoride intake from sulfuryl fluoride may appear small when averaged across all consumers, it can provide a significant source of fluoride exposure for those with high intakes of foods with high fumigation rates. The EPA anticipates, for example, that 100% of cocoa powder, 100% of pinto beans, 100% of dried beans, 99% of walnuts, 69% of dried fruits, 10% of almonds, and 3% of rice will be fumigated with sulfuryl fluoride if the tolerances are not withdrawn. As Dow’s field test data shows, the average fluoride concentration of these crops when fumigated ranges from 1 to 12.5 ppm.
16 Children whose drinking water naturally contains more fluoride than is used for artificial fluoridation will obviously be even more prone to suffering from dental fluorosis and other fluoride related adverse effects, especially if sulfuryl fluoride continues to contribute to the total daily fluoride intake: “Children in communities that routinely exceed the SMCL for fluoride during the period when their teeth are forming will be particularly vulnerable to developing severe dental fluorosis.” (EPA, 2010b, p.106). 17 See http://www.epa.gov/environmentaljustice/ (“Environmental Justice is the fair treatment and meaningful involvement of all people regardless of race, color, national origin, or income with respect to the development, implementation, and enforcement of environmental laws, regulations, and policies. EPA has this goal for all communities and persons across this Nation. It will be achieved when everyone enjoys the same degree of protection from environmental and health hazards and equal access to the decision-making process to have a healthy environment in which to live, learn, and work.”).
13
Food
Commodity % Treated
(Direct) Residual F
(mg/kg) Cocoa 100 8.4
All dried beans
100 4.5
Pinto beans 100 4.5 Walnuts 99 2.4
All dried fruits 69 1.0 All tree nuts 10 5.3
Almonds 10 5.3 Rice
(milled basis) 3 4.5 (white)
12.5 (brown)
Although the DEEM database shows that the 90th to 95th percentile of the population consumes roughly 2 to 4 times more of any given food item than the average consumer, EPA only assessed exposure from sulfuryl fluoride as a function of age. It is possible, and indeed likely, therefore, that some individuals and populations will receive significantly more fluoride from the tolerances than the estimated “average” exposure. Consider, for example, dry beans. Under the tolerances, 100% of dry beans will be directly fumigated with sulfuryl fluoride, producing an average fluoride content of 4.5 mg/kg. The USDA’s Dietary Guidelines recommend 2 to 3 cups of dry beans per week, or the equivalent of 65 to 97 grams per day, for those with daily nutrient intakes of 2000 calories or more per day. (USDA 2010, p.23, tbl. B2.3). If the sulfuryl tolerances are allowed to stand, the USDA’s recommended guidelines for bean intake would result in a fluoride exposure of 0.29 to 0.43 mg/day from this source alone, hardly a de minimis amount. Although most Americans do not consume the USDA’s recommended intake for beans,18 it stands to reason that many people do. Hispanics, for example, accounted for 33 percent of U.S. dry bean consumption in 2000, despite representing only 11 percent of the population (Lucier et al., 2000). Hispanics will thus receive significantly more fluoride from this source than the average consumer, which is particularly significant given EPA’s environmental justice policy and the fact that Mexican American children suffer the highest rates of moderate/severe fluorosis in the population. (Beltrán-Aguilar, et al., 2005, Table 23).
The experience with cryolite provides an instructive example of the problems that
can result from focusing only on the average intake for the population as a whole. According to EPA’s exposure analysis, the average intake of fluoride from cryolite is less than the average intake from sulfuryl fluoride. (EPA 2010a, Table 1, p.2). Based on the reasoning by Dow AgroSciences and others, cryolite must thus be a de minimis source of fluoride. That, however, is not the case, as fluoride intake from cryolite has been found to be a significant source of fluoride for children who drink appreciable quantities of 18 See, http://www.ars.usda.gov/News/docs.htm?docid=20820 (stating that average American consumes “a little more than 1/4 of the 2005 Dietary Guidelines for Americans' recommendation of 3 cups of beans per week”).
14
white grape juice (due to the high quantities of fluoride residues on white grapes). (Stannard 1991). Accordingly, the focus on the overall average intake of fluoride from cryolite or, in this case sulfuryl fluoride, loses sight of the fact that when the data is appropriately analyzed to focus on high-end consumption of specific food items, the intake can become quite meaningful and significant.
Finally, EPA based its proposed order on the premise that dental fluorosis is the only health effect of concern from exposure to fluoride. This premise, however, is an increasingly untenable one. A growing body of evidence indicates that fluoride can cause a range of other adverse effects, including damage to the developing brain. Indeed, a recently published meta-analysis of 27 published studies by a team of Harvard scientists reports that children in high fluoride areas have significantly lower IQ scores than those in low fluoride areas (Choi et al., 2012). One recent study (Ding et al., 2011) found significant negative associations with children’s IQ based on individual-level measures of exposure at relatively low levels of fluoride (0.24-2.84 mg/L). Other studies reviewed by the Harvard team, including many studies that have yet to be considered by the EPA, have found IQ reductions in children drinking water with 0.88 ppm (Lin 1991); 1.75 ppm (Xiang 2003a,b), 1.8-3.9 ppm (Xu 1994); 2.0 ppm (Yao 1996, 1997); 2.1-3.2 ppm (An 1992); 2.38 ppm (Poureslami 2011); 2.45 ppm (Eswar 2011); 2.5 ppm (Seraj 2006); 2.85 ppm (Hong 2001); 2.97 ppm (Wang 2001, Yang 1994); 3.15 ppm (Lu 2000); 4.12 ppm (Zhao 1996). Objectors have recently translated many of the Chinese studies relied upon by the Harvard team and will be providing these studies in a supplemental submission to these Comments. As the Harvard team points out, “dose-response differences in test scores [have] occurred at a wide range of water-fluoride concentrations,” and the “results suggest that fluoride may be a developmental neurotoxicant that affects brain development at exposures much below those that can cause toxicity in adults.” (Choi et al 2012). In light of the FQPA’s clear command to protect infants and children from developmental neurotoxicity, the research on fluoride and IQ calls for greater precaution with current fluoride policies and strongly counsels against EPA’s exercise of the de minimis option.
In this discussion of acute and chronic fluoride toxicity, Objectors have offered arguments and evidence demonstrating that sulfuryl fluoride exposure can cause serious health effects. Therefore, the imposition of a de minimis exception would perpetuate a very real danger to the public health.
15
III. In Enacting the FQPA Congress Intended That EPA Establish Pesticide Chemical Residue Tolerances by Taking into Account a Full Range of Fluoride Exposures A. The Plain Language of the “Aggregate” and “Cumulative” Terms in
the FQPA Reflects a Congressional Intent That the Overall Impact of All Fluoride Exposures on Human Health Be Part of the Determination of Tolerances. The Purposes and Objectives of the FQPA Provide Further Support for the Intent Expressed in the Act’s Plain Language
The “plain language” of the FQPA requires that “aggregate” and “cumulative”
exposures to sulfuryl fluoride and fluoride must be considered in establishing tolerances for pesticide chemical residues. These terms are set forth clearly and prominently in the Act, and they are integral components of the congressional formulation to provide the public health protections that are the act’s principal objective. In this matter, the work of statutory interpretation is simple and basic: “Courts must presume that a legislature says in a statute what it means and means in a statute what it says there."19
Congress made clear its strong interest in protecting public health by amending the FFDCA to provide, in Section 408(a)(1), that “any pesticide chemical residue in or on a food shall be deemed unsafe” unless it meets the specific, strict requirements of that statute. For a tolerance (establishing an acceptable level for a pesticide chemical residue) to be “safe” (and thus be available for use in or on food), it must meet an exacting test: [T]he term ‘‘safe’’, with respect to a tolerance for
a pesticide chemical residue, means that the Administrator has determined that there is a reasonable certainty that no harm will result from aggregate exposure to the pesticide chemical residue, including all anticipated dietary exposures and all other exposures for which there is reliable information.20 (Emphasis added)
This language is plain and clear: Tolerance determinations, in inquiring whether a
pesticide chemical residue is “safe,” must take into account “aggregate exposure … including all anticipated dietary exposures and all other exposures.” Further, when this language is given context, in terms FQPA objectives of strict public health protections, Congress’s reason for supplying this specific, additional language becomes even more evident. Similarly, Congress clearly meant to include “cumulative” effects of fluoride exposures in the tolerance determination process. Significantly, Congress invoked this term in the context of its prescriptions, in FFDCA Section 408(b)(2)(C), regarding
19 Connecticut Nat'l Bank v. Germain. 20 FFDCA Sec. 408(b)(2)(A)(ii), 7 USC §346a(b) )(2)(A)(ii).
16
“Exposure of infants and children.”21 In establishing a scheme for protection of the health of this sensitive and vulnerable sub-group, that section requires that such cumulative effects be among the “risks” to be assessed: [T]he Administrator—(i) shall assess the risk of the pesticide chemical
residue based on … (III) available information concerning the cumulative effects on infants and children of such residues and other substances that have a common mechanism of toxicity.22 (Emphasis added)
In the instance of both terms, only a tortured interpretation of their use in this
statute—one that ignored both the plain language and the congressional purpose—would yield any other conclusion than the one supported by Objectors. Not to respect such express language and purposes would be to run afoul of a venerable old canon of statutory construction that statutes should be construed “so as to avoid rendering superfluous” any statutory language”23:
[Courts should] give effect, if possible, to every clause and word of a statute, avoiding, if it may be, any construction which implies that the legislature was ignorant of the meaning of the language it employed.24
The discussion below will provide additional support for Objectors’s position on the proper interpretation of the two terms. In particular, this position has also been expressed by numerous federal governmental officials with responsibility relative to the FQPA, as well as in EPA interpretations.
1. Executive Branch and Congressional Statements Attest to the Role and Relevance of the “Aggregate” and “Cumulative” Terms
a. Congressional Hearing on Implementation of the Food Quality Protection Act
On June 25, 1998, the Subcommittee on Department Operations, Nutrition, and Foreign Agriculture, of the House of Representatives Committee on Agriculture, held hearings entitled “Implementation of the Food Quality Protection Act.”25 The colloquy between EPA Deputy Administrator Fred Hansen and Subcommittee Chairman Robert Goodlatte reveals how governmental officials in the federal legislative and executive 21 FFDCA Sec. 408(b)(2)(A)(ii), 7 USC §346a(b) )(2)(A)(ii). 22 FFDCA Sec. 408(b)(2)(C)(i)(III), 7 USC §346a(b) )(2)(C)(i)(III). 23 Astoria Federal Savings & Loan Ass’n v. Solimino, 501 U.S. 104, 112 (1991). 24 Montclair v. Ramsdell, 107 U.S. 147, 152 (1883). See also, Bailey v. United States, 516 U.S. 137, 146 (1995) 25 Testimony of Fred Hansen, EPA Deputy Administrator, “Implementation of the Food Quality Protection Act,” before the Subcommittee on Department Operations, Nutrition,and Foreign Agriculture, of the House of Representatives Committee on Agriculture, June 25, 1998, available at
17
branches have long perceived the legislative intent regarding the scope of fluoride sources to be taken into account under FQPA:
[Mr. Goodlatte, Chairman] In a document that the EPA published on January 31, 1997, PR Notice 97–1, the EPA states that in addition to dietary exposure, such sources as drinking water, residential and lawn care use need to be considered
[Mr. Hansen] Mr. Chairman, as I think all of you are well aware, the Food Quality Protection Act provides for significant new changes in several areas and let me be clear. It provides for a clearly expressed additional protection for children. It provides for looking at non-residential and residential exposures along with drinking water exposures, beyond the typical, or beyond the more traditional, places where our analyses had previously been provided for under law in terms of the dietary exposure.
b. Statement of EPA Assistant Administrator Lynn R. Goldman
The exchange between Mr. Goodlatte and Mr. Hansen, whose testimony was given under oath, reflected a commonly held interpretation of EPA’s mandate to consider aggregate sources and cumulative effects in its tolerance decisionmaking. A further example of this view appeared in a letter published in the Wall Street Journal and written by EPA Assistant Administrator Lynn R. Goldman. Written just two months after the FQPA was signed into law, Dr. Goldman’s letter sheds light on the historical rationale for the broader, more inclusive approach to fluoride adopted in the FQPA:
Many of the provisions of the new law grew out of the 1993 National Academy of Sciences report “Pesticides in the Diet of Infants and Children.” That report noted that children may be more susceptible to the effects of pesticide residues than adults, and recommended that the EPA consider using extra safety factors to account for this when setting legal limits for pesticides in foods. The authors also recommended that the EPA consider all routes of exposure to a pesticide, and exposure to chemicals with a common mode of action.26 (Emphasis added)
2. Agency Interpretations Attest to the Role and Relevance of the
“Aggregate” and “Cumulative” Terms
At the 1998 congressional hearing on implementation of the FQPA discussed in Section III( A)(1)(a) above, Chairman Goodlatte based his questions to Mr. Hansen on
26 “Law Makes Food Safer for Children,” Wall Street Journal, Page A23, October 7, 1996. See also, the letter of Albert H. Meryerhoff, Natural Resources Defense Council, San Francisco, id. (“[The National Academy of Sciences report] conclude[s] that it is cumulative exposure to multiple pesticides and other toxic substances that are of the most serious concern… [T]he new Food Quality Protection Act …mandates the EPA to assess the health risks of pesticides in their totality.”)
18
“Pesticide Registration (PR) Notice 97-1: Agency Actions under the Requirements of the Food Quality Protection Act.”27 This January 31, 1997 pronouncement was essentially an interpretive guidance document for implementation of, and compliance with, the FQPA. As such, it necessarily includes the agency’s interpretation of the role of aggregate exposures and cumulative effects in the administration of the Act:
The new safety standard, provided in section 408(b)(2)(A)(ii) of the statute, is a "reasonable certainty of no harm" standard for aggregate exposure using dietary residues and all other reliable exposure information. When setting new or reassessing existing tolerances or tolerance exemptions under the new standard, EPA must now focus explicitly on exposures and risks to children and infants. EPA must, 1) explicitly determine that the tolerance, or exemption from tolerance, is safe for children; 2) consider the need for an additional safety factor of up to ten-fold to account for uncertainty in the data base relative to children unless there is evidence that a different factor should be used; and 3) consider children's special sensitivities and often unique exposure patterns to pesticides. In addition, when making a determination as to whether or not there is a reasonable certainty that a pesticide chemical will cause "no harm," EPA must now consider other non-occupational sources of pesticide exposure when performing risk assessments and setting tolerances. This includes dietary exposure from drinking water, non-occupational exposure, exposure from like pesticides that share a common mechanism of toxicity as well as other exposure scenarios. When setting new or reassessing existing tolerances and tolerance exemptions, EPA must also evaluate the potential for endocrine disruption. The new law directs the Agency to use its authority to require specific tests and information on estrogenic effects for all pesticide chemical residues. (Emphases added)
Objectors note that all of the statements discussed above are authoritative ones, as they were made by government officials with special expertise and high-level responsibility for the administration or oversight of the FQPA. Further, in the instance of the executive branch, these interpretations “constitute a body of experience and informed judgment to which courts … may properly resort for guidance.”28
27 “Pesticide Registration (PR) Notice 97-1: Agency Actions Under the Requirements of the Food Quality Protection Act,” January 31, 1997. available at http://www.epa.gov/PR_Notices/pr97-1.html. 28 Skidmore v. Swift & Co., 323 U.S. 134, 140 (1944). See also, Christensen v. Harris County, 529 U.S. 576 , 586-87 (2000) (Chevron-style deference is not warranted where agency interpretations are announced in “opinion letters,” “policy statements, agency manuals, and enforcement guidelines, all of which lack the force of law.”)
19
B. The Use of Numerous Provisions in the FQPA Requiring “Aggregate”
and “Cumulative” Consideration of Various Fluoride Exposures, as well as the Significant Implications of those Terms’ Use, Reflects a Congressional Intent that EPA Should Consider the Overall Impact of Fluoride from All Sources. If Congress Had Not Intended for Fluoride Exposures to Be Taken into Account In Toto, It Would Not Have Used the Terms “Aggregate” and “Cumulative” So Prominently and So Pervasively in the FQPA
As Objectors have noted throughout these Comments, Congress did not use the
terms “aggregate” and “cumulative” for nothing. Moreover, the number of points at which the terms are used, as well as the importance of those points to the statute’s objectives, stands as a refutation against assertions that they are limited in scope, meaningless, or incidental. Indeed, the terms are basic building blocks in the FQPA architecture. They directly further Congress’s concern for the public health threat posed by fluoride exposures (especially for infants and children) and that body’s desire to provide stringent protections. The terms are used in the FQPA numerous times, including, but not limited to, the following instances:
• Standard for tolerances; Determination of safety (aggregate exposure)29
• Standard for tolerances; Conditions regarding risk (aggregate exposure)30
• Standard for tolerances; Review of tolerances (aggregate exposure)31
• Standard for tolerances; Exposure of infants and children (cumulative
effects, aggregate exposure)32
• Standard for tolerances; Factors in establishing, modifying, leaving in effect, or revoking a tolerance (cumulative effects, aggregate exposure)33
• Standard for exemptions; Determination of safety (aggregate exposure)34
Therefore, the frequency and significance of these terms’s use in the FQPA adds
additional force to the well-accepted legal maxim that statutes should be construed so as to avoid rendering superfluous any statutory language.35
29 FFDCA Sec. 408(b)(2)(A)(ii), 7 USC §346a(b) )(2)(A)(ii). 30 FFDCA Sec. 408(b)(2)(B)(iv), 7 USC § 346a b)(2)(B)(iv). 31 FFDCA Sec. 408(b)(2)(B)(v), 7 USC § 346a b)(2)(B)(v). 32 FFDCA Sec. 408(b)(2)(C), 7 USC § 346a b)(2)(C). 33 FFDCA Sec. 408(b)(2)(D), 7 USC § 346a b)(2)(D).
34 FFDCA Sec. 408( c)(2)((A)(ii), 7 USC § 346a( c)(2)((A)(ii).
20
IV. Obligations Under the Montreal Protocol Neither Excuse Nor
Diminish EPA’s Obligations Under the FQPA. Indeed, the Clean Air Act Provision Incorporating the Protocol into Law Supports the Proper Administration of Those and Other Federal Environmental Laws
One of EPA’s regulatory challenges in this matter is to meet its mandates under both the FQPA and the Montreal Protocol on Substances that Deplete the Ozone Layer (Protocol) in light of the tension between the two laws that has emerged over the years. Specifically, the required phase-out of the ozone depleting substance (ODS) methyl bromide has been complicated by several issues. And included among these issues is the fact that sulfuryl fluoride, a major alternative, has now been determined by EPA to carry its own serious threats to public health and the environment. Objectors understand this tension very well and they have developed their position in these Comments with an appreciation for the complex challenge it poses to EPA’s environmental regulatory leadership. Objectors believe, however, that the tension can be managed and that the challenge can be met, all without compromising the environmental and public health values sought to be protected under both laws.
A. Background on the Montreal Protocol In NRDC v. EPA, the Court of Appeals for the District of Columbia Circuit
described the entry by the United States into the Protocol, the treaty’s ratification, and the role of methyl bromide within that legal regime:
Amidst growing international concern about ozone depletion, the United States and twenty-four other nations entered into the Montreal Protocol. The Protocol requires signatory nations – which now number 189 -- to reduce and eliminate their production and use of ozone-depleting chemicals in accordance with agreed-upon timetables. Montreal Protocol arts. 2-2I. The Senate ratified the treaty in 1988, and Congress incorporated its terms into domestic law through the Clean Air Act Amendments of 1990 … Since then, the United States has reduced its use of methyl bromide to less than 39% of its 1991 baseline. In 1997, the Parties "adjusted" the Protocol to require developed-country Parties to cease "production" and "consumption" of methyl bromide by 2005. See Montreal Protocol art. 2H(5). In response, Congress amended the Clean Air Act to require EPA to "promulgate rules for reductions in, and terminate the production, importation, and consumption of, methyl
35 Qi-Zhuo v. Meissner, 315 U.S. App. D.C. 35, 70 F.3d 136, 139 (D.C. Cir. 1995)( “[A]l words in a statute are to be assigned meaning, and … nothing therein is to be construed as surplusage.") ; see also Halverson v. Slater, 129 F.3d 180, 185 (D.C. Cir. 1997) ("Congress cannot be presumed to do a futile thing.")
21
bromide under a schedule that is in accordance with, but not more stringent than, the phaseout schedule of the Montreal Protocol Treaty as in effect on October 21.”36
B. A Treaty-Inspired Law is, in General, Not Inherently Superior to A
Domestically-Initiated Federal Law. Therefore, Any Conflicts or Tensions Between Laws from the Two Categories Must, Absent Special Circumstances, Be Reconciled So as to Promote, to the Greatest Extent Possible, the Interests of Both Laws
As an initial matter, it is important to address a common misconception about the place and effect of international treaties like the Protocol in the overall American legal framework. More specifically, although properly signed, ratified and executed international treaties have the “force and effect of law,” and although they often relate to important global policy matters, they are not legally superior to other federal laws (unless treaty or congressional action creates such a predominance). Accordingly, there is no inherent obligation to enforce treaty law to the exclusion or subordination of other U.S. laws like FIFRA and the FFDCA. On this point, and as a fundamental matter, Article VI of the United States Constitution provides, in pertinent part: This Constitution, and the Laws of the United States which shall be made in Pursuance thereof; and all Treaties made, or which shall be made, under the Authority of the United
States, shall be the supreme Law of the Land….37 (Emphasis added)
The plain language of the U.S. Constitution clarifies that, in general, treaty law and domestically-initiated federal law are equal in status in the American legal system. This point was well-made early in the history of American constitutional jurisprudence by the oft-cited case of Whitney v. Robertson:
By the Constitution a treaty is placed on the same footing, and made of like obligation, with an act of legislation. Both are declared by that instrument to be the supreme law of the land, and no superior efficacy is given to either over the other. When the two relate to the same subject, the courts will always endeavor to construe them so as to give effect to both, if that can be done without violating the language of either; but if the two are inconsistent, the one last in date will control the other, provided always the stipulation of the treaty on the subject is self-executing.38
Objectors believe that the tension or conflict in this matter, while challenging, is not so irreconcilable as to require that EPA take an extreme position to enforce either one law or another. In other words, we believe the two laws are not so harshly “inconsistent”
36 NRDC v. EPA, 464 F.3d 1, 3-4 (2006). 37 U.S. Const. Art. VI. 38 Whitney v. Robertson, 124 U.S.190, 194 (1888). See also, Breard v. Greene, 523 U.S. 371, 376 (1998).
22
as to invoke some of the choices contemplated in some cases.39 This means that reconciliation is possible, and Objectors are including in Section ___ of these Comments (Conclusion and Recommendations) certain recommendations for a meaningful solution to the challenges posed. But, the key term here is “reconcile”--not “choose”--and therefore EPA should take care, in reviewing the various comments, to avoid a needless diminution in the effectuation of either legal mandate.
C. The Montreal Protocol and the Clean Air Act Require the Development of Environmentally Safe Alternatives
In addition to the major provisions in the legal framework of the Protocol relative
to the phaseout of ODSs, there also is a specific mandate to the signatory Parties to develop “possible alternatives” to those ODSs:
1. The Parties shall co-operate, consistent with their national laws, regulations and practices and taking into account in particular the needs of developing countries, in promoting, directly or through competent international bodies, research, development and exchange of information on:
***
(b) possible alternatives to controlled substances, to products
containing such substances, and to products manufactured with them. (Emphasis added)
Similarly, Clean Air Act incorporation of the Protocol contains language imposing certain duties on the United States in promoting the development of such alternatives:
(a) Policy To the maximum extent practicable, class I [which includes methyl bromide] and class II substances shall be replaced by chemicals, product substitutes, or alternative manufacturing processes that reduce overall risks to human health and the environment.40 (Emphasis added)
Objectors believe that these two provisions do much to ameliorate the tension
between the Protocol and the FQPA. This is because they require that alternatives to ODSs be developed “consistent with …national laws, regulations and practices” and that they be environmentally protective against “overall risks to human health and the environment.” And while some commentators would take the view that the provisions provide a basis for grossly favoring the phaseout of methyl bromide over sulfuryl fluoride
39 See, id.,, invoking the “first-in-time” rule of precedence, and Trans World Airlines, Inc. v. Franklin Mint Corp., 466 U.S. 243, 252 (1984) (an ambiguous statute should be construed where fairly possible not to abrogate a treaty). 40 Clean Air Act, Title VI, Sec. 612 (Stratospheric Ozone Protection), 42 USC § 7671-7671q.
23
and fluoride, Objectors submit that such an interpretation moves “reconciliation” more in the direction of “choice.” Objectors’s position is that these Protocol and Clean Air Act provisions make a simple point, one that also comports nicely with the “plain meaning” legal doctrine: Don’t create ODS alternatives that are themselves threats to human health and the environment.
Given this language, it is clear that public health protections under the FQPA should not suffer because the development of alternatives to methyl bromide has not been as successful as desired. Part of the solution, in this regard, is to put emphasis on the aggressive development of alternatives that are also protective of the environment and human health. Objectors appreciate the great nature of this challenge. At the same time, however, it is a legal charge, and it is also a factor in mitigation of the need for continuing the problems caused by the use in society of sulfuryl fluoride.
In regards to safe, practical, and cost-effective alternatives to methyl bromide and
sulfuryl fluoride tolerances on food, Objectors draw attention to the EPA’s own economic and technical feasibility study of likely alternatives in the grain milling industry. (EPA 2011). Among food processing facilities, grain mills are the largest projected user of SF. EPA’s report concluded that 75 to 80% of US grain mills will be able to switch to heat treatment for their periodic pest treatment needs and that the cost of heat treatment at these facilities will actually be less than the cost for SF fumigations. For the 20 to 25% of mills which are very old and whose wood construction probably makes them unsuitable for heat treatments, the EPA report concluded that they could switch to SF fumigation after removal of all food. EPA found this to be a practical and cost-effective solution as the additional cost from removing all food prior to fumigation would amount to less than 3% of the annual profits from these mills. Removing all food prior to fumigation is, as discussed earlier, the solution arrived at by the majority of western nations. This precludes the need, therefore, for any food exposures to fluoride or sulfuryl fluoride from facility fumigations. While EPA did not perform similar analyses for other types of food processing facilities, it is reasonable to expect that—for facilities that cannot use heat or other non-toxic methods—the alternative of food removal before SF fumigations will be technically feasible and of minimal economic impact.
Although EPA did not review alternatives to direct SF fumigation of foods like
cocoa, dried beans, and dried fruits, there are alternatives in use in many other countries where no food tolerances of sulfuryl fluoride or fluoride have been allowed. Indeed, most signatories to the Montreal Protocol have successfully phased out methyl bromide use without the need to resort to sulfuryl fluoride., The EU, for example, has ruled that sulfuryl fluoride must not contact food during mill fumigations, and any food that contains higher than background levels of fluoride from fumigations must be destroyed and not enter commerce. (EU 2010a, 2010b).
Further, Objectors note that it is possible to maintain a food storage facility without the use of toxic fumigants. Firstly, a clean storage or processing facility, fully and regularly maintained, will be much more easily managed and kept free of pests. Modern food processing and storage practices effectively prevent pest infestations
24
through careful management of equipment, and conditions, such as keeping the product at appropriate humidity levels with drying fans that circulate air to lower the moisture content.
The United Nations Food and Agriculture Organization’s Manual of Fumigation
for Insect Control notes that controlled atmosphere techniques (the manipulation of oxygen or carbon dioxide (CO2)) are widely used in the storage of perishable commodities such as fruit, vegetables, cut flowers, etc. (Bond 1984). Carbon dioxide gas can be applied to storages from a vessel of liquid carbon dioxide or in the form of dry ice. Carbon dioxide is readily available on the marketplace at reasonable cost. Similarly, a USDA ARS study (Nevin, et al. 2006) found that two high-temperature, forced air treatments under controlled atmosphere conditions were successful at controlling moths for stored fruits. According to the study, treatments using a heating rate of either12 and 24 degrees C/hr to a final chamber temperature of 46 degrees C under a 1% oxygen, 15% carbon dioxide atmosphere were sufficient to control the most tolerant stages of moth.
According to a review of organic practices conducted by Joe Montecalvo, Ph.D., another approach sometimes used for pest management for grain and flour is the movement of those materials into a satellite trailer or silo. (Montecalvo 2004). They are then fumigated with carbon dioxide gas. When CO2 is used as a fumigant, there are no harmful residues and it is relatively safe to use. Further, it is effective in killing insects in all stages of their life cycles and could be used for long-term storage of products. CO2 fumigation should be practiced under completely sealed storage, and concentration must be maintained at 35% or higher during the first 15 days.41 There is sufficient evidence to support the use of controlled-atmosphere techniques as a viable alternative to sulfuryl flouride and methyl bromide that they deserve serious consideration. Objectors strongly urge EPA to include these methods as reasonable options in arriving at a final decision in this matter. V. Sulfuryl Fluoride is a Potent Greenhouse Gas, and this Further Obligates
EPA to Reduce Its Usage
A. Sulfuryl Fluoride is a Potent Greenhouse Gas and the Cumulative Effects of Its Continued Use Increase Its Potential for Significant Adverse Impacts
Yet another problem with sulfuryl fluoride is that it is a potent greenhouse gas. Authoritative scientific studies have continued to establish this fact. In this regard, Objectors seek to update the record for the period since the Proposed Order, which stated with respect to this issue:
5. Other atmospheric effects of sulfuryl fluoride. EPA acknowledges that recent research has identified the potential for sulfuryl fluoride
41 Carbon dioxide fumigation technique to control insect pests in stored products. 2004. Food and Fertilizer Technology Center (FFTC). Thailand, available at http://www.agnet.org/htmlarea_file/library/20110716183913/pt2004015.pdf.
25
to contribute to the greenhouse effect; however there does not appear to be consensus yet in the scientific community on its global warming potential.42
Objectors assert that the current picture is different from the one described in
EPA’s brief conclusion. For example, in 2009, scientists at the Massachusetts Institute of Technology (MIT), the Scripps Institution of Oceanography in San Diego and other institutions reported the results of their study of the greenhouse gas properties of sulfuryl fluoride in the Journal of Geophysical Research.43 The researchers were specifically interested in the levels of the gas in the atmosphere and its lifetime, so as to estimate its potential future effects on the climate.
Their research revealed that sulfuryl fluoride has a lifetime of about 36 years,
which is eight times greater than previously thought. They concluded that although it is present in only small quantities in the atmosphere now, it could become an actual threat as a greenhouse if the quantity of its use grows. The pertinence of this research to EPA’s duties is clear: Act now before sulfuryl fluoride quantities, as well as the economics undergirding it (industry sector development, capital investment, jobs, and the like), experience such growth as to make it even more difficult than at the present time to mitigate the effects of such expansion. As noted by Ron Prinn, TEPCO Professor of Atmospheric Science in MIT's Department of Earth, Atmospheric and Planetary Sciences
[W]e've caught it very early in the game …In AGAGE [the Advanced Global Atmospheric Gases Experiment, we don't just monitor the big greenhouse gases that everybody's heard of … This program is also designed to sniff out potential greenhouse and ozone-depleting gases before the industry gets very big.44
As the study above demonstrates, certainty in scientific knowledge about sulfuryl fluoride as a greenhouse gas continues to increase.45 And EPA should take into account
42 Proposed Order, available at https://www.federalregister.gov/articles/2011/01/19/2011-917/sulfuryl-fluoride-proposed-order-granting-objections-to-tolerances-and-denying-request-for-a-stay#p-346. 43 “Sulfuryl fluoride in the global atmosphere,” Journal of Geophysical Research, Vol. 114, 2009. 44 See, David Chandler, “New greenhouse gas identified; Early detection may permit ‘niping it in the bud,’” MITnews, March 11, 2009, available at http://web.mit.edu/newsoffice/2009/prinn-greenhouse-tt0311.html. 45 See, e.g., Zhao Z, Laine PL, Nicovich JM, Wine PH. 2010. “Reactive and nonreactive quenching of O(1D) by the potent greenhouse gases SO2F2, NF3, and SF5CF3” Proc Natl Acad Sci U S A. 2010 Apr 13;107(15):6610-5. (full article at http://www.ncbi.nlm.nih.gov/pmc/articles/PMC2872385/pdf/pnas.0911228107.pdf; Andersen MP, Blake DR, Rowland FS, Hurley MD, Wallington TJ. 2009. “Atmospheric chemistry of sulfuryl fluoride: reaction with OH radicals, Cl atoms and O3, atmospheric lifetime, IR spectrum, and global warming potential., Environ Sci Technol. 2009 Feb 15;43(4):1067-70. Abstract, http://www.ncbi.nlm.nih.gov/pubmed/19320159; Papadimitriou VC, Portmann RW, Fahey DW, Mühle J, Weiss RF, Burkholder JB. 2008. “Experimental and theoretical study of the atmospheric chemistry and global warming potential of SO2F2,” J Phys Chem A. 2008 Dec 11;112(49):12657-66. Abstract at http://www.ncbi.nlm.nih.gov/pubmed/19053541
26
the findings and conclusions of this emerging body of knowledge as it makes a decision about the environmental and health impacts of sulfuryl fluoride.
EPA has been advised in the past of the need to include the greenhouse gas
properties of sulfuryl fluoride in its analyses of that chemical’s environmental impact. For example, on July 10, 2009, Alaska Community Action on Toxics, the Center for Biological Diversity, the Center for Environmental Health, Defenders of Wildlife, Pesticide Action Network North America, and the Sierra Club addressed a letter to EPA of this very nature.46 In opposing a Dow application for an experimental use permit, the groups stated that “sulfuryl fluoride is 4,780 times as potent a greenhouse gas as carbon dioxide over a 100 year time horizon, and EPA must therefore consider climate change in this decision.”47 The fact that a potent substance may be present in only small amounts does not render it insignificant, said the groups, because:
[C]limate change is perhaps the best (and worst) example of a cumulative effects problem; emissions from numerous sources have combined to create the most pressing environmental and societal problem of our time… Because sulfuryl fluoride is such a potent greenhouse gas, seemingly small emissions can make a significant contribution to climate change.48
Thus, there is increasing scientific evidence and continued advocacy favoring the inclusion of sulfuryl fluoride’s greenhouse gas potential in environmental and health assessments. These groups all note particularly the danger of ignoring the “cumulative effects” of what might otherwise appear to be a harmlessly small presence of the chemical in the environment. Objectors fully agree with these views and urge EPA to include this additional threat into its calculus regarding the environmental and health impacts of sulfuryl fluoride.
B. Prospects for Greenhouse Gas Regulation in the United States Continue to Advance and Thus Sulfuryl Fluoride Could Pose Yet Another Major Environmental Regulatory Challenge
To the extent a comprehensive legal regime for greenhouse gas regulation
emerges in the United States, there will also emerge a major governmental responsibility to reduce the incidence and impact of greenhouse gases. In the instance of sulfuryl fluoride, new climate control regulation, combined with the continued use and cumulative impacts of this chemical, would add a regulatory burden that could easily have been avoided with prompt prior action. In other words, if EPA acts in a final order 46 Letter from, Alaska Community Action on Toxics, the Center for Biological Diversity, the Center for Environmental Health, Defenders of Wildlife, Pesticide Action Network North America, and the Sierra Club addressed a letter to EPA opposing a Dow application for an experimental use permit to use sulfuryl fluoride, July 10, 2009, available at http://www.biologicaldiversity.org/campaigns/pesticides_reduction/pdfs/SulfurylFluorideComments.pdf. 47 Id. 48 Id.
27
to phase out sulfuryl fluoride and fluoride tolerances, then there would be one less greenhouse gas to regulate. As noted in the discussion below, the development of a federal regulatory regime is gradually becoming a reality.
On June 26, 2012, in Coalition for Responsible Regulation v. EPA, the United
States Court of Appeals for the District of Columbia Circuit dismissed all challenges to the Environmental Protection Agency's greenhouse gas regulations in an unsigned opinion that reaffirmed the rules in their entirety.49 The court denied challenges to EPA's “endangerment finding” for greenhouse gases and subsequent emissions standards for cars and light-duty trucks under the Clean Air Act. EPA Administrator Lisa Jackson hailed the decision as a significant step in the march toward comprehensive climate change regulation:
Today's ruling is a strong validation of, in the Court's own words, the "unambiguously correct" approach we have taken in responding to the 2007 Supreme Court decision [Massachusetts v. EPA]. I am pleased that the U.S. Court of Appeals for the D.C. Circuit found that EPA followed both the science and the law in taking common-sense, reasonable actions to address the very real threat of climate change by limiting greenhouse gas pollution from the largest sources.50
As observed by Administrator Jackson and experts in the area,51 the ruling “clears the way” for the regulatory implementation of a comprehensive federal greenhouse gas regulatory regime—one unburdened by the political hurdles involved in taking a legislative approach. Again, Objectors urge EPA to pursue their recommended action on sulfuryl fluoride, so as to avoid this additional regulatory burden and health threat. VI. Conclusion and Recommendations In these Comments, Objectors have responded to the questions posed in the EPA Second Request and have also reaffirmed their position that EPA has already made a wise and considered decision in its Proposed Order.
Objectors' primary recommendation, therefore, is that EPA issue a final order withdrawing the tolerances for sulfuryl fluoride and fluoride. However, Objectors would like to make it abundantly clear to EPA that the continued use of methyl bromide is equally unacceptable from a public health and environmental perspective. In view of that, Objectors make certain related recommendations. In particular, for uses of sulfuryl 49 Coalition for Responsible Regulation v. EPA , D.C. Cir., No. 09-1322, 6/26/12. 50 See, “U.S. Court of Appeals - D.C. Circuit Upholds EPA's Actions to Reduce Greenhouse Gases under the Clean Air Act,” EPA Announcement, June 26, 2012, available at http://www.epa.gov/climatechange/endangerment/ghgcourtdecision.html.
51 See, e.g., “D.C. Circuit Decision Upholds EPA Greenhouse Gas Regulations in Entirety,” Bloomberg BNA, Daily Environment Report™, June 27, 2012 (quoting several climate change experts about the importance of the ruling), available at http://www.bna.com/dc-circuit-decision-n12884910286/.
28
fluoride where methyl bromide presently is the only alternative, Objectors are willing to support a more flexible phaseout of sulfuryl fluoride for such uses, but only if EPA meets several conditions. First, for those facility treatments where temperature and other non-chemical treatments are not available, fumigation with sulfuryl fluoride could be temporarily allowed so long as all food is removed from the facility prior to fumigation, and measures are taken to prevent contamination after the facility resumes production. This is not an unreasonable requirement. Indeed, as discussed earlier, Austria, Belgium, Canada, Germany, France, Greece, Italy, Ireland, Switzerland and the UK have each taken this approach. There is no reason for the United States to not require the same, particularly since chronic fluoride exposure in the United States is higher than in these other countries.
Second, EPA must take meaningful steps to phaseout sulfuryl fluoride as soon as is reasonably possible, providing the public updates along the way on its progress meeting that important objective. Finally, EPA must not accept arguments from producers and users of sulfuryl fluoride that the public has to make a false choice between these two toxic and highly potent atmospheric* gases. Rather EPA must do more to encourage greater innovation on that front, as it is required to do by law.
* The word “atmospheric” is used here instead of “greenhouse,” which is the word Objectors had inadvertently used in its actual submission to the EPA.

29
APPENDIX
References Akiniwa, K. (1997). Re-examination of acute toxicity of fluoride. Fluoride 30: 89-104. American Egg Board (2005a) Liquid Egg Product Statistics web page at: http://www.aeb.org/proc/stats/liquid-use.html An J, et al. (1992). The effects of high fluoride on the level of intelligence of primary and secondary students. Chinese Journal of Control of Endemic Diseases 7(2):93-94. Beltrán-Aguilar ED, Barker L, Dye BA. 2010. Prevalence and severity of dental fluorosis in the United States, 1999-2004. NCHS data brief, no 53. Hyattsville, MD: National Center for Health Statistics. http://www.cdc.gov/nchs/data/databriefs/db53.htm Beltran-Aguilar ED et al. (2005). Surveillance for dental caries, dental sealants, tooth retention, edentulism, and enamel fluorosis — United States, 1988–1994 and 1999—2002. MMWR Surveillance Summaries 54(3): 1-44. Bond EJ. (1984). Manual of Fumigation for Insect Control. Food & Agricultural Organization of the United Nations (FAO), Plant and Production Paper No. 54. Available online at: http://www.fao.org/docrep/x5042e/x5042E00.htm. Choi AL, Sun G, Zhang Y, Grandjean P. 2012. Developmental fluoride neurotoxicity: a systematic review and meta-analysis. Env Health Perspect. doi:10.1289/ehp.1104912 Ding Y, et al. (2011). The relationships between low levels of urine fluoride on children's intelligence, dental fluorosis in endemic fluorosis areas in Hulunbuir, Inner Mongolia, China. J Hazard Mater. 186(2-3):1942-46. Eichler HG, et al. (1982). Accidental ingestion of NaF tablets by children--report of a poison control center and one case. International Journal of Clinical Pharmacology, Therapy and Toxicology 20(7):334-8.
30
EPA (2011). Assessment of Impacts on Flour Mills Operators of a Stay in Sulfuryl Fluoride Food Tolerances. EPA-HQ-OPP-2005-0174-0110 http://www.regulations.gov/ - !documentDetail;D=EPA-HQ-OPP-2005-0174-0110.
EPA (2010a). Sulfuryl Fluoride: Estimates of fluoride exposure from pesticidal sources—customized age groups. Memorandum. July 1, 2010. From: Doherty MA. To: Doyle E. EPA (December 2010b). Fluoride: Exposure and Relative Source Contribution Analysis. EPA 820-R-10-015. http://water.epa.gov/action/advisories/drinking/fluoride_index.cfm EPA (2006). Final Human Health Risk Assessment for Sulfuryl Fluoride and Fluoride Anion Addressing the Section 3 Registration of Sulfuryl Fluoride as a Fumigant for Foods and Food Processing Facilities. PP# 3F6573. Office of Prevention, Pesticides and Toxic Substances. January 18. EPA (2005). Sulfuryl Fluoride; Notice of Filing a Pesticide Petition to Establish Tolerances for a Certain Pesticide Chemical in or on Food. Federal Register. Docket OPP-2005-0067. March 4. EFSA (European Food Safety Authority) (2010). Conclusion on the peer review of the pesticide risk assessment of the active substance sulfuryl fluoride. EFSA Journal 8(1):1441. Eswar P, et al. (2011). Intelligent quotients of 12-14 year old school children in a high and low fluoride village in India. Fluoride 44:168-72. European Union. (2010a) Commission Directive 2010/38/EU. Available online at: http://eur-lex.europa.eu/LexUriServ/LexUriServ.do?uri=OJ:L:2010:154:0021:0023:EN:PDF European Union. (2010b). Review report for the active substance sulfuryl fluoride. Available online at: http://ec.europa.eu/food/plant/protection/evaluation/newactive/sulfuryl_fluoride_review_report.pdf FAO. 1984 Manual of fumigation for insect control, FAO Plant Production and Protection Papers, available at http://www.fao.org/docrep/x5042e/x5042E0o.htm, FDA (1995). Estimating Exposure To Direct Food Additives And Chemical Contaminants in the Diet. Center for Foor Safety & Applied Nutrition. Office of Premarket Approval. Prepared by Michael J. DiNovi and Paul M. Kuznesof. September. Gessner BD, et al. (1994). Acute fluoride poisoning from a public water system. New England Journal of Medicine 330:95-9.
31
Hong F, et al. (2001). Research on the effects of fluoride on child intellectual development under different environments. Chinese Primary Health Care 15(3):56-7 (republished in Fluoride 2008; 41(2):156–60). Institute of Medicine. 1997. Dietary Reference Intakes for Calcium, Phosphorus, Magnesium, Vitamin D, and Fluoride. Standing Committee on the Scientific Evaluation of Dietary Reference Intakes, Food and Nutrition Board. National Academy Press. Lin Fa-Fu; et al (1991). The relationship of a low-iodine and high-fluoride environment to subclinical cretinism in Xinjiang. Endemic Disease Bulletin 6(2):62-67 (republished in Iodine Deficiency Disorder Newsletter Vol. 7(3):24-25). Lu Y, et al (2000). Effect of high-fluoride water on intelligence of children. Fluoride 33:74-78. Lucier G, Lin BH, Allshouse J, Kantor LS. 2000. Factors affecting dry bean consumption in the United States. Begetables and Specialties S&O /VGS-280/April 2000. Economic Research Service, USDA. http://webarchives.cdlib.org/sw1bc3ts3z/http://ers.usda.gov/Briefing/DryBeans/PDFs/DryBeanConsumption.pdf Montecalvo, J. 2004. Organic Pest Management Operations and Requirements. Organic Processing Magazine.
National Research Council. 2006. Fluoride in Drinking Water: A Scientific Review of EPA’s Standards. Washington, D.C.: National Academies Press. 507 pp. http://www.nap.edu/catalog.php?record_id=11571
Neven LG, Rehfield-Ray LM, Obenland D. 2006. Confirmation and efficacy tests against codling moth and oriental fruit moth in peaches and nectarines using combination heat and controlled atmosphere treatments. J Econ Entomol. 99(5):1610-9.
Penman AD, et al. (1997). Outbreak of acute fluoride poisoning caused by a fluoride overfeed, Mississippi, 1993. Public Health Reports 112:403-09. Poureslami HR, et al. (2011). Intelligence quotient of 7 to 9 year-old children from an area with high fluoride in drinking water. Journal of Dentistry and Oral Hygiene. 3(4):61-64. Seraj B, et al. (2006). [Effect of high fluoride concentration in drinking water on children’s intelligence]. Journal of Dental Medicine 19(2):80-86. Spoerke DG, et al. (1980). Toxicity related to acute low dose sodium fluoride ingestions. Journal of Family Practice 10:139-40.
32
Stannard JG, Shim YS, Kritsineli M, Labropoulou P, Tsamtsouris A. 1991. Fluoride levels and fluoride contamination of fruit juices. Journal of Clinical Pediatric Dentistry. 16(1):38-40. USDA (2010). Report of the Dietary Guidelines Advisory Committee on the Dietary Guidelines for Americans, 2010. Available online at: http://www.cnpp.usda.gov/DGAs2010-DGACReport.htm USDA (2008). Food Buying Guides for Child Nutrition Programs. Section 3: Grains/Breads. USDA (2003) Commodity Specification: All Purpose Egg Mix. Online at: http://www.ams.usda.gov/poultry/cp/egg/eggf/PY277/277spec.pdf Wang X, et al. (2001). Effects of high iodine and high fluorine on children’s intelligence and thyroid function. Chinese Journal of Endemiology 20(4):288-90. Whitford GM. (1990). The physiological and toxicological characteristics of fluoride. Journal of Dental Research 69(Spec Issue):539-49. Whitford GM. (1987). Fluoride in dental products: safety considerations. Journal of Dental Research 66: 1056-60. Xiang Q, et al. (2003a). Effect of fluoride in drinking water on children's intelligence. Fluoride 36: 84-94. Xiang Q, et al. (2003b). Blood lead of children in Wamiao-Xinhuai intelligence study. Fluoride 36: 198-199. Xu Y, et al. (1994). The effect of fluorine on the level of intelligence in children. Endemic Disease Bulletin 9(2):83-84. Yao Y, et al. (1997). A comparative assessment of the physical and mental development of children in endemic fluorosis area with water improvement and without water improvement. Literature and Information on Preventive Medicine 3(1):42-43. Yao Y, et al. (1996). Analysis on TSH and intelligence level of children with dental Fluorosis in a high fluoride area. Literature and Information on Preventive Medicine 2(1):26-27. Yang Y, et al. (1994). The effects of high levels of fluoride and iodine on intellectual ability and the metabolism of fluoride and iodine. Chinese Journal of Epidemiology 15(4):296-98 (republished in Fluoride 2008; 41:336-339). Zhao LB, et al (1996). Effect of high-fluoride water supply on children's intelligence. Fluoride 29: 190-192.
July 30, 2012
ADDENDUM
to:
Comments of Objectors Fluoride Action Network, Environmental Working
Group, and Beyond Pesticides on the United States Environmental Protection Agency Proposed Rule to Withdraw Sulfuryl Fluoride Tolerances
Sulfuryl Fluoride: Second Request for Comment on Proposed Order Granting Objections
to Tolerances and Denying Request for a Stay
EPA-HQ-OOP-2005-0174; FRL-9343-6
Federal Register, Vol. 77, No. 84, Tuesday, May 1, 2012
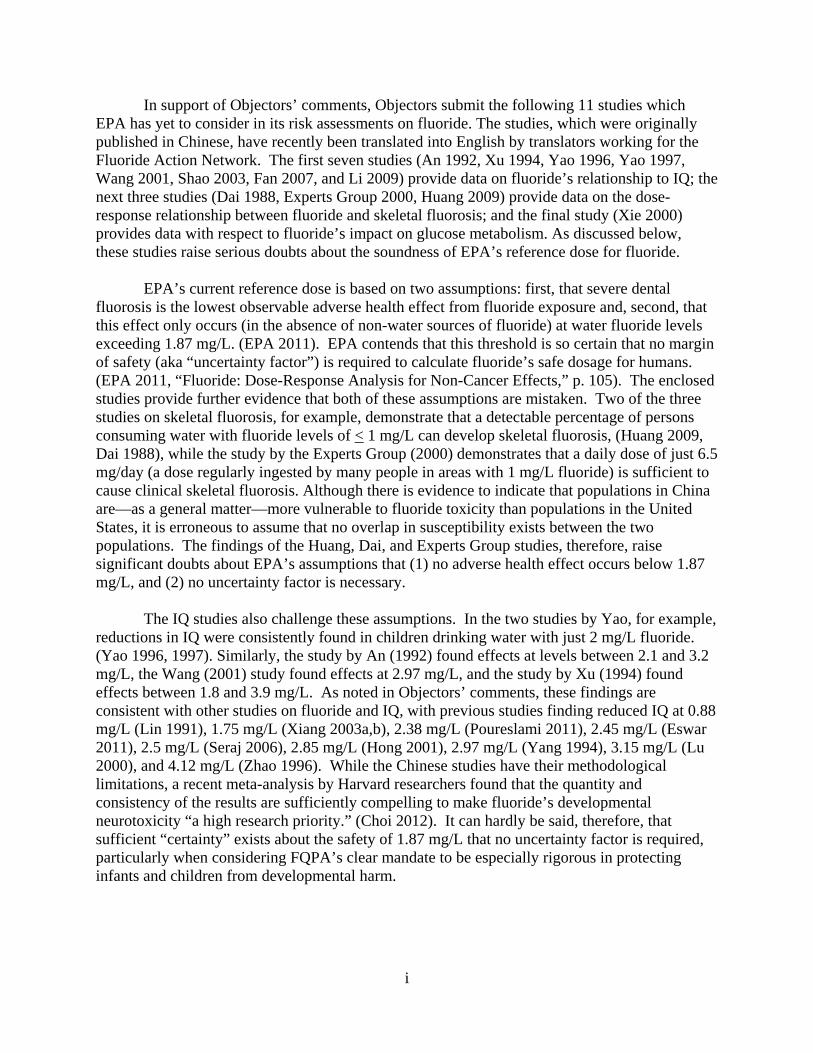
i
In support of Objectors’ comments, Objectors submit the following 11 studies which EPA has yet to consider in its risk assessments on fluoride. The studies, which were originally published in Chinese, have recently been translated into English by translators working for the Fluoride Action Network. The first seven studies (An 1992, Xu 1994, Yao 1996, Yao 1997, Wang 2001, Shao 2003, Fan 2007, and Li 2009) provide data on fluoride’s relationship to IQ; the next three studies (Dai 1988, Experts Group 2000, Huang 2009) provide data on the dose-response relationship between fluoride and skeletal fluorosis; and the final study (Xie 2000) provides data with respect to fluoride’s impact on glucose metabolism. As discussed below, these studies raise serious doubts about the soundness of EPA’s reference dose for fluoride.
EPA’s current reference dose is based on two assumptions: first, that severe dental
fluorosis is the lowest observable adverse health effect from fluoride exposure and, second, that this effect only occurs (in the absence of non-water sources of fluoride) at water fluoride levels exceeding 1.87 mg/L. (EPA 2011). EPA contends that this threshold is so certain that no margin of safety (aka “uncertainty factor”) is required to calculate fluoride’s safe dosage for humans. (EPA 2011, “Fluoride: Dose-Response Analysis for Non-Cancer Effects,” p. 105). The enclosed studies provide further evidence that both of these assumptions are mistaken. Two of the three studies on skeletal fluorosis, for example, demonstrate that a detectable percentage of persons consuming water with fluoride levels of < 1 mg/L can develop skeletal fluorosis, (Huang 2009, Dai 1988), while the study by the Experts Group (2000) demonstrates that a daily dose of just 6.5 mg/day (a dose regularly ingested by many people in areas with 1 mg/L fluoride) is sufficient to cause clinical skeletal fluorosis. Although there is evidence to indicate that populations in China are—as a general matter—more vulnerable to fluoride toxicity than populations in the United States, it is erroneous to assume that no overlap in susceptibility exists between the two populations. The findings of the Huang, Dai, and Experts Group studies, therefore, raise significant doubts about EPA’s assumptions that (1) no adverse health effect occurs below 1.87 mg/L, and (2) no uncertainty factor is necessary.
The IQ studies also challenge these assumptions. In the two studies by Yao, for example,
reductions in IQ were consistently found in children drinking water with just 2 mg/L fluoride. (Yao 1996, 1997). Similarly, the study by An (1992) found effects at levels between 2.1 and 3.2 mg/L, the Wang (2001) study found effects at 2.97 mg/L, and the study by Xu (1994) found effects between 1.8 and 3.9 mg/L. As noted in Objectors’ comments, these findings are consistent with other studies on fluoride and IQ, with previous studies finding reduced IQ at 0.88 mg/L (Lin 1991), 1.75 mg/L (Xiang 2003a,b), 2.38 mg/L (Poureslami 2011), 2.45 mg/L (Eswar 2011), 2.5 mg/L (Seraj 2006), 2.85 mg/L (Hong 2001), 2.97 mg/L (Yang 1994), 3.15 mg/L (Lu 2000), and 4.12 mg/L (Zhao 1996). While the Chinese studies have their methodological limitations, a recent meta-analysis by Harvard researchers found that the quantity and consistency of the results are sufficiently compelling to make fluoride’s developmental neurotoxicity “a high research priority.” (Choi 2012). It can hardly be said, therefore, that sufficient “certainty” exists about the safety of 1.87 mg/L that no uncertainty factor is required, particularly when considering FQPA’s clear mandate to be especially rigorous in protecting infants and children from developmental harm.
ii
TABLE OF CONTENTS
A1-A3: An J, et al. (1992). The effects of high fluoride on the level of intelligence of primary and secondary students. Chinese Journal of Control of Endemic Diseases 7(2):93-94. A4-A6: Xu Y, et al. (1994). The effect of fluorine on the level of intelligence in children. Endemic Disease Bulletin 9(2):83-84. A7-A9: Yao Y, et al. (1996). Analysis on TSH and intelligence level of children with dental Fluorosis in a high fluoride area. Literature and Information on Preventive Medicine 2(1):26-27. A10-A13: Yao Y, et al. (1997). A comparative assessment of the physical and mental development of children in endemic fluorosis area with water improvement and without water improvement. Literature and Information on Preventive Medicine 3(1):42-43. A14-A17: Wang X, et al. (2001). Effects of high iodine and high fluorine on children’s intelligence and thyroid function. Chinese Journal of Endemiology 20(4):288-90. A18-A21: Shao Q, et al. (2003). Study of cognitive function impairment caused by chronic fluorosis. Chinese Journal of Endemiology 22(4):336-38. A22-A24: Fan Z, et al. (2007). The effect of high fluoride exposure on the level of intelligence in children. Journal of Environmental Health 24(10):802-03. A25-A30: Li F, et al. (2009). The impact of endemic fluorosis caused by the burning of coal on the development of intelligence in children. Journal of Environmental Health 26(4):838-40. A31-A33: Huang C. (2009). Diagnosis of endemic skeletal fluorois: clinical examination vs. X-rays. Chinese Journal of Endemiology 28(2):194-196. A34-A42: Dai G, et al. (1988). Quantitative epidemiological research on the relationship between fluoride concentration of drinking water and endemic fluoride poisoning. Chinese Journal of Endemiology 7(1):21-26. A43-A46: Expert Group of the Ministry of Health for the Study of Tea-Induced Fluoride Poisoning. (2000). The dose-response relationship of tea-induced osteofluorosis and brick tea fluoride intake. Chinese Journal of Endemiology 19(4):266-68. A47-A49: Xie Y, et al. (2000). Clinical study of effect of high fluoride on the function of the pancreatic islet B cells. Chinese Journal of Endemiology 19(2):84-86.
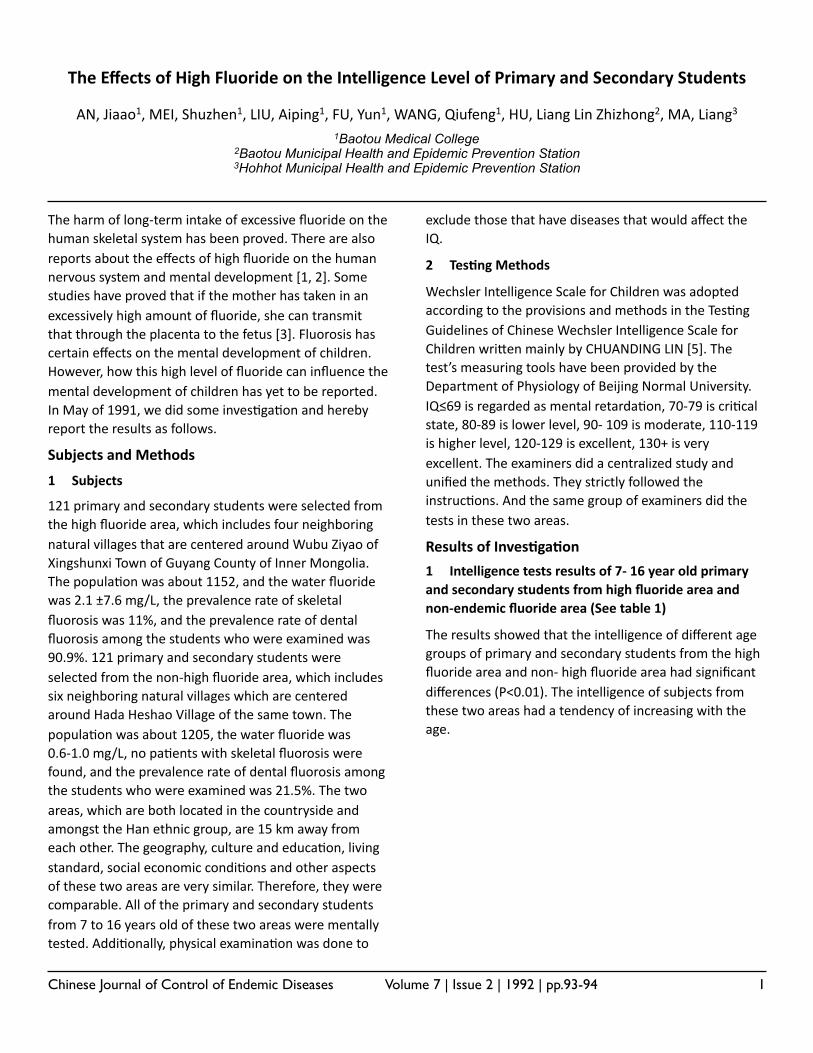
Chinese Journal of Control of Endemic Diseases Volume 7 | Issue 2 | 1992 | pp.93-94 1
The Effects of High Fluoride on the Intelligence Level of Primary and Secondary Students
AN, Jiaao1, MEI, Shuzhen1, LIU, Aiping1, FU, Yun1, WANG, Qiufeng1, HU, Liang Lin Zhizhong2, MA, Liang3
1Baotou Medical College2Baotou Municipal Health and Epidemic Prevention Station3Hohhot Municipal Health and Epidemic Prevention Station
The harm of long-‐term intake of excessive fluoride on the human skeletal system has been proved. There are also reports about the effects of high fluoride on the human nervous system and mental development [1, 2]. Some studies have proved that if the mother has taken in an excessively high amount of fluoride, she can transmit that through the placenta to the fetus [3]. Fluorosis has certain effects on the mental development of children. However, how this high level of fluoride can influence the mental development of children has yet to be reported. In May of 1991, we did some invesJgaJon and hereby report the results as follows.
Subjects and Methods
1 Subjects
121 primary and secondary students were selected from the high fluoride area, which includes four neighboring natural villages that are centered around Wubu Ziyao of Xingshunxi Town of Guyang County of Inner Mongolia. The populaJon was about 1152, and the water fluoride was 2.1 ±7.6 mg/L, the prevalence rate of skeletal fluorosis was 11%, and the prevalence rate of dental fluorosis among the students who were examined was 90.9%. 121 primary and secondary students were selected from the non-‐high fluoride area, which includes six neighboring natural villages which are centered around Hada Heshao Village of the same town. The populaJon was about 1205, the water fluoride was 0.6-‐1.0 mg/L, no paJents with skeletal fluorosis were found, and the prevalence rate of dental fluorosis among the students who were examined was 21.5%. The two areas, which are both located in the countryside and amongst the Han ethnic group, are 15 km away from each other. The geography, culture and educaJon, living standard, social economic condiJons and other aspects of these two areas are very similar. Therefore, they were comparable. All of the primary and secondary students from 7 to 16 years old of these two areas were mentally tested. AddiJonally, physical examinaJon was done to
exclude those that have diseases that would affect the IQ.
2 Tes-ng Methods
Wechsler Intelligence Scale for Children was adopted according to the provisions and methods in the TesJng Guidelines of Chinese Wechsler Intelligence Scale for Children wri[en mainly by CHUANDING LIN [5]. The test’s measuring tools have been provided by the Department of Physiology of Beijing Normal University. IQ≤69 is regarded as mental retardaJon, 70-‐79 is criJcal state, 80-‐89 is lower level, 90-‐ 109 is moderate, 110-‐119 is higher level, 120-‐129 is excellent, 130+ is very excellent. The examiners did a centralized study and unified the methods. They strictly followed the instrucJons. And the same group of examiners did the tests in these two areas.
Results of InvesAgaAon
1 Intelligence tests results of 7-‐ 16 year old primary and secondary students from high fluoride area and non-‐endemic fluoride area (See table 1)
The results showed that the intelligence of different age groups of primary and secondary students from the high fluoride area and non-‐ high fluoride area had significant differences (P<0.01). The intelligence of subjects from these two areas had a tendency of increasing with the age.
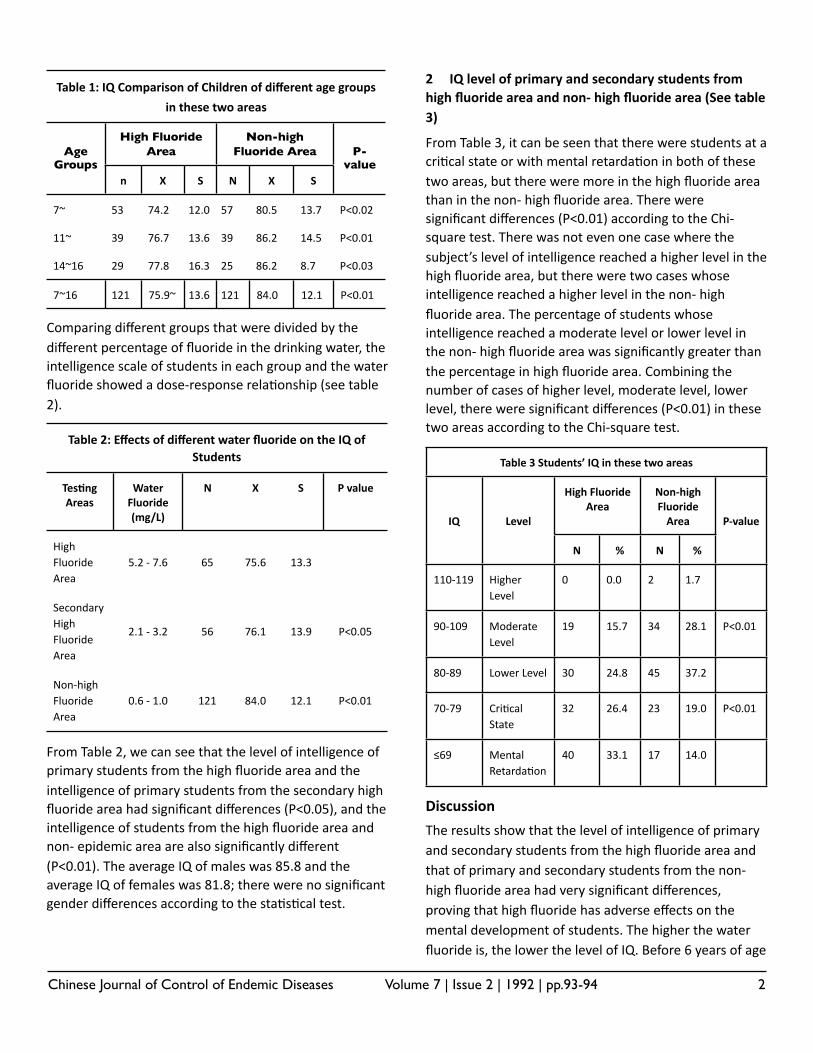
Chinese Journal of Control of Endemic Diseases Volume 7 | Issue 2 | 1992 | pp.93-94 2
Table 1: IQ Comparison of Children of different age groups
in these two areas
Table 1: IQ Comparison of Children of different age groups
in these two areas
Table 1: IQ Comparison of Children of different age groups
in these two areas
Table 1: IQ Comparison of Children of different age groups
in these two areas
Table 1: IQ Comparison of Children of different age groups
in these two areas
Table 1: IQ Comparison of Children of different age groups
in these two areas
Table 1: IQ Comparison of Children of different age groups
in these two areas
Table 1: IQ Comparison of Children of different age groups
in these two areas
Age Groups
High Fluoride Area
High Fluoride Area
High Fluoride Area
Non-high Fluoride Area
Non-high Fluoride Area
Non-high Fluoride Area P-
valueAge
Groupsn X S N X S
P-value
7~ 53 74.2 12.0 57 80.5 13.7 P<0.02
11~ 39 76.7 13.6 39 86.2 14.5 P<0.01
14~16 29 77.8 16.3 25 86.2 8.7 P<0.03
7~16 121 75.9~ 13.6 121 84.0 12.1 P<0.01
Comparing different groups that were divided by the different percentage of fluoride in the drinking water, the intelligence scale of students in each group and the water fluoride showed a dose-‐response relaJonship (see table 2).
Table 2: Effects of different water fluoride on the IQ of Students
Table 2: Effects of different water fluoride on the IQ of Students
Table 2: Effects of different water fluoride on the IQ of Students
Table 2: Effects of different water fluoride on the IQ of Students
Table 2: Effects of different water fluoride on the IQ of Students
Table 2: Effects of different water fluoride on the IQ of Students
Tes(ng Areas
Water Fluoride (mg/L)
N X S P value
High Fluoride Area
5.2 -‐ 7.6 65 75.6 13.3
Secondary High Fluoride Area
2.1 -‐ 3.2 56 76.1 13.9 P<0.05
Non-‐high Fluoride Area
0.6 -‐ 1.0 121 84.0 12.1 P<0.01
From Table 2, we can see that the level of intelligence of primary students from the high fluoride area and the intelligence of primary students from the secondary high fluoride area had significant differences (P<0.05), and the intelligence of students from the high fluoride area and non-‐ epidemic area are also significantly different (P<0.01). The average IQ of males was 85.8 and the average IQ of females was 81.8; there were no significant gender differences according to the staJsJcal test.
2 IQ level of primary and secondary students from high fluoride area and non-‐ high fluoride area (See table 3)
From Table 3, it can be seen that there were students at a criJcal state or with mental retardaJon in both of these two areas, but there were more in the high fluoride area than in the non-‐ high fluoride area. There were significant differences (P<0.01) according to the Chi-‐square test. There was not even one case where the subject’s level of intelligence reached a higher level in the high fluoride area, but there were two cases whose intelligence reached a higher level in the non-‐ high fluoride area. The percentage of students whose intelligence reached a moderate level or lower level in the non-‐ high fluoride area was significantly greater than the percentage in high fluoride area. Combining the number of cases of higher level, moderate level, lower level, there were significant differences (P<0.01) in these two areas according to the Chi-‐square test.
Table 3 Students’ IQ in these two areasTable 3 Students’ IQ in these two areasTable 3 Students’ IQ in these two areasTable 3 Students’ IQ in these two areasTable 3 Students’ IQ in these two areasTable 3 Students’ IQ in these two areasTable 3 Students’ IQ in these two areas
IQ Level
High Fluoride Area
High Fluoride Area
Non-‐high Fluoride Area
Non-‐high Fluoride Area P-‐valueIQ Level
N % N %
P-‐value
110-‐119 Higher Level
0 0.0 2 1.7
90-‐109 Moderate Level
19 15.7 34 28.1 P<0.01
80-‐89 Lower Level 30 24.8 45 37.2
70-‐79 CriJcal State
32 26.4 23 19.0 P<0.01
≤69 Mental RetardaJon
40 33.1 17 14.0
Discussion
The results show that the level of intelligence of primary and secondary students from the high fluoride area and that of primary and secondary students from the non-‐high fluoride area had very significant differences, proving that high fluoride has adverse effects on the mental development of students. The higher the water fluoride is, the lower the level of IQ. Before 6 years of age
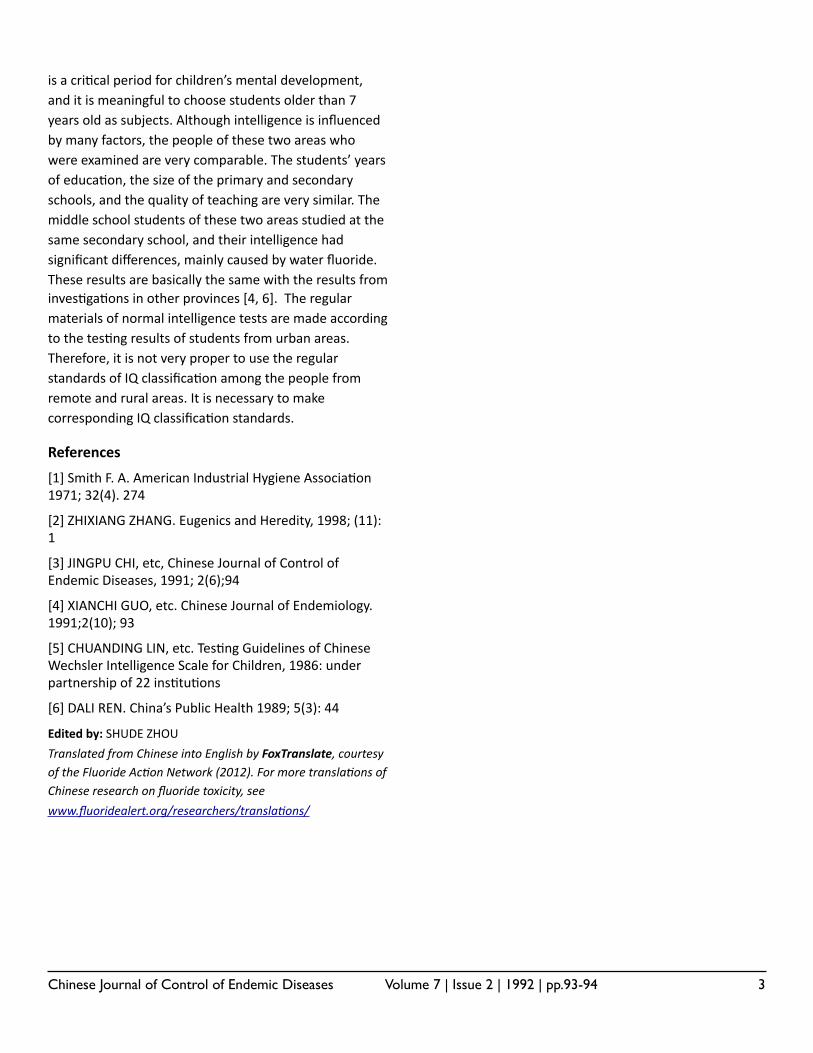
Chinese Journal of Control of Endemic Diseases Volume 7 | Issue 2 | 1992 | pp.93-94 3
is a criJcal period for children’s mental development, and it is meaningful to choose students older than 7 years old as subjects. Although intelligence is influenced by many factors, the people of these two areas who were examined are very comparable. The students’ years of educaJon, the size of the primary and secondary schools, and the quality of teaching are very similar. The middle school students of these two areas studied at the same secondary school, and their intelligence had significant differences, mainly caused by water fluoride. These results are basically the same with the results from invesJgaJons in other provinces [4, 6]. The regular materials of normal intelligence tests are made according to the tesJng results of students from urban areas. Therefore, it is not very proper to use the regular standards of IQ classificaJon among the people from remote and rural areas. It is necessary to make corresponding IQ classificaJon standards.
References
[1] Smith F. A. American Industrial Hygiene AssociaJon 1971; 32(4). 274
[2] ZHIXIANG ZHANG. Eugenics and Heredity, 1998; (11):1
[3] JINGPU CHI, etc, Chinese Journal of Control of Endemic Diseases, 1991; 2(6);94
[4] XIANCHI GUO, etc. Chinese Journal of Endemiology. 1991;2(10); 93
[5] CHUANDING LIN, etc. TesJng Guidelines of Chinese Wechsler Intelligence Scale for Children, 1986: under partnership of 22 insJtuJons
[6] DALI REN. China’s Public Health 1989; 5(3): 44
Edited by: SHUDE ZHOU
Translated from Chinese into English by FoxTranslate, courtesy of the Fluoride Ac:on Network (2012). For more transla:ons of Chinese research on fluoride toxicity, see
www.fluoridealert.org/researchers/transla:ons/
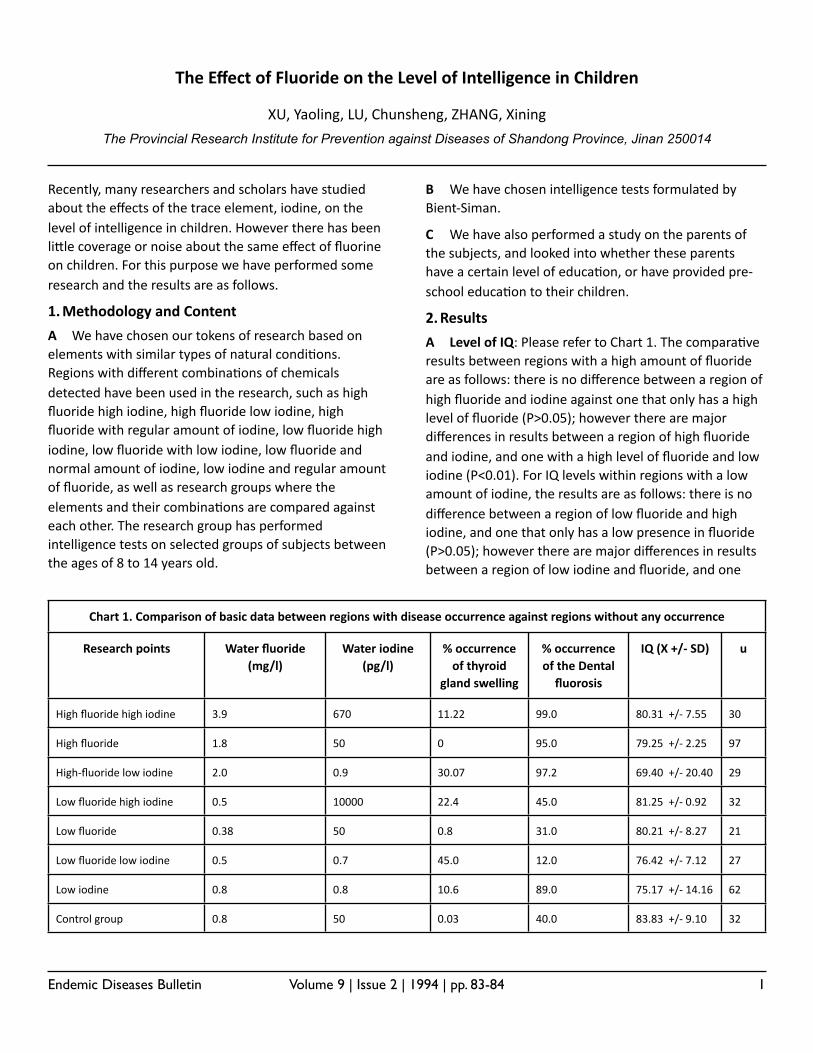
Endemic Diseases Bulletin Volume 9 | Issue 2 | 1994 | pp. 83-84 1
The Effect of Fluoride on the Level of Intelligence in Children
XU, Yaoling, LU, Chunsheng, ZHANG, Xining
The Provincial Research Institute for Prevention against Diseases of Shandong Province, Jinan 250014
Recently, many researchers and scholars have studied about the effects of the trace element, iodine, on the level of intelligence in children. However there has been li;le coverage or noise about the same effect of fluorine on children. For this purpose we have performed some research and the results are as follows.
1.Methodology and Content
A We have chosen our tokens of research based on elements with similar types of natural condiAons. Regions with different combinaAons of chemicals detected have been used in the research, such as high fluoride high iodine, high fluoride low iodine, high fluoride with regular amount of iodine, low fluoride high iodine, low fluoride with low iodine, low fluoride and normal amount of iodine, low iodine and regular amount of fluoride, as well as research groups where the elements and their combinaAons are compared against each other. The research group has performed intelligence tests on selected groups of subjects between the ages of 8 to 14 years old.
B We have chosen intelligence tests formulated by Bient-‐Siman.
C We have also performed a study on the parents of the subjects, and looked into whether these parents have a certain level of educaAon, or have provided pre-‐school educaAon to their children.
2.Results
A Level of IQ: Please refer to Chart 1. The comparaAve results between regions with a high amount of fluoride are as follows: there is no difference between a region of high fluoride and iodine against one that only has a high level of fluoride (P>0.05); however there are major differences in results between a region of high fluoride and iodine, and one with a high level of fluoride and low iodine (P<0.01). For IQ levels within regions with a low amount of iodine, the results are as follows: there is no difference between a region of low fluoride and high iodine, and one that only has a low presence in fluoride (P>0.05); however there are major differences in results between a region of low iodine and fluoride, and one
Chart 1. Comparison of basic data between regions with disease occurrence against regions without any occurrenceChart 1. Comparison of basic data between regions with disease occurrence against regions without any occurrenceChart 1. Comparison of basic data between regions with disease occurrence against regions without any occurrenceChart 1. Comparison of basic data between regions with disease occurrence against regions without any occurrenceChart 1. Comparison of basic data between regions with disease occurrence against regions without any occurrenceChart 1. Comparison of basic data between regions with disease occurrence against regions without any occurrenceChart 1. Comparison of basic data between regions with disease occurrence against regions without any occurrence
Research points Water fluoride (mg/l)
Water iodine (pg/l)
% occurrence of thyroid
gland swelling
% occurrence of the Dental fluorosis
IQ (X +/-‐ SD) u
High fluoride high iodine 3.9 670 11.22 99.0 80.31 +/-‐ 7.55 30
High fluoride 1.8 50 0 95.0 79.25 +/-‐ 2.25 97
High-‐fluoride low iodine 2.0 0.9 30.07 97.2 69.40 +/-‐ 20.40 29
Low fluoride high iodine 0.5 10000 22.4 45.0 81.25 +/-‐ 0.92 32
Low fluoride 0.38 50 0.8 31.0 80.21 +/-‐ 8.27 21
Low fluoride low iodine 0.5 0.7 45.0 12.0 76.42 +/-‐ 7.12 27
Low iodine 0.8 0.8 10.6 89.0 75.17 +/-‐ 14.16 62
Control group 0.8 50 0.03 40.0 83.83 +/-‐ 9.10 32
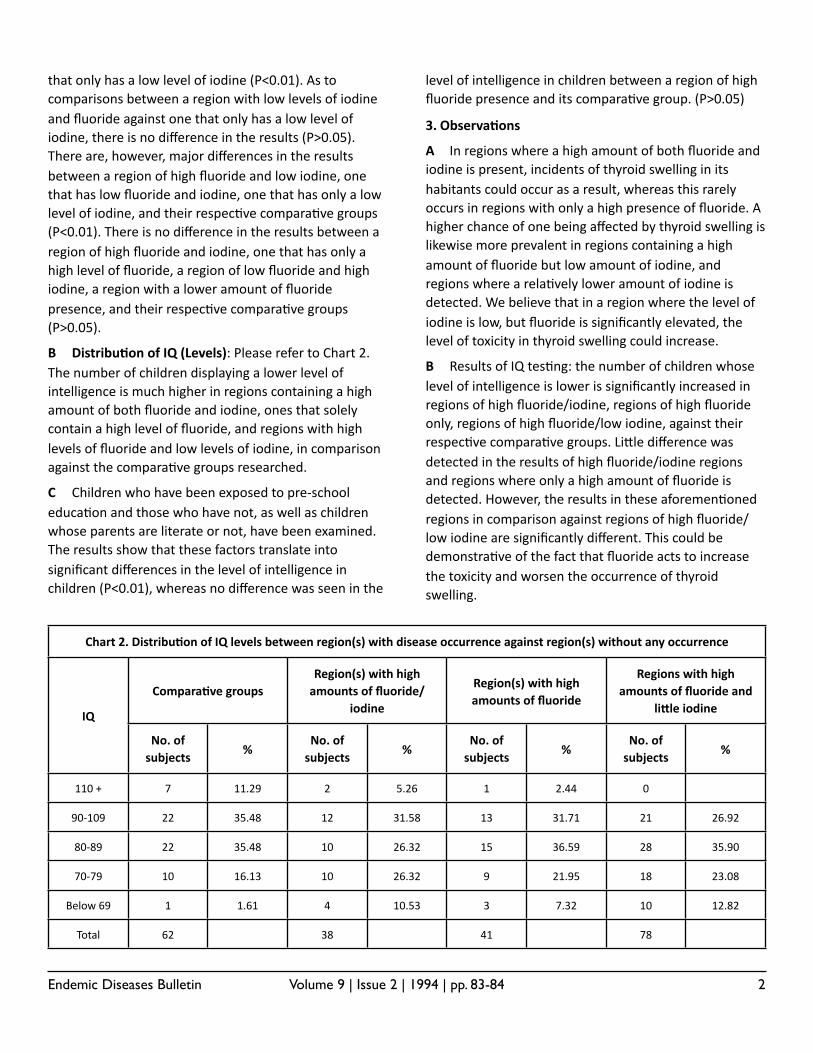
Endemic Diseases Bulletin Volume 9 | Issue 2 | 1994 | pp. 83-84 2
that only has a low level of iodine (P<0.01). As to comparisons between a region with low levels of iodine and fluoride against one that only has a low level of iodine, there is no difference in the results (P>0.05). There are, however, major differences in the results between a region of high fluoride and low iodine, one that has low fluoride and iodine, one that has only a low level of iodine, and their respecAve comparaAve groups (P<0.01). There is no difference in the results between a region of high fluoride and iodine, one that has only a high level of fluoride, a region of low fluoride and high iodine, a region with a lower amount of fluoride presence, and their respecAve comparaAve groups (P>0.05).
B DistribuKon of IQ (Levels): Please refer to Chart 2. The number of children displaying a lower level of intelligence is much higher in regions containing a high amount of both fluoride and iodine, ones that solely contain a high level of fluoride, and regions with high levels of fluoride and low levels of iodine, in comparison against the comparaAve groups researched.
C Children who have been exposed to pre-‐school educaAon and those who have not, as well as children whose parents are literate or not, have been examined. The results show that these factors translate into significant differences in the level of intelligence in children (P<0.01), whereas no difference was seen in the
level of intelligence in children between a region of high fluoride presence and its comparaAve group. (P>0.05)
3. ObservaKons
A In regions where a high amount of both fluoride and iodine is present, incidents of thyroid swelling in its habitants could occur as a result, whereas this rarely occurs in regions with only a high presence of fluoride. A higher chance of one being affected by thyroid swelling is likewise more prevalent in regions containing a high amount of fluoride but low amount of iodine, and regions where a relaAvely lower amount of iodine is detected. We believe that in a region where the level of iodine is low, but fluoride is significantly elevated, the level of toxicity in thyroid swelling could increase.
B Results of IQ tesAng: the number of children whose level of intelligence is lower is significantly increased in regions of high fluoride/iodine, regions of high fluoride only, regions of high fluoride/low iodine, against their respecAve comparaAve groups. Li;le difference was detected in the results of high fluoride/iodine regions and regions where only a high amount of fluoride is detected. However, the results in these aforemenAoned regions in comparison against regions of high fluoride/low iodine are significantly different. This could be demonstraAve of the fact that fluoride acts to increase the toxicity and worsen the occurrence of thyroid swelling.
Chart 2. DistribuKon of IQ levels between region(s) with disease occurrence against region(s) without any occurrenceChart 2. DistribuKon of IQ levels between region(s) with disease occurrence against region(s) without any occurrenceChart 2. DistribuKon of IQ levels between region(s) with disease occurrence against region(s) without any occurrenceChart 2. DistribuKon of IQ levels between region(s) with disease occurrence against region(s) without any occurrenceChart 2. DistribuKon of IQ levels between region(s) with disease occurrence against region(s) without any occurrenceChart 2. DistribuKon of IQ levels between region(s) with disease occurrence against region(s) without any occurrenceChart 2. DistribuKon of IQ levels between region(s) with disease occurrence against region(s) without any occurrenceChart 2. DistribuKon of IQ levels between region(s) with disease occurrence against region(s) without any occurrenceChart 2. DistribuKon of IQ levels between region(s) with disease occurrence against region(s) without any occurrence
IQ
ComparaKve groupsComparaKve groupsRegion(s) with high amounts of fluoride/
iodine
Region(s) with high amounts of fluoride/
iodine
Region(s) with high amounts of fluorideRegion(s) with high amounts of fluoride
Regions with high amounts of fluoride and
liOle iodine
Regions with high amounts of fluoride and
liOle iodineIQ
No. of subjects
%No. of subjects
%No. of subjects
%No. of subjects
%
110 + 7 11.29 2 5.26 1 2.44 0
90-‐109 22 35.48 12 31.58 13 31.71 21 26.92
80-‐89 22 35.48 10 26.32 15 36.59 28 35.90
70-‐79 10 16.13 10 26.32 9 21.95 18 23.08
Below 69 1 1.61 4 10.53 3 7.32 10 12.82
Total 62 38 41 78

Endemic Diseases Bulletin Volume 9 | Issue 2 | 1994 | pp. 83-84 3
C When it comes to the parents’ level of educaAon, and the children’s exposure (or lack thereof) to pre-‐school educaAon, significant differences in the intelligence level in these young subjects are shown in both regions affected by thyroid swelling, and their comparaAve regions. This demonstrates that levels of IQ are not only affected by the amount of trace elements in the environment, but also by social factors such as the educaAon of the subjects, the type of educaAon and training they are exposed to, etc. These social factors most definitely play an important role in this type of research.
Bibliography
[1] MA, Tai & Co.: Regional types of thyroid swelling and cre4nism. The People’s Health Publishing House, Beijing, 1981, 48.
[2] NIE, Ronghua & Co.: Several elements affecAng the development of intelligence in children between 5-‐7 years of age in regions with occurrence of thyroid swelling, goiter and other related diseases and healthy regions: a preliminary study. Chinese Journal of Endemiology, 1984, 3 (3): 161.
Translated from Chinese into English by FoxTranslate, courtesy of the Fluoride Ac4on Network (2012). For more transla4ons of Chinese research on fluoride toxicity, see www.fluoridealert.org/researchers/transla4ons/
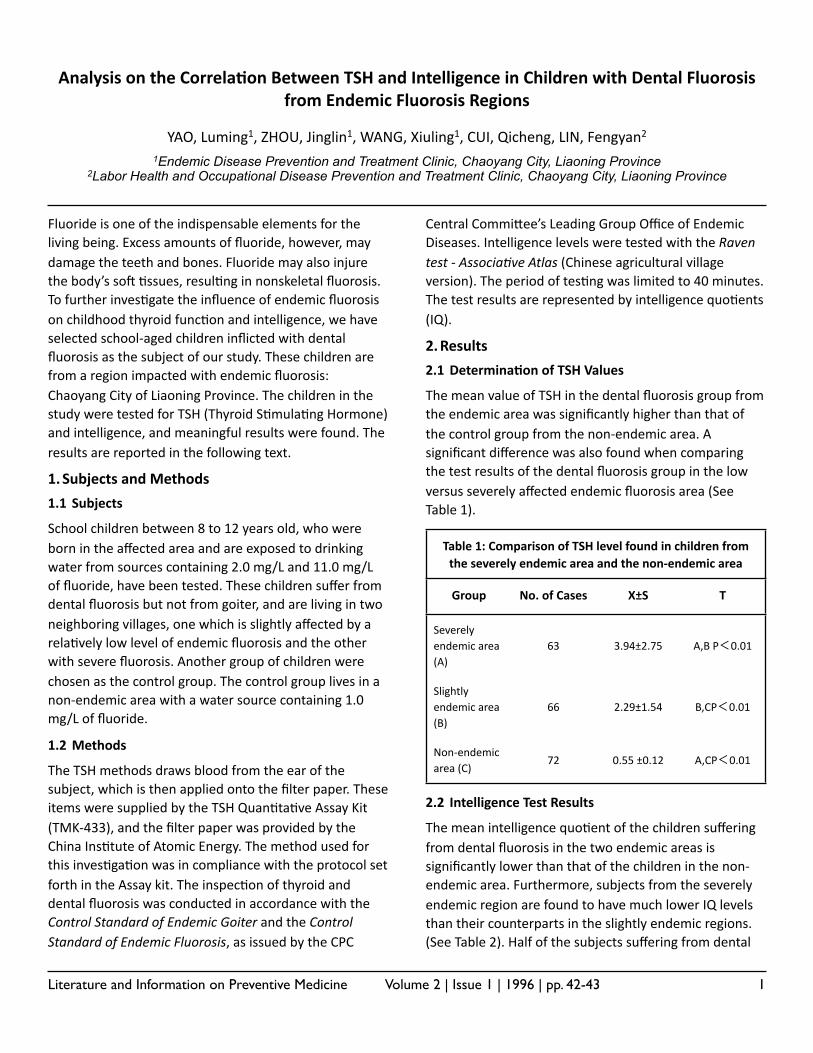
Literature and Information on Preventive Medicine Volume 2 | Issue 1 | 1996 | pp. 42-43 1
Analysis on the Correla/on Between TSH and Intelligence in Children with Dental Fluorosis from Endemic Fluorosis Regions
YAO, Luming1, ZHOU, Jinglin1, WANG, Xiuling1, CUI, Qicheng, LIN, Fengyan2
1Endemic Disease Prevention and Treatment Clinic, Chaoyang City, Liaoning Province2Labor Health and Occupational Disease Prevention and Treatment Clinic, Chaoyang City, Liaoning Province
Fluoride is one of the indispensable elements for the living being. Excess amounts of fluoride, however, may damage the teeth and bones. Fluoride may also injure the body’s soA Bssues, resulBng in nonskeletal fluorosis. To further invesBgate the influence of endemic fluorosis on childhood thyroid funcBon and intelligence, we have selected school-‐aged children inflicted with dental fluorosis as the subject of our study. These children are from a region impacted with endemic fluorosis: Chaoyang City of Liaoning Province. The children in the study were tested for TSH (Thyroid SBmulaBng Hormone) and intelligence, and meaningful results were found. The results are reported in the following text.
1.Subjects and Methods
1.1 Subjects
School children between 8 to 12 years old, who were born in the affected area and are exposed to drinking water from sources containing 2.0 mg/L and 11.0 mg/L of fluoride, have been tested. These children suffer from dental fluorosis but not from goiter, and are living in two neighboring villages, one which is slightly affected by a relaBvely low level of endemic fluorosis and the other with severe fluorosis. Another group of children were chosen as the control group. The control group lives in a non-‐endemic area with a water source containing 1.0 mg/L of fluoride.
1.2 Methods
The TSH methods draws blood from the ear of the subject, which is then applied onto the filter paper. These items were supplied by the TSH QuanBtaBve Assay Kit (TMK-‐433), and the filter paper was provided by the China InsBtute of Atomic Energy. The method used for this invesBgaBon was in compliance with the protocol set forth in the Assay kit. The inspecBon of thyroid and dental fluorosis was conducted in accordance with the Control Standard of Endemic Goiter and the Control Standard of Endemic Fluorosis, as issued by the CPC
Central CommiZee’s Leading Group Office of Endemic Diseases. Intelligence levels were tested with the Raven test -‐ Associa9ve Atlas (Chinese agricultural village version). The period of tesBng was limited to 40 minutes. The test results are represented by intelligence quoBents (IQ).
2.Results
2.1 Determina7on of TSH Values
The mean value of TSH in the dental fluorosis group from the endemic area was significantly higher than that of the control group from the non-‐endemic area. A significant difference was also found when comparing the test results of the dental fluorosis group in the low versus severely affected endemic fluorosis area (See Table 1).
Table 1: Comparison of TSH level found in children from the severely endemic area and the non-‐endemic areaTable 1: Comparison of TSH level found in children from the severely endemic area and the non-‐endemic areaTable 1: Comparison of TSH level found in children from the severely endemic area and the non-‐endemic areaTable 1: Comparison of TSH level found in children from the severely endemic area and the non-‐endemic area
Group No. of Cases X±S T
Severely endemic area (A)
63 3.94±2.75 A,B P<0.01
Slightly endemic area (B)
66 2.29±1.54 B,CP<0.01
Non-‐endemic area (C)
72 0.55 ±0.12 A,CP<0.01
2.2 Intelligence Test Results
The mean intelligence quoBent of the children suffering from dental fluorosis in the two endemic areas is significantly lower than that of the children in the non-‐endemic area. Furthermore, subjects from the severely endemic region are found to have much lower IQ levels than their counterparts in the slightly endemic regions. (See Table 2). Half of the subjects suffering from dental
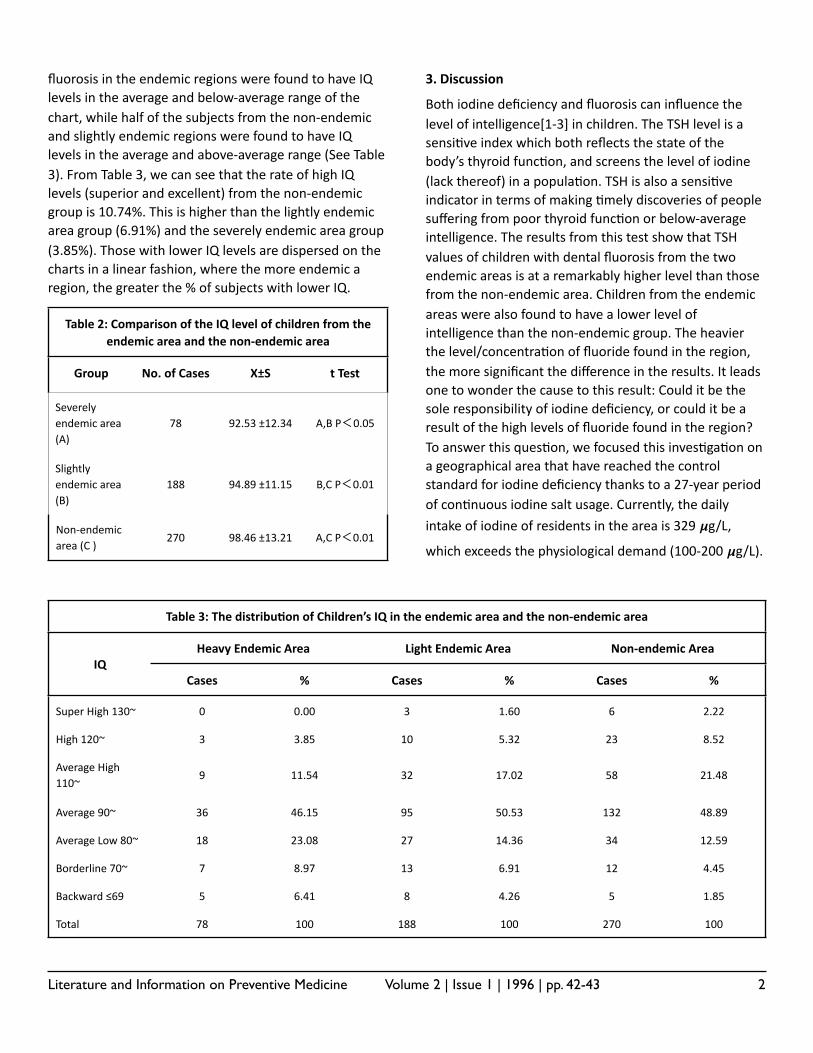
Literature and Information on Preventive Medicine Volume 2 | Issue 1 | 1996 | pp. 42-43 2
fluorosis in the endemic regions were found to have IQ levels in the average and below-‐average range of the chart, while half of the subjects from the non-‐endemic and slightly endemic regions were found to have IQ levels in the average and above-‐average range (See Table 3). From Table 3, we can see that the rate of high IQ levels (superior and excellent) from the non-‐endemic group is 10.74%. This is higher than the lightly endemic area group (6.91%) and the severely endemic area group (3.85%). Those with lower IQ levels are dispersed on the charts in a linear fashion, where the more endemic a region, the greater the % of subjects with lower IQ.
Table 2: Comparison of the IQ level of children from the endemic area and the non-‐endemic area
Table 2: Comparison of the IQ level of children from the endemic area and the non-‐endemic area
Table 2: Comparison of the IQ level of children from the endemic area and the non-‐endemic area
Table 2: Comparison of the IQ level of children from the endemic area and the non-‐endemic area
Group No. of Cases X±S t Test
Severely endemic area (A)
78 92.53 ±12.34 A,B P<0.05
Slightly endemic area (B)
188 94.89 ±11.15 B,C P<0.01
Non-‐endemic area (C )
270 98.46 ±13.21 A,C P<0.01
3. Discussion
Both iodine deficiency and fluorosis can influence the level of intelligence[1-‐3] in children. The TSH level is a sensiBve index which both reflects the state of the body’s thyroid funcBon, and screens the level of iodine (lack thereof) in a populaBon. TSH is also a sensiBve indicator in terms of making Bmely discoveries of people suffering from poor thyroid funcBon or below-‐average intelligence. The results from this test show that TSH values of children with dental fluorosis from the two endemic areas is at a remarkably higher level than those from the non-‐endemic area. Children from the endemic areas were also found to have a lower level of intelligence than the non-‐endemic group. The heavier the level/concentraBon of fluoride found in the region, the more significant the difference in the results. It leads one to wonder the cause to this result: Could it be the sole responsibility of iodine deficiency, or could it be a result of the high levels of fluoride found in the region? To answer this quesBon, we focused this invesBgaBon on a geographical area that have reached the control standard for iodine deficiency thanks to a 27-‐year period of conBnuous iodine salt usage. Currently, the daily
intake of iodine of residents in the area is 329 𝝁g/L,
which exceeds the physiological demand (100-‐200 𝝁g/L).
Table 3: The distribu7on of Children’s IQ in the endemic area and the non-‐endemic areaTable 3: The distribu7on of Children’s IQ in the endemic area and the non-‐endemic areaTable 3: The distribu7on of Children’s IQ in the endemic area and the non-‐endemic areaTable 3: The distribu7on of Children’s IQ in the endemic area and the non-‐endemic areaTable 3: The distribu7on of Children’s IQ in the endemic area and the non-‐endemic areaTable 3: The distribu7on of Children’s IQ in the endemic area and the non-‐endemic areaTable 3: The distribu7on of Children’s IQ in the endemic area and the non-‐endemic area
IQHeavy Endemic AreaHeavy Endemic Area Light Endemic AreaLight Endemic Area Non-‐endemic AreaNon-‐endemic Area
IQCases % Cases % Cases %
Super High 130~ 0 0.00 3 1.60 6 2.22
High 120~ 3 3.85 10 5.32 23 8.52
Average High 110~
9 11.54 32 17.02 58 21.48
Average 90~ 36 46.15 95 50.53 132 48.89
Average Low 80~ 18 23.08 27 14.36 34 12.59
Borderline 70~ 7 8.97 13 6.91 12 4.45
Backward ≤69 5 6.41 8 4.26 5 1.85
Total 78 100 188 100 270 100
Literature and Information on Preventive Medicine Volume 2 | Issue 1 | 1996 | pp. 42-43 3
The mean value of urinary iodine was found to be 131.5
𝝁g/L and measurements of T3 and T4 in the subjects’
serum were within the normal range. As per these results it is safe to conclude that the influence of Iodine deficiency on children can be removed as an explanaBon of the results in this study. In addiBon, the local economy, size of the schools, quality of teachers’ educaBon, and the status of iodine nutriBon are relaBvely the same in the exposed and control groups. This is parBcularly significant in the results from the two neighboring villages who were actually located in the same town (with one being the lightly endemic region and the other being the severely endemic region). The water fluoride level in the former village is 2.0 mg/L, while the water fluoride level in the laZer village is up to 11mg/L. The severity of dental fluorosis from these two areas are deemed to be “serious” and “severe”, respecBvely, which reflects the fact that there is a comparable, yet different, degree of fluoride harm between these two endemic area groups.
The results of the intelligence tests show that a high level of fluoride influences children’s IQ, which is consistent with some previous data[4]. It is worth menBoning that the higher the degree of dental fluorosis, the more negaBve the impact on the children’s intelligence level. This is an issue which merits utmost aZenBon. We believe that the low intelligence of children has no relaBon to the level of TSH. Although there are differences found in TSH values between the endemic area and non-‐endemic area groups, and between the lightly endemic and severely endemic groups, the individual values are all within the normal range. The endemic and non-‐endemic area groups are all control areas of iodine deficiency. Although the subjects were found to suffer from dental fluorosis, no thyroid goiter were found on them. The TSH value rises with the level of the fluoride endemic area (from light to heavy degree) and is the result of interference by high fluoride. Further exploraBon on the influence or harm of this interference on the children’s body is required.
References
[1] Chen Zhihui, et al. Research on influencing factors on children’s intelligence development in iodine deficiency. Chinese Journal of Endemic Control, 1991; 6 (supplement):7.
[2] Tan Yubin. The influence of fluoride on human metabolism and the various systems of the body. Chinese Journal of Endemic Control, 1994; 9(4):230.
[3] He Han, et al. Influence of fluoride on human’s fetus. Chinese Journal of Endemic Control, 1989; 4 (3):136.
[4] Qin Liansheng, et al. Inference and test of the influence of the water fluoride on school-‐aged children’s intelligence with Revan standard. Chinese Journal of Endemic Control, 1990; 5 (4):203.
Accepted on: August 7, 1995.
Translated from Chinese into English by FoxTranslate, courtesy of the Fluoride Ac9on Network (2012). For more transla9ons of Chinese research on fluoride toxicity, see www.fluoridealert.org/researchers/transla9ons/
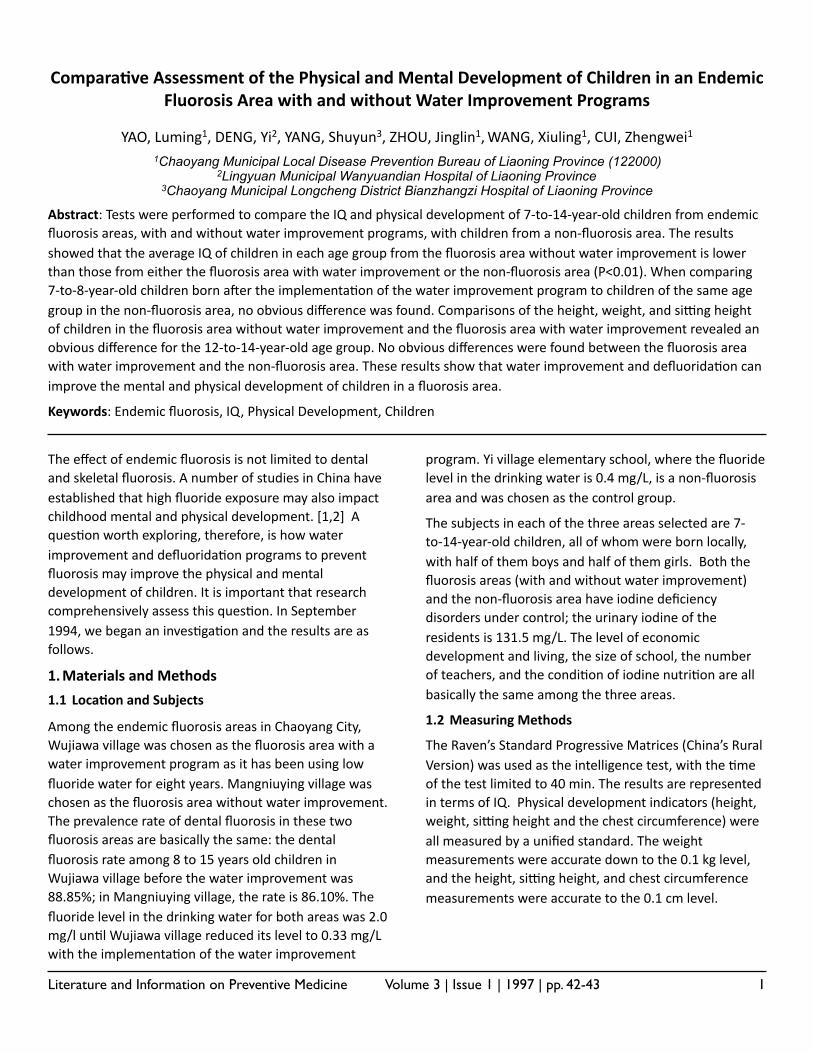
Literature and Information on Preventive Medicine Volume 3 | Issue 1 | 1997 | pp. 42-43 1
Compara've Assessment of the Physical and Mental Development of Children in an Endemic Fluorosis Area with and without Water Improvement Programs
YAO, Luming1, DENG, Yi2, YANG, Shuyun3, ZHOU, Jinglin1, WANG, Xiuling1, CUI, Zhengwei1
1Chaoyang Municipal Local Disease Prevention Bureau of Liaoning Province (122000)2Lingyuan Municipal Wanyuandian Hospital of Liaoning Province
3Chaoyang Municipal Longcheng District Bianzhangzi Hospital of Liaoning Province
Abstract: Tests were performed to compare the IQ and physical development of 7-‐to-‐14-‐year-‐old children from endemic fluorosis areas, with and without water improvement programs, with children from a non-‐fluorosis area. The results showed that the average IQ of children in each age group from the fluorosis area without water improvement is lower than those from either the fluorosis area with water improvement or the non-‐fluorosis area (P<0.01). When comparing 7-‐to-‐8-‐year-‐old children born aKer the implementaLon of the water improvement program to children of the same age group in the non-‐fluorosis area, no obvious difference was found. Comparisons of the height, weight, and siOng height of children in the fluorosis area without water improvement and the fluorosis area with water improvement revealed an obvious difference for the 12-‐to-‐14-‐year-‐old age group. No obvious differences were found between the fluorosis area with water improvement and the non-‐fluorosis area. These results show that water improvement and defluoridaLon can improve the mental and physical development of children in a fluorosis area.
Keywords: Endemic fluorosis, IQ, Physical Development, Children
The effect of endemic fluorosis is not limited to dental and skeletal fluorosis. A number of studies in China have established that high fluoride exposure may also impact childhood mental and physical development. [1,2] A quesLon worth exploring, therefore, is how water improvement and defluoridaLon programs to prevent fluorosis may improve the physical and mental development of children. It is important that research comprehensively assess this quesLon. In September 1994, we began an invesLgaLon and the results are as follows.
1.Materials and Methods
1.1 Loca2on and Subjects
Among the endemic fluorosis areas in Chaoyang City, Wujiawa village was chosen as the fluorosis area with a water improvement program as it has been using low fluoride water for eight years. Mangniuying village was chosen as the fluorosis area without water improvement. The prevalence rate of dental fluorosis in these two fluorosis areas are basically the same: the dental fluorosis rate among 8 to 15 years old children in Wujiawa village before the water improvement was 88.85%; in Mangniuying village, the rate is 86.10%. The fluoride level in the drinking water for both areas was 2.0 mg/l unLl Wujiawa village reduced its level to 0.33 mg/L with the implementaLon of the water improvement
program. Yi village elementary school, where the fluoride level in the drinking water is 0.4 mg/L, is a non-‐fluorosis area and was chosen as the control group.
The subjects in each of the three areas selected are 7-‐to-‐14-‐year-‐old children, all of whom were born locally, with half of them boys and half of them girls. Both the fluorosis areas (with and without water improvement) and the non-‐fluorosis area have iodine deficiency disorders under control; the urinary iodine of the residents is 131.5 mg/L. The level of economic development and living, the size of school, the number of teachers, and the condiLon of iodine nutriLon are all basically the same among the three areas.
1.2 Measuring Methods
The Raven’s Standard Progressive Matrices (China’s Rural Version) was used as the intelligence test, with the Lme of the test limited to 40 min. The results are represented in terms of IQ. Physical development indicators (height, weight, siOng height and the chest circumference) were all measured by a unified standard. The weight measurements were accurate down to the 0.1 kg level, and the height, siOng height, and chest circumference measurements were accurate to the 0.1 cm level.
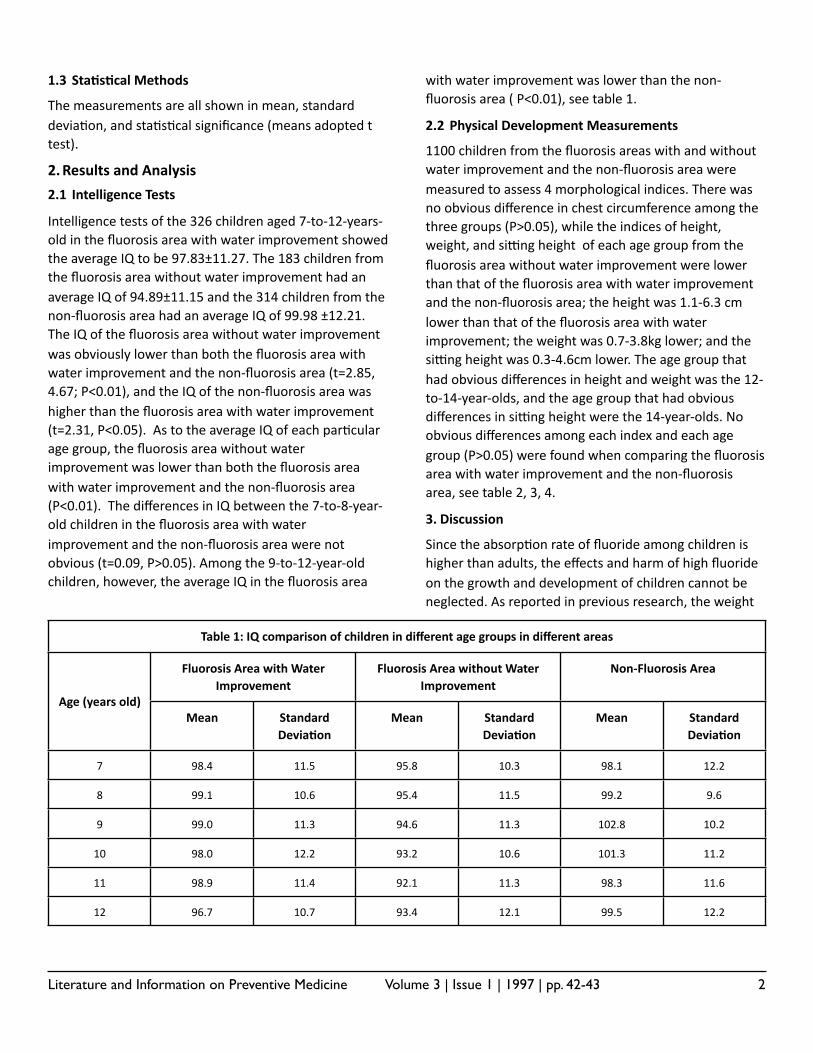
Literature and Information on Preventive Medicine Volume 3 | Issue 1 | 1997 | pp. 42-43 2
1.3 Sta2s2cal Methods
The measurements are all shown in mean, standard deviaLon, and staLsLcal significance (means adopted t test).
2.Results and Analysis
2.1 Intelligence Tests
Intelligence tests of the 326 children aged 7-‐to-‐12-‐years-‐old in the fluorosis area with water improvement showed the average IQ to be 97.83±11.27. The 183 children from the fluorosis area without water improvement had an average IQ of 94.89±11.15 and the 314 children from the non-‐fluorosis area had an average IQ of 99.98 ±12.21. The IQ of the fluorosis area without water improvement was obviously lower than both the fluorosis area with water improvement and the non-‐fluorosis area (t=2.85, 4.67; P<0.01), and the IQ of the non-‐fluorosis area was higher than the fluorosis area with water improvement (t=2.31, P<0.05). As to the average IQ of each parLcular age group, the fluorosis area without water improvement was lower than both the fluorosis area with water improvement and the non-‐fluorosis area (P<0.01). The differences in IQ between the 7-‐to-‐8-‐year-‐old children in the fluorosis area with water improvement and the non-‐fluorosis area were not obvious (t=0.09, P>0.05). Among the 9-‐to-‐12-‐year-‐old children, however, the average IQ in the fluorosis area
with water improvement was lower than the non-‐fluorosis area ( P<0.01), see table 1.
2.2 Physical Development Measurements
1100 children from the fluorosis areas with and without water improvement and the non-‐fluorosis area were measured to assess 4 morphological indices. There was no obvious difference in chest circumference among the three groups (P>0.05), while the indices of height, weight, and siOng height of each age group from the fluorosis area without water improvement were lower than that of the fluorosis area with water improvement and the non-‐fluorosis area; the height was 1.1-‐6.3 cm lower than that of the fluorosis area with water improvement; the weight was 0.7-‐3.8kg lower; and the siOng height was 0.3-‐4.6cm lower. The age group that had obvious differences in height and weight was the 12-‐to-‐14-‐year-‐olds, and the age group that had obvious differences in siOng height were the 14-‐year-‐olds. No obvious differences among each index and each age group (P>0.05) were found when comparing the fluorosis area with water improvement and the non-‐fluorosis area, see table 2, 3, 4.
3. Discussion
Since the absorpLon rate of fluoride among children is higher than adults, the effects and harm of high fluoride on the growth and development of children cannot be neglected. As reported in previous research, the weight
Table 1: IQ comparison of children in different age groups in different areasTable 1: IQ comparison of children in different age groups in different areasTable 1: IQ comparison of children in different age groups in different areasTable 1: IQ comparison of children in different age groups in different areasTable 1: IQ comparison of children in different age groups in different areasTable 1: IQ comparison of children in different age groups in different areasTable 1: IQ comparison of children in different age groups in different areas
Age (years old)
Fluorosis Area with Water Improvement
Fluorosis Area with Water Improvement
Fluorosis Area without Water Improvement
Fluorosis Area without Water Improvement
Non-‐Fluorosis AreaNon-‐Fluorosis Area
Age (years old)Mean Standard
Devia2onMean Standard
Devia2onMean Standard
Devia2on
7 98.4 11.5 95.8 10.3 98.1 12.2
8 99.1 10.6 95.4 11.5 99.2 9.6
9 99.0 11.3 94.6 11.3 102.8 10.2
10 98.0 12.2 93.2 10.6 101.3 11.2
11 98.9 11.4 92.1 11.3 98.3 11.6
12 96.7 10.7 93.4 12.1 99.5 12.2

Literature and Information on Preventive Medicine Volume 3 | Issue 1 | 1997 | pp. 42-43 3
of the brain among 6-‐year-‐old children is about 1,200g, which is 90% of the respecLve weight in adults [3]. Therefore, the pre-‐6-‐year-‐old period is a criLcal one for children’s mental development. Drinking water with high fluoride content during this Lme thus has a significant impact on the intelligence development of children. In this survey, the IQ of two groups of children, who were 7 or 8 years old and were born aKer drinking low fluoride water, was not obviously different from the IQ of children from the non-‐fluorosis area. This is mainly because the children of this age group have always been drinking low fluoride water and have not been exposed to high fluoride. By contrast, since the water improvement program was implemented 8 years ago, the children who are currently 9-‐to-‐12-‐years-‐old were exposed to a high fluoride environment either in the fetal period in the womb or within the four years aKer birth. Although they are now drinking low fluoride water, they have been exposed to various levels of fluoride harm during the
criLcal period of childhood brain development and their mental development has been influenced to a certain degree. As a result, their current IQ is sLll lower than that of the non-‐fluorosis area.
The results of measurements of morphological indices showed that the height, weight and siOng height of children in the fluorosis area without water improvement were lower than the groups from the fluorosis area with water improvement and the non-‐fluorosis area. The age group that had obvious differences was mainly the 12-‐to-‐14-‐year-‐olds, which indicates that this age group is at the second rapid growth period for children’s growth and development. High fluoride delays and postpones the growth and development of children. Comparing the chest circumference among the three groups, there was no obvious difference, which indicates that high fluoride exposure had linle effect on the development of chest circumference.
Table 2: Comparison of height of children in different age groups in endemic fluorosis area with and without water Improvement (cm)
Table 2: Comparison of height of children in different age groups in endemic fluorosis area with and without water Improvement (cm)
Table 2: Comparison of height of children in different age groups in endemic fluorosis area with and without water Improvement (cm)
Table 2: Comparison of height of children in different age groups in endemic fluorosis area with and without water Improvement (cm)
Table 2: Comparison of height of children in different age groups in endemic fluorosis area with and without water Improvement (cm)
Table 2: Comparison of height of children in different age groups in endemic fluorosis area with and without water Improvement (cm)
Table 2: Comparison of height of children in different age groups in endemic fluorosis area with and without water Improvement (cm)
Table 2: Comparison of height of children in different age groups in endemic fluorosis area with and without water Improvement (cm)
Table 2: Comparison of height of children in different age groups in endemic fluorosis area with and without water Improvement (cm)
Table 2: Comparison of height of children in different age groups in endemic fluorosis area with and without water Improvement (cm)
Age (years old)
Fluorosis Area with Water Improvement
Fluorosis Area with Water Improvement
Fluorosis Area with Water Improvement
Fluorosis Area without Water Improvement
Fluorosis Area without Water Improvement
Fluorosis Area without Water Improvement
Non-‐Fluorosis AreaNon-‐Fluorosis AreaNon-‐Fluorosis AreaAge (years old) No. of
childrenMean Standard
Devia2onNo. of children
Mean Standard Devia2on
No. of children
Mean Standard Devia2on
8 144 121.9 1.8 64 120.8 3.1 168 122.8 3.7
10 138 132.6 3.1 46 131.4 3.2 166 132.8 3.4
12 72 143.7 3.6 62 139.6 2.8 198 144.2 3.9
14 14 152.8 2.3 16 146.5 3.2 22 153.5 3.4
Table 3: Comparison of weight of children in different age groups in endemic fluorosis area with and without water improvement (kg)
Table 3: Comparison of weight of children in different age groups in endemic fluorosis area with and without water improvement (kg)
Table 3: Comparison of weight of children in different age groups in endemic fluorosis area with and without water improvement (kg)
Table 3: Comparison of weight of children in different age groups in endemic fluorosis area with and without water improvement (kg)
Table 3: Comparison of weight of children in different age groups in endemic fluorosis area with and without water improvement (kg)
Table 3: Comparison of weight of children in different age groups in endemic fluorosis area with and without water improvement (kg)
Table 3: Comparison of weight of children in different age groups in endemic fluorosis area with and without water improvement (kg)
Table 3: Comparison of weight of children in different age groups in endemic fluorosis area with and without water improvement (kg)
Table 3: Comparison of weight of children in different age groups in endemic fluorosis area with and without water improvement (kg)
Table 3: Comparison of weight of children in different age groups in endemic fluorosis area with and without water improvement (kg)
Age (years old)
Fluorosis Area with Water Improvement
Fluorosis Area with Water Improvement
Fluorosis Area with Water Improvement
Fluorosis Area without Water Improvement
Fluorosis Area without Water Improvement
Fluorosis Area without Water Improvement
Non-‐Fluorosis AreaNon-‐Fluorosis AreaNon-‐Fluorosis AreaAge (years old) No. of
childrenMean Standard
Devia2onNo. of children
Mean Standard Devia2on
No. of children
Mean Standard Devia2on
8 144 23.9 1.5 64 23.2 1.9 168 24.5 1.6
10 138 28.1 2.3 46 27.3 2.1 166 29.0 1.9
12 72 37.2 2.5 62 33.6 1.5 198 37.7 2.1
14 14 43.3 1.5 16 39.5 2.7 22 42.8 1.8
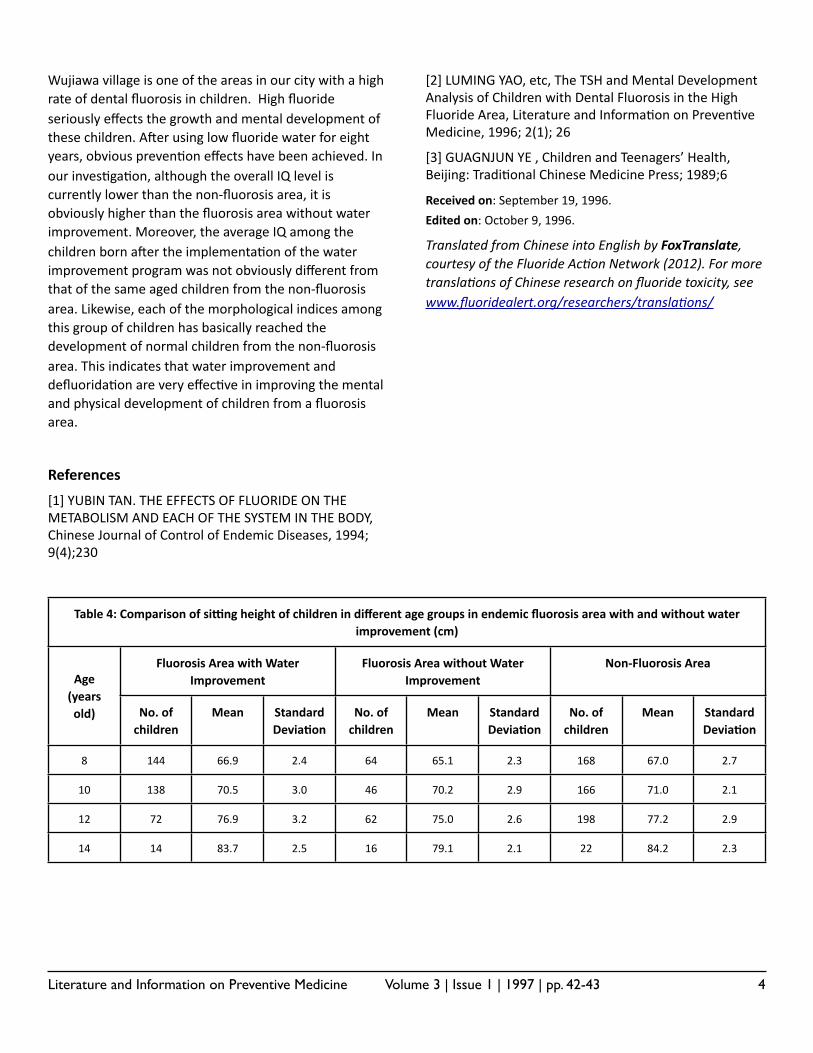
Literature and Information on Preventive Medicine Volume 3 | Issue 1 | 1997 | pp. 42-43 4
Wujiawa village is one of the areas in our city with a high rate of dental fluorosis in children. High fluoride seriously effects the growth and mental development of these children. AKer using low fluoride water for eight years, obvious prevenLon effects have been achieved. In our invesLgaLon, although the overall IQ level is currently lower than the non-‐fluorosis area, it is obviously higher than the fluorosis area without water improvement. Moreover, the average IQ among the children born aKer the implementaLon of the water improvement program was not obviously different from that of the same aged children from the non-‐fluorosis area. Likewise, each of the morphological indices among this group of children has basically reached the development of normal children from the non-‐fluorosis area. This indicates that water improvement and defluoridaLon are very effecLve in improving the mental and physical development of children from a fluorosis area.
References
[1] YUBIN TAN. THE EFFECTS OF FLUORIDE ON THE METABOLISM AND EACH OF THE SYSTEM IN THE BODY, Chinese Journal of Control of Endemic Diseases, 1994; 9(4);230
[2] LUMING YAO, etc, The TSH and Mental Development Analysis of Children with Dental Fluorosis in the High Fluoride Area, Literature and InformaLon on PrevenLve Medicine, 1996; 2(1); 26
[3] GUAGNJUN YE , Children and Teenagers’ Health, Beijing: TradiLonal Chinese Medicine Press; 1989;6
Received on: September 19, 1996.
Edited on: October 9, 1996.
Translated from Chinese into English by FoxTranslate, courtesy of the Fluoride Ac:on Network (2012). For more transla:ons of Chinese research on fluoride toxicity, see www.fluoridealert.org/researchers/transla:ons/
Table 4: Comparison of siUng height of children in different age groups in endemic fluorosis area with and without water improvement (cm)
Table 4: Comparison of siUng height of children in different age groups in endemic fluorosis area with and without water improvement (cm)
Table 4: Comparison of siUng height of children in different age groups in endemic fluorosis area with and without water improvement (cm)
Table 4: Comparison of siUng height of children in different age groups in endemic fluorosis area with and without water improvement (cm)
Table 4: Comparison of siUng height of children in different age groups in endemic fluorosis area with and without water improvement (cm)
Table 4: Comparison of siUng height of children in different age groups in endemic fluorosis area with and without water improvement (cm)
Table 4: Comparison of siUng height of children in different age groups in endemic fluorosis area with and without water improvement (cm)
Table 4: Comparison of siUng height of children in different age groups in endemic fluorosis area with and without water improvement (cm)
Table 4: Comparison of siUng height of children in different age groups in endemic fluorosis area with and without water improvement (cm)
Table 4: Comparison of siUng height of children in different age groups in endemic fluorosis area with and without water improvement (cm)
Age (years old)
Fluorosis Area with Water Improvement
Fluorosis Area with Water Improvement
Fluorosis Area with Water Improvement
Fluorosis Area without Water Improvement
Fluorosis Area without Water Improvement
Fluorosis Area without Water Improvement
Non-‐Fluorosis AreaNon-‐Fluorosis AreaNon-‐Fluorosis AreaAge (years old) No. of
childrenMean Standard
Devia2onNo. of children
Mean Standard Devia2on
No. of children
Mean Standard Devia2on
8 144 66.9 2.4 64 65.1 2.3 168 67.0 2.7
10 138 70.5 3.0 46 70.2 2.9 166 71.0 2.1
12 72 76.9 3.2 62 75.0 2.6 198 77.2 2.9
14 14 83.7 2.5 16 79.1 2.1 22 84.2 2.3
Chinese Journal of Endemiology Volume 20 | Issue 4 | July 2001 | pp. 288-290 1
Effects of High Iodine and High Fluorine on Children’s Intelligence and Thyroid Func:on
WANG, Xiu-‐hong, WANG, Ling-‐fang, HU, Pi-‐ying, GUO, Xiao-‐wei, LUO, Xiao-‐hong
Shandong Institute of Prevention and Treatment of Endemic Disease, Jinana 250014, Shandong Province
Abstract:
Objec+ve: Try to find out the effects of high iodine and high fluorine on children’s intelligence and thyroid func8on.
Methods: We selected in Qingyun County the Lidian Primary School, where the iodine and fluorine in the water are rela8vely high in concentra8on as the inves8ga8ve point and Dading Primary School where the iodine and fluorine in the water have normal concentra8on as the control point. The high iodine goiter rate, dental fluorosis, IQ and thyroid metabolism indicators of the students aged 8 to 12 from the two schools were examined.
Results: In high iodine and high fluorine areas, the goiter rate and dental fluorosis of 8~12 years children were 29.8% and 72.98%. The children’s average intelligence quo8ent (IQ) was 76.67±7.75, slightly lower than comparison point, but low intelligent pupil was 16.67%. The urinary iodine and urinary fluoride were (816.25±1.80) µg/L and (3.08±1.03)mg/L separately, clearly higher than comparison point. The thyroid iodine-‐131 uptake rates were visible lower. The value of 3h and 24h were respec8vely (9.36±1.55)% and (9.26±4.63)%. The serum TSH level was obviously higher than comparison point.
Conclusions: High iodine and high fluorine have certain influence on children’s intelligence and thyroid func8on.
Keywords: High iodine goiter; Dental fluorosis; Intelligence quo8ent; Thyroid hormone
Iodine and fluorine are necessary trace elements in the life ac8vi8es of the body; both are in the halogen family, with similar chemical natures[1] and accompany each other in the water environment. In the ci8es of Binzhou and Dezhou in Shandong Province, people are sick with high-‐iodine goiter and dental fluorosis, because the iodine and fluorine in the water of deep wells are higher than the normal standard. To find out the effects of high iodine and high fluorine on children’s intelligence and thyroid func8on, we carried out comparison inves8ga8ons on children in primary schools of the key villages in Qingyun County. The results are reported as follows.
1.Object and Methods
1.1 Inves+ga+on Areas:
We selected Lidian Primary School (with water iodine of 1,100 µg/L and water fluorine of 2.97 mg/L) as inves8ga8ve point and Dading Primary School (with water iodine of 128.67 µg/L and water fluorine of 0.5 mg/L) as the control point.
1.2 Inves+ga+on Objects and Content
We inves8gated the thyroid and dental status of the children in the age of 8-‐12 of two primary schools, about 30 children in Grade 4 were selected randomly in each
school for the examina8on of intelligence, urinary iodine, urinary fluoride, the thyroid iodine-‐131 uptake rates and the serum TSH level.
1.3 Examina+on Methods for Each Indicator
1.3.1 The Diagnosis of Thyroid Goiter and Dental Fluorosis: The diagnosis was executed according to the na8onal preven8on standard. The examina8on of thyroid used Palpa8on and the examina8on of dental fluorosis used the Dean method.
1.3.2 Intelligence Test: The test used was the atlas and norm of Combined Raven's Test (Chinese village version). The descrip8ve classifica8ons of intelligence quo8ents were as follows: IQ scores above 130 indicate are very superior, scores between 120 and 129 indicate superior, scores between 110 and 119 indicate high average, scores between 90 and 109 indicate average, scores between 80 and 89 indicate low average, scores between 70 and 79 indicate borderline, scores below 70 indicate extremely low.
1.3.3 Physical and Chemical Indicator: Water iodine applies Na2S2O3 8tra8on, the urinary iodine applies acid diges8on, represented by µg/L; water fluorine and urinary fluorine applies fluorine ion selec8ve electrode, represented by mg/L.

Chinese Journal of Endemiology Volume 20 | Issue 4 | July 2001 | pp. 288-290 2
1.3.4 Test of Thyroid Iodine-‐131 Uptake Rates: The test used FH-‐458 thyroid at site.
1.3.5 Test of Serum Hormone: To test TSH we used the immunoradiometric assay (IRMA), while to test T3 and T4 we used Radioimmunoassay(RIA).
2.Results
2.1 Condi+ons of Children’s Thyroid Goiter and Dental Fluorosis
In high iodine and high fluorine areas, the goiter and dental fluorosis rates of children aged from 8 to 12 were clearly higher than the control point, indica8ng that high iodine and high fluorosis have worse effects on children’s thyroid and teeth (See Table 1).
Table 1: Condi+ons of Children’s Thyroid Goiter and Dental Fluorosis
Table 1: Condi+ons of Children’s Thyroid Goiter and Dental Fluorosis
Table 1: Condi+ons of Children’s Thyroid Goiter and Dental Fluorosis
Table 1: Condi+ons of Children’s Thyroid Goiter and Dental Fluorosis
Table 1: Condi+ons of Children’s Thyroid Goiter and Dental Fluorosis
Table 1: Condi+ons of Children’s Thyroid Goiter and Dental Fluorosis
ItemsNo.
Children Examined
Thyroid GoiterThyroid Goiter
Dental FluorosisDental Fluorosis
ItemsNo.
Children Examined
No.Rate (%)
No.Rate (%)
Inves8ga8ve Point
322 96 29.81 235 72.98
Control Point 193 31 16.07 35 18.13
2.2 Children’s Intelligence and Distribu+on
There are no obvious differences of children’s average intelligence quo8ents between the high iodine/high fluorine areas and comparison point (P>0.05). But the propor8on of children at the level of borderline and extremely low is obviously increased (See Table 2) .
2.3 Test Results of Children’s Urinary Iodine and Urinary Fluoride
Urinary iodine and urinary fluorine of the children in the endemic areas were obviously higher than control point (P<0.001), indica8ng that children took a large amount of iodine and fluorine from the drinking water, and the metabolism of iodine and fluorine in the internal environment of the body was rela8vely high (See Table 3).
Table 3: Test results of Children’s Urinary Iodine and Urinary Fluorine (ᵡ±s)
Table 3: Test results of Children’s Urinary Iodine and Urinary Fluorine (ᵡ±s)
Table 3: Test results of Children’s Urinary Iodine and Urinary Fluorine (ᵡ±s)
Table 3: Test results of Children’s Urinary Iodine and Urinary Fluorine (ᵡ±s)
GroupNumber of
Cases
Urinary Iodine (µg/L)
Urinary Fluoride(mg/L)
Inves8ga8ve Point
30 816.25±1.80 3.08±1.03
Control point 29 212.04±1.95 0.82±0.56
2.4 Test Results of Children’s Thyroid-‐131 I Updake Rates (RIAU)
The average thyroid-‐131I uptake rates of children in the high-‐iodine/fluorine area at 3h and 24h are similar and visibly lower than the comparison point, with the peaks occurring earlier (See Table 4).
Table 2: Children’s Intelligence and Distribu+onTable 2: Children’s Intelligence and Distribu+onTable 2: Children’s Intelligence and Distribu+onTable 2: Children’s Intelligence and Distribu+onTable 2: Children’s Intelligence and Distribu+onTable 2: Children’s Intelligence and Distribu+onTable 2: Children’s Intelligence and Distribu+onTable 2: Children’s Intelligence and Distribu+onTable 2: Children’s Intelligence and Distribu+onTable 2: Children’s Intelligence and Distribu+on
Items NumberIQ value(ᵡ±s)
Distribu+on of different IQ values (%)Distribu+on of different IQ values (%)Distribu+on of different IQ values (%)Distribu+on of different IQ values (%)Distribu+on of different IQ values (%)Distribu+on of different IQ values (%)Distribu+on of different IQ values (%)Items Number
IQ value(ᵡ±s) ≤69 70~79 80~89 90~109 110~119 120~129 ≥130
Inves8ga8ve
Point30 76.67±7.75 16.67 36.67 20.00 13.33 10.00 3.33 0
Control point 30 81.67±11.97 10.00 16.67 30.00 26.67 10.00 6.67 0
Chinese Journal of Endemiology Volume 20 | Issue 4 | July 2001 | pp. 288-290 3
Table 4: Test Results of Children’s Thyroid -‐131I Uptake Rates (ᵡ±s)
Table 4: Test Results of Children’s Thyroid -‐131I Uptake Rates (ᵡ±s)
Table 4: Test Results of Children’s Thyroid -‐131I Uptake Rates (ᵡ±s)
Table 4: Test Results of Children’s Thyroid -‐131I Uptake Rates (ᵡ±s)
Items Number
Thyroid Iodine Uptake Rates (ᵡ±s)
Thyroid Iodine Uptake Rates (ᵡ±s)
Items Number
3h 24h
Inves8ga8ve Point 27 9.36±1.55 9.26±4.63
Comparison Point 31 13.42±2.88 22.79±5.29
2.5 Test Results of Children’s Serum TSH Level
The serum TSH level was obviously higher than comparison point (See Table 5).
Table 5 Test Results of Children’s Serum TSH (ᵡ±s)Table 5 Test Results of Children’s Serum TSH (ᵡ±s)Table 5 Test Results of Children’s Serum TSH (ᵡ±s)Table 5 Test Results of Children’s Serum TSH (ᵡ±s)Table 5 Test Results of Children’s Serum TSH (ᵡ±s)
Items No.T3
(nmol/L)T4 (nmol/L)
TSH (mU/L)
Inves8ga8ve point
29 0.76±0.36 147.83±48.31 3.37±2.16
Control point
33 0.74±0.43 128.46±38.12 0.82±0.51
3. Discussion
In high iodine and high fluorine areas, the goiter and dental fluorosis rates of children aged from 8 to 12 were 29.8% and 72.98%. The children’s average intelligence quo8ent (IQ) was 76.67±7.75, slightly lower than the control point. The rate of low intelligence and borderline intelligence were 16.67% and 36.67% respec8vely, obviously higher than the control point. This is consistent with the other reports[2,3] on the effects of high iodine and fluorine on children’s intelligence. The number of children tested is not enough in this intelligence inves8ga8on so further research is needed into the effects of high iodine and high fluorine on children’s intelligence.
The urinary iodine and urinary fluorine of children in high iodine and high fluorosis areas are obviously higher than the control point, showing that metabolism of iodine and fluorine in the internal environment of the body is at a high level. The thyroid-‐131I uptake rates (RAIU) is also one of the sensi8ve indicators for the iodine metabolic
level of body. The RAIU value at 3h and 24h were close and the peak occurred early, indica8ng that high iodine and high fluorine may suppress the thyroid-‐131I uptake func8on. High iodine is the main reactor[4]. As for the effects of fluorine on thyroid-‐131I uptake func8on, different opinions appear in the literature. Fluorine is believed to have no effect on thyroid [5], while it is also believed that fluorine and iodine are compe88ve or collabora8ve for target organs and that fluorine suppresses thyroid to uptake 131I [6].
TSH value was obviously higher than the control point, indica8ng that, under high iodine and high fluorine condi8on, T3 and T4 secreted by the thyroid are in the normal range, while TSH value secreted by the pituitary clearly increased. This is probably because high iodine and high fluorine suppress the synthesis and secre8on of the thyroid peroxidase and thyroid hormones and other circles. The body accelerates the Hypothalamic TRH secre8on by nega8ve feedback regula8on, thus increasing the secre8on of TSH, s8mula8ng the composi8on of T3 and T4 of the thyroid. As a result, the TSH in the peripheral blood circula8on is high while T3 and T4 are not clearly reduced.
In conclusion, high iodine and high fluorine in the drinking water have, to some extent, effects on children’s intelligence and thyroid func8on. For the diseases induced by high iodine and high fluorine, the change of water resources is an important preven8on. In addi8on, we should seek new water sources, limit the intake and absorp8on of high iodine and high fluorine, and accelerate the drainage of iodine and fluorine from the body. The health sector should look for and monitor new water resources.
References
[1] Rao Zhengmin. Inves8ga8on and Research of the Rela8onship Between Trace Elements and Local Fluorosis [J]. Chinese Journal of Endemiology, 1992, 11(2):100.
[2] Xie Jiliang, Qi Quan, Zou Jiyuan, et al. Inves8ga8on and Research on Children’s Intelligence in the Waterborne Thyroid Disease Areas[J]. Chinese Journal of Control of Endemic Diseases, 1987,2(1):27.
[3] Liu Shusen, Lv Yan, Sun Zengrong, et al. Inves8ga8on on Intelligence Level of Children in High Fluorine Area[J]. Chinese Journal of Control of Endemic Diseases, 2000,15(4):231.
Chinese Journal of Endemiology Volume 20 | Issue 4 | July 2001 | pp. 288-290 4
[4] Zhang Jihe, Li Ximing, Ding Ping, et al. Thyroid Goiter-‐131 Iodine Uptake Rates and Peripheral Thyroid Hormone Levels of the Ci8zens in High Iodine Area. Chinese Journal of Endemiology [J], 1997, 16 (2):125.
[5] WHO Fluorine and Fluorides [M]. WHO. Genvea, 1984, 90.
[6] Chen Chongyi. The Effects of Iodine and Calcium, Fluorine, Sulfur, Cyanide, Nitrate, Copper, Selenium on Thyroid[J]. Chinese Journal of Control of Endemic Diseases, 1993, 8(2):95.
[7] Yang Yingkui, Zhang Xining, Zhang Huafang, et al. Study on the Iodine Metabolic, the Pituitary and Thyroid Func8on of the Thyroid Pa8ents in High Iodine Area and on Thyroid Pathology [J]. Chinese Journal of Control of Endemic Diseases, 1988, 3 (6):338.
Translated from Chinese into English by FoxTranslate, courtesy of the Fluoride AcHon Network (2012). For more translaHons of Chinese research on fluoride toxicity, see www.fluoridealert.org/researchers/translaHons/
Chinese Journal of Endemiology Volume 22 | Issue 4 | July 2003 | pp. 336-338 1
Ini$al Study of Cogni$ve Func$on Impairment as Caused by Chronic Fluorosis
SHAO, Quanli1, WANG, Yanan2, LI, Liangwen3, LI, Jian4
1CGuiyang Medical College, Guiyang 550004, China2Biochemical Department of Stockholm University, Rasundouagen 0046-16967
3Nayong County Hospital of Guizhou, Nayong 553300, Guizhou Province, China4Clinical Office of Guizhou Military Area, Guiyang 550002, Guizhou Province, China
Abstract:
Objec+ve: To inves.gate whether an impairment in cogni.ve func.on exists in pa.ents diagnosed with fluoride poisoning as well as its biological basis.
Methods: Individuals suffering from fluoride poisoning from a high fluorine region were selected for the study group, while healthy individuals from a non-‐endemic region were selected as the control group. Using specific psychological methods, the indices of blood oxida.ve stress were also tested with the following: Thiobarbituric acid reac.on (TBA) for serum lipid peroxide (LPO), Ellman’s for reduced glutathione (GSH) in serum, nitrite method for superoxide dismutase (SOD) in red blood cells, and the Dithiobis-‐nitrobenzoic acid (DTNB) method for glutathione peroxidase (GSH-‐Px) in serum. As to determining the amount of NO in the subjects, this was done through tes.ng the nitrous and nitrate (NO2-‐/NO3-‐) in serum.
Results: Between the study group and the control group, significant differences were observed in the data gathered from the psychological tests. Big differences were found in the tests of language fluency, recogni.on, similarity, associa.ve learning, and working memory (digit span test). The total failure numbers from the psychological tests and the concentra.on of NO demonstrated a significant posi.ve correla.on, while the similarity test showed a significant nega.ve correla.on. SOD ac.vity showed a significant nega.ve correla.on with the similarity and digit span tests.
Conclusion: The results suggest that some cogni.ve func.on limita.ons exist in those suffering from chronic fluoride poisoning, and its biologic basis may be related to the levels of SOD and NO.
Keywords: Chronic Fluoride Poisoning; Cogni.ve Func.on; Oxida.ve Stress
Endemic fluorosis can cause overall pathological injury to the human body [1], and yet its pathogenesis con.nues to remain unclear. Only a rela.vely few number of studies discussing the influence of endemic fluorosis on the pa.ents’ level of intelligence are presently available. This study examined the influence of chronic fluoride poisoning on the intelligence of pa.ents in the endemic area of Guizhou Province. We focused in par.cular on the correla.on between the pa.ents’ cogni.ve func.ons and oxida.ve stress as a result of con.nuous excessive exposure to fluoride (which could cause poten.al oxida.ve increase in the brain .ssues as seen in tests performed on lab rats).
1.Subjects and Methods
1.1 Subjects
1.1.1 Study Group. Individuals suffering from fluoride poisoning were selected from an endemic area
in Bijie City, Guizhou Province, which is not an area impacted by iodine-‐deficiency.
Selec/on criteria. Individuals with fluoride poisoning were iden.fied as those with a diagnosis of dental fluorosis, a decrease in bone density upon X-‐ray examina.on, a thickening of the periosteum, calcifica.on of the skeletal muscle and ligaments, and a decrease in physical fitness and cholinesterase ac.vity, etc. Selec.on was further limited to subjects between the ages of 30 and 50, who had been suffering from the disease for over 2 years, who had not yet accepted systemic treatment or used an.oxidants, who had been excluded from experiencing symptoms of mental disorders caused by stunted mental development and/or organic and soma.c diseases of the brain. 49 individuals (37 males, 12 females) were selected in total, all of whom were farmers. The average age was 42±6 years and the average length of educa.on was 10±2 years. 20 people from the group obtained a high school degree, 25
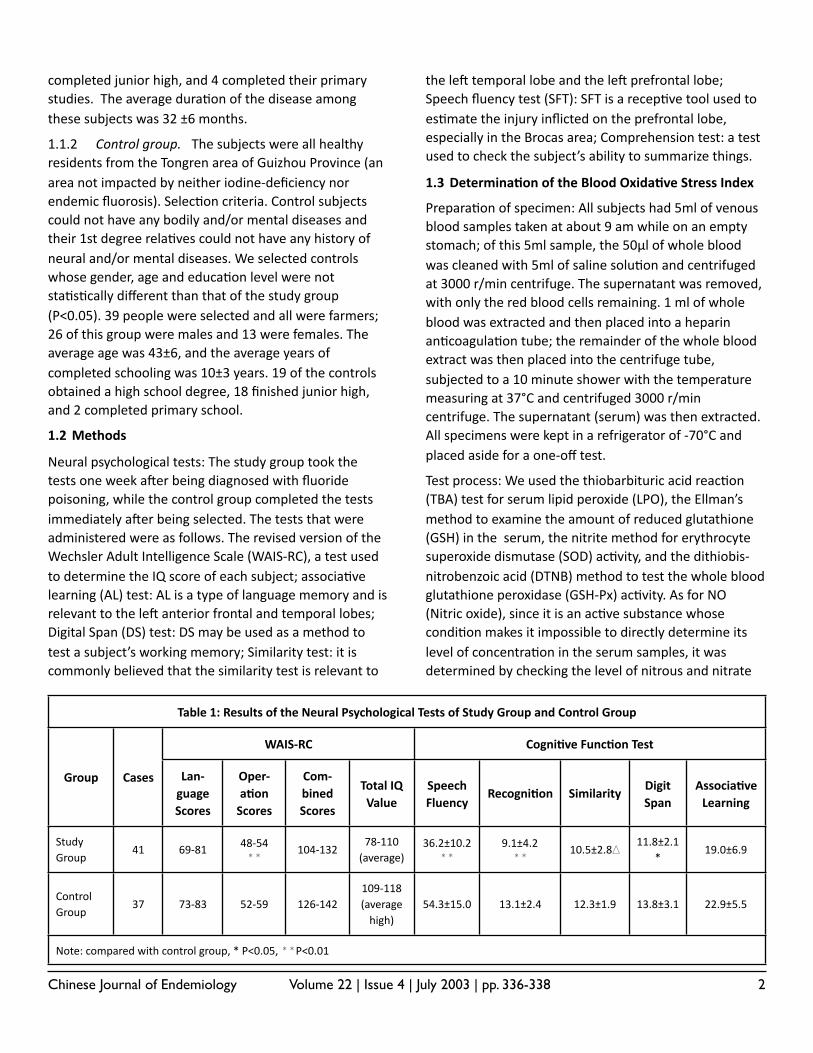
Chinese Journal of Endemiology Volume 22 | Issue 4 | July 2003 | pp. 336-338 2
completed junior high, and 4 completed their primary studies. The average dura.on of the disease among these subjects was 32 ±6 months.
1.1.2 Control group. The subjects were all healthy residents from the Tongren area of Guizhou Province (an area not impacted by neither iodine-‐deficiency nor endemic fluorosis). Selec.on criteria. Control subjects could not have any bodily and/or mental diseases and their 1st degree rela.ves could not have any history of neural and/or mental diseases. We selected controls whose gender, age and educa.on level were not sta.s.cally different than that of the study group (P<0.05). 39 people were selected and all were farmers; 26 of this group were males and 13 were females. The average age was 43±6, and the average years of completed schooling was 10±3 years. 19 of the controls obtained a high school degree, 18 finished junior high, and 2 completed primary school.
1.2 Methods
Neural psychological tests: The study group took the tests one week aher being diagnosed with fluoride poisoning, while the control group completed the tests immediately aher being selected. The tests that were administered were as follows. The revised version of the Wechsler Adult Intelligence Scale (WAIS-‐RC), a test used to determine the IQ score of each subject; associa.ve learning (AL) test: AL is a type of language memory and is relevant to the leh anterior frontal and temporal lobes; Digital Span (DS) test: DS may be used as a method to test a subject’s working memory; Similarity test: it is commonly believed that the similarity test is relevant to
the leh temporal lobe and the leh prefrontal lobe; Speech fluency test (SFT): SFT is a recep.ve tool used to es.mate the injury inflicted on the prefrontal lobe, especially in the Brocas area; Comprehension test: a test used to check the subject’s ability to summarize things.
1.3 Determina+on of the Blood Oxida+ve Stress Index
Prepara.on of specimen: All subjects had 5ml of venous blood samples taken at about 9 am while on an empty stomach; of this 5ml sample, the 50μl of whole blood was cleaned with 5ml of saline solu.on and centrifuged at 3000 r/min centrifuge. The supernatant was removed, with only the red blood cells remaining. 1 ml of whole blood was extracted and then placed into a heparin an.coagula.on tube; the remainder of the whole blood extract was then placed into the centrifuge tube, subjected to a 10 minute shower with the temperature measuring at 37°C and centrifuged 3000 r/min centrifuge. The supernatant (serum) was then extracted. All specimens were kept in a refrigerator of -‐70°C and placed aside for a one-‐off test.
Test process: We used the thiobarbituric acid reac.on (TBA) test for serum lipid peroxide (LPO), the Ellman’s method to examine the amount of reduced glutathione (GSH) in the serum, the nitrite method for erythrocyte superoxide dismutase (SOD) ac.vity, and the dithiobis-‐nitrobenzoic acid (DTNB) method to test the whole blood glutathione peroxidase (GSH-‐Px) ac.vity. As for NO (Nitric oxide), since it is an ac.ve substance whose condi.on makes it impossible to directly determine its level of concentra.on in the serum samples, it was determined by checking the level of nitrous and nitrate
Table 1: Results of the Neural Psychological Tests of Study Group and Control GroupTable 1: Results of the Neural Psychological Tests of Study Group and Control GroupTable 1: Results of the Neural Psychological Tests of Study Group and Control GroupTable 1: Results of the Neural Psychological Tests of Study Group and Control GroupTable 1: Results of the Neural Psychological Tests of Study Group and Control GroupTable 1: Results of the Neural Psychological Tests of Study Group and Control GroupTable 1: Results of the Neural Psychological Tests of Study Group and Control GroupTable 1: Results of the Neural Psychological Tests of Study Group and Control GroupTable 1: Results of the Neural Psychological Tests of Study Group and Control GroupTable 1: Results of the Neural Psychological Tests of Study Group and Control GroupTable 1: Results of the Neural Psychological Tests of Study Group and Control Group
Group Cases
WAIS-‐RCWAIS-‐RCWAIS-‐RCWAIS-‐RC Cogni+ve Func+on TestCogni+ve Func+on TestCogni+ve Func+on TestCogni+ve Func+on TestCogni+ve Func+on Test
Group Cases Lan-‐guage Scores
Oper-‐a+on Scores
Com-‐bined Scores
Total IQ Value
Speech Fluency
Recogni+on SimilarityDigit Span
Associa+ve Learning
Study Group
41 69-‐81 48-‐54** 104-‐132
78-‐110 (average)
36.2±10.2**
9.1±4.2** 10.5±2.8Δ 11.8±2.1
*19.0±6.9
Control Group
37 73-‐83 52-‐59 126-‐142109-‐118 (average high)
54.3±15.0 13.1±2.4 12.3±1.9 13.8±3.1 22.9±5.5
Note: compared with control group, * P<0.05, **P<0.01 Note: compared with control group, * P<0.05, **P<0.01 Note: compared with control group, * P<0.05, **P<0.01 Note: compared with control group, * P<0.05, **P<0.01 Note: compared with control group, * P<0.05, **P<0.01 Note: compared with control group, * P<0.05, **P<0.01 Note: compared with control group, * P<0.05, **P<0.01 Note: compared with control group, * P<0.05, **P<0.01 Note: compared with control group, * P<0.05, **P<0.01 Note: compared with control group, * P<0.05, **P<0.01 Note: compared with control group, * P<0.05, **P<0.01
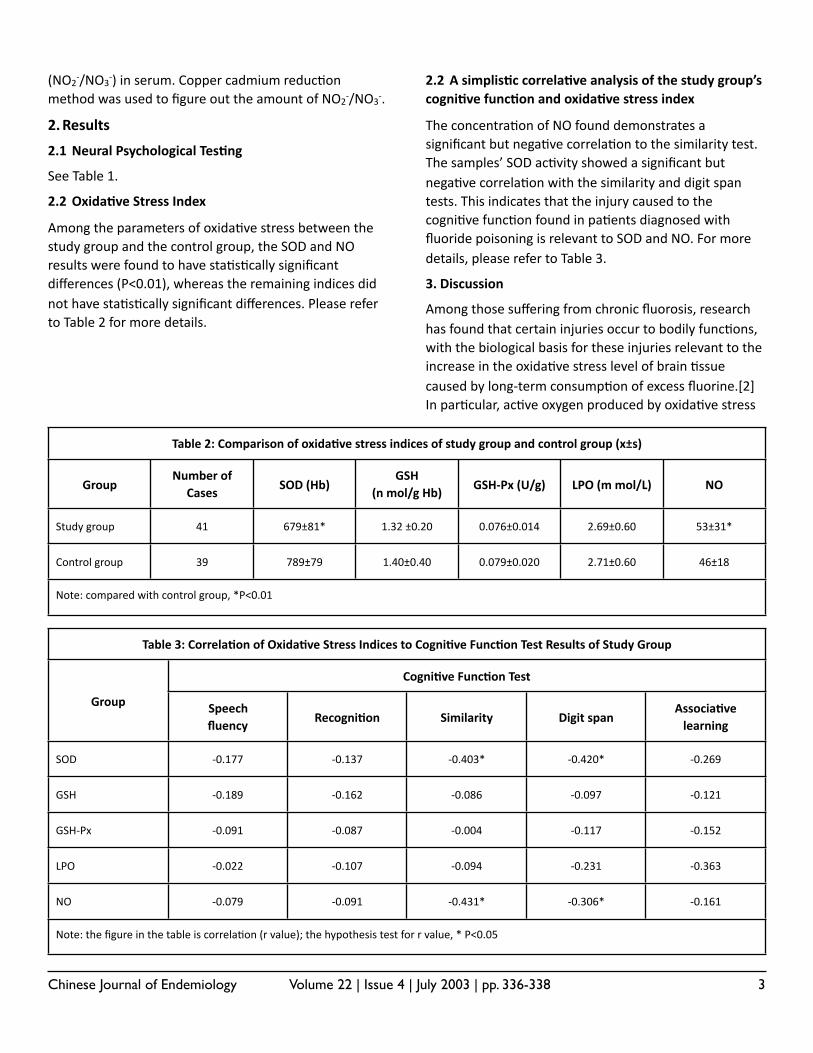
Chinese Journal of Endemiology Volume 22 | Issue 4 | July 2003 | pp. 336-338 3
(NO2-‐/NO3
-‐) in serum. Copper cadmium reduc.on method was used to figure out the amount of NO2
-‐/NO3-‐.
2.Results
2.1 Neural Psychological Tes+ng
See Table 1.
2.2 Oxida+ve Stress Index
Among the parameters of oxida.ve stress between the study group and the control group, the SOD and NO results were found to have sta.s.cally significant differences (P<0.01), whereas the remaining indices did not have sta.s.cally significant differences. Please refer to Table 2 for more details.
2.2 A simplis+c correla+ve analysis of the study group’s cogni+ve func+on and oxida+ve stress index
The concentra.on of NO found demonstrates a significant but nega.ve correla.on to the similarity test. The samples’ SOD ac.vity showed a significant but nega.ve correla.on with the similarity and digit span tests. This indicates that the injury caused to the cogni.ve func.on found in pa.ents diagnosed with fluoride poisoning is relevant to SOD and NO. For more details, please refer to Table 3.
3. Discussion
Among those suffering from chronic fluorosis, research has found that certain injuries occur to bodily func.ons, with the biological basis for these injuries relevant to the increase in the oxida.ve stress level of brain .ssue caused by long-‐term consump.on of excess fluorine.[2] In par.cular, ac.ve oxygen produced by oxida.ve stress
Table 2: Comparison of oxida+ve stress indices of study group and control group (x±s)Table 2: Comparison of oxida+ve stress indices of study group and control group (x±s)Table 2: Comparison of oxida+ve stress indices of study group and control group (x±s)Table 2: Comparison of oxida+ve stress indices of study group and control group (x±s)Table 2: Comparison of oxida+ve stress indices of study group and control group (x±s)Table 2: Comparison of oxida+ve stress indices of study group and control group (x±s)Table 2: Comparison of oxida+ve stress indices of study group and control group (x±s)
GroupNumber of
CasesSOD (Hb)
GSH (n mol/g Hb)
GSH-‐Px (U/g) LPO (m mol/L) NO
Study group 41 679±81* 1.32 ±0.20 0.076±0.014 2.69±0.60 53±31*
Control group 39 789±79 1.40±0.40 0.079±0.020 2.71±0.60 46±18
Note: compared with control group, *P<0.01 Note: compared with control group, *P<0.01 Note: compared with control group, *P<0.01 Note: compared with control group, *P<0.01 Note: compared with control group, *P<0.01 Note: compared with control group, *P<0.01 Note: compared with control group, *P<0.01
Table 3: Correla+on of Oxida+ve Stress Indices to Cogni+ve Func+on Test Results of Study GroupTable 3: Correla+on of Oxida+ve Stress Indices to Cogni+ve Func+on Test Results of Study GroupTable 3: Correla+on of Oxida+ve Stress Indices to Cogni+ve Func+on Test Results of Study GroupTable 3: Correla+on of Oxida+ve Stress Indices to Cogni+ve Func+on Test Results of Study GroupTable 3: Correla+on of Oxida+ve Stress Indices to Cogni+ve Func+on Test Results of Study GroupTable 3: Correla+on of Oxida+ve Stress Indices to Cogni+ve Func+on Test Results of Study Group
Group
Cogni+ve Func+on TestCogni+ve Func+on TestCogni+ve Func+on TestCogni+ve Func+on TestCogni+ve Func+on Test
Group Speechfluency
Recogni+on Similarity Digit spanAssocia+ve learning
SOD -‐0.177 -‐0.137 -‐0.403* -‐0.420* -‐0.269
GSH -‐0.189 -‐0.162 -‐0.086 -‐0.097 -‐0.121
GSH-‐Px -‐0.091 -‐0.087 -‐0.004 -‐0.117 -‐0.152
LPO -‐0.022 -‐0.107 -‐0.094 -‐0.231 -‐0.363
NO -‐0.079 -‐0.091 -‐0.431* -‐0.306* -‐0.161
Note: the figure in the table is correla.on (r value); the hypothesis test for r value, * P<0.05Note: the figure in the table is correla.on (r value); the hypothesis test for r value, * P<0.05Note: the figure in the table is correla.on (r value); the hypothesis test for r value, * P<0.05Note: the figure in the table is correla.on (r value); the hypothesis test for r value, * P<0.05Note: the figure in the table is correla.on (r value); the hypothesis test for r value, * P<0.05Note: the figure in the table is correla.on (r value); the hypothesis test for r value, * P<0.05
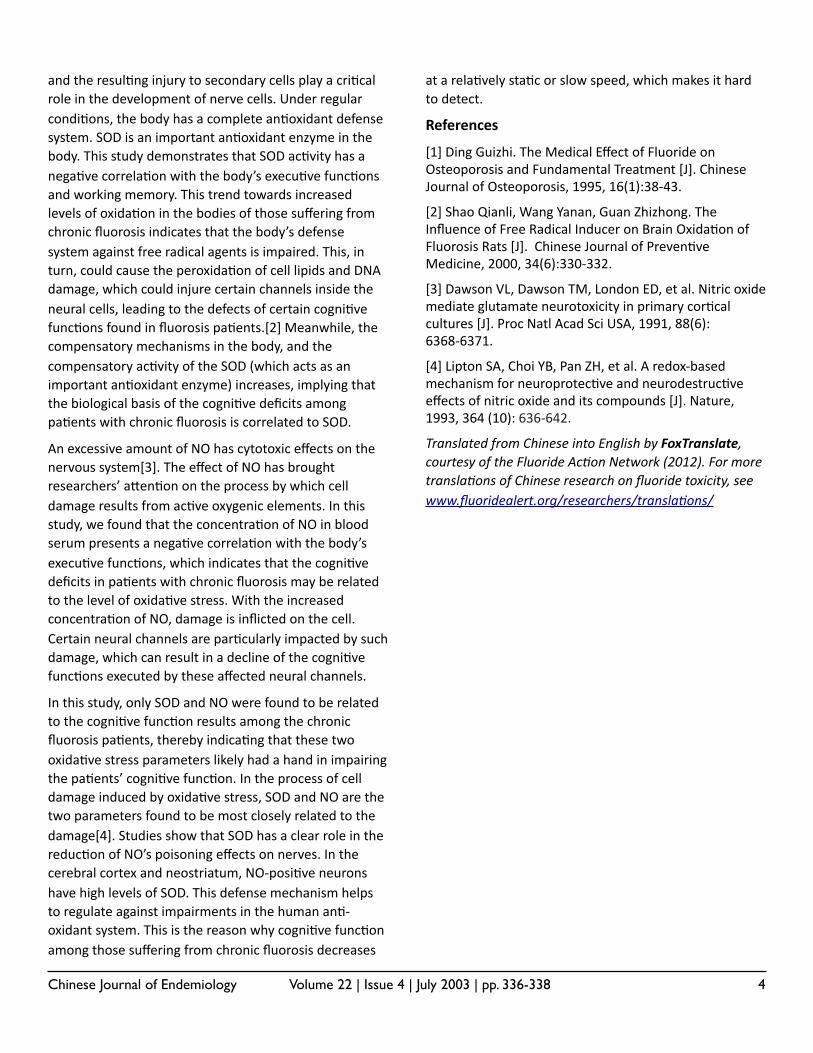
Chinese Journal of Endemiology Volume 22 | Issue 4 | July 2003 | pp. 336-338 4
and the resul.ng injury to secondary cells play a cri.cal role in the development of nerve cells. Under regular condi.ons, the body has a complete an.oxidant defense system. SOD is an important an.oxidant enzyme in the body. This study demonstrates that SOD ac.vity has a nega.ve correla.on with the body’s execu.ve func.ons and working memory. This trend towards increased levels of oxida.on in the bodies of those suffering from chronic fluorosis indicates that the body’s defense system against free radical agents is impaired. This, in turn, could cause the peroxida.on of cell lipids and DNA damage, which could injure certain channels inside the neural cells, leading to the defects of certain cogni.ve func.ons found in fluorosis pa.ents.[2] Meanwhile, the compensatory mechanisms in the body, and the compensatory ac.vity of the SOD (which acts as an important an.oxidant enzyme) increases, implying that the biological basis of the cogni.ve deficits among pa.ents with chronic fluorosis is correlated to SOD.
An excessive amount of NO has cytotoxic effects on the nervous system[3]. The effect of NO has brought researchers’ aoen.on on the process by which cell damage results from ac.ve oxygenic elements. In this study, we found that the concentra.on of NO in blood serum presents a nega.ve correla.on with the body’s execu.ve func.ons, which indicates that the cogni.ve deficits in pa.ents with chronic fluorosis may be related to the level of oxida.ve stress. With the increased concentra.on of NO, damage is inflicted on the cell. Certain neural channels are par.cularly impacted by such damage, which can result in a decline of the cogni.ve func.ons executed by these affected neural channels.
In this study, only SOD and NO were found to be related to the cogni.ve func.on results among the chronic fluorosis pa.ents, thereby indica.ng that these two oxida.ve stress parameters likely had a hand in impairing the pa.ents’ cogni.ve func.on. In the process of cell damage induced by oxida.ve stress, SOD and NO are the two parameters found to be most closely related to the damage[4]. Studies show that SOD has a clear role in the reduc.on of NO’s poisoning effects on nerves. In the cerebral cortex and neostriatum, NO-‐posi.ve neurons have high levels of SOD. This defense mechanism helps to regulate against impairments in the human an.-‐oxidant system. This is the reason why cogni.ve func.on among those suffering from chronic fluorosis decreases
at a rela.vely sta.c or slow speed, which makes it hard to detect.
References
[1] Ding Guizhi. The Medical Effect of Fluoride on Osteoporosis and Fundamental Treatment [J]. Chinese Journal of Osteoporosis, 1995, 16(1):38-‐43.
[2] Shao Qianli, Wang Yanan, Guan Zhizhong. The Influence of Free Radical Inducer on Brain Oxida.on of Fluorosis Rats [J]. Chinese Journal of Preven.ve Medicine, 2000, 34(6):330-‐332.
[3] Dawson VL, Dawson TM, London ED, et al. Nitric oxide mediate glutamate neurotoxicity in primary cor.cal cultures [J]. Proc Natl Acad Sci USA, 1991, 88(6):6368-‐6371.
[4] Lipton SA, Choi YB, Pan ZH, et al. A redox-‐based mechanism for neuroprotec.ve and neurodestruc.ve effects of nitric oxide and its compounds [J]. Nature, 1993, 364 (10): 636-‐642.
Translated from Chinese into English by FoxTranslate, courtesy of the Fluoride Ac/on Network (2012). For more transla/ons of Chinese research on fluoride toxicity, see www.fluoridealert.org/researchers/transla/ons/
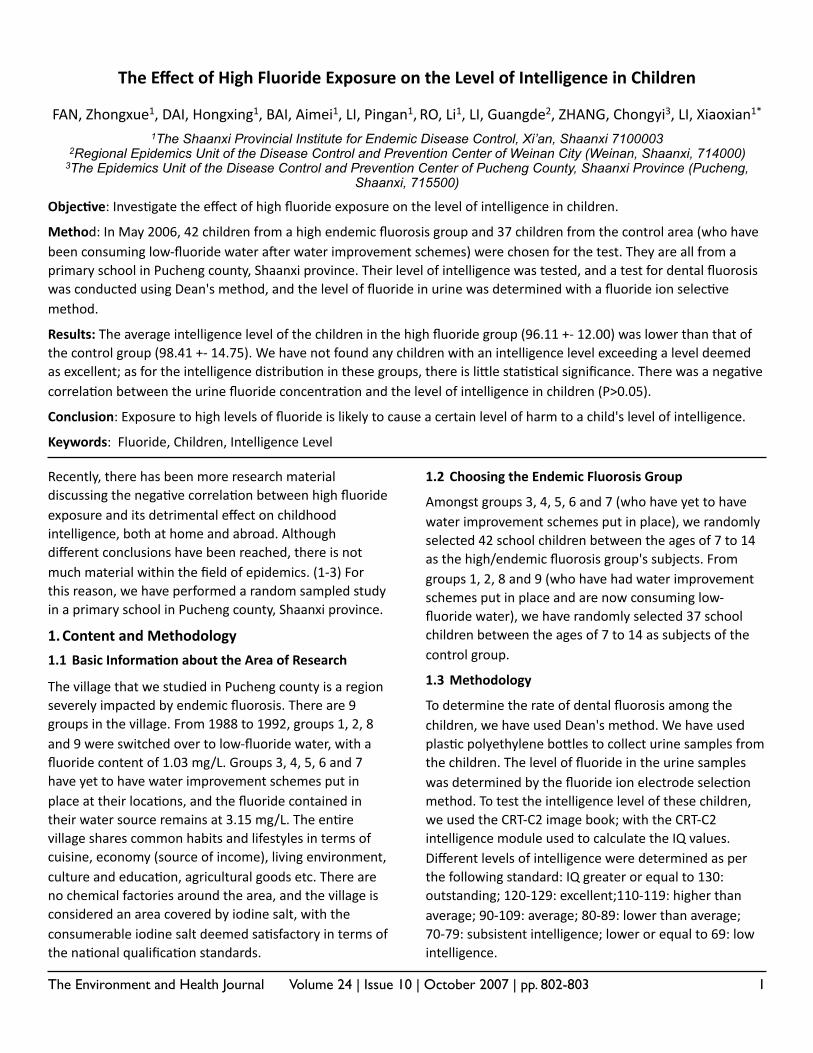
The Environment and Health Journal Volume 24 | Issue 10 | October 2007 | pp. 802-803 1
The Effect of High Fluoride Exposure on the Level of Intelligence in Children
FAN, Zhongxue1, DAI, Hongxing1, BAI, Aimei1, LI, Pingan1, RO, Li1, LI, Guangde2, ZHANG, Chongyi3, LI, Xiaoxian1*
1The Shaanxi Provincial Institute for Endemic Disease Control, Xi’an, Shaanxi 71000032Regional Epidemics Unit of the Disease Control and Prevention Center of Weinan City (Weinan, Shaanxi, 714000)
3The Epidemics Unit of the Disease Control and Prevention Center of Pucheng County, Shaanxi Province (Pucheng, Shaanxi, 715500)
Objec&ve: Inves,gate the effect of high fluoride exposure on the level of intelligence in children.
Method: In May 2006, 42 children from a high endemic fluorosis group and 37 children from the control area (who have been consuming low-‐fluoride water aJer water improvement schemes) were chosen for the test. They are all from a primary school in Pucheng county, Shaanxi province. Their level of intelligence was tested, and a test for dental fluorosis was conducted using Dean's method, and the level of fluoride in urine was determined with a fluoride ion selec,ve method.
Results: The average intelligence level of the children in the high fluoride group (96.11 +-‐ 12.00) was lower than that of the control group (98.41 +-‐ 14.75). We have not found any children with an intelligence level exceeding a level deemed as excellent; as for the intelligence distribu,on in these groups, there is liWle sta,s,cal significance. There was a nega,ve correla,on between the urine fluoride concentra,on and the level of intelligence in children (P>0.05).
Conclusion: Exposure to high levels of fluoride is likely to cause a certain level of harm to a child's level of intelligence.
Keywords: Fluoride, Children, Intelligence Level
Recently, there has been more research material discussing the nega,ve correla,on between high fluoride exposure and its detrimental effect on childhood intelligence, both at home and abroad. Although different conclusions have been reached, there is not much material within the field of epidemics. (1-‐3) For this reason, we have performed a random sampled study in a primary school in Pucheng county, Shaanxi province.
1.Content and Methodology
1.1 Basic Informa&on about the Area of Research
The village that we studied in Pucheng county is a region severely impacted by endemic fluorosis. There are 9 groups in the village. From 1988 to 1992, groups 1, 2, 8 and 9 were switched over to low-‐fluoride water, with a fluoride content of 1.03 mg/L. Groups 3, 4, 5, 6 and 7 have yet to have water improvement schemes put in place at their loca,ons, and the fluoride contained in their water source remains at 3.15 mg/L. The en,re village shares common habits and lifestyles in terms of cuisine, economy (source of income), living environment, culture and educa,on, agricultural goods etc. There are no chemical factories around the area, and the village is considered an area covered by iodine salt, with the consumerable iodine salt deemed sa,sfactory in terms of the na,onal qualifica,on standards.
1.2 Choosing the Endemic Fluorosis Group
Amongst groups 3, 4, 5, 6 and 7 (who have yet to have water improvement schemes put in place), we randomly selected 42 school children between the ages of 7 to 14 as the high/endemic fluorosis group's subjects. From groups 1, 2, 8 and 9 (who have had water improvement schemes put in place and are now consuming low-‐fluoride water), we have randomly selected 37 school children between the ages of 7 to 14 as subjects of the control group.
1.3 Methodology
To determine the rate of dental fluorosis among the children, we have used Dean's method. We have used plas,c polyethylene boWles to collect urine samples from the children. The level of fluoride in the urine samples was determined by the fluoride ion electrode selec,on method. To test the intelligence level of these children, we used the CRT-‐C2 image book; with the CRT-‐C2 intelligence module used to calculate the IQ values. Different levels of intelligence were determined as per the following standard: IQ greater or equal to 130: outstanding; 120-‐129: excellent;110-‐119: higher than average; 90-‐109: average; 80-‐89: lower than average; 70-‐79: subsistent intelligence; lower or equal to 69: low intelligence.
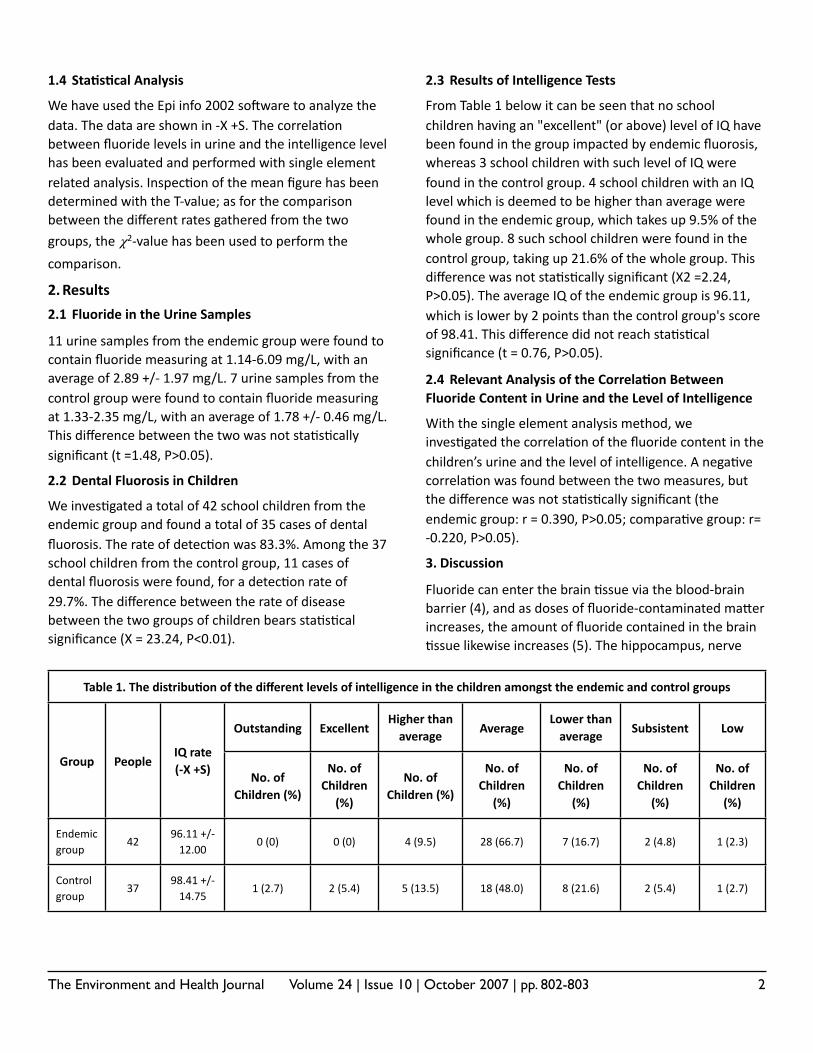
The Environment and Health Journal Volume 24 | Issue 10 | October 2007 | pp. 802-803 2
1.4 Sta&s&cal Analysis
We have used the Epi info 2002 soJware to analyze the data. The data are shown in -‐X +S. The correla,on between fluoride levels in urine and the intelligence level has been evaluated and performed with single element related analysis. Inspec,on of the mean figure has been determined with the T-‐value; as for the comparison between the different rates gathered from the two
groups, the 𝜒2-‐value has been used to perform the
comparison.
2.Results
2.1 Fluoride in the Urine Samples
11 urine samples from the endemic group were found to contain fluoride measuring at 1.14-‐6.09 mg/L, with an average of 2.89 +/-‐ 1.97 mg/L. 7 urine samples from the control group were found to contain fluoride measuring at 1.33-‐2.35 mg/L, with an average of 1.78 +/-‐ 0.46 mg/L. This difference between the two was not sta,s,cally significant (t =1.48, P>0.05).
2.2 Dental Fluorosis in Children
We inves,gated a total of 42 school children from the endemic group and found a total of 35 cases of dental fluorosis. The rate of detec,on was 83.3%. Among the 37 school children from the control group, 11 cases of dental fluorosis were found, for a detec,on rate of 29.7%. The difference between the rate of disease between the two groups of children bears sta,s,cal significance (X = 23.24, P<0.01).
2.3 Results of Intelligence Tests
From Table 1 below it can be seen that no school children having an "excellent" (or above) level of IQ have been found in the group impacted by endemic fluorosis, whereas 3 school children with such level of IQ were found in the control group. 4 school children with an IQ level which is deemed to be higher than average were found in the endemic group, which takes up 9.5% of the whole group. 8 such school children were found in the control group, taking up 21.6% of the whole group. This difference was not sta,s,cally significant (X2 =2.24, P>0.05). The average IQ of the endemic group is 96.11, which is lower by 2 points than the control group's score of 98.41. This difference did not reach sta,s,cal significance (t = 0.76, P>0.05).
2.4 Relevant Analysis of the Correla&on Between Fluoride Content in Urine and the Level of Intelligence
With the single element analysis method, we inves,gated the correla,on of the fluoride content in the children’s urine and the level of intelligence. A nega,ve correla,on was found between the two measures, but the difference was not sta,s,cally significant (the endemic group: r = 0.390, P>0.05; compara,ve group: r= -‐0.220, P>0.05).
3. Discussion
Fluoride can enter the brain ,ssue via the blood-‐brain barrier (4), and as doses of fluoride-‐contaminated maWer increases, the amount of fluoride contained in the brain ,ssue likewise increases (5). The hippocampus, nerve
Table 1. The distribu&on of the different levels of intelligence in the children amongst the endemic and control groupsTable 1. The distribu&on of the different levels of intelligence in the children amongst the endemic and control groupsTable 1. The distribu&on of the different levels of intelligence in the children amongst the endemic and control groupsTable 1. The distribu&on of the different levels of intelligence in the children amongst the endemic and control groupsTable 1. The distribu&on of the different levels of intelligence in the children amongst the endemic and control groupsTable 1. The distribu&on of the different levels of intelligence in the children amongst the endemic and control groupsTable 1. The distribu&on of the different levels of intelligence in the children amongst the endemic and control groupsTable 1. The distribu&on of the different levels of intelligence in the children amongst the endemic and control groupsTable 1. The distribu&on of the different levels of intelligence in the children amongst the endemic and control groupsTable 1. The distribu&on of the different levels of intelligence in the children amongst the endemic and control groups
Group PeopleIQ rate(-‐X +S)
Outstanding ExcellentHigher than average
AverageLower than average
Subsistent Low
Group PeopleIQ rate(-‐X +S)
No. of Children (%)
No. of Children
(%)
No. of Children (%)
No. of Children
(%)
No. of Children
(%)
No. of Children
(%)
No. of Children
(%)
Endemic group
4296.11 +/-‐ 12.00
0 (0) 0 (0) 4 (9.5) 28 (66.7) 7 (16.7) 2 (4.8) 1 (2.3)
Control group
3798.41 +/-‐ 14.75
1 (2.7) 2 (5.4) 5 (13.5) 18 (48.0) 8 (21.6) 2 (5.4) 1 (2.7)
The Environment and Health Journal Volume 24 | Issue 10 | October 2007 | pp. 802-803 3
fibers, nerve synapses and blood-‐brain barrier of a lab rat that has consumed high-‐fluoride water over a long period of ,me are all seen to be harmed by such consump,on (6). This research in par,cular has shown that no children with a level of IQ deemed as "excellent" or above have been found in the group consuming water containing fluoride at 3.50 mg/L over an extended period of ,me. Addi,onally, the average IQ level of the endemic group was found to measure 2 points lower than that of the control group. This difference bears no sta,s,cal significance (P>0.05), which is in accordance with the conclusion of the research team led by Yuanshen Hu, who performed similar research in a village whose drinking water contained fluoride measuring at 7.00 mg/L (3). These are all indica,ve of the importance and necessity of rolling out the water improvement schemes in these affected areas. There is a significant need to carry out improvement schemes to lower the level of fluoride in drinking water. Doing so may subsequently protect and allow children in these areas to have a normal development of intelligence.
As the level of fluoride in this area is far too high, subjects consumed fluoride from a variety of sources. Other than water, subjects were exposed to fluoride in food items, vegetables and other items in the food chain. This could be a factor contribu,ng to the sta,s,cally nonsignificant difference between the average fluoride level in the urine samples and the IQ levels of the subjects from the control and endemic areas. We therefore recommend that more extensive research be done on the degree of exposure and source of fluoride intake in the affected endemic regions. As well, we recommend lowering the health standard for fluoride in drinking water in endemic regions where the overall intake of fluoride has exceeded the na,onal health standard. We believe that it is realis,c and important as a measure for endemic regions to proceed with a par,cular, regional fluoride standard in drinking water; as well, the method of food reloca,on (having food items produced in the south to be brought up north) would be affec,ve in lowering the overall amount of fluoride consump,on. As for the correla,on between the level of fluoride in urine and the level of intelligence in children, the results are shown to be nega,ve. It has been observed that as the level of fluoride content in urine increases, the level of intelligence in a child decreases.
Therefore, focusing and expanding efforts to reduce the level of fluoride in drinking water has a far-‐reaching impact on the quality of our country's ci,zens.
The present research has also shown that while fluoride consump,on has a certain level of impact on the level of intelligence in children, the difference is not sta,s,cally apparent. Whether this is because of the rela,vely low number of samples collected, the overall level of fluoride consump,on, or whether dental fluorosis is (or is not) under control (30%) remains to be determined. As the amount of fluoride in drinking water increases and con,nues to be consumed over an extended period of ,me, the nega,ve impact -‐ and the scope of said impact -‐ on the development of intelligence in children is very much worthy of further research and inves,ga,on.
References
[1] Editorial: Fluoride and Intelligence, Fluoride, 2000, 33: 49-‐52.
[2] Chunguan Yang, Feng Ye. The impact of high levels of fluoride on the central nervous system. The Chinese Journal of Regional Epidemics, 2006, 25 (3): 352-‐ 353.
[3] Yuanshen Hu, Zhuxin Yu, Riqing Ding. The inspec9on and research on the level of intelligence in school children aged 6-‐14 in regions with endemic fluorosis. Shaanxi Regional Bulle,n of Epidemics, 1989, 2: 7-‐9.
[4] Aijun Zhang, Dai Zhu. Items with fluorosis and its nega9ve impact on the fetus. The Chinese Regional Journal of Disease Control, 1998, 13 (3): 156-‐158.
[5] PJ Mullenix, Denbesten PK, A Schunior et al. Neurotoxicity of sodium fluoride in rats. Neurotoxical Teratol, 1995: 15: 169-‐177.
[6] Zhengrong Sun, Fengjing Liu, Lila Wu et al. The impact of high-‐fluoride drinking water on the brain func9ons of lab rats. The Chinese Journal of Regional Epidemics, 2000, 19 (4): 262-‐ 263.
Dra[ submi\ed: April 19, 2007. Edited on: May 17, 2007.Editor of this ar&cle: Yuxin DuTranslated from Chinese into English by FoxTranslate, courtesy of the Fluoride Ac9on Network (2012). For more transla9ons of Chinese research on fluoride toxicity, see www.fluoridealert.org/researchers/transla9ons/
Journal of Environment and Health Volume 26 | Issue 4 | 2009 | pp. 838-840 1
The Impact of Endemic Fluorosis Caused by the Burning of Coal on the Development of Intelligence in Children
LI, Fenghua1, CHEN, Xin1, HUANG, Renjian1, XIE, Yuanfu2
1The School of Public Health, University of South China (Hengyang, Hunan, 241001)2The Centre for Prevention and Control of Diseases of Xinhua County, Hunan Province (Xinhua, Hunan, 417600)
Corresponding author: Xin Chen, email: [email protected]
Objec&ve: To explore the effect of endemic fluorosis caused by coal burning on the level of intelligence in children.
The Method: We randomly selected 20 school children from 4 areas between the ages of 8-‐12, whose characterisEcs fit the scope of our research. They were chosen from slight, moderate, and severe endemic fluorosis areas that were affected by regional fluoride poisoning brought on by the burning of coal, and a controlled, non-‐endemic area. We have used the used the CRT-‐RC to perform a test of the children’s intelligence levels, and we have examined the condiEon of their dental fluorosis. Urine samples were collected in the morning, and the fluoride content in the samples was measured by the fluoride ion selecEve electrode method.
The Results: We have found that those more severely impacted by dental fluorosis had a higher level of fluoride in their urine samples (P<0.01). A significant difference in the children’s levels of IQ could be observed amongst the different disease areas. The children’s level of IQ tended to decrease as the severity of dental fluorosis increased. There was a negaEve correlaEon between the children’s IQ level and urinary fluoride content (P<0.01). Significant differences could be seen in the abiliEes of comparaEve inference, serial relaEonship, and abstract inference between the different groups tested (P<0.05). In terms of cogniEon and analogical comparison abiliEes, the difference was not significant among the children from the different disease groups (P>0.05).
Conclusion: High exposure to fluoride most definitely has an adverse effect on the development of intelligence in children, in parEcular on the capability of abstract inference.
Keywords: Fluoride; Fluorosis; Children; Intelligence quoEent; Coal-‐burning polluEon
Fluoride poisoning is one of the major endemic diseases severely impacEng the health of the human body. It is reported that more than 50 countries in the world have inhabitants suffering from chronic endemic fluorosis. Recent research on the fluorosis issue and its impact on the nervous system and, in parEcular, the development of intelligence and memory has prompted scienEsts and researchers from all over the world to place more focus on the disease and its impact on the human body. The journal Fluoride has also published an editorial, aptly named "Fluoride and level of intelligence", in its second issue published in 2000. In the arEcle the author discussed the relaEonship between the intake of fluoride and the level of intelligence in children, and further emphasized the need for greater research on the negaEve impact of fluoride on intelligence level, as well as the need for more research on the effect of fluoride on the central nervous system (1). Presently, a lot of researchers from abroad and within China have performed relevant research on animal subjects and
endemic fluorosis regions. However, li]le research has been conducted to assess the effect of demographics and the degree of pathological change in the fluorosis areas. The present report has therefore focused on the impact of fluoride poisoning, caused by coal burning, on children. ParEcular focus has been placed on the effect of fluoride poisoning on the level of intelligence in these young subjects, and if it varies based on the severity of the dental fluorosis encountered. A set of data has been provided as per this research to assist in the effecEve planning of prevenEve measures against the disease, so to ensure that children living in areas affected by fluoride poisoning can grow up in good health.
1.Content and Methodology
1.1 Subjects Researched
As per the natural environment, local economy, custom, lifestyle and eaEng habits of the region researched, we have selected one township as a point of research in the areas with slight, medium and severe fluorosis, and a
Journal of Environment and Health Volume 26 | Issue 4 | 2009 | pp. 838-840 2
fluorosis-‐free area respecEvely, within Xinhua County, Hunan province, in November 2006. A group of children aged 8-‐12 years old from the grade 5 class of every central primary school from the four areas have been inspected. These are children who were born and raised in the area. We have excluded subjects who have been diagnosed with physical deformaEon, overall developmental disorders, delayed mental development, emoEonal/behavioral obstacles or challenges, or other forms of mental disorders. 20 children were then randomly selected from this group for the research, and thus a total number of 80 school children from the 4 points of research were examined. Regions and their level of endemic fluorosis were considered and confirmed based on "The standard of disEnguishing regions with endemic fluorosis caused by coal burning", GB 17018-‐1997, as administered by the Ministry of Health of the People's Republic of China.
1.2 Inspec&on for Dental Fluorosis
For the inspecEon and examinaEon of dental fluorosis in the subjects, we have used Dean's Method as recommended by the World Health OrganizaEon.
1.3 Intelligence Test for children
All subjects were asked to partake in a group tesEng as per the CRT-‐RC (Combined Raven's Test -‐ For Rural regions in China method). TesEng Eme was limited to 40 minutes. The test consists of 72 images, which are then divided into groups A, AB, B, C, D, E in accordance to their level of difficulty. Groups A and AB are primarily used to test the ability of cogniEve discernment, image comparison, and imaginaEon, whereas Group B primarily tests the ability of analogical comparison and image grouping. Group C primarily tests inference and image grouping. Group D primarily reflects serial relaEonship and the abiliEes of image registraEon and analogy. Group E tests abstract abiliEes such as exchanging and interchanging objects, etc. All children subjects were tested by the same administraEve staff, and assisted by 3 other staff members. All instrucEonal terms and condiEons of tesEng strictly followed the requirements of the tesEng module. Amer the test was finished, the scores were calculated as per the standard answer cards. The actual level of intelligence (IQ) of the subject was
then calculated as per the CRT-‐RC2 chart. The CRT-‐RC evaluates different levels of intelligence as per the following standard: IQ greater or equal to 130: outstanding; 120-‐129: excellent; 110-‐119: higher than average; 90-‐109: average; 80-‐89: lower than average; 70-‐79: subsistent intelligence; lower or equal to 69: low intelligence.
1.4 Inspec&on of Fluoride in Urine
We have used dry polyethylene bo]les pre-‐treated by deionized water to collect urine samples in the morning. Once the sample was collected, we refrigerated it and took it back to our research site for further examinaEon. The fluoride level in the urine samples was determined through the ion selecEve electrode method.
1.5 Sta&s&cal Analysis
We have used the SPSS 11.5 StaEsEcs somware to analyze the data, and have confirmed that the difference of P<0.05 has staEsEcal significance in the analysis of data in this project.
2.Results of InvesBgaBon
2.1 Balance test
The results of the Χ2 tests have shown that there is no staEsEcal significance related to the difference in the distribuEon of gender found between subjects across the different groups (who have been selected from different endemic regions and were ailing at different levels of severity). (x2 = 0.201, P>0.05; x2 =1.870, P>0.05). The results gathered from the single-‐element tesEng have shown that, likewise, there is no staEsEcal significance related to the difference in the age found between subjects across the different groups who have been selected from different endemic regions and were ailing at different levels of severity. (F=0.202, P>0.05; F=0.461, P>0.05). This is representaEve of the fact that there is an equal representaEon of subjects from different age groups and gender class present in various endemic regions and were experiencing the symptoms of fluorosis at various levels of severity.
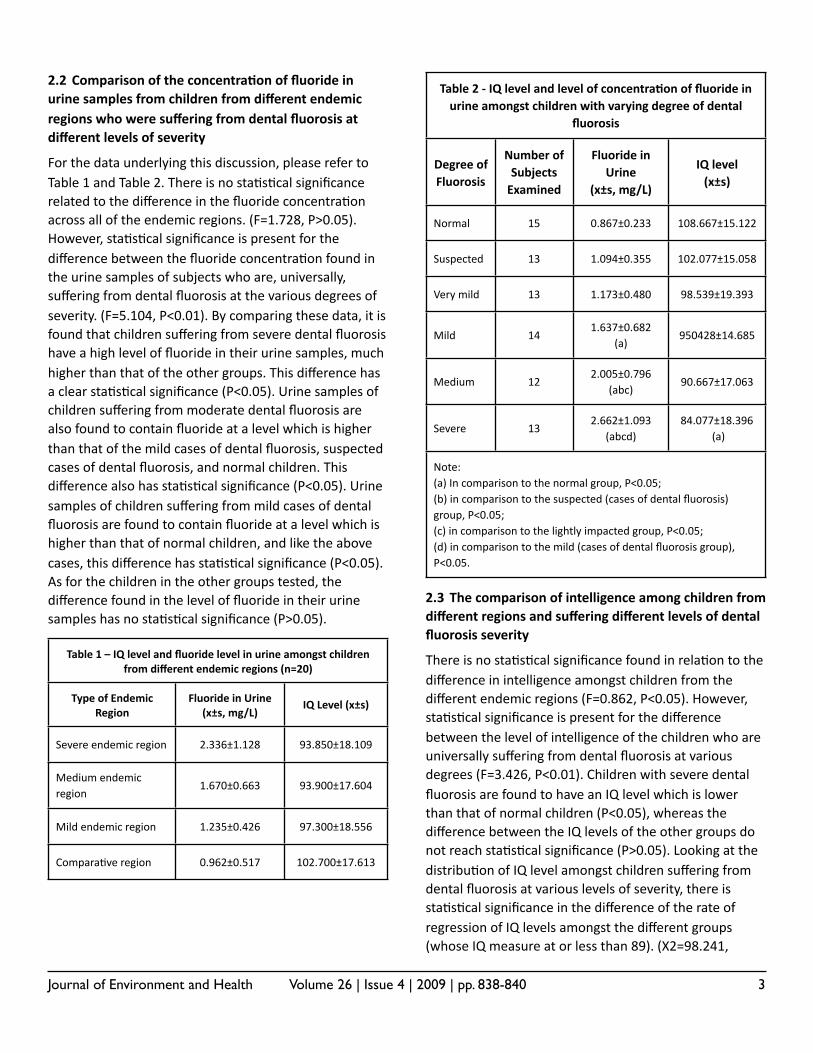
Journal of Environment and Health Volume 26 | Issue 4 | 2009 | pp. 838-840 3
2.2 Comparison of the concentra&on of fluoride in urine samples from children from different endemic regions who were suffering from dental fluorosis at different levels of severity
For the data underlying this discussion, please refer to Table 1 and Table 2. There is no staEsEcal significance related to the difference in the fluoride concentraEon across all of the endemic regions. (F=1.728, P>0.05). However, staEsEcal significance is present for the difference between the fluoride concentraEon found in the urine samples of subjects who are, universally, suffering from dental fluorosis at the various degrees of severity. (F=5.104, P<0.01). By comparing these data, it is found that children suffering from severe dental fluorosis have a high level of fluoride in their urine samples, much higher than that of the other groups. This difference has a clear staEsEcal significance (P<0.05). Urine samples of children suffering from moderate dental fluorosis are also found to contain fluoride at a level which is higher than that of the mild cases of dental fluorosis, suspected cases of dental fluorosis, and normal children. This difference also has staEsEcal significance (P<0.05). Urine samples of children suffering from mild cases of dental fluorosis are found to contain fluoride at a level which is higher than that of normal children, and like the above cases, this difference has staEsEcal significance (P<0.05). As for the children in the other groups tested, the difference found in the level of fluoride in their urine samples has no staEsEcal significance (P>0.05).
Table 1 – IQ level and fluoride level in urine amongst children from different endemic regions (n=20)
Table 1 – IQ level and fluoride level in urine amongst children from different endemic regions (n=20)
Table 1 – IQ level and fluoride level in urine amongst children from different endemic regions (n=20)
Type of Endemic Region
Fluoride in Urine (x±s, mg/L)
IQ Level (x±s)
Severe endemic region 2.336±1.128 93.850±18.109
Medium endemic region
1.670±0.663 93.900±17.604
Mild endemic region 1.235±0.426 97.300±18.556
ComparaEve region 0.962±0.517 102.700±17.613
Table 2 -‐ IQ level and level of concentra&on of fluoride in urine amongst children with varying degree of dental
fluorosis
Table 2 -‐ IQ level and level of concentra&on of fluoride in urine amongst children with varying degree of dental
fluorosis
Table 2 -‐ IQ level and level of concentra&on of fluoride in urine amongst children with varying degree of dental
fluorosis
Table 2 -‐ IQ level and level of concentra&on of fluoride in urine amongst children with varying degree of dental
fluorosis
Degree of Fluorosis
Number of Subjects Examined
Fluoride in Urine
(x±s, mg/L)
IQ level (x±s)
Normal 15 0.867±0.233 108.667±15.122
Suspected 13 1.094±0.355 102.077±15.058
Very mild 13 1.173±0.480 98.539±19.393
Mild 141.637±0.682
(a)950428±14.685
Medium 122.005±0.796
(abc)90.667±17.063
Severe 132.662±1.093
(abcd)84.077±18.396
(a)
Note: (a) In comparison to the normal group, P<0.05; (b) in comparison to the suspected (cases of dental fluorosis) group, P<0.05; (c) in comparison to the lightly impacted group, P<0.05; (d) in comparison to the mild (cases of dental fluorosis group), P<0.05.
Note: (a) In comparison to the normal group, P<0.05; (b) in comparison to the suspected (cases of dental fluorosis) group, P<0.05; (c) in comparison to the lightly impacted group, P<0.05; (d) in comparison to the mild (cases of dental fluorosis group), P<0.05.
Note: (a) In comparison to the normal group, P<0.05; (b) in comparison to the suspected (cases of dental fluorosis) group, P<0.05; (c) in comparison to the lightly impacted group, P<0.05; (d) in comparison to the mild (cases of dental fluorosis group), P<0.05.
Note: (a) In comparison to the normal group, P<0.05; (b) in comparison to the suspected (cases of dental fluorosis) group, P<0.05; (c) in comparison to the lightly impacted group, P<0.05; (d) in comparison to the mild (cases of dental fluorosis group), P<0.05.
2.3 The comparison of intelligence among children from different regions and suffering different levels of dental fluorosis severity
There is no staEsEcal significance found in relaEon to the difference in intelligence amongst children from the different endemic regions (F=0.862, P<0.05). However, staEsEcal significance is present for the difference between the level of intelligence of the children who are universally suffering from dental fluorosis at various degrees (F=3.426, P<0.01). Children with severe dental fluorosis are found to have an IQ level which is lower than that of normal children (P<0.05), whereas the difference between the IQ levels of the other groups do not reach staEsEcal significance (P>0.05). Looking at the distribuEon of IQ level amongst children suffering from dental fluorosis at various levels of severity, there is staEsEcal significance in the difference of the rate of regression of IQ levels amongst the different groups (whose IQ measure at or less than 89). (X2=98.241,
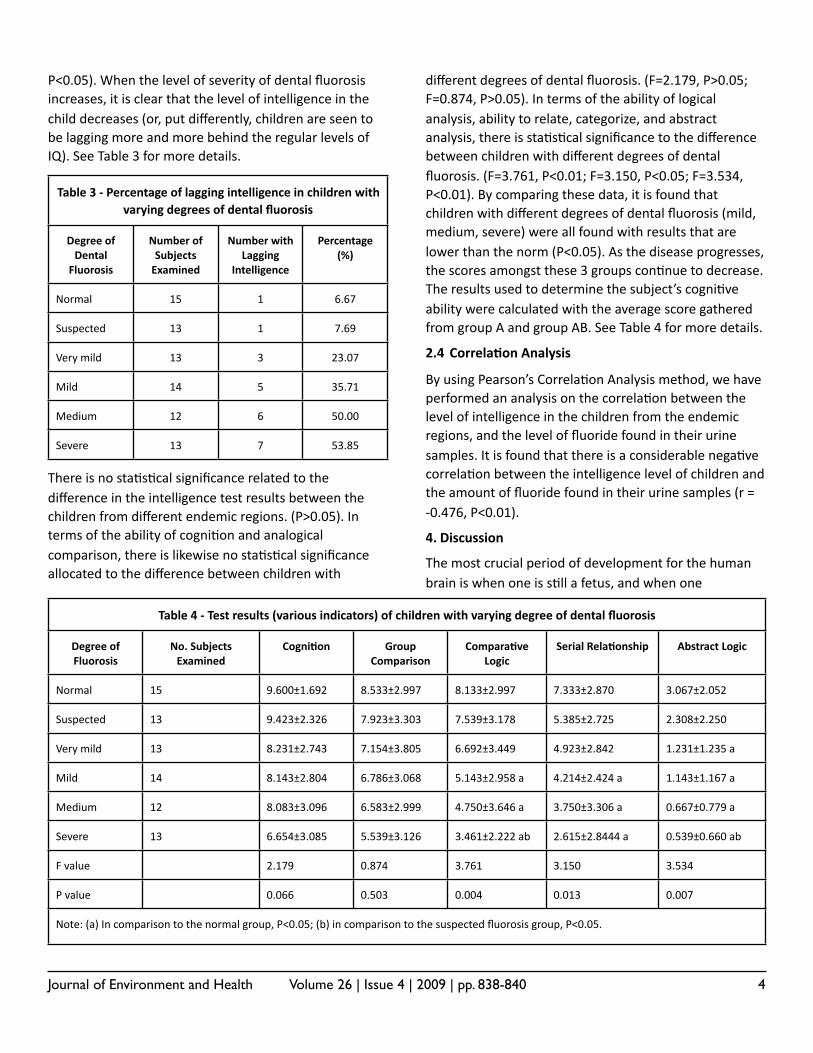
Journal of Environment and Health Volume 26 | Issue 4 | 2009 | pp. 838-840 4
P<0.05). When the level of severity of dental fluorosis increases, it is clear that the level of intelligence in the child decreases (or, put differently, children are seen to be lagging more and more behind the regular levels of IQ). See Table 3 for more details.
Table 3 -‐ Percentage of lagging intelligence in children with varying degrees of dental fluorosis
Table 3 -‐ Percentage of lagging intelligence in children with varying degrees of dental fluorosis
Table 3 -‐ Percentage of lagging intelligence in children with varying degrees of dental fluorosis
Table 3 -‐ Percentage of lagging intelligence in children with varying degrees of dental fluorosis
Degree of Dental Fluorosis
Number of Subjects Examined
Number with Lagging
Intelligence
Percentage (%)
Normal 15 1 6.67
Suspected 13 1 7.69
Very mild 13 3 23.07
Mild 14 5 35.71
Medium 12 6 50.00
Severe 13 7 53.85
There is no staEsEcal significance related to the difference in the intelligence test results between the children from different endemic regions. (P>0.05). In terms of the ability of cogniEon and analogical comparison, there is likewise no staEsEcal significance allocated to the difference between children with
different degrees of dental fluorosis. (F=2.179, P>0.05; F=0.874, P>0.05). In terms of the ability of logical analysis, ability to relate, categorize, and abstract analysis, there is staEsEcal significance to the difference between children with different degrees of dental fluorosis. (F=3.761, P<0.01; F=3.150, P<0.05; F=3.534, P<0.01). By comparing these data, it is found that children with different degrees of dental fluorosis (mild, medium, severe) were all found with results that are lower than the norm (P<0.05). As the disease progresses, the scores amongst these 3 groups conEnue to decrease. The results used to determine the subject’s cogniEve ability were calculated with the average score gathered from group A and group AB. See Table 4 for more details.
2.4 Correla&on Analysis
By using Pearson’s CorrelaEon Analysis method, we have performed an analysis on the correlaEon between the level of intelligence in the children from the endemic regions, and the level of fluoride found in their urine samples. It is found that there is a considerable negaEve correlaEon between the intelligence level of children and the amount of fluoride found in their urine samples (r = -‐0.476, P<0.01).
4. Discussion
The most crucial period of development for the human brain is when one is sEll a fetus, and when one
Table 4 -‐ Test results (various indicators) of children with varying degree of dental fluorosis Table 4 -‐ Test results (various indicators) of children with varying degree of dental fluorosis Table 4 -‐ Test results (various indicators) of children with varying degree of dental fluorosis Table 4 -‐ Test results (various indicators) of children with varying degree of dental fluorosis Table 4 -‐ Test results (various indicators) of children with varying degree of dental fluorosis Table 4 -‐ Test results (various indicators) of children with varying degree of dental fluorosis Table 4 -‐ Test results (various indicators) of children with varying degree of dental fluorosis
Degree of Fluorosis
No. Subjects Examined
CogniTon Group Comparison
ComparaTve Logic
Serial RelaTonship Abstract Logic
Normal 15 9.600±1.692 8.533±2.997 8.133±2.997 7.333±2.870 3.067±2.052
Suspected 13 9.423±2.326 7.923±3.303 7.539±3.178 5.385±2.725 2.308±2.250
Very mild 13 8.231±2.743 7.154±3.805 6.692±3.449 4.923±2.842 1.231±1.235 a
Mild 14 8.143±2.804 6.786±3.068 5.143±2.958 a 4.214±2.424 a 1.143±1.167 a
Medium 12 8.083±3.096 6.583±2.999 4.750±3.646 a 3.750±3.306 a 0.667±0.779 a
Severe 13 6.654±3.085 5.539±3.126 3.461±2.222 ab 2.615±2.8444 a 0.539±0.660 ab
F value 2.179 0.874 3.761 3.150 3.534
P value 0.066 0.503 0.004 0.013 0.007
Note: (a) In comparison to the normal group, P<0.05; (b) in comparison to the suspected fluorosis group, P<0.05.Note: (a) In comparison to the normal group, P<0.05; (b) in comparison to the suspected fluorosis group, P<0.05.Note: (a) In comparison to the normal group, P<0.05; (b) in comparison to the suspected fluorosis group, P<0.05.Note: (a) In comparison to the normal group, P<0.05; (b) in comparison to the suspected fluorosis group, P<0.05.Note: (a) In comparison to the normal group, P<0.05; (b) in comparison to the suspected fluorosis group, P<0.05.Note: (a) In comparison to the normal group, P<0.05; (b) in comparison to the suspected fluorosis group, P<0.05.Note: (a) In comparison to the normal group, P<0.05; (b) in comparison to the suspected fluorosis group, P<0.05.
Journal of Environment and Health Volume 26 | Issue 4 | 2009 | pp. 838-840 5
approaches infancy. An overdose of various types of elements, or lack thereof, in one’s surrounding environment can have a highly negaEve impact on the development of the brain and nervous system. Research on the poisonous effect of fluoride in recent years has shown that an overdose of fluoride can be damaging to the central nervous system. If, during pregnancy, the mother ingests a higher than normal amount of fluoride, the fluoride can be transferred from the placenta to the actual body of the fetus and negaEvely affect its normal development. If, amer birth, the child is conEnually subjected to living in an endemic environment, the child could be taking in more fluoride than needed. In parEcular, if the child has an overdose of fluoride between the Eme of birth up unEl the age of 8, the fluoride may penetrate the blood-‐cerebrospinal fluid barrier to affect the development of the child’s brain in different phases. This will then cause different degrees of negaEve impacts on the child’s intelligence level and funcEonality of his nervous system. (2, 3)
Another important indicator that bears on fluoride’s ability to harm the subject's body and organs is the concentraEon of fluoride in urine. The present research has compared the difference between the urinary fluoride concentraEon in children with different degrees of fluoride poisoning. We have discovered that, if we do not consider the environmental impact of the endemic region on the subject's illness, the difference between the level of fluoride concentraEon in the urine samples from different children with various degrees of dental fluorosis does bear staEsEcal significance (P<0.01). The more severe the symptoms of dental fluorosis in a subject, the higher the level of concentraEon of fluoride will be found in the subject's urine sample. This finding is consistent with the viewpoints of most published studies[4]. For this reason our research has focused on using the level of fluoride found in the children’s urine as a way of inspecEng the body's ability to withstand fluoride. Our research, however, did not find any difference in the level of fluoride in the urine samples of children affected by fluoride poisoning, despite their coming from different endemic regions. Such results seem to be in conflict with the results of previous research. This may be due to the method of analysis we used within the scope of this parEcular project.
Previously, researchers would not consider the impact of the actual disease on the subject as part of the controlled factors. Therefore, they would normally gather results that come up as posiEve. Our research is different in the sense that, while we use the random selecEon method, we had, simultaneously, looked into and analyzed the effect and impact of the actual disease (dental fluorosis), as well as that of other types of fluoride poisoning from the endemic region. This means that when we were analyzing the endemic regions, we had taken the bodily ailments of the subjects into consideraEon as a controlled factor. Similarly, we had taken the data associated with the endemic region into consideraEon when we were analyzing the actual symptoms and impact of the diseases. In using these controlled procedures, we have discovered that the differences between the IQ and urinary fluoride levels across the various endemic regions do not have staEsEcal significance, whereas there is staEsEcal significance when comparing the differences in these indicators across the varying levels of fluoride poisoning. These results indicate that changes in the level of intelligence, the fluoride concentraEon in urine, as well as other indicators, have an important correlaEon with the severity of dental fluorosis.
Researchers frequently use IQ as an indicator to measure the development of intelligence in a subject. There are numerous methods to test IQ. The one we have used for the present study is the CRT-‐CR. This test focuses on tesEng the basic elements of a child's intellectual ability, and the method is parEcularly suitable for group tesEng. The test results are not affected by factors such as culture, ethnicity and language, and can aptly demonstrate the way a child's intelligence moves from factual, intuiEve/visual type of thinking to more abstract, logical thinking. This then reflects a child's intellectual development and level of maturity. We have therefore chosen this parEcular method to test our subjects' level of intelligence, as we believe this method to be reputable and effecEve.
The present research has also concluded that the difference in the level of intelligence between children suffering from various degrees of dental fluorosis does have staEsEcal significance (P<0.05). As the disease progresses in severity, the child's IQ was seen to go

Journal of Environment and Health Volume 26 | Issue 4 | 2009 | pp. 838-840 6
consistently downwards. Relevant research has shown that a child's level of intelligence (IQ) correlates with the fluoride level in urine (P<0.01). Such results are indicaEve of the fact that a high intake or overdose of fluoride has clear, negaEve impacts on the development of intelligence in children. This finding is most definitely consistent with the results of previous research on endemic fluorosis performed by other researchers[5,6].
The present invesEgaEon also focused on the impact of fluoride poisoning on the child's cogniEon and abstract logic. It was found that the difference of a subject's cogniEon and group comparison abiliEes are not staEsEcally significant when comparing children with varying degrees of dental fluorosis. (P>0.05). These two indicators are primarily indicaEve of a subject's logical thinking. By contrast, the differences found in comparaEve logic, serial relaEonship, and abstract analysis capaciEes amongst children with varying degree of fluoride poisoning did reach staEsEcal significance (P<0.05). As the disease progresses, scores a]ained for all 3 indicators decreased. These 3 indicators are therefore indicaEve of the harmful effect of fluoride poisoning on the children's mental development. It can be seen that such poisoning primarily effects the child's performance in abstract thinking, whereas it does li]le to effect the child's visual thinking ability. The likely reason for this is that as fluoride conEnues to build up inside the brain, the maturity of the brain (which is sEll undergoing development) would be affected. While children affected by fluoride poisoning are sEll capable to perform decently in simple neural exercises, they under-‐perform in more complicated neural acEvity.
It is worth menEoning that results presented here were gathered amer excluding the factor of "regional influence". We believe such results, presented in this manner, are more reliable and reflect the truth of the situaEon. AddiEonally, our research has reinforced the finding that the severity of dental fluorosis (fluoride poisoning) directly correlates with a child's mental development. We therefore believe that this relaEonship merits greater acknowledgement from researchers and interested parEes alike.
Looking at the results gathered from this study on the intelligence level of children with varying degrees of
fluorosis, it is clear that fluoride's harmful impact on the central nervous system could be seen via the development of the subjects' intellect. In parEcular, said impact can be seen in the children's abstract thinking and logic. Accordingly, it is important that we raise our society's awareness of this issue.
Bibliography
[1] Editorial. Fluoride and intelligence (J). Fluoride, 2000, 33: 49-‐52.2
[2] Yongping Li, Changyi Jin, De Chen et al. The impact of fluoride poisoning on the development of intelligence in children in Baotou city. (J). Management f the Public Health of China, 2003, 19, 4: 337-‐338.
[3] Jun Chen, Xuemin Chen, Study of impact of selenium and zinc on fluoride's preven<ve ability, and the impact of fluoride on the DNA of male rats' brain cells. (J), Chinese Public Health, 2002, 15, 4: 231-‐232.
[4] Yufu Sun, Guoxing Teng, Guangqian Yu et al. The study of epidemics: the correla<on between the intake of fluoride and fluoride poisoning caused by coal burning. (J). The Chinese Regional Endemic Journal, 1993, 12, 6: 351.
[5] XS Li, JL Zhi, RO Gao. The effect of fluoride exposure on intelligence in children. (J). Fluoride, 1995, 28:189-‐192.
[6] Y Lu, ZR Sun, LN Wu et al. The effect of high-‐fluoride water on intelligence in children (J). Fluoride, 2000, 33: 74-‐78.
DraZ collected on: October 5, 2008. Edited on: December 3, 2008.
Editor of this ar&cle: Shen Gao
Translated from Chinese into English by FoxTranslate, courtesy of the Fluoride Ac<on Network (2012). For more transla<ons of Chinese research on fluoride toxicity, see www.fluoridealert.org/researchers/transla<ons/
Chinese Journal of Endemiology Volume 28 | Issue 2 | 2009 | pp. 194-196 1
Diagnosis of Endemic Skeletal Fluorosis: Clinical Examina9on vs. X-‐Rays
HUANG, Changqing1, CHEN, Zhi2, TANG, Riqi2, LIU, Binghuan3
1Department of Endemic Fluorosis, Jilin Province No 1, Institute for Prevention and Treatment of Endemic Diseases, Baicheng 137000, China
2Fluorosis Prevention and Treatment Research Institute at the Endemic Disease Control Center of the Chinese Disease Prevention and Control Center of Harbin Medical University
3X-Ray Department at the affiliated No. 1 Hospital
Objec&ve: To compare the diagnosis of endemic skeletal fluorosis by means of clinical examina<on to diagnosis by x-‐ray, in order to provide a founda<on for revising standards of clinical diagnosis for endemic osteofluorosis.
Method: The study was carried out using exis<ng data. The fluoride levels of 15 villages in the Qianan and Nongan coun<es of Jilin, where residents con<nue to drink from naturally fluoridated sources, were divided into 11 categories based on the fluoride content of the water: 0.5, 1.0, 1.5, 2.0, 2.2, 2.4, 3.0, 3.5, 4.0, 6.0, and 7.0 mg/L. 675 residents between the ages of 16 and 60 who had lived in the area for at least 10 years were selected as subjects; the results of their diagnosis by either clinical examina<on or x-‐ray examina<on were analyzed and compared.
Results: For subjects drinking water with fluoride concentra<ons of 2.0, 2.2, 2.4, 3.0, and 4.0 mg/L, clinical detec<on rates (21.43%, 22.45%, 21.28%, 19.05%, 38.89%) were markedly higher than x-‐ray detec<on rates (0, 2.04%, 9%, 4.76%, 12.96%; χ2 = 7.96, 9.49, 11.19, 4.08, 9.45, p < 0.05). The detec<on rate for x-‐rays were zero at fluoride concentra<ons of 2.0 and 2.4 mg/L, and s<ll rela<vely low at 3.0 and 4.0 mg/L. At fluoride concentra<ons of 0.5, 1.0, 1.5, 3.5, 6.0, 7.0 mg/L, the difference between the clinical detec<on rates (1.00%, 4.44%, 7.23%, 18.00%, 54.39%, 49.18%) and x-‐ray detec<on rates (0, 2.22%, 3.61%, 8.00%, 36.84%, 52.46%) was not sta<s<cally significant ( χ2 = 1.00, 0.17, 0.47, 2.21, 3.54, 0.13, p > 0.05)
Conclusion: With both the clinical and x-‐ray method, the detec<on rate increases with the concentra<on of fluoride in the local water, and the clinical detec<on rate increases more reliably with concentra<on than the x-‐ray detec<on rate.
Key words: Osteofluorosis; X-‐rays; diagnosis; water consump<on; results assessment
Osteofluorosis is a key indicator for endemic fluoride poisoning. Generally speaking, osteofluorosis is diagnosed by means of either clinical examina<on or x-‐ray. As part of the work in preven<ng and trea<ng this disease, the consistency of results between clinical and x-‐ray examina<ons needs to be beber understood; this will provide an important benefit with respect to understanding and choosing diagnos<c techniques as well as improving diagnos<c standards. Using materials from the key research project "Quan<ta<ve Epidemiological Research on Endemic Fluoride Poisoning "[1] launched in 1984 by the Endemic Fluorosis Scien<fic Commibee of the Central Office of Endemic Diseases, the authors have carried out a comparison and analysis of osteofluorosis diagnoses by either clinical examina<on or x-‐ray, offering a new reference for future preven<on and treatment work and the crea<on of diagnos<c standards.
1.Materials and Methods
1.1 Place of Inves&ga&on: Our study uses materials previously collected from 15 villages from endemic areas in the Qianan and Nongan coun<es of Jilin province; these villages have existed at least 50 years and s<ll use their original water source. Detailed records have been kept about the fluoride concentra<on of the drinking water of these villages. (The concentra<on was measured using the ion selec<ve electrode method, with a range of varia<on less than 0.3 mg/L). The residents do not have the habit of drinking tea, are not very mobile, are of uniform ethnic composi<on, have similar natural surroundings, economic status, and living and working condi<ons, and are not subject to other sources of fluoride poisoning such as industry or coal-‐burning. The 15 villages were divided into 11 levels based on the fluoride concentra<on of their water: 0.5 mg/L (Xiaowangjia Village, Rangzijing Village); 1.0 mg/L (Xigengjia Village, Zhongrenzi Village); 1.5 mg/L (Majiawo Village, Jianzijing Village); 2.0 mg/L (Linjia Village); 2.2
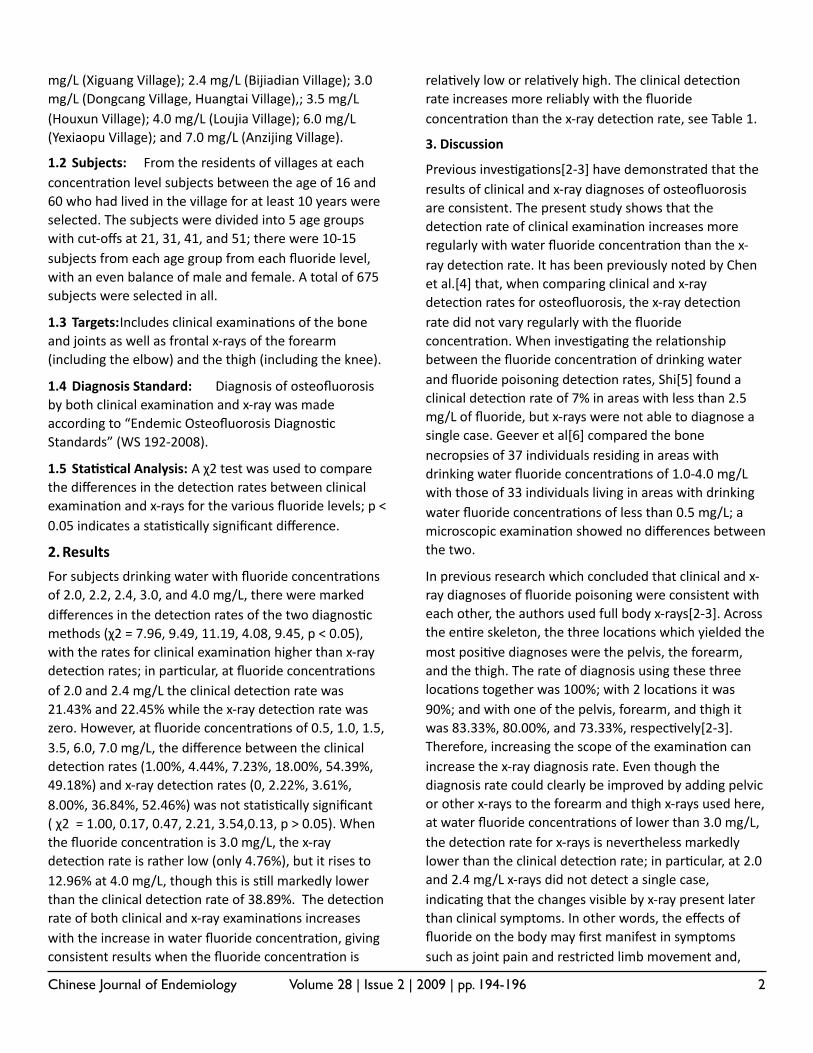
Chinese Journal of Endemiology Volume 28 | Issue 2 | 2009 | pp. 194-196 2
mg/L (Xiguang Village); 2.4 mg/L (Bijiadian Village); 3.0 mg/L (Dongcang Village, Huangtai Village),; 3.5 mg/L (Houxun Village); 4.0 mg/L (Loujia Village); 6.0 mg/L (Yexiaopu Village); and 7.0 mg/L (Anzijing Village).
1.2 Subjects: From the residents of villages at each concentra<on level subjects between the age of 16 and 60 who had lived in the village for at least 10 years were selected. The subjects were divided into 5 age groups with cut-‐offs at 21, 31, 41, and 51; there were 10-‐15 subjects from each age group from each fluoride level, with an even balance of male and female. A total of 675 subjects were selected in all.
1.3 Targets: Includes clinical examina<ons of the bone and joints as well as frontal x-‐rays of the forearm (including the elbow) and the thigh (including the knee).
1.4 Diagnosis Standard: Diagnosis of osteofluorosis by both clinical examina<on and x-‐ray was made according to “Endemic Osteofluorosis Diagnos<c Standards” (WS 192-‐2008).
1.5 Sta&s&cal Analysis: A χ2 test was used to compare the differences in the detec<on rates between clinical examina<on and x-‐rays for the various fluoride levels; p < 0.05 indicates a sta<s<cally significant difference.
2.Results
For subjects drinking water with fluoride concentra<ons of 2.0, 2.2, 2.4, 3.0, and 4.0 mg/L, there were marked differences in the detec<on rates of the two diagnos<c methods (χ2 = 7.96, 9.49, 11.19, 4.08, 9.45, p < 0.05), with the rates for clinical examina<on higher than x-‐ray detec<on rates; in par<cular, at fluoride concentra<ons of 2.0 and 2.4 mg/L the clinical detec<on rate was 21.43% and 22.45% while the x-‐ray detec<on rate was zero. However, at fluoride concentra<ons of 0.5, 1.0, 1.5, 3.5, 6.0, 7.0 mg/L, the difference between the clinical detec<on rates (1.00%, 4.44%, 7.23%, 18.00%, 54.39%, 49.18%) and x-‐ray detec<on rates (0, 2.22%, 3.61%, 8.00%, 36.84%, 52.46%) was not sta<s<cally significant ( χ2 = 1.00, 0.17, 0.47, 2.21, 3.54,0.13, p > 0.05). When the fluoride concentra<on is 3.0 mg/L, the x-‐ray detec<on rate is rather low (only 4.76%), but it rises to 12.96% at 4.0 mg/L, though this is s<ll markedly lower than the clinical detec<on rate of 38.89%. The detec<on rate of both clinical and x-‐ray examina<ons increases with the increase in water fluoride concentra<on, giving consistent results when the fluoride concentra<on is
rela<vely low or rela<vely high. The clinical detec<on rate increases more reliably with the fluoride concentra<on than the x-‐ray detec<on rate, see Table 1.
3. Discussion
Previous inves<ga<ons[2-‐3] have demonstrated that the results of clinical and x-‐ray diagnoses of osteofluorosis are consistent. The present study shows that the detec<on rate of clinical examina<on increases more regularly with water fluoride concentra<on than the x-‐ray detec<on rate. It has been previously noted by Chen et al.[4] that, when comparing clinical and x-‐ray detec<on rates for osteofluorosis, the x-‐ray detec<on rate did not vary regularly with the fluoride concentra<on. When inves<ga<ng the rela<onship between the fluoride concentra<on of drinking water and fluoride poisoning detec<on rates, Shi[5] found a clinical detec<on rate of 7% in areas with less than 2.5 mg/L of fluoride, but x-‐rays were not able to diagnose a single case. Geever et al[6] compared the bone necropsies of 37 individuals residing in areas with drinking water fluoride concentra<ons of 1.0-‐4.0 mg/L with those of 33 individuals living in areas with drinking water fluoride concentra<ons of less than 0.5 mg/L; a microscopic examina<on showed no differences between the two.
In previous research which concluded that clinical and x-‐ray diagnoses of fluoride poisoning were consistent with each other, the authors used full body x-‐rays[2-‐3]. Across the en<re skeleton, the three loca<ons which yielded the most posi<ve diagnoses were the pelvis, the forearm, and the thigh. The rate of diagnosis using these three loca<ons together was 100%; with 2 loca<ons it was 90%; and with one of the pelvis, forearm, and thigh it was 83.33%, 80.00%, and 73.33%, respec<vely[2-‐3]. Therefore, increasing the scope of the examina<on can increase the x-‐ray diagnosis rate. Even though the diagnosis rate could clearly be improved by adding pelvic or other x-‐rays to the forearm and thigh x-‐rays used here, at water fluoride concentra<ons of lower than 3.0 mg/L, the detec<on rate for x-‐rays is nevertheless markedly lower than the clinical detec<on rate; in par<cular, at 2.0 and 2.4 mg/L x-‐rays did not detect a single case, indica<ng that the changes visible by x-‐ray present later than clinical symptoms. In other words, the effects of fluoride on the body may first manifest in symptoms such as joint pain and restricted limb movement and,
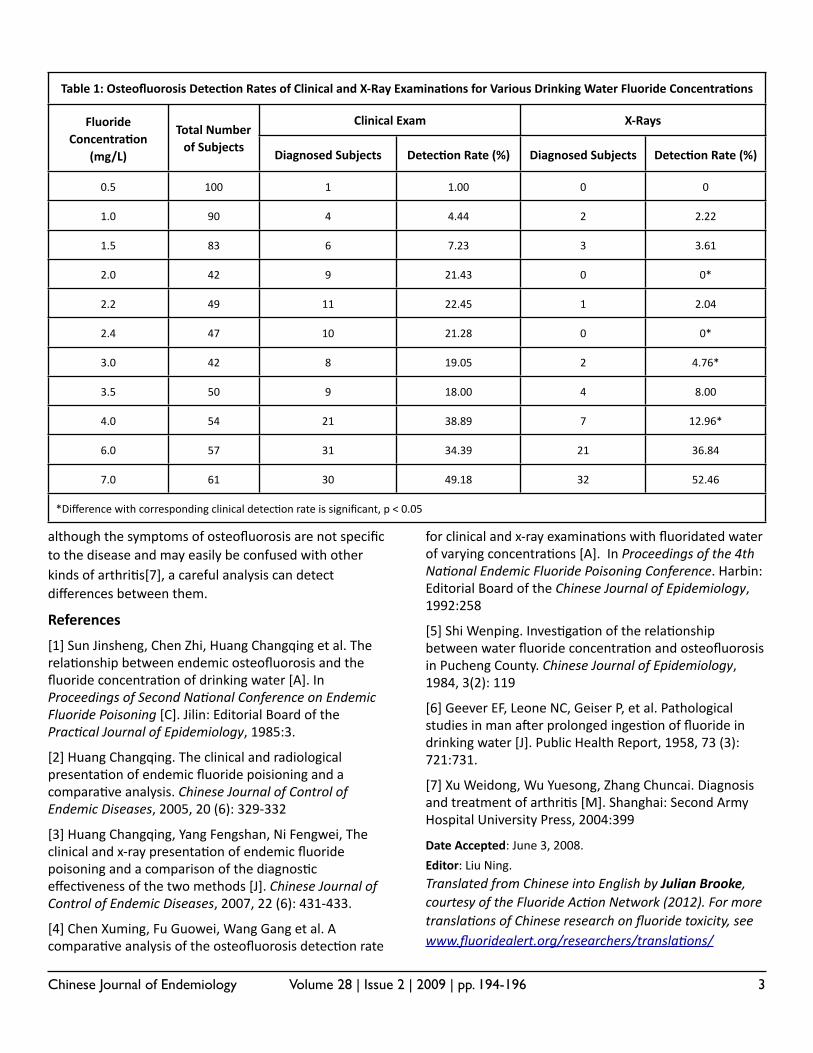
Chinese Journal of Endemiology Volume 28 | Issue 2 | 2009 | pp. 194-196 3
although the symptoms of osteofluorosis are not specific to the disease and may easily be confused with other kinds of arthri<s[7], a careful analysis can detect differences between them.
References
[1] Sun Jinsheng, Chen Zhi, Huang Changqing et al. The rela<onship between endemic osteofluorosis and the fluoride concentra<on of drinking water [A]. In Proceedings of Second Na0onal Conference on Endemic Fluoride Poisoning [C]. Jilin: Editorial Board of the Prac0cal Journal of Epidemiology, 1985:3.
[2] Huang Changqing. The clinical and radiological presenta<on of endemic fluoride poisioning and a compara<ve analysis. Chinese Journal of Control of Endemic Diseases, 2005, 20 (6): 329-‐332
[3] Huang Changqing, Yang Fengshan, Ni Fengwei, The clinical and x-‐ray presenta<on of endemic fluoride poisoning and a comparison of the diagnos<c effec<veness of the two methods [J]. Chinese Journal of Control of Endemic Diseases, 2007, 22 (6): 431-‐433.
[4] Chen Xuming, Fu Guowei, Wang Gang et al. A compara<ve analysis of the osteofluorosis detec<on rate
for clinical and x-‐ray examina<ons with fluoridated water of varying concentra<ons [A]. In Proceedings of the 4th Na0onal Endemic Fluoride Poisoning Conference. Harbin: Editorial Board of the Chinese Journal of Epidemiology, 1992:258
[5] Shi Wenping. Inves<ga<on of the rela<onship between water fluoride concentra<on and osteofluorosis in Pucheng County. Chinese Journal of Epidemiology, 1984, 3(2): 119
[6] Geever EF, Leone NC, Geiser P, et al. Pathological studies in man axer prolonged inges<on of fluoride in drinking water [J]. Public Health Report, 1958, 73 (3): 721:731.
[7] Xu Weidong, Wu Yuesong, Zhang Chuncai. Diagnosis and treatment of arthri<s [M]. Shanghai: Second Army Hospital University Press, 2004:399
Date Accepted: June 3, 2008.
Editor: Liu Ning.Translated from Chinese into English by Julian Brooke, courtesy of the Fluoride Ac0on Network (2012). For more transla0ons of Chinese research on fluoride toxicity, see www.fluoridealert.org/researchers/transla0ons/
Table 1: Osteofluorosis Detec&on Rates of Clinical and X-‐Ray Examina&ons for Various Drinking Water Fluoride Concentra&onsTable 1: Osteofluorosis Detec&on Rates of Clinical and X-‐Ray Examina&ons for Various Drinking Water Fluoride Concentra&onsTable 1: Osteofluorosis Detec&on Rates of Clinical and X-‐Ray Examina&ons for Various Drinking Water Fluoride Concentra&onsTable 1: Osteofluorosis Detec&on Rates of Clinical and X-‐Ray Examina&ons for Various Drinking Water Fluoride Concentra&onsTable 1: Osteofluorosis Detec&on Rates of Clinical and X-‐Ray Examina&ons for Various Drinking Water Fluoride Concentra&onsTable 1: Osteofluorosis Detec&on Rates of Clinical and X-‐Ray Examina&ons for Various Drinking Water Fluoride Concentra&ons
Fluoride Concentra&on
(mg/L)
Total Number of Subjects
Clinical ExamClinical Exam X-‐RaysX-‐RaysFluoride Concentra&on
(mg/L)
Total Number of Subjects
Diagnosed Subjects Detec&on Rate (%) Diagnosed Subjects Detec&on Rate (%)
0.5 100 1 1.00 0 0
1.0 90 4 4.44 2 2.22
1.5 83 6 7.23 3 3.61
2.0 42 9 21.43 0 0*
2.2 49 11 22.45 1 2.04
2.4 47 10 21.28 0 0*
3.0 42 8 19.05 2 4.76*
3.5 50 9 18.00 4 8.00
4.0 54 21 38.89 7 12.96*
6.0 57 31 34.39 21 36.84
7.0 61 30 49.18 32 52.46
*Difference with corresponding clinical detec<on rate is significant, p < 0.05*Difference with corresponding clinical detec<on rate is significant, p < 0.05*Difference with corresponding clinical detec<on rate is significant, p < 0.05*Difference with corresponding clinical detec<on rate is significant, p < 0.05*Difference with corresponding clinical detec<on rate is significant, p < 0.05*Difference with corresponding clinical detec<on rate is significant, p < 0.05
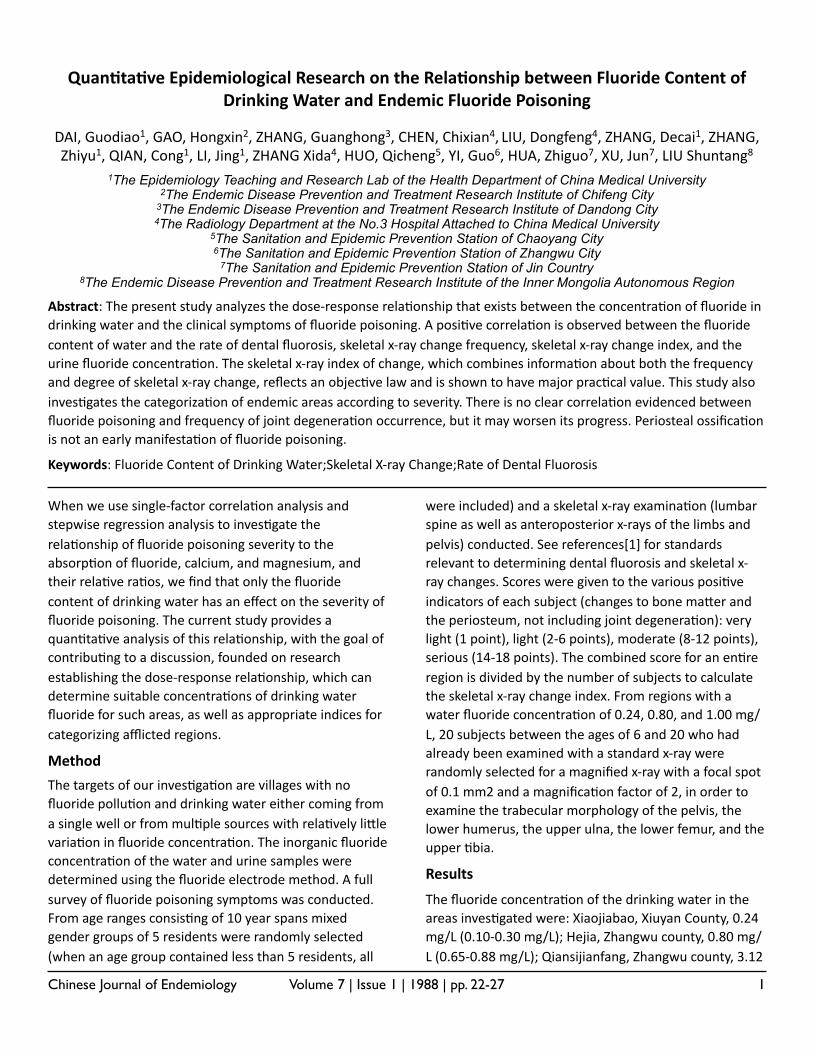
Chinese Journal of Endemiology Volume 7 | Issue 1 | 1988 | pp. 22-27 1
Quan%ta%ve Epidemiological Research on the Rela%onship between Fluoride Content of Drinking Water and Endemic Fluoride Poisoning
DAI, Guodiao1, GAO, Hongxin2, ZHANG, Guanghong3, CHEN, Chixian4, LIU, Dongfeng4, ZHANG, Decai1, ZHANG, Zhiyu1, QIAN, Cong1, LI, Jing1, ZHANG Xida4, HUO, Qicheng5, YI, Guo6, HUA, Zhiguo7, XU, Jun7, LIU Shuntang8
1The Epidemiology Teaching and Research Lab of the Health Department of China Medical University2The Endemic Disease Prevention and Treatment Research Institute of Chifeng City
3The Endemic Disease Prevention and Treatment Research Institute of Dandong City4The Radiology Department at the No.3 Hospital Attached to China Medical University
5The Sanitation and Epidemic Prevention Station of Chaoyang City6The Sanitation and Epidemic Prevention Station of Zhangwu City
7The Sanitation and Epidemic Prevention Station of Jin Country8The Endemic Disease Prevention and Treatment Research Institute of the Inner Mongolia Autonomous Region
Abstract: The present study analyzes the dose-‐response rela;onship that exists between the concentra;on of fluoride in drinking water and the clinical symptoms of fluoride poisoning. A posi;ve correla;on is observed between the fluoride content of water and the rate of dental fluorosis, skeletal x-‐ray change frequency, skeletal x-‐ray change index, and the urine fluoride concentra;on. The skeletal x-‐ray index of change, which combines informa;on about both the frequency and degree of skeletal x-‐ray change, reflects an objec;ve law and is shown to have major prac;cal value. This study also inves;gates the categoriza;on of endemic areas according to severity. There is no clear correla;on evidenced between fluoride poisoning and frequency of joint degenera;on occurrence, but it may worsen its progress. Periosteal ossifica;on is not an early manifesta;on of fluoride poisoning.
Keywords: Fluoride Content of Drinking Water;Skeletal X-‐ray Change;Rate of Dental Fluorosis
When we use single-‐factor correla;on analysis and stepwise regression analysis to inves;gate the rela;onship of fluoride poisoning severity to the absorp;on of fluoride, calcium, and magnesium, and their rela;ve ra;os, we find that only the fluoride content of drinking water has an effect on the severity of fluoride poisoning. The current study provides a quan;ta;ve analysis of this rela;onship, with the goal of contribu;ng to a discussion, founded on research establishing the dose-‐response rela;onship, which can determine suitable concentra;ons of drinking water fluoride for such areas, as well as appropriate indices for categorizing afflicted regions.
Method
The targets of our inves;ga;on are villages with no fluoride pollu;on and drinking water either coming from a single well or from mul;ple sources with rela;vely liXle varia;on in fluoride concentra;on. The inorganic fluoride concentra;on of the water and urine samples were determined using the fluoride electrode method. A full survey of fluoride poisoning symptoms was conducted. From age ranges consis;ng of 10 year spans mixed gender groups of 5 residents were randomly selected (when an age group contained less than 5 residents, all
were included) and a skeletal x-‐ray examina;on (lumbar spine as well as anteroposterior x-‐rays of the limbs and pelvis) conducted. See references[1] for standards relevant to determining dental fluorosis and skeletal x-‐ray changes. Scores were given to the various posi;ve indicators of each subject (changes to bone maXer and the periosteum, not including joint degenera;on): very light (1 point), light (2-‐6 points), moderate (8-‐12 points), serious (14-‐18 points). The combined score for an en;re region is divided by the number of subjects to calculate the skeletal x-‐ray change index. From regions with a water fluoride concentra;on of 0.24, 0.80, and 1.00 mg/L, 20 subjects between the ages of 6 and 20 who had already been examined with a standard x-‐ray were randomly selected for a magnified x-‐ray with a focal spot of 0.1 mm2 and a magnifica;on factor of 2, in order to examine the trabecular morphology of the pelvis, the lower humerus, the upper ulna, the lower femur, and the upper ;bia.
Results
The fluoride concentra;on of the drinking water in the areas inves;gated were: Xiaojiabao, Xiuyan County, 0.24 mg/L (0.10-‐0.30 mg/L); Hejia, Zhangwu county, 0.80 mg/L (0.65-‐0.88 mg/L); Qiansijianfang, Zhangwu county, 3.12
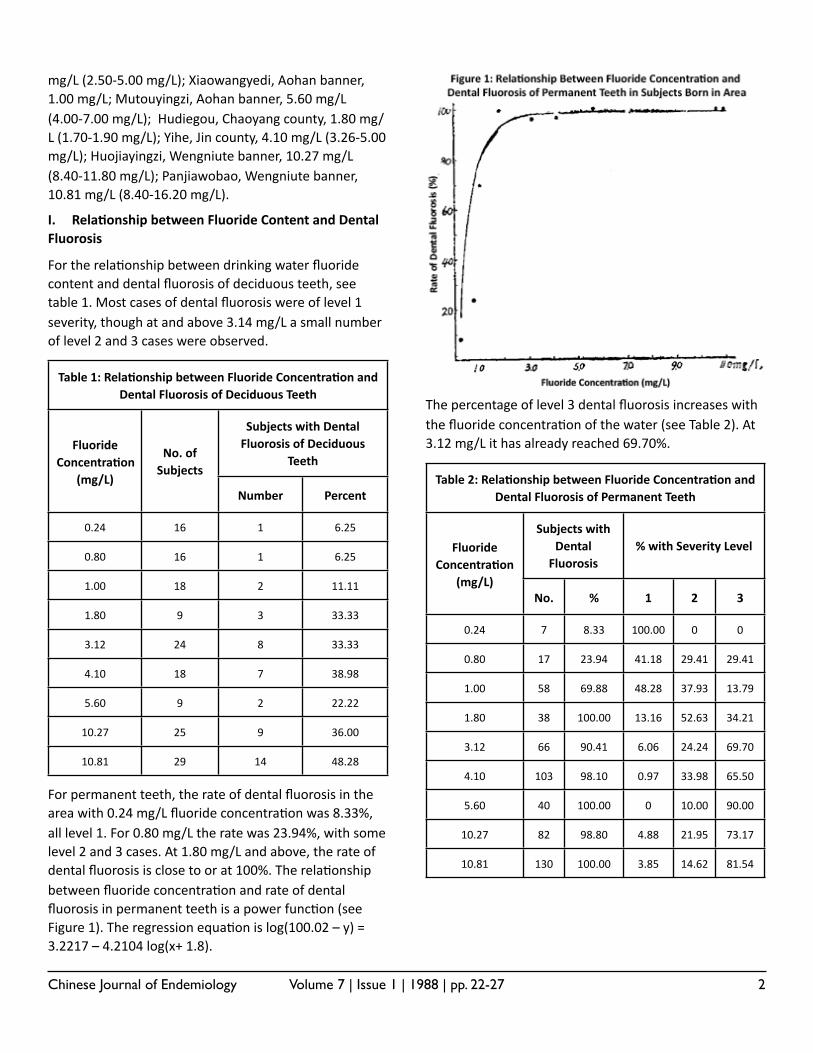
Chinese Journal of Endemiology Volume 7 | Issue 1 | 1988 | pp. 22-27 2
mg/L (2.50-‐5.00 mg/L); Xiaowangyedi, Aohan banner, 1.00 mg/L; Mutouyingzi, Aohan banner, 5.60 mg/L (4.00-‐7.00 mg/L); Hudiegou, Chaoyang county, 1.80 mg/L (1.70-‐1.90 mg/L); Yihe, Jin county, 4.10 mg/L (3.26-‐5.00 mg/L); Huojiayingzi, Wengniute banner, 10.27 mg/L (8.40-‐11.80 mg/L); Panjiawobao, Wengniute banner, 10.81 mg/L (8.40-‐16.20 mg/L).
I. Rela3onship between Fluoride Content and Dental Fluorosis
For the rela;onship between drinking water fluoride content and dental fluorosis of deciduous teeth, see table 1. Most cases of dental fluorosis were of level 1 severity, though at and above 3.14 mg/L a small number of level 2 and 3 cases were observed.
Table 1: Rela3onship between Fluoride Concentra3on and Dental Fluorosis of Deciduous Teeth
Table 1: Rela3onship between Fluoride Concentra3on and Dental Fluorosis of Deciduous Teeth
Table 1: Rela3onship between Fluoride Concentra3on and Dental Fluorosis of Deciduous Teeth
Table 1: Rela3onship between Fluoride Concentra3on and Dental Fluorosis of Deciduous Teeth
Fluoride Concentra3on
(mg/L)
No. of Subjects
Subjects with Dental Fluorosis of Deciduous
Teeth
Subjects with Dental Fluorosis of Deciduous
TeethFluoride
Concentra3on (mg/L)
No. of Subjects
Number Percent
0.24 16 1 6.25
0.80 16 1 6.25
1.00 18 2 11.11
1.80 9 3 33.33
3.12 24 8 33.33
4.10 18 7 38.98
5.60 9 2 22.22
10.27 25 9 36.00
10.81 29 14 48.28
For permanent teeth, the rate of dental fluorosis in the area with 0.24 mg/L fluoride concentra;on was 8.33%, all level 1. For 0.80 mg/L the rate was 23.94%, with some level 2 and 3 cases. At 1.80 mg/L and above, the rate of dental fluorosis is close to or at 100%. The rela;onship between fluoride concentra;on and rate of dental fluorosis in permanent teeth is a power func;on (see Figure 1). The regression equa;on is log(100.02 – y) = 3.2217 – 4.2104 log(x+ 1.8).
The percentage of level 3 dental fluorosis increases with the fluoride concentra;on of the water (see Table 2). At 3.12 mg/L it has already reached 69.70%.
Table 2: Rela3onship between Fluoride Concentra3on and Dental Fluorosis of Permanent Teeth
Table 2: Rela3onship between Fluoride Concentra3on and Dental Fluorosis of Permanent Teeth
Table 2: Rela3onship between Fluoride Concentra3on and Dental Fluorosis of Permanent Teeth
Table 2: Rela3onship between Fluoride Concentra3on and Dental Fluorosis of Permanent Teeth
Table 2: Rela3onship between Fluoride Concentra3on and Dental Fluorosis of Permanent Teeth
Table 2: Rela3onship between Fluoride Concentra3on and Dental Fluorosis of Permanent Teeth
Fluoride Concentra3on
(mg/L)
Subjects with Dental Fluorosis
Subjects with Dental Fluorosis
% with Severity Level% with Severity Level% with Severity LevelFluoride Concentra3on
(mg/L)No. % 1 2 3
0.24 7 8.33 100.00 0 0
0.80 17 23.94 41.18 29.41 29.41
1.00 58 69.88 48.28 37.93 13.79
1.80 38 100.00 13.16 52.63 34.21
3.12 66 90.41 6.06 24.24 69.70
4.10 103 98.10 0.97 33.98 65.50
5.60 40 100.00 0 10.00 90.00
10.27 82 98.80 4.88 21.95 73.17
10.81 130 100.00 3.85 14.62 81.54
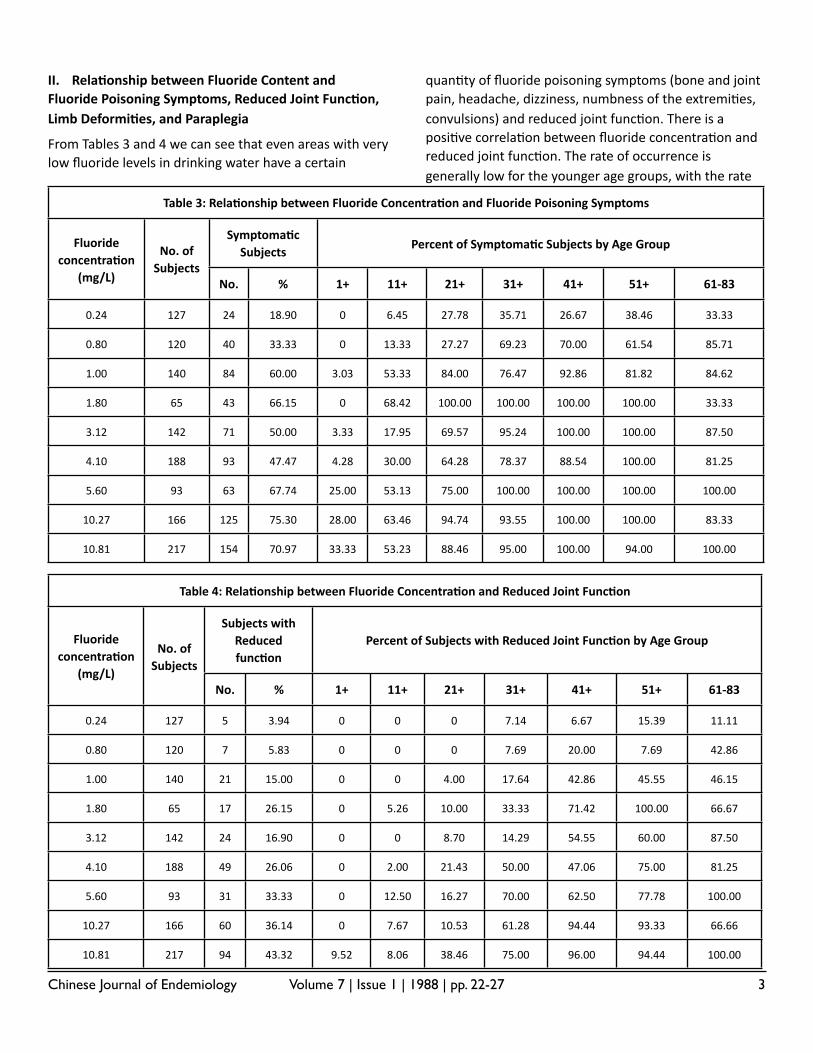
Chinese Journal of Endemiology Volume 7 | Issue 1 | 1988 | pp. 22-27 3
II. Rela3onship between Fluoride Content and Fluoride Poisoning Symptoms, Reduced Joint Func3on, Limb Deformi3es, and Paraplegia
From Tables 3 and 4 we can see that even areas with very low fluoride levels in drinking water have a certain
quan;ty of fluoride poisoning symptoms (bone and joint pain, headache, dizziness, numbness of the extremi;es, convulsions) and reduced joint func;on. There is a posi;ve correla;on between fluoride concentra;on and reduced joint func;on. The rate of occurrence is generally low for the younger age groups, with the rate
Table 3: Rela3onship between Fluoride Concentra3on and Fluoride Poisoning SymptomsTable 3: Rela3onship between Fluoride Concentra3on and Fluoride Poisoning SymptomsTable 3: Rela3onship between Fluoride Concentra3on and Fluoride Poisoning SymptomsTable 3: Rela3onship between Fluoride Concentra3on and Fluoride Poisoning SymptomsTable 3: Rela3onship between Fluoride Concentra3on and Fluoride Poisoning SymptomsTable 3: Rela3onship between Fluoride Concentra3on and Fluoride Poisoning SymptomsTable 3: Rela3onship between Fluoride Concentra3on and Fluoride Poisoning SymptomsTable 3: Rela3onship between Fluoride Concentra3on and Fluoride Poisoning SymptomsTable 3: Rela3onship between Fluoride Concentra3on and Fluoride Poisoning SymptomsTable 3: Rela3onship between Fluoride Concentra3on and Fluoride Poisoning SymptomsTable 3: Rela3onship between Fluoride Concentra3on and Fluoride Poisoning Symptoms
Fluoride concentra3on
(mg/L)
No. of Subjects
Symptoma3c Subjects
Symptoma3c Subjects
Percent of Symptoma3c Subjects by Age GroupPercent of Symptoma3c Subjects by Age GroupPercent of Symptoma3c Subjects by Age GroupPercent of Symptoma3c Subjects by Age GroupPercent of Symptoma3c Subjects by Age GroupPercent of Symptoma3c Subjects by Age GroupPercent of Symptoma3c Subjects by Age GroupFluoride concentra3on
(mg/L)
No. of Subjects
No. % 1+ 11+ 21+ 31+ 41+ 51+ 61-‐83
0.24 127 24 18.90 0 6.45 27.78 35.71 26.67 38.46 33.33
0.80 120 40 33.33 0 13.33 27.27 69.23 70.00 61.54 85.71
1.00 140 84 60.00 3.03 53.33 84.00 76.47 92.86 81.82 84.62
1.80 65 43 66.15 0 68.42 100.00 100.00 100.00 100.00 33.33
3.12 142 71 50.00 3.33 17.95 69.57 95.24 100.00 100.00 87.50
4.10 188 93 47.47 4.28 30.00 64.28 78.37 88.54 100.00 81.25
5.60 93 63 67.74 25.00 53.13 75.00 100.00 100.00 100.00 100.00
10.27 166 125 75.30 28.00 63.46 94.74 93.55 100.00 100.00 83.33
10.81 217 154 70.97 33.33 53.23 88.46 95.00 100.00 94.00 100.00
Table 4: Rela3onship between Fluoride Concentra3on and Reduced Joint Func3onTable 4: Rela3onship between Fluoride Concentra3on and Reduced Joint Func3onTable 4: Rela3onship between Fluoride Concentra3on and Reduced Joint Func3onTable 4: Rela3onship between Fluoride Concentra3on and Reduced Joint Func3onTable 4: Rela3onship between Fluoride Concentra3on and Reduced Joint Func3onTable 4: Rela3onship between Fluoride Concentra3on and Reduced Joint Func3onTable 4: Rela3onship between Fluoride Concentra3on and Reduced Joint Func3onTable 4: Rela3onship between Fluoride Concentra3on and Reduced Joint Func3onTable 4: Rela3onship between Fluoride Concentra3on and Reduced Joint Func3onTable 4: Rela3onship between Fluoride Concentra3on and Reduced Joint Func3onTable 4: Rela3onship between Fluoride Concentra3on and Reduced Joint Func3on
Fluoride concentra3on
(mg/L)
No. of Subjects
Subjects with Reduced func3on
Subjects with Reduced func3on
Percent of Subjects with Reduced Joint Func3on by Age GroupPercent of Subjects with Reduced Joint Func3on by Age GroupPercent of Subjects with Reduced Joint Func3on by Age GroupPercent of Subjects with Reduced Joint Func3on by Age GroupPercent of Subjects with Reduced Joint Func3on by Age GroupPercent of Subjects with Reduced Joint Func3on by Age GroupPercent of Subjects with Reduced Joint Func3on by Age GroupFluoride concentra3on
(mg/L)
No. of Subjects
No. % 1+ 11+ 21+ 31+ 41+ 51+ 61-‐83
0.24 127 5 3.94 0 0 0 7.14 6.67 15.39 11.11
0.80 120 7 5.83 0 0 0 7.69 20.00 7.69 42.86
1.00 140 21 15.00 0 0 4.00 17.64 42.86 45.55 46.15
1.80 65 17 26.15 0 5.26 10.00 33.33 71.42 100.00 66.67
3.12 142 24 16.90 0 0 8.70 14.29 54.55 60.00 87.50
4.10 188 49 26.06 0 2.00 21.43 50.00 47.06 75.00 81.25
5.60 93 31 33.33 0 12.50 16.27 70.00 62.50 77.78 100.00
10.27 166 60 36.14 0 7.67 10.53 61.28 94.44 93.33 66.66
10.81 217 94 43.32 9.52 8.06 38.46 75.00 96.00 94.44 100.00
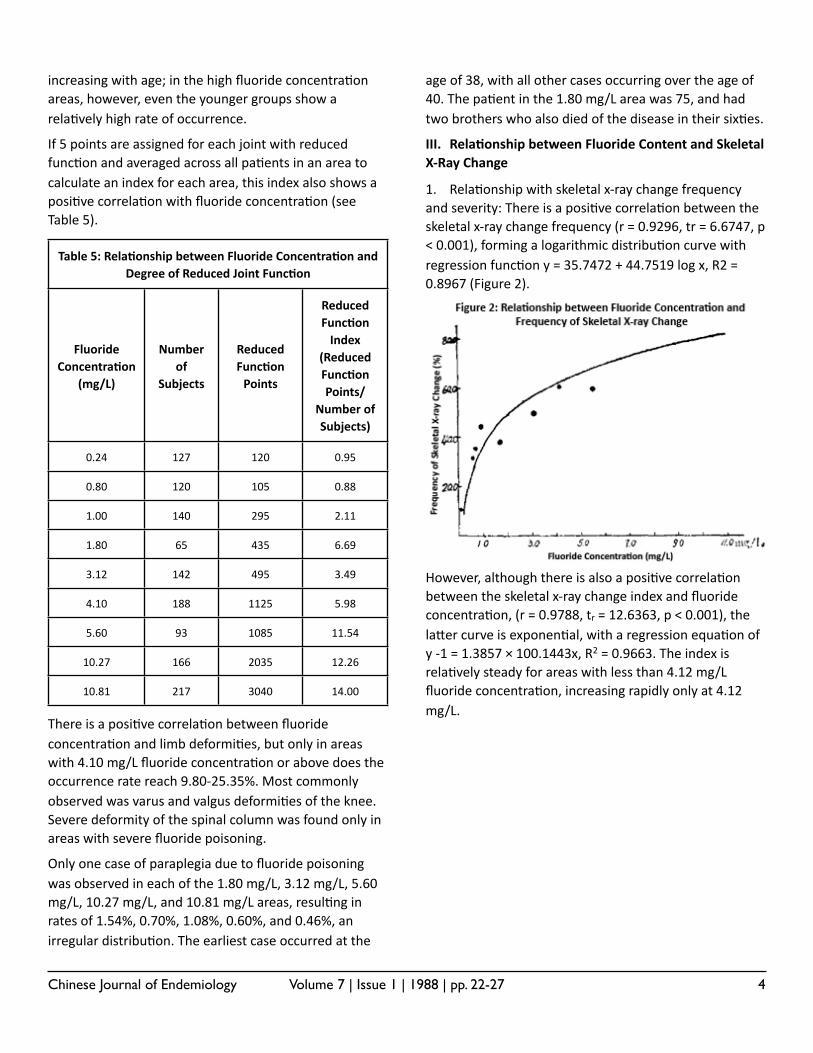
Chinese Journal of Endemiology Volume 7 | Issue 1 | 1988 | pp. 22-27 4
increasing with age; in the high fluoride concentra;on areas, however, even the younger groups show a rela;vely high rate of occurrence.
If 5 points are assigned for each joint with reduced func;on and averaged across all pa;ents in an area to calculate an index for each area, this index also shows a posi;ve correla;on with fluoride concentra;on (see Table 5).
Table 5: Rela3onship between Fluoride Concentra3on and Degree of Reduced Joint Func3on
Table 5: Rela3onship between Fluoride Concentra3on and Degree of Reduced Joint Func3on
Table 5: Rela3onship between Fluoride Concentra3on and Degree of Reduced Joint Func3on
Table 5: Rela3onship between Fluoride Concentra3on and Degree of Reduced Joint Func3on
Fluoride Concentra3on
(mg/L)
Number of
Subjects
Reduced Func3on Points
Reduced Func3on Index
(Reduced Func3on Points/
Number of Subjects)
0.24 127 120 0.95
0.80 120 105 0.88
1.00 140 295 2.11
1.80 65 435 6.69
3.12 142 495 3.49
4.10 188 1125 5.98
5.60 93 1085 11.54
10.27 166 2035 12.26
10.81 217 3040 14.00
There is a posi;ve correla;on between fluoride concentra;on and limb deformi;es, but only in areas with 4.10 mg/L fluoride concentra;on or above does the occurrence rate reach 9.80-‐25.35%. Most commonly observed was varus and valgus deformi;es of the knee. Severe deformity of the spinal column was found only in areas with severe fluoride poisoning.
Only one case of paraplegia due to fluoride poisoning was observed in each of the 1.80 mg/L, 3.12 mg/L, 5.60 mg/L, 10.27 mg/L, and 10.81 mg/L areas, resul;ng in rates of 1.54%, 0.70%, 1.08%, 0.60%, and 0.46%, an irregular distribu;on. The earliest case occurred at the
age of 38, with all other cases occurring over the age of 40. The pa;ent in the 1.80 mg/L area was 75, and had two brothers who also died of the disease in their six;es.
III. Rela3onship between Fluoride Content and Skeletal X-‐Ray Change
1. Rela;onship with skeletal x-‐ray change frequency and severity: There is a posi;ve correla;on between the skeletal x-‐ray change frequency (r = 0.9296, tr = 6.6747, p < 0.001), forming a logarithmic distribu;on curve with regression func;on y = 35.7472 + 44.7519 log x, R2 = 0.8967 (Figure 2).
However, although there is also a posi;ve correla;on between the skeletal x-‐ray change index and fluoride concentra;on, (r = 0.9788, tr = 12.6363, p < 0.001), the laXer curve is exponen;al, with a regression equa;on of y -‐1 = 1.3857 × 100.1443x, R2 = 0.9663. The index is rela;vely steady for areas with less than 4.12 mg/L fluoride concentra;on, increasing rapidly only at 4.12 mg/L.
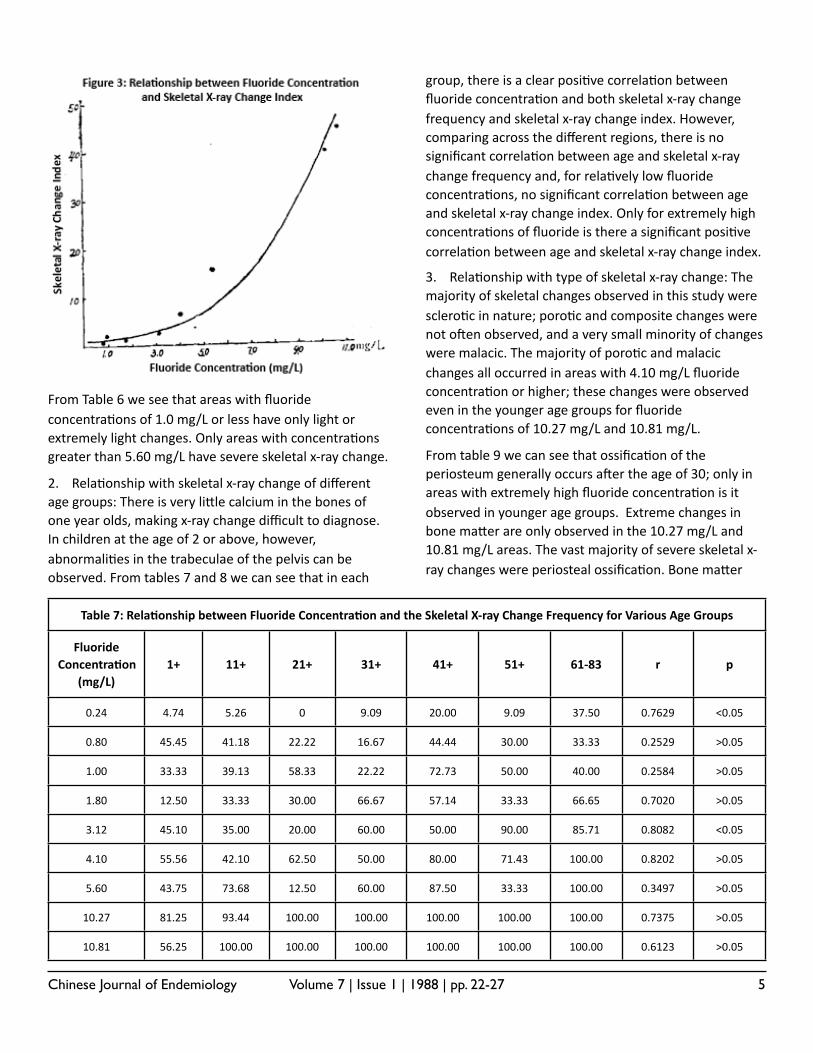
Chinese Journal of Endemiology Volume 7 | Issue 1 | 1988 | pp. 22-27 5
From Table 6 we see that areas with fluoride concentra;ons of 1.0 mg/L or less have only light or extremely light changes. Only areas with concentra;ons greater than 5.60 mg/L have severe skeletal x-‐ray change.
2. Rela;onship with skeletal x-‐ray change of different age groups: There is very liXle calcium in the bones of one year olds, making x-‐ray change difficult to diagnose. In children at the age of 2 or above, however, abnormali;es in the trabeculae of the pelvis can be observed. From tables 7 and 8 we can see that in each
group, there is a clear posi;ve correla;on between fluoride concentra;on and both skeletal x-‐ray change frequency and skeletal x-‐ray change index. However, comparing across the different regions, there is no significant correla;on between age and skeletal x-‐ray change frequency and, for rela;vely low fluoride concentra;ons, no significant correla;on between age and skeletal x-‐ray change index. Only for extremely high concentra;ons of fluoride is there a significant posi;ve correla;on between age and skeletal x-‐ray change index.
3. Rela;onship with type of skeletal x-‐ray change: The majority of skeletal changes observed in this study were sclero;c in nature; poro;c and composite changes were not open observed, and a very small minority of changes were malacic. The majority of poro;c and malacic changes all occurred in areas with 4.10 mg/L fluoride concentra;on or higher; these changes were observed even in the younger age groups for fluoride concentra;ons of 10.27 mg/L and 10.81 mg/L.
From table 9 we can see that ossifica;on of the periosteum generally occurs aper the age of 30; only in areas with extremely high fluoride concentra;on is it observed in younger age groups. Extreme changes in bone maXer are only observed in the 10.27 mg/L and 10.81 mg/L areas. The vast majority of severe skeletal x-‐ray changes were periosteal ossifica;on. Bone maXer
Table 7: Rela3onship between Fluoride Concentra3on and the Skeletal X-‐ray Change Frequency for Various Age GroupsTable 7: Rela3onship between Fluoride Concentra3on and the Skeletal X-‐ray Change Frequency for Various Age GroupsTable 7: Rela3onship between Fluoride Concentra3on and the Skeletal X-‐ray Change Frequency for Various Age GroupsTable 7: Rela3onship between Fluoride Concentra3on and the Skeletal X-‐ray Change Frequency for Various Age GroupsTable 7: Rela3onship between Fluoride Concentra3on and the Skeletal X-‐ray Change Frequency for Various Age GroupsTable 7: Rela3onship between Fluoride Concentra3on and the Skeletal X-‐ray Change Frequency for Various Age GroupsTable 7: Rela3onship between Fluoride Concentra3on and the Skeletal X-‐ray Change Frequency for Various Age GroupsTable 7: Rela3onship between Fluoride Concentra3on and the Skeletal X-‐ray Change Frequency for Various Age GroupsTable 7: Rela3onship between Fluoride Concentra3on and the Skeletal X-‐ray Change Frequency for Various Age GroupsTable 7: Rela3onship between Fluoride Concentra3on and the Skeletal X-‐ray Change Frequency for Various Age Groups
Fluoride Concentra3on
(mg/L)1+ 11+ 21+ 31+ 41+ 51+ 61-‐83 r p
0.24 4.74 5.26 0 9.09 20.00 9.09 37.50 0.7629 <0.05
0.80 45.45 41.18 22.22 16.67 44.44 30.00 33.33 0.2529 >0.05
1.00 33.33 39.13 58.33 22.22 72.73 50.00 40.00 0.2584 >0.05
1.80 12.50 33.33 30.00 66.67 57.14 33.33 66.65 0.7020 >0.05
3.12 45.10 35.00 20.00 60.00 50.00 90.00 85.71 0.8082 <0.05
4.10 55.56 42.10 62.50 50.00 80.00 71.43 100.00 0.8202 >0.05
5.60 43.75 73.68 12.50 60.00 87.50 33.33 100.00 0.3497 >0.05
10.27 81.25 93.44 100.00 100.00 100.00 100.00 100.00 0.7375 >0.05
10.81 56.25 100.00 100.00 100.00 100.00 100.00 100.00 0.6123 >0.05
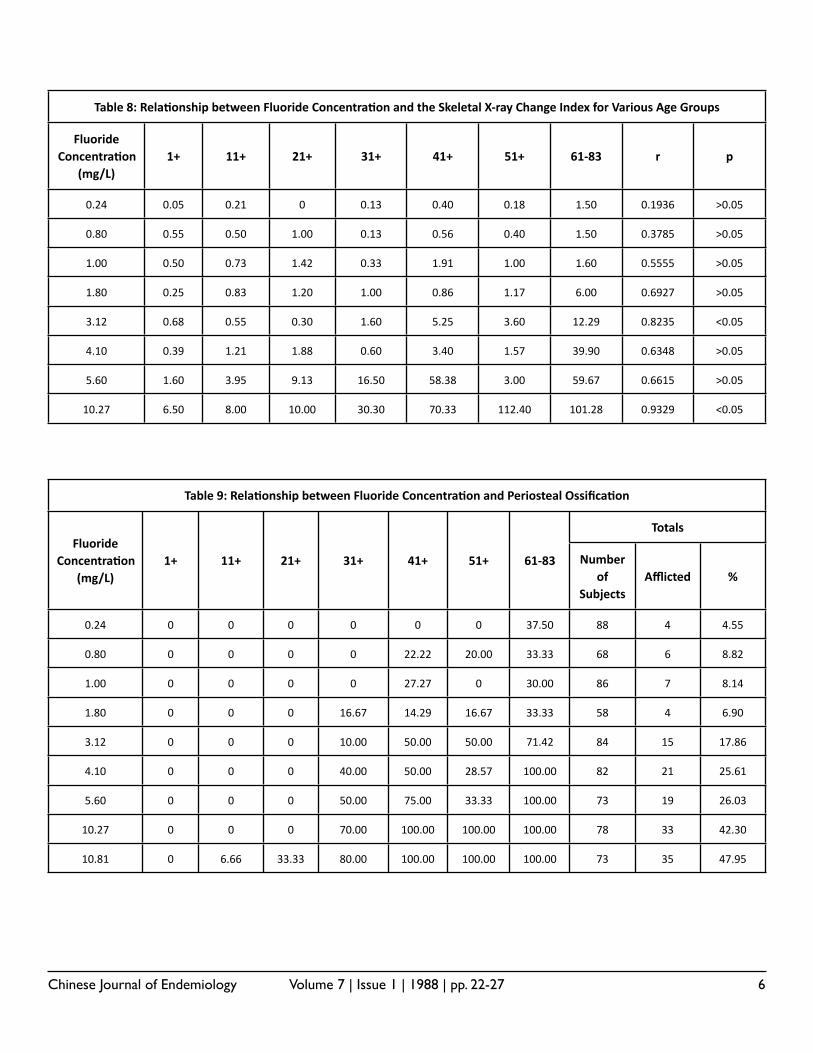
Chinese Journal of Endemiology Volume 7 | Issue 1 | 1988 | pp. 22-27 6
Table 8: Rela3onship between Fluoride Concentra3on and the Skeletal X-‐ray Change Index for Various Age GroupsTable 8: Rela3onship between Fluoride Concentra3on and the Skeletal X-‐ray Change Index for Various Age GroupsTable 8: Rela3onship between Fluoride Concentra3on and the Skeletal X-‐ray Change Index for Various Age GroupsTable 8: Rela3onship between Fluoride Concentra3on and the Skeletal X-‐ray Change Index for Various Age GroupsTable 8: Rela3onship between Fluoride Concentra3on and the Skeletal X-‐ray Change Index for Various Age GroupsTable 8: Rela3onship between Fluoride Concentra3on and the Skeletal X-‐ray Change Index for Various Age GroupsTable 8: Rela3onship between Fluoride Concentra3on and the Skeletal X-‐ray Change Index for Various Age GroupsTable 8: Rela3onship between Fluoride Concentra3on and the Skeletal X-‐ray Change Index for Various Age GroupsTable 8: Rela3onship between Fluoride Concentra3on and the Skeletal X-‐ray Change Index for Various Age GroupsTable 8: Rela3onship between Fluoride Concentra3on and the Skeletal X-‐ray Change Index for Various Age Groups
Fluoride Concentra3on
(mg/L)1+ 11+ 21+ 31+ 41+ 51+ 61-‐83 r p
0.24 0.05 0.21 0 0.13 0.40 0.18 1.50 0.1936 >0.05
0.80 0.55 0.50 1.00 0.13 0.56 0.40 1.50 0.3785 >0.05
1.00 0.50 0.73 1.42 0.33 1.91 1.00 1.60 0.5555 >0.05
1.80 0.25 0.83 1.20 1.00 0.86 1.17 6.00 0.6927 >0.05
3.12 0.68 0.55 0.30 1.60 5.25 3.60 12.29 0.8235 <0.05
4.10 0.39 1.21 1.88 0.60 3.40 1.57 39.90 0.6348 >0.05
5.60 1.60 3.95 9.13 16.50 58.38 3.00 59.67 0.6615 >0.05
10.27 6.50 8.00 10.00 30.30 70.33 112.40 101.28 0.9329 <0.05
Table 9: Rela3onship between Fluoride Concentra3on and Periosteal Ossifica3onTable 9: Rela3onship between Fluoride Concentra3on and Periosteal Ossifica3onTable 9: Rela3onship between Fluoride Concentra3on and Periosteal Ossifica3onTable 9: Rela3onship between Fluoride Concentra3on and Periosteal Ossifica3onTable 9: Rela3onship between Fluoride Concentra3on and Periosteal Ossifica3onTable 9: Rela3onship between Fluoride Concentra3on and Periosteal Ossifica3onTable 9: Rela3onship between Fluoride Concentra3on and Periosteal Ossifica3onTable 9: Rela3onship between Fluoride Concentra3on and Periosteal Ossifica3onTable 9: Rela3onship between Fluoride Concentra3on and Periosteal Ossifica3onTable 9: Rela3onship between Fluoride Concentra3on and Periosteal Ossifica3onTable 9: Rela3onship between Fluoride Concentra3on and Periosteal Ossifica3on
Fluoride Concentra3on
(mg/L)1+ 11+ 21+ 31+ 41+ 51+ 61-‐83
TotalsTotalsTotalsFluoride
Concentra3on (mg/L)
1+ 11+ 21+ 31+ 41+ 51+ 61-‐83 Number of
SubjectsAfflicted %
0.24 0 0 0 0 0 0 37.50 88 4 4.55
0.80 0 0 0 0 22.22 20.00 33.33 68 6 8.82
1.00 0 0 0 0 27.27 0 30.00 86 7 8.14
1.80 0 0 0 16.67 14.29 16.67 33.33 58 4 6.90
3.12 0 0 0 10.00 50.00 50.00 71.42 84 15 17.86
4.10 0 0 0 40.00 50.00 28.57 100.00 82 21 25.61
5.60 0 0 0 50.00 75.00 33.33 100.00 73 19 26.03
10.27 0 0 0 70.00 100.00 100.00 100.00 78 33 42.30
10.81 0 6.66 33.33 80.00 100.00 100.00 100.00 73 35 47.95
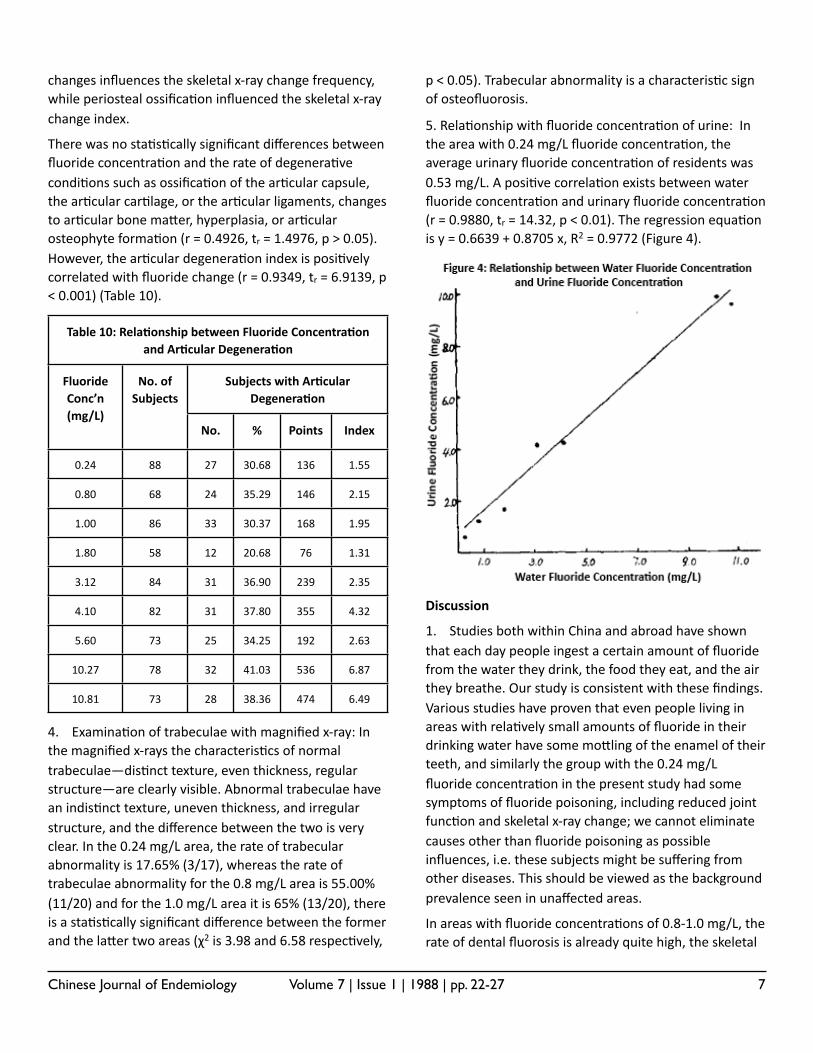
Chinese Journal of Endemiology Volume 7 | Issue 1 | 1988 | pp. 22-27 7
changes influences the skeletal x-‐ray change frequency, while periosteal ossifica;on influenced the skeletal x-‐ray change index.
There was no sta;s;cally significant differences between fluoride concentra;on and the rate of degenera;ve condi;ons such as ossifica;on of the ar;cular capsule, the ar;cular car;lage, or the ar;cular ligaments, changes to ar;cular bone maXer, hyperplasia, or ar;cular osteophyte forma;on (r = 0.4926, tr = 1.4976, p > 0.05). However, the ar;cular degenera;on index is posi;vely correlated with fluoride change (r = 0.9349, tr = 6.9139, p < 0.001) (Table 10).
Table 10: Rela3onship between Fluoride Concentra3on and Ar3cular Degenera3on
Table 10: Rela3onship between Fluoride Concentra3on and Ar3cular Degenera3on
Table 10: Rela3onship between Fluoride Concentra3on and Ar3cular Degenera3on
Table 10: Rela3onship between Fluoride Concentra3on and Ar3cular Degenera3on
Table 10: Rela3onship between Fluoride Concentra3on and Ar3cular Degenera3on
Table 10: Rela3onship between Fluoride Concentra3on and Ar3cular Degenera3on
Fluoride Conc’n (mg/L)
No. of Subjects
Subjects with Ar3cular Degenera3on
Subjects with Ar3cular Degenera3on
Subjects with Ar3cular Degenera3on
Subjects with Ar3cular Degenera3on
Fluoride Conc’n (mg/L)
No. of Subjects
No. % Points Index
0.24 88 27 30.68 136 1.55
0.80 68 24 35.29 146 2.15
1.00 86 33 30.37 168 1.95
1.80 58 12 20.68 76 1.31
3.12 84 31 36.90 239 2.35
4.10 82 31 37.80 355 4.32
5.60 73 25 34.25 192 2.63
10.27 78 32 41.03 536 6.87
10.81 73 28 38.36 474 6.49
4. Examina;on of trabeculae with magnified x-‐ray: In the magnified x-‐rays the characteris;cs of normal trabeculae—dis;nct texture, even thickness, regular structure—are clearly visible. Abnormal trabeculae have an indis;nct texture, uneven thickness, and irregular structure, and the difference between the two is very clear. In the 0.24 mg/L area, the rate of trabecular abnormality is 17.65% (3/17), whereas the rate of trabeculae abnormality for the 0.8 mg/L area is 55.00% (11/20) and for the 1.0 mg/L area it is 65% (13/20), there is a sta;s;cally significant difference between the former and the laXer two areas (χ2 is 3.98 and 6.58 respec;vely,
p < 0.05). Trabecular abnormality is a characteris;c sign of osteofluorosis.
5. Rela;onship with fluoride concentra;on of urine: In the area with 0.24 mg/L fluoride concentra;on, the average urinary fluoride concentra;on of residents was 0.53 mg/L. A posi;ve correla;on exists between water fluoride concentra;on and urinary fluoride concentra;on (r = 0.9880, tr = 14.32, p < 0.01). The regression equa;on is y = 0.6639 + 0.8705 x, R2 = 0.9772 (Figure 4).
Discussion
1. Studies both within China and abroad have shown that each day people ingest a certain amount of fluoride from the water they drink, the food they eat, and the air they breathe. Our study is consistent with these findings. Various studies have proven that even people living in areas with rela;vely small amounts of fluoride in their drinking water have some moXling of the enamel of their teeth, and similarly the group with the 0.24 mg/L fluoride concentra;on in the present study had some symptoms of fluoride poisoning, including reduced joint func;on and skeletal x-‐ray change; we cannot eliminate causes other than fluoride poisoning as possible influences, i.e. these subjects might be suffering from other diseases. This should be viewed as the background prevalence seen in unaffected areas.
In areas with fluoride concentra;ons of 0.8-‐1.0 mg/L, the rate of dental fluorosis is already quite high, the skeletal
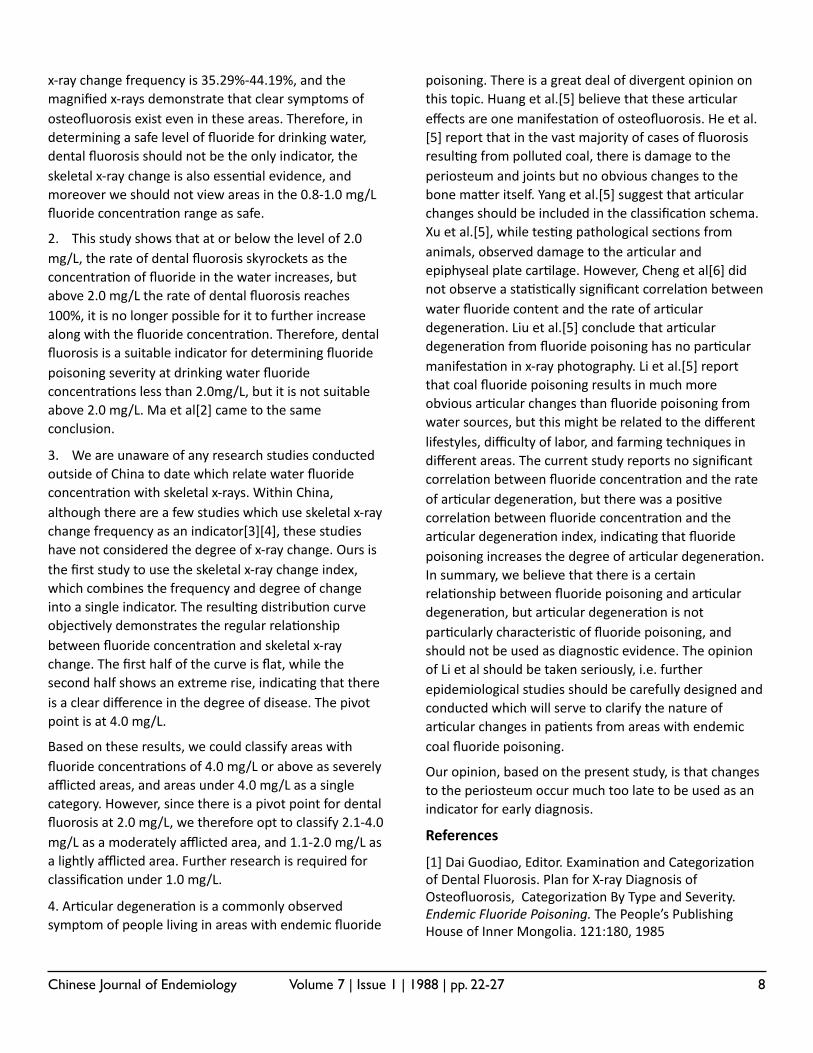
Chinese Journal of Endemiology Volume 7 | Issue 1 | 1988 | pp. 22-27 8
x-‐ray change frequency is 35.29%-‐44.19%, and the magnified x-‐rays demonstrate that clear symptoms of osteofluorosis exist even in these areas. Therefore, in determining a safe level of fluoride for drinking water, dental fluorosis should not be the only indicator, the skeletal x-‐ray change is also essen;al evidence, and moreover we should not view areas in the 0.8-‐1.0 mg/L fluoride concentra;on range as safe.
2. This study shows that at or below the level of 2.0 mg/L, the rate of dental fluorosis skyrockets as the concentra;on of fluoride in the water increases, but above 2.0 mg/L the rate of dental fluorosis reaches 100%, it is no longer possible for it to further increase along with the fluoride concentra;on. Therefore, dental fluorosis is a suitable indicator for determining fluoride poisoning severity at drinking water fluoride concentra;ons less than 2.0mg/L, but it is not suitable above 2.0 mg/L. Ma et al[2] came to the same conclusion.
3. We are unaware of any research studies conducted outside of China to date which relate water fluoride concentra;on with skeletal x-‐rays. Within China, although there are a few studies which use skeletal x-‐ray change frequency as an indicator[3][4], these studies have not considered the degree of x-‐ray change. Ours is the first study to use the skeletal x-‐ray change index, which combines the frequency and degree of change into a single indicator. The resul;ng distribu;on curve objec;vely demonstrates the regular rela;onship between fluoride concentra;on and skeletal x-‐ray change. The first half of the curve is flat, while the second half shows an extreme rise, indica;ng that there is a clear difference in the degree of disease. The pivot point is at 4.0 mg/L.
Based on these results, we could classify areas with fluoride concentra;ons of 4.0 mg/L or above as severely afflicted areas, and areas under 4.0 mg/L as a single category. However, since there is a pivot point for dental fluorosis at 2.0 mg/L, we therefore opt to classify 2.1-‐4.0 mg/L as a moderately afflicted area, and 1.1-‐2.0 mg/L as a lightly afflicted area. Further research is required for classifica;on under 1.0 mg/L.
4. Ar;cular degenera;on is a commonly observed symptom of people living in areas with endemic fluoride
poisoning. There is a great deal of divergent opinion on this topic. Huang et al.[5] believe that these ar;cular effects are one manifesta;on of osteofluorosis. He et al.[5] report that in the vast majority of cases of fluorosis resul;ng from polluted coal, there is damage to the periosteum and joints but no obvious changes to the bone maXer itself. Yang et al.[5] suggest that ar;cular changes should be included in the classifica;on schema. Xu et al.[5], while tes;ng pathological sec;ons from animals, observed damage to the ar;cular and epiphyseal plate car;lage. However, Cheng et al[6] did not observe a sta;s;cally significant correla;on between water fluoride content and the rate of ar;cular degenera;on. Liu et al.[5] conclude that ar;cular degenera;on from fluoride poisoning has no par;cular manifesta;on in x-‐ray photography. Li et al.[5] report that coal fluoride poisoning results in much more obvious ar;cular changes than fluoride poisoning from water sources, but this might be related to the different lifestyles, difficulty of labor, and farming techniques in different areas. The current study reports no significant correla;on between fluoride concentra;on and the rate of ar;cular degenera;on, but there was a posi;ve correla;on between fluoride concentra;on and the ar;cular degenera;on index, indica;ng that fluoride poisoning increases the degree of ar;cular degenera;on. In summary, we believe that there is a certain rela;onship between fluoride poisoning and ar;cular degenera;on, but ar;cular degenera;on is not par;cularly characteris;c of fluoride poisoning, and should not be used as diagnos;c evidence. The opinion of Li et al should be taken seriously, i.e. further epidemiological studies should be carefully designed and conducted which will serve to clarify the nature of ar;cular changes in pa;ents from areas with endemic coal fluoride poisoning.
Our opinion, based on the present study, is that changes to the periosteum occur much too late to be used as an indicator for early diagnosis.
References
[1] Dai Guodiao, Editor. Examina;on and Categoriza;on of Dental Fluorosis. Plan for X-‐ray Diagnosis of Osteofluorosis, Categoriza;on By Type and Severity. Endemic Fluoride Poisoning. The People’s Publishing House of Inner Mongolia. 121:180, 1985
Chinese Journal of Endemiology Volume 7 | Issue 1 | 1988 | pp. 22-27 9
[2] Ma Chunlin et al. Using Regression Analysis to Determine the Safe Fluoride Content of Drinking Water. Chinese Journal of Health Sta:s:cs. 4 (1): 17, 1987.
[3] Shandong Coordina;on Group for the Inves;ga;on of Endemic Fluoride Poisoning Epidemiology. Inves;ga;on and Analysis of Endemic Fluoride Poisoning Epidemiology in Regions of Shandong Province. Chinese Journal of Preventa:ve Medicine. 16 (6): 359, 1982.
[4] Liu ChangHan et al. Epidemiology Research on Endemic Fluoride Poisoning in Heilongjiang Province. Chinese Journal of Epidemiology. 3 (3) : 187, 1984.
[5] Special Endemic Disease Topics of the Endemic Disease CommiXee: X-‐ray Diagnosis Sec;on. In Abstracts of the Second Na:onal Conference on Endemic Fluoride Poisoning. Jilin. 94, 81, 88, 111, 80, 113, 1985.
[6] Cheng Jinshan et al. Quan;ta;ve Research on the Distribu;on of Characteris;c X-‐ray Signs of Osteofluorosis in the Residents of the Menghe River Valley in Zhaowudameng. X-‐ray Diagnosis of Osteofluorosis Collec:on. Na;onal Research Coordina;on Group for X-‐ray Diagnosis of Osteofluorosis. Beijing 181, 1984.
Received on: September 19, 1996.
Edited on: October 9, 1996.Also par;cipa;ng in this research: Ma Wenzhi, Wang Xitong, Wang Jialu, Ma Chunlin, Cheng Jinshan, Ji Chunyin, Tan Rongguang, Zhang Xinxi, Chen Hailiang Li Yongqiang, Liu Zhaizhong, Su Guangming, Lu Haiping, Wang Zeng, Qiao Zunyi.
Translated from Chinese into English by Julian Brooke, courtesy of the Fluoride Ac:on Network (2012). For more transla:ons of Chinese research on fluoride toxicity, see www.fluoridealert.org/researchers/transla:ons/
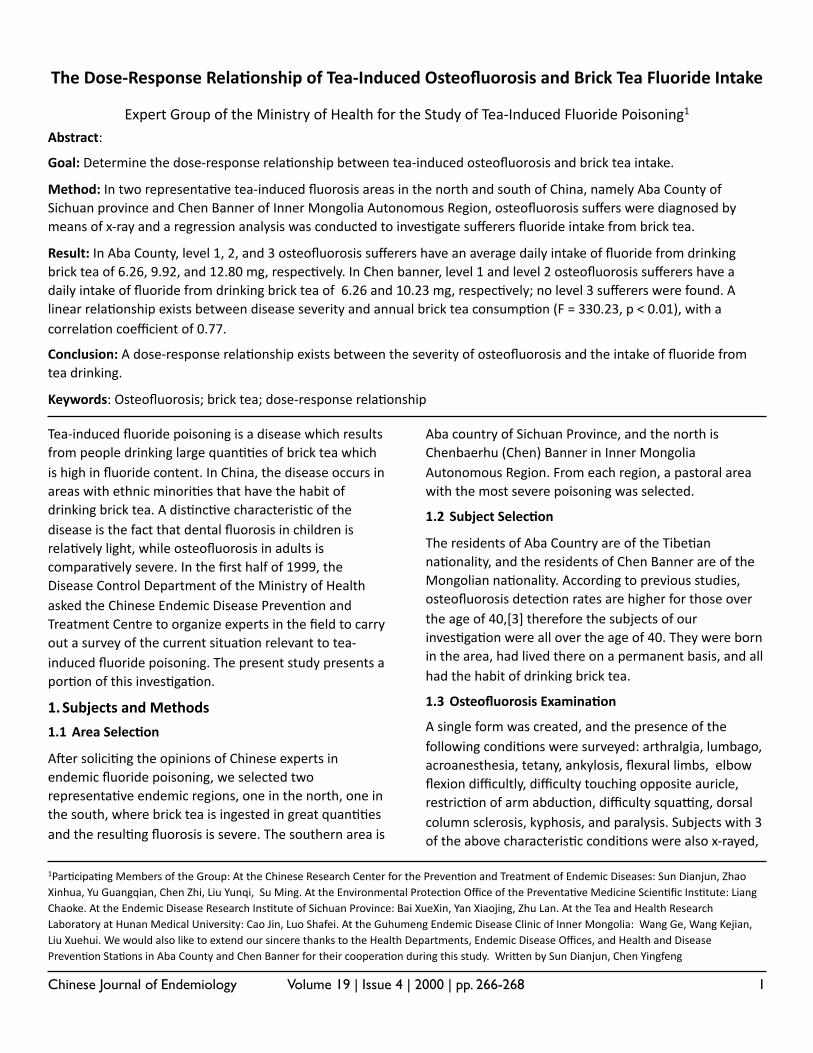
Chinese Journal of Endemiology Volume 19 | Issue 4 | 2000 | pp. 266-268 1
The Dose-‐Response Rela.onship of Tea-‐Induced Osteofluorosis and Brick Tea Fluoride Intake
Expert Group of the Ministry of Health for the Study of Tea-‐Induced Fluoride Poisoning1
Abstract:
Goal: Determine the dose-‐response rela3onship between tea-‐induced osteofluorosis and brick tea intake.
Method: In two representa3ve tea-‐induced fluorosis areas in the north and south of China, namely Aba County of Sichuan province and Chen Banner of Inner Mongolia Autonomous Region, osteofluorosis suffers were diagnosed by means of x-‐ray and a regression analysis was conducted to inves3gate sufferers fluoride intake from brick tea.
Result: In Aba County, level 1, 2, and 3 osteofluorosis sufferers have an average daily intake of fluoride from drinking brick tea of 6.26, 9.92, and 12.80 mg, respec3vely. In Chen banner, level 1 and level 2 osteofluorosis sufferers have a daily intake of fluoride from drinking brick tea of 6.26 and 10.23 mg, respec3vely; no level 3 sufferers were found. A linear rela3onship exists between disease severity and annual brick tea consump3on (F = 330.23, p < 0.01), with a correla3on coefficient of 0.77.
Conclusion: A dose-‐response rela3onship exists between the severity of osteofluorosis and the intake of fluoride from tea drinking.
Keywords: Osteofluorosis; brick tea; dose-‐response rela3onship
Tea-‐induced fluoride poisoning is a disease which results from people drinking large quan33es of brick tea which is high in fluoride content. In China, the disease occurs in areas with ethnic minori3es that have the habit of drinking brick tea. A dis3nc3ve characteris3c of the disease is the fact that dental fluorosis in children is rela3vely light, while osteofluorosis in adults is compara3vely severe. In the first half of 1999, the Disease Control Department of the Ministry of Health asked the Chinese Endemic Disease Preven3on and Treatment Centre to organize experts in the field to carry out a survey of the current situa3on relevant to tea-‐induced fluoride poisoning. The present study presents a por3on of this inves3ga3on.
1.Subjects and Methods
1.1 Area Selec<on
A_er solici3ng the opinions of Chinese experts in endemic fluoride poisoning, we selected two representa3ve endemic regions, one in the north, one in the south, where brick tea is ingested in great quan33es and the resul3ng fluorosis is severe. The southern area is
Aba country of Sichuan Province, and the north is Chenbaerhu (Chen) Banner in Inner Mongolia Autonomous Region. From each region, a pastoral area with the most severe poisoning was selected.
1.2 Subject Selec<on
The residents of Aba Country are of the Tibe3an na3onality, and the residents of Chen Banner are of the Mongolian na3onality. According to previous studies, osteofluorosis detec3on rates are higher for those over the age of 40,[3] therefore the subjects of our inves3ga3on were all over the age of 40. They were born in the area, had lived there on a permanent basis, and all had the habit of drinking brick tea.
1.3 Osteofluorosis Examina<on
A single form was created, and the presence of the following condi3ons were surveyed: arthralgia, lumbago, acroanesthesia, tetany, ankylosis, flexural limbs, elbow flexion difficultly, difficulty touching opposite auricle, restric3on of arm abduc3on, difficulty squadng, dorsal column sclerosis, kyphosis, and paralysis. Subjects with 3 of the above characteris3c condi3ons were also x-‐rayed,
1Par3cipa3ng Members of the Group: At the Chinese Research Center for the Preven3on and Treatment of Endemic Diseases: Sun Dianjun, Zhao Xinhua, Yu Guangqian, Chen Zhi, Liu Yunqi, Su Ming. At the Environmental Protec3on Office of the Preventa3ve Medicine Scien3fic Ins3tute: Liang Chaoke. At the Endemic Disease Research Ins3tute of Sichuan Province: Bai XueXin, Yan Xiaojing, Zhu Lan. At the Tea and Health Research Laboratory at Hunan Medical University: Cao Jin, Luo Shafei. At the Guhumeng Endemic Disease Clinic of Inner Mongolia: Wang Ge, Wang Kejian, Liu Xuehui. We would also like to extend our sincere thanks to the Health Departments, Endemic Disease Offices, and Health and Disease Preven3on Sta3ons in Aba County and Chen Banner for their coopera3on during this study. Wrinen by Sun Dianjun, Chen Yingfeng
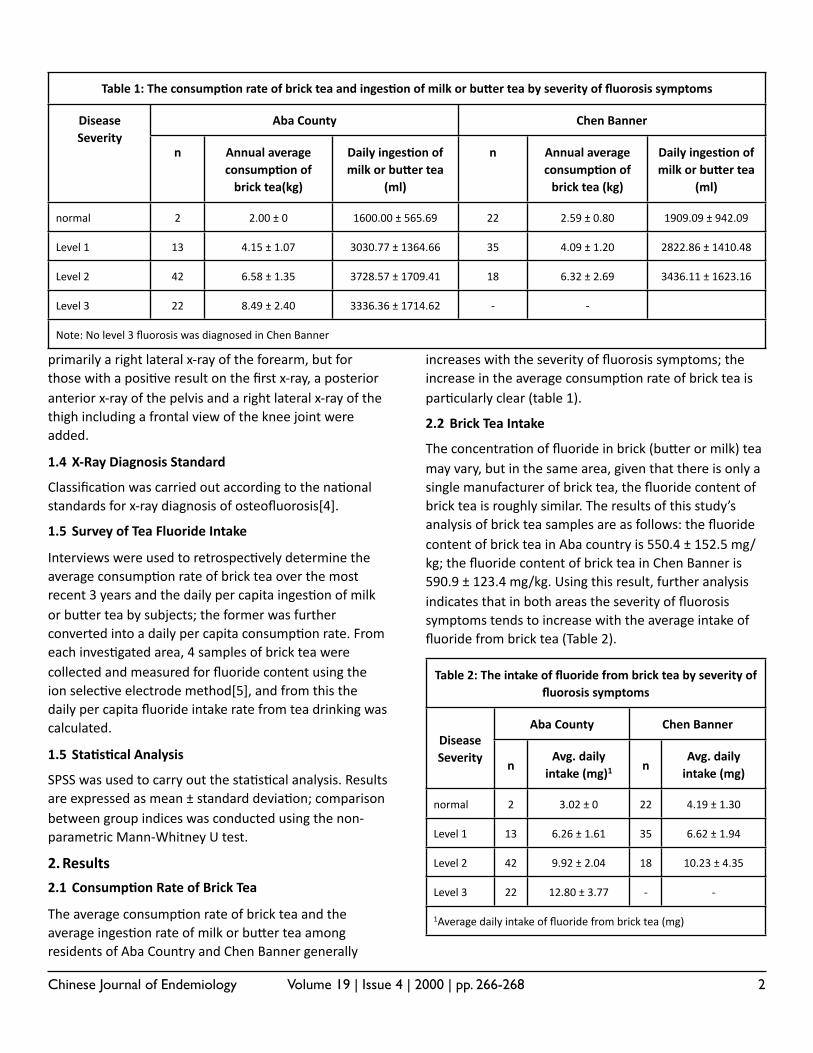
Chinese Journal of Endemiology Volume 19 | Issue 4 | 2000 | pp. 266-268 2
primarily a right lateral x-‐ray of the forearm, but for those with a posi3ve result on the first x-‐ray, a posterior anterior x-‐ray of the pelvis and a right lateral x-‐ray of the thigh including a frontal view of the knee joint were added.
1.4 X-‐Ray Diagnosis Standard
Classifica3on was carried out according to the na3onal standards for x-‐ray diagnosis of osteofluorosis[4].
1.5 Survey of Tea Fluoride Intake
Interviews were used to retrospec3vely determine the average consump3on rate of brick tea over the most recent 3 years and the daily per capita inges3on of milk or buner tea by subjects; the former was further converted into a daily per capita consump3on rate. From each inves3gated area, 4 samples of brick tea were collected and measured for fluoride content using the ion selec3ve electrode method[5], and from this the daily per capita fluoride intake rate from tea drinking was calculated.
1.5 Sta<s<cal Analysis
SPSS was used to carry out the sta3s3cal analysis. Results are expressed as mean ± standard devia3on; comparison between group indices was conducted using the non-‐parametric Mann-‐Whitney U test.
2.Results
2.1 Consump<on Rate of Brick Tea
The average consump3on rate of brick tea and the average inges3on rate of milk or buner tea among residents of Aba Country and Chen Banner generally
increases with the severity of fluorosis symptoms; the increase in the average consump3on rate of brick tea is par3cularly clear (table 1).
2.2 Brick Tea Intake
The concentra3on of fluoride in brick (buner or milk) tea may vary, but in the same area, given that there is only a single manufacturer of brick tea, the fluoride content of brick tea is roughly similar. The results of this study’s analysis of brick tea samples are as follows: the fluoride content of brick tea in Aba country is 550.4 ± 152.5 mg/kg; the fluoride content of brick tea in Chen Banner is 590.9 ± 123.4 mg/kg. Using this result, further analysis indicates that in both areas the severity of fluorosis symptoms tends to increase with the average intake of fluoride from brick tea (Table 2).
Table 2: The intake of fluoride from brick tea by severity of fluorosis symptoms
Table 2: The intake of fluoride from brick tea by severity of fluorosis symptoms
Table 2: The intake of fluoride from brick tea by severity of fluorosis symptoms
Table 2: The intake of fluoride from brick tea by severity of fluorosis symptoms
Table 2: The intake of fluoride from brick tea by severity of fluorosis symptoms
Disease Severity
Aba CountyAba County Chen BannerChen BannerDisease Severity
nAvg. daily
intake (mg)1n
Avg. daily intake (mg)
normal 2 3.02 ± 0 22 4.19 ± 1.30
Level 1 13 6.26 ± 1.61 35 6.62 ± 1.94
Level 2 42 9.92 ± 2.04 18 10.23 ± 4.35
Level 3 22 12.80 ± 3.77 -‐ -‐
1Average daily intake of fluoride from brick tea (mg)1Average daily intake of fluoride from brick tea (mg)1Average daily intake of fluoride from brick tea (mg)1Average daily intake of fluoride from brick tea (mg)1Average daily intake of fluoride from brick tea (mg)
Table 1: The consump<on rate of brick tea and inges<on of milk or buUer tea by severity of fluorosis symptomsTable 1: The consump<on rate of brick tea and inges<on of milk or buUer tea by severity of fluorosis symptomsTable 1: The consump<on rate of brick tea and inges<on of milk or buUer tea by severity of fluorosis symptomsTable 1: The consump<on rate of brick tea and inges<on of milk or buUer tea by severity of fluorosis symptomsTable 1: The consump<on rate of brick tea and inges<on of milk or buUer tea by severity of fluorosis symptomsTable 1: The consump<on rate of brick tea and inges<on of milk or buUer tea by severity of fluorosis symptomsTable 1: The consump<on rate of brick tea and inges<on of milk or buUer tea by severity of fluorosis symptoms
Disease Severity
Aba CountyAba CountyAba County Chen BannerChen BannerChen BannerDisease Severity
n Annual average consump<on of brick tea(kg)
Daily inges<on of milk or buUer tea
(ml)
n Annual average consump<on of brick tea (kg)
Daily inges<on of milk or buUer tea
(ml)
normal 2 2.00 ± 0 1600.00 ± 565.69 22 2.59 ± 0.80 1909.09 ± 942.09
Level 1 13 4.15 ± 1.07 3030.77 ± 1364.66 35 4.09 ± 1.20 2822.86 ± 1410.48
Level 2 42 6.58 ± 1.35 3728.57 ± 1709.41 18 6.32 ± 2.69 3436.11 ± 1623.16
Level 3 22 8.49 ± 2.40 3336.36 ± 1714.62 -‐ -‐
Note: No level 3 fluorosis was diagnosed in Chen BannerNote: No level 3 fluorosis was diagnosed in Chen BannerNote: No level 3 fluorosis was diagnosed in Chen BannerNote: No level 3 fluorosis was diagnosed in Chen BannerNote: No level 3 fluorosis was diagnosed in Chen BannerNote: No level 3 fluorosis was diagnosed in Chen BannerNote: No level 3 fluorosis was diagnosed in Chen Banner
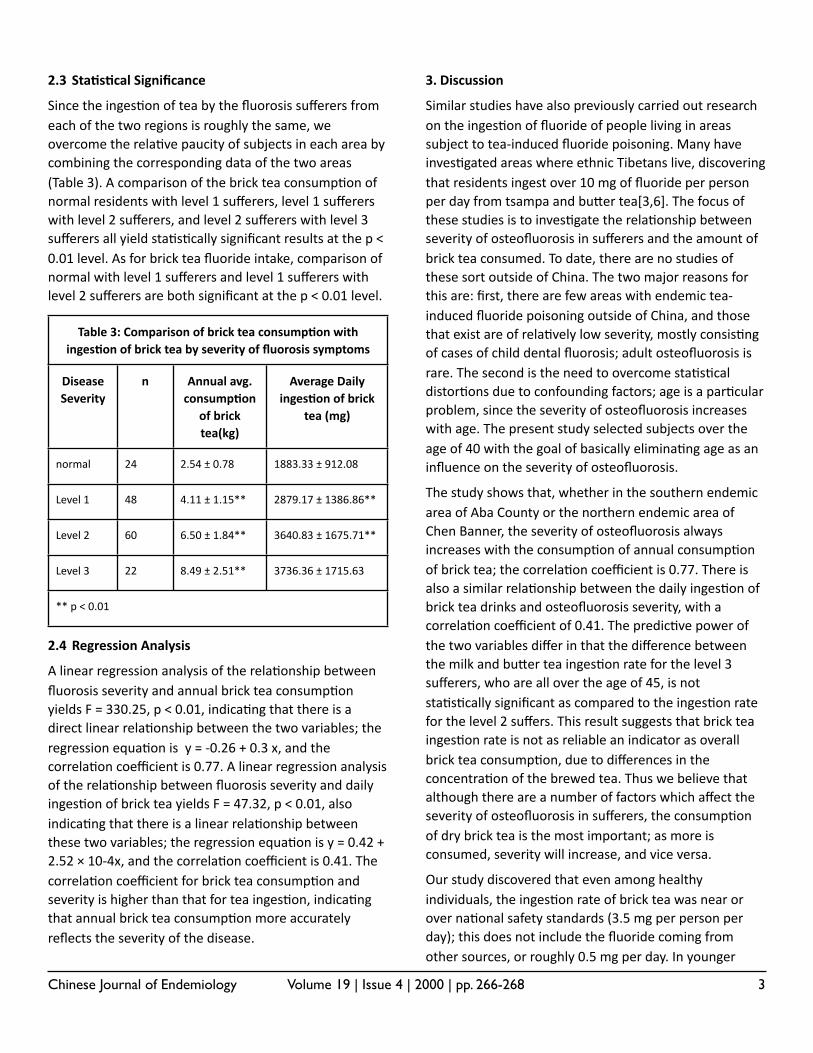
Chinese Journal of Endemiology Volume 19 | Issue 4 | 2000 | pp. 266-268 3
2.3 Sta<s<cal Significance
Since the inges3on of tea by the fluorosis sufferers from each of the two regions is roughly the same, we overcome the rela3ve paucity of subjects in each area by combining the corresponding data of the two areas (Table 3). A comparison of the brick tea consump3on of normal residents with level 1 sufferers, level 1 sufferers with level 2 sufferers, and level 2 sufferers with level 3 sufferers all yield sta3s3cally significant results at the p < 0.01 level. As for brick tea fluoride intake, comparison of normal with level 1 sufferers and level 1 sufferers with level 2 sufferers are both significant at the p < 0.01 level.
Table 3: Comparison of brick tea consump<on with inges<on of brick tea by severity of fluorosis symptomsTable 3: Comparison of brick tea consump<on with
inges<on of brick tea by severity of fluorosis symptomsTable 3: Comparison of brick tea consump<on with
inges<on of brick tea by severity of fluorosis symptomsTable 3: Comparison of brick tea consump<on with
inges<on of brick tea by severity of fluorosis symptoms
Disease Severity
n Annual avg. consump<on
of brick tea(kg)
Average Daily inges<on of brick
tea (mg)
normal 24 2.54 ± 0.78 1883.33 ± 912.08
Level 1 48 4.11 ± 1.15** 2879.17 ± 1386.86**
Level 2 60 6.50 ± 1.84** 3640.83 ± 1675.71**
Level 3 22 8.49 ± 2.51** 3736.36 ± 1715.63
** p < 0.01** p < 0.01** p < 0.01** p < 0.01
2.4 Regression Analysis
A linear regression analysis of the rela3onship between fluorosis severity and annual brick tea consump3on yields F = 330.25, p < 0.01, indica3ng that there is a direct linear rela3onship between the two variables; the regression equa3on is y = -‐0.26 + 0.3 x, and the correla3on coefficient is 0.77. A linear regression analysis of the rela3onship between fluorosis severity and daily inges3on of brick tea yields F = 47.32, p < 0.01, also indica3ng that there is a linear rela3onship between these two variables; the regression equa3on is y = 0.42 + 2.52 × 10-‐4x, and the correla3on coefficient is 0.41. The correla3on coefficient for brick tea consump3on and severity is higher than that for tea inges3on, indica3ng that annual brick tea consump3on more accurately reflects the severity of the disease.
3. Discussion
Similar studies have also previously carried out research on the inges3on of fluoride of people living in areas subject to tea-‐induced fluoride poisoning. Many have inves3gated areas where ethnic Tibetans live, discovering that residents ingest over 10 mg of fluoride per person per day from tsampa and buner tea[3,6]. The focus of these studies is to inves3gate the rela3onship between severity of osteofluorosis in sufferers and the amount of brick tea consumed. To date, there are no studies of these sort outside of China. The two major reasons for this are: first, there are few areas with endemic tea-‐induced fluoride poisoning outside of China, and those that exist are of rela3vely low severity, mostly consis3ng of cases of child dental fluorosis; adult osteofluorosis is rare. The second is the need to overcome sta3s3cal distor3ons due to confounding factors; age is a par3cular problem, since the severity of osteofluorosis increases with age. The present study selected subjects over the age of 40 with the goal of basically elimina3ng age as an influence on the severity of osteofluorosis.
The study shows that, whether in the southern endemic area of Aba County or the northern endemic area of Chen Banner, the severity of osteofluorosis always increases with the consump3on of annual consump3on of brick tea; the correla3on coefficient is 0.77. There is also a similar rela3onship between the daily inges3on of brick tea drinks and osteofluorosis severity, with a correla3on coefficient of 0.41. The predic3ve power of the two variables differ in that the difference between the milk and buner tea inges3on rate for the level 3 sufferers, who are all over the age of 45, is not sta3s3cally significant as compared to the inges3on rate for the level 2 suffers. This result suggests that brick tea inges3on rate is not as reliable an indicator as overall brick tea consump3on, due to differences in the concentra3on of the brewed tea. Thus we believe that although there are a number of factors which affect the severity of osteofluorosis in sufferers, the consump3on of dry brick tea is the most important; as more is consumed, severity will increase, and vice versa.
Our study discovered that even among healthy individuals, the inges3on rate of brick tea was near or over na3onal safety standards (3.5 mg per person per day); this does not include the fluoride coming from other sources, or roughly 0.5 mg per day. In younger
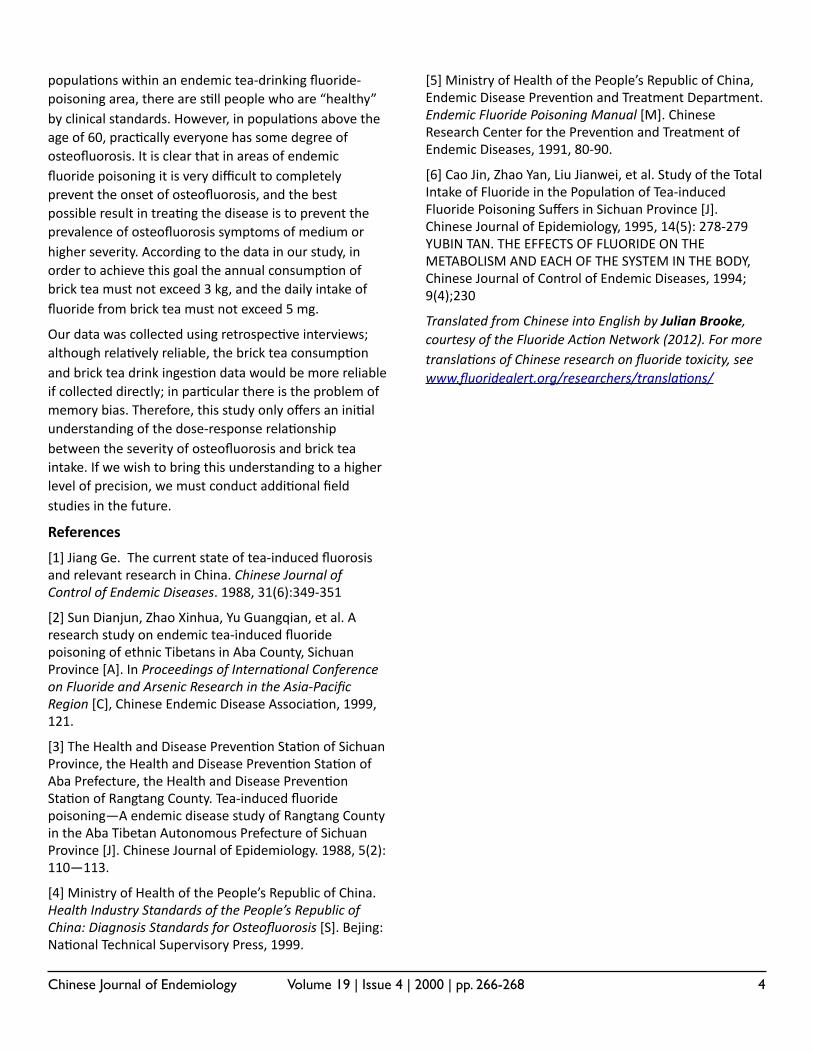
Chinese Journal of Endemiology Volume 19 | Issue 4 | 2000 | pp. 266-268 4
popula3ons within an endemic tea-‐drinking fluoride-‐poisoning area, there are s3ll people who are “healthy” by clinical standards. However, in popula3ons above the age of 60, prac3cally everyone has some degree of osteofluorosis. It is clear that in areas of endemic fluoride poisoning it is very difficult to completely prevent the onset of osteofluorosis, and the best possible result in trea3ng the disease is to prevent the prevalence of osteofluorosis symptoms of medium or higher severity. According to the data in our study, in order to achieve this goal the annual consump3on of brick tea must not exceed 3 kg, and the daily intake of fluoride from brick tea must not exceed 5 mg.
Our data was collected using retrospec3ve interviews; although rela3vely reliable, the brick tea consump3on and brick tea drink inges3on data would be more reliable if collected directly; in par3cular there is the problem of memory bias. Therefore, this study only offers an ini3al understanding of the dose-‐response rela3onship between the severity of osteofluorosis and brick tea intake. If we wish to bring this understanding to a higher level of precision, we must conduct addi3onal field studies in the future.
References
[1] Jiang Ge. The current state of tea-‐induced fluorosis and relevant research in China. Chinese Journal of Control of Endemic Diseases. 1988, 31(6):349-‐351
[2] Sun Dianjun, Zhao Xinhua, Yu Guangqian, et al. A research study on endemic tea-‐induced fluoride poisoning of ethnic Tibetans in Aba County, Sichuan Province [A]. In Proceedings of Interna8onal Conference on Fluoride and Arsenic Research in the Asia-‐Pacific Region [C], Chinese Endemic Disease Associa3on, 1999, 121.
[3] The Health and Disease Preven3on Sta3on of Sichuan Province, the Health and Disease Preven3on Sta3on of Aba Prefecture, the Health and Disease Preven3on Sta3on of Rangtang County. Tea-‐induced fluoride poisoning—A endemic disease study of Rangtang County in the Aba Tibetan Autonomous Prefecture of Sichuan Province [J]. Chinese Journal of Epidemiology. 1988, 5(2):110—113.
[4] Ministry of Health of the People’s Republic of China. Health Industry Standards of the People’s Republic of China: Diagnosis Standards for Osteofluorosis [S]. Bejing: Na3onal Technical Supervisory Press, 1999.
[5] Ministry of Health of the People’s Republic of China, Endemic Disease Preven3on and Treatment Department. Endemic Fluoride Poisoning Manual [M]. Chinese Research Center for the Preven3on and Treatment of Endemic Diseases, 1991, 80-‐90.
[6] Cao Jin, Zhao Yan, Liu Jianwei, et al. Study of the Total Intake of Fluoride in the Popula3on of Tea-‐induced Fluoride Poisoning Suffers in Sichuan Province [J]. Chinese Journal of Epidemiology, 1995, 14(5): 278-‐279 YUBIN TAN. THE EFFECTS OF FLUORIDE ON THE METABOLISM AND EACH OF THE SYSTEM IN THE BODY, Chinese Journal of Control of Endemic Diseases, 1994; 9(4);230
Translated from Chinese into English by Julian Brooke, courtesy of the Fluoride Ac8on Network (2012). For more transla8ons of Chinese research on fluoride toxicity, see www.fluoridealert.org/researchers/transla8ons/
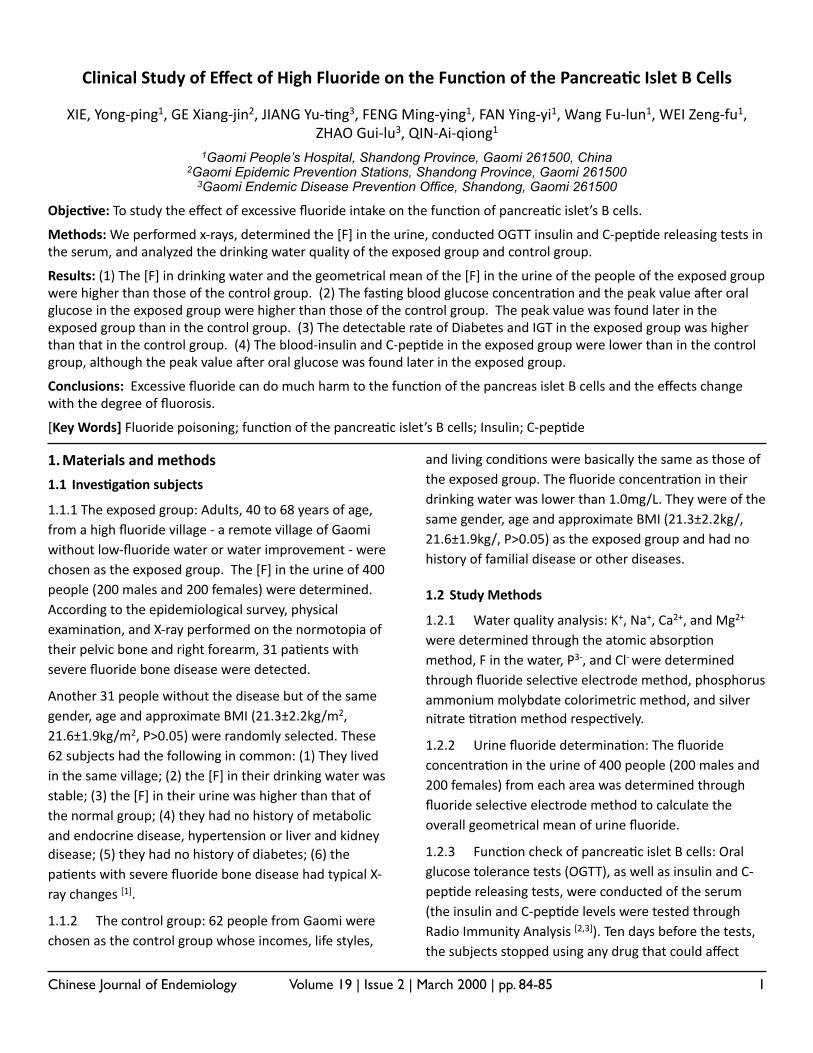
Chinese Journal of Endemiology Volume 19 | Issue 2 | March 2000 | pp. 84-85 1
Clinical Study of Effect of High Fluoride on the Func7on of the Pancrea7c Islet B Cells
XIE, Yong-‐ping1, GE Xiang-‐jin2, JIANG Yu-‐4ng3, FENG Ming-‐ying1, FAN Ying-‐yi1, Wang Fu-‐lun1, WEI Zeng-‐fu1, ZHAO Gui-‐lu3, QIN-‐Ai-‐qiong1
1Gaomi People’s Hospital, Shandong Province, Gaomi 261500, China2Gaomi Epidemic Prevention Stations, Shandong Province, Gaomi 261500
3Gaomi Endemic Disease Prevention Office, Shandong, Gaomi 261500
Objec&ve: To study the effect of excessive fluoride intake on the func9on of pancrea9c islet’s B cells.
Methods: We performed x-‐rays, determined the [F] in the urine, conducted OGTT insulin and C-‐pep9de releasing tests in the serum, and analyzed the drinking water quality of the exposed group and control group.
Results: (1) The [F] in drinking water and the geometrical mean of the [F] in the urine of the people of the exposed group were higher than those of the control group. (2) The fas9ng blood glucose concentra9on and the peak value aPer oral glucose in the exposed group were higher than those of the control group. The peak value was found later in the exposed group than in the control group. (3) The detectable rate of Diabetes and IGT in the exposed group was higher than that in the control group. (4) The blood-‐insulin and C-‐pep9de in the exposed group were lower than in the control group, although the peak value aPer oral glucose was found later in the exposed group.
Conclusions: Excessive fluoride can do much harm to the func9on of the pancreas islet B cells and the effects change with the degree of fluorosis.
[Key Words] Fluoride poisoning; func9on of the pancrea9c islet’s B cells; Insulin; C-‐pep9de
1.Materials and methods
1.1 Inves&ga&on subjects
1.1.1 The exposed group: Adults, 40 to 68 years of age, from a high fluoride village -‐ a remote village of Gaomi without low-‐fluoride water or water improvement -‐ were chosen as the exposed group. The [F] in the urine of 400 people (200 males and 200 females) were determined. According to the epidemiological survey, physical examina9on, and X-‐ray performed on the normotopia of their pelvic bone and right forearm, 31 pa9ents with severe fluoride bone disease were detected.
Another 31 people without the disease but of the same gender, age and approximate BMI (21.3±2.2kg/m2, 21.6±1.9kg/m2, P>0.05) were randomly selected. These 62 subjects had the following in common: (1) They lived in the same village; (2) the [F] in their drinking water was stable; (3) the [F] in their urine was higher than that of the normal group; (4) they had no history of metabolic and endocrine disease, hypertension or liver and kidney disease; (5) they had no history of diabetes; (6) the pa9ents with severe fluoride bone disease had typical X-‐ray changes [1].
1.1.2 The control group: 62 people from Gaomi were chosen as the control group whose incomes, life styles,
and living condi9ons were basically the same as those of the exposed group. The fluoride concentra9on in their drinking water was lower than 1.0mg/L. They were of the same gender, age and approximate BMI (21.3±2.2kg/, 21.6±1.9kg/, P>0.05) as the exposed group and had no history of familial disease or other diseases.
1.2 Study Methods
1.2.1 Water quality analysis: K+, Na+, Ca2+, and Mg2+ were determined through the atomic absorp9on method, F in the water, P3-‐, and Cl-‐ were determined through fluoride selec9ve electrode method, phosphorus ammonium molybdate colorimetric method, and silver nitrate 9tra9on method respec9vely.
1.2.2 Urine fluoride determina9on: The fluoride concentra9on in the urine of 400 people (200 males and 200 females) from each area was determined through fluoride selec9ve electrode method to calculate the overall geometrical mean of urine fluoride.
1.2.3 Func9on check of pancrea9c islet B cells: Oral glucose tolerance tests (OGTT), as well as insulin and C-‐pep9de releasing tests, were conducted of the serum (the insulin and C-‐pep9de levels were tested through Radio Immunity Analysis [2,3]). Ten days before the tests, the subjects stopped using any drug that could affect
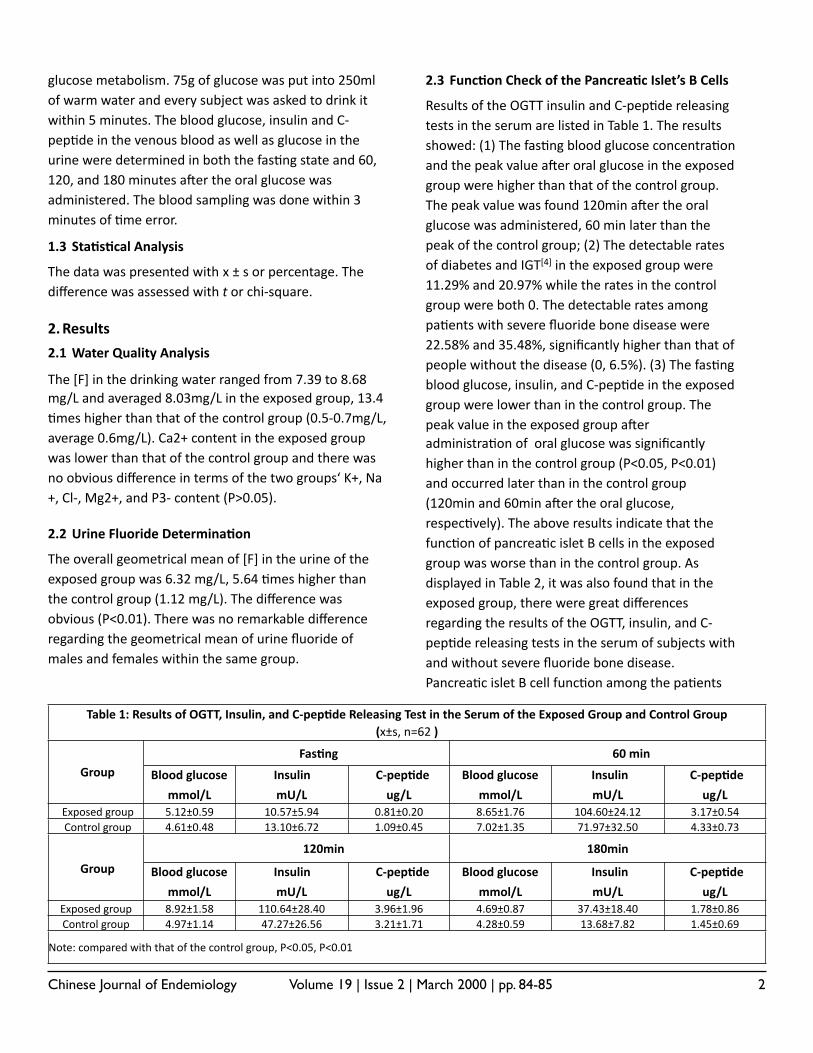
Chinese Journal of Endemiology Volume 19 | Issue 2 | March 2000 | pp. 84-85 2
glucose metabolism. 75g of glucose was put into 250ml of warm water and every subject was asked to drink it within 5 minutes. The blood glucose, insulin and C-‐pep9de in the venous blood as well as glucose in the urine were determined in both the fas9ng state and 60, 120, and 180 minutes aPer the oral glucose was administered. The blood sampling was done within 3 minutes of 9me error.
1.3 Sta&s&cal Analysis
The data was presented with x ± s or percentage. The difference was assessed with t or chi-‐square.
2.Results
2.1 Water Quality Analysis
The [F] in the drinking water ranged from 7.39 to 8.68 mg/L and averaged 8.03mg/L in the exposed group, 13.4 9mes higher than that of the control group (0.5-‐0.7mg/L, average 0.6mg/L). Ca2+ content in the exposed group was lower than that of the control group and there was no obvious difference in terms of the two groups‘ K+, Na+, Cl-‐, Mg2+, and P3-‐ content (P>0.05).
2.2 Urine Fluoride Determina&on
The overall geometrical mean of [F] in the urine of the exposed group was 6.32 mg/L, 5.64 9mes higher than the control group (1.12 mg/L). The difference was obvious (P<0.01). There was no remarkable difference regarding the geometrical mean of urine fluoride of males and females within the same group.
2.3 Func&on Check of the Pancrea&c Islet’s B Cells
Results of the OGTT insulin and C-‐pep9de releasing tests in the serum are listed in Table 1. The results showed: (1) The fas9ng blood glucose concentra9on and the peak value aPer oral glucose in the exposed group were higher than that of the control group. The peak value was found 120min aPer the oral glucose was administered, 60 min later than the peak of the control group; (2) The detectable rates of diabetes and IGT[4] in the exposed group were 11.29% and 20.97% while the rates in the control group were both 0. The detectable rates among pa9ents with severe fluoride bone disease were 22.58% and 35.48%, significantly higher than that of people without the disease (0, 6.5%). (3) The fas9ng blood glucose, insulin, and C-‐pep9de in the exposed group were lower than in the control group. The peak value in the exposed group aPer administra9on of oral glucose was significantly higher than in the control group (P<0.05, P<0.01) and occurred later than in the control group (120min and 60min aPer the oral glucose, respec9vely). The above results indicate that the func9on of pancrea9c islet B cells in the exposed group was worse than in the control group. As displayed in Table 2, it was also found that in the exposed group, there were great differences regarding the results of the OGTT, insulin, and C-‐pep9de releasing tests in the serum of subjects with and without severe fluoride bone disease. Pancrea9c islet B cell func9on among the pa9ents
Table 1: Results of OGTT, Insulin, and C-‐pep&de Releasing Test in the Serum of the Exposed Group and Control Group (x±s, n=62 )
Table 1: Results of OGTT, Insulin, and C-‐pep&de Releasing Test in the Serum of the Exposed Group and Control Group (x±s, n=62 )
Table 1: Results of OGTT, Insulin, and C-‐pep&de Releasing Test in the Serum of the Exposed Group and Control Group (x±s, n=62 )
Table 1: Results of OGTT, Insulin, and C-‐pep&de Releasing Test in the Serum of the Exposed Group and Control Group (x±s, n=62 )
Table 1: Results of OGTT, Insulin, and C-‐pep&de Releasing Test in the Serum of the Exposed Group and Control Group (x±s, n=62 )
Table 1: Results of OGTT, Insulin, and C-‐pep&de Releasing Test in the Serum of the Exposed Group and Control Group (x±s, n=62 )
Table 1: Results of OGTT, Insulin, and C-‐pep&de Releasing Test in the Serum of the Exposed Group and Control Group (x±s, n=62 )
GroupFas&ngFas&ngFas&ng 60 min60 min60 min
Group Blood glucose
mmol/L
Insulin
mU/L
C-‐pep&de
ug/L
Blood glucose
mmol/L
Insulin
mU/L
C-‐pep&de
ug/LExposed group 5.12±0.59 10.57±5.94 0.81±0.20 8.65±1.76 104.60±24.12 3.17±0.54Control group 4.61±0.48 13.10±6.72 1.09±0.45 7.02±1.35 71.97±32.50 4.33±0.73
Group
120min120min120min 180min180min180min
Group Blood glucose
mmol/L
Insulin
mU/L
C-‐pep&de
ug/L
Blood glucose
mmol/L
Insulin
mU/L
C-‐pep&de
ug/LExposed group 8.92±1.58 110.64±28.40 3.96±1.96 4.69±0.87 37.43±18.40 1.78±0.86Control group 4.97±1.14 47.27±26.56 3.21±1.71 4.28±0.59 13.68±7.82 1.45±0.69
Note: compared with that of the control group, P<0.05, P<0.01Note: compared with that of the control group, P<0.05, P<0.01Note: compared with that of the control group, P<0.05, P<0.01Note: compared with that of the control group, P<0.05, P<0.01Note: compared with that of the control group, P<0.05, P<0.01Note: compared with that of the control group, P<0.05, P<0.01Note: compared with that of the control group, P<0.05, P<0.01
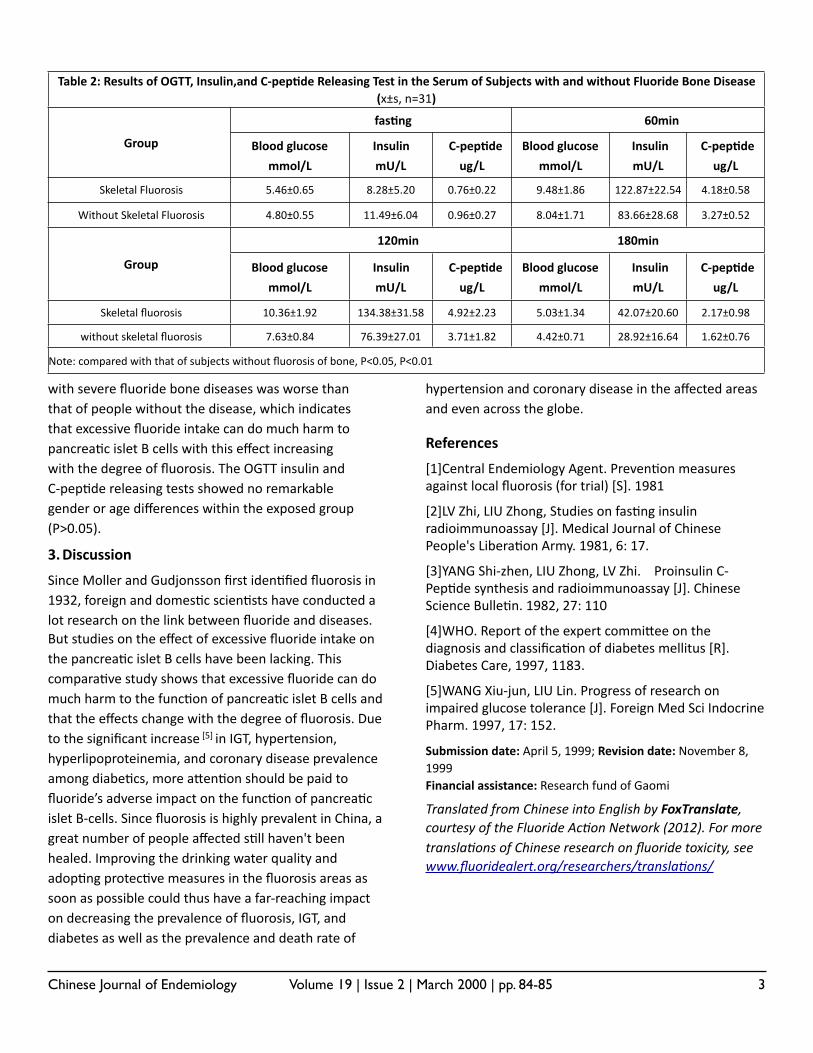
Chinese Journal of Endemiology Volume 19 | Issue 2 | March 2000 | pp. 84-85 3
with severe fluoride bone diseases was worse than that of people without the disease, which indicates that excessive fluoride intake can do much harm to pancrea9c islet B cells with this effect increasing with the degree of fluorosis. The OGTT insulin and C-‐pep9de releasing tests showed no remarkable gender or age differences within the exposed group (P>0.05).
3.Discussion
Since Moller and Gudjonsson first iden9fied fluorosis in 1932, foreign and domes9c scien9sts have conducted a lot research on the link between fluoride and diseases. But studies on the effect of excessive fluoride intake on the pancrea9c islet B cells have been lacking. This compara9ve study shows that excessive fluoride can do much harm to the func9on of pancrea9c islet B cells and that the effects change with the degree of fluorosis. Due to the significant increase [5] in IGT, hypertension, hyperlipoproteinemia, and coronary disease prevalence among diabe9cs, more aqen9on should be paid to fluoride’s adverse impact on the func9on of pancrea9c islet B-‐cells. Since fluorosis is highly prevalent in China, a great number of people affected s9ll haven't been healed. Improving the drinking water quality and adop9ng protec9ve measures in the fluorosis areas as soon as possible could thus have a far-‐reaching impact on decreasing the prevalence of fluorosis, IGT, and diabetes as well as the prevalence and death rate of
hypertension and coronary disease in the affected areas and even across the globe.
References
[1]Central Endemiology Agent. Preven9on measures against local fluorosis (for trial) [S]. 1981
[2]LV Zhi, LIU Zhong, Studies on fas9ng insulin radioimmunoassay [J]. Medical Journal of Chinese People's Libera9on Army. 1981, 6: 17.
[3]YANG Shi-‐zhen, LIU Zhong, LV Zhi. Proinsulin C-‐Pep9de synthesis and radioimmunoassay [J]. Chinese Science Bulle9n. 1982, 27: 110
[4]WHO. Report of the expert commiqee on the diagnosis and classifica9on of diabetes mellitus [R]. Diabetes Care, 1997, 1183.
[5]WANG Xiu-‐jun, LIU Lin. Progress of research on impaired glucose tolerance [J]. Foreign Med Sci Indocrine Pharm. 1997, 17: 152.
Submission date: April 5, 1999; Revision date: November 8, 1999Financial assistance: Research fund of Gaomi
Translated from Chinese into English by FoxTranslate, courtesy of the Fluoride Ac:on Network (2012). For more transla:ons of Chinese research on fluoride toxicity, see www.fluoridealert.org/researchers/transla:ons/
Table 2: Results of OGTT, Insulin,and C-‐pep&de Releasing Test in the Serum of Subjects with and without Fluoride Bone Disease(x±s, n=31)
Table 2: Results of OGTT, Insulin,and C-‐pep&de Releasing Test in the Serum of Subjects with and without Fluoride Bone Disease(x±s, n=31)
Table 2: Results of OGTT, Insulin,and C-‐pep&de Releasing Test in the Serum of Subjects with and without Fluoride Bone Disease(x±s, n=31)
Table 2: Results of OGTT, Insulin,and C-‐pep&de Releasing Test in the Serum of Subjects with and without Fluoride Bone Disease(x±s, n=31)
Table 2: Results of OGTT, Insulin,and C-‐pep&de Releasing Test in the Serum of Subjects with and without Fluoride Bone Disease(x±s, n=31)
Table 2: Results of OGTT, Insulin,and C-‐pep&de Releasing Test in the Serum of Subjects with and without Fluoride Bone Disease(x±s, n=31)
Table 2: Results of OGTT, Insulin,and C-‐pep&de Releasing Test in the Serum of Subjects with and without Fluoride Bone Disease(x±s, n=31)
Group
fas&ngfas&ngfas&ng 60min60min60min
Group Blood glucose
mmol/L
Insulin
mU/L
C-‐pep&de
ug/L
Blood glucose
mmol/L
Insulin
mU/L
C-‐pep&de
ug/L
Skeletal Fluorosis 5.46±0.65 8.28±5.20 0.76±0.22 9.48±1.86 122.87±22.54 4.18±0.58
Without Skeletal Fluorosis 4.80±0.55 11.49±6.04 0.96±0.27 8.04±1.71 83.66±28.68 3.27±0.52
Group
120min120min120min 180min180min180min
Group Blood glucose
mmol/L
Insulin
mU/L
C-‐pep&de
ug/L
Blood glucose
mmol/L
Insulin
mU/L
C-‐pep&de
ug/L
Skeletal fluorosis 10.36±1.92 134.38±31.58 4.92±2.23 5.03±1.34 42.07±20.60 2.17±0.98
without skeletal fluorosis 7.63±0.84 76.39±27.01 3.71±1.82 4.42±0.71 28.92±16.64 1.62±0.76
Note: compared with that of subjects without fluorosis of bone, P<0.05, P<0.01Note: compared with that of subjects without fluorosis of bone, P<0.05, P<0.01Note: compared with that of subjects without fluorosis of bone, P<0.05, P<0.01Note: compared with that of subjects without fluorosis of bone, P<0.05, P<0.01Note: compared with that of subjects without fluorosis of bone, P<0.05, P<0.01Note: compared with that of subjects without fluorosis of bone, P<0.05, P<0.01Note: compared with that of subjects without fluorosis of bone, P<0.05, P<0.01