de ning chemical reaction mechanisms associated with
TRANSCRIPT
Defining chemical reaction mechanisms associatedwith threshold phenomena in conformational
diseases
by
Conner Iknokwayyo Sandefur
A dissertation submitted in partial fulfillmentof the requirements for the degree of
Doctor of Philosophy(Bioinformatics)
in The University of Michigan2012
Doctoral Committee:
Associate Professor Santiago Schnell, ChairAssociate Professor Jason GestwickiAssociate Professor Gustavo RosaniaAssistant Professor Victoria BoothLecturer IV Elizabeth McLaurine Rust

c© Conner Iknokwayyo Sandefur 2012
All Rights Reserved

This thesis is dedicated to my wife, Brittany Grace Marino Sandefur. Thank you for
your kindness, candor, humor, and patience. Your unconditional love and support
made this thesis possible. Gopher ties.
ii

TABLE OF CONTENTS
DEDICATION . . . . . . . . . . . . . . . . . . . . . . . . . . . . . . . . . . ii
LIST OF FIGURES . . . . . . . . . . . . . . . . . . . . . . . . . . . . . . . vi
LIST OF TABLES . . . . . . . . . . . . . . . . . . . . . . . . . . . . . . . . xi
LIST OF APPENDICES . . . . . . . . . . . . . . . . . . . . . . . . . . . . xii
ABSTRACT . . . . . . . . . . . . . . . . . . . . . . . . . . . . . . . . . . . xiii
CHAPTER
I. Introduction . . . . . . . . . . . . . . . . . . . . . . . . . . . . . . 1
1.1 Introduction . . . . . . . . . . . . . . . . . . . . . . . . . . . 11.2 Overview of thesis structure . . . . . . . . . . . . . . . . . . . 4
II. Classifying protein aggregation in conformational disease: cur-rent strategies and limitations . . . . . . . . . . . . . . . . . . . 6
2.1 Introduction . . . . . . . . . . . . . . . . . . . . . . . . . . . 62.2 Classification of mechanisms of protein misfolding and aggre-
gation . . . . . . . . . . . . . . . . . . . . . . . . . . . . . . . 72.3 Threshold phenomena are observed in the formation of toxic
misfolded and aggregated proteins . . . . . . . . . . . . . . . 102.4 Most available mechanisms of protein misfolding and aggrega-
tion are not classified as capturing threshold phenomena . . . 132.5 Threshold phenomena can be captured by dose response curves 142.6 Dynamical behaviors driving threshold phenomena can be dis-
tinguished experimentally . . . . . . . . . . . . . . . . . . . . 192.7 Conclusion . . . . . . . . . . . . . . . . . . . . . . . . . . . . 22
III. Identification of motifs underlying bistable chemical reactionmechanisms . . . . . . . . . . . . . . . . . . . . . . . . . . . . . . . 24
iii

3.1 Introduction . . . . . . . . . . . . . . . . . . . . . . . . . . . 243.2 Dynamical behavior underlying threshold phenomena have been
systematically characterized . . . . . . . . . . . . . . . . . . . 253.3 Materials and Methods . . . . . . . . . . . . . . . . . . . . . 29
3.3.1 Bistable overall reaction configurations . . . . . . . 293.3.2 Bistable reaction mechanisms . . . . . . . . . . . . . 303.3.3 One-to-one transformation of mechanisms into bipar-
tite graphs with edge coloring . . . . . . . . . . . . 303.3.4 Mining bipartite graphs for motifs . . . . . . . . . . 31
3.4 Results . . . . . . . . . . . . . . . . . . . . . . . . . . . . . . 323.4.1 Original chemical motifs were captured by mining the
transformed bistable reaction configurations . . . . 323.4.2 Fundamental reaction mechanism structure is cap-
tured by small motif sizes . . . . . . . . . . . . . . . 353.4.3 Identification of motifs underlying bistability . . . . 38
3.5 Discussion . . . . . . . . . . . . . . . . . . . . . . . . . . . . 403.6 Conclusion . . . . . . . . . . . . . . . . . . . . . . . . . . . . 42
IV. Motifs characterizing protein aggregation mechanisms anddynamics . . . . . . . . . . . . . . . . . . . . . . . . . . . . . . . . 44
4.1 Introduction . . . . . . . . . . . . . . . . . . . . . . . . . . . 444.2 Materials and Methods . . . . . . . . . . . . . . . . . . . . . 46
4.2.1 Creation of a library of protein aggregation mecha-nisms and networks . . . . . . . . . . . . . . . . . . 46
4.2.2 Motif mining and clustering . . . . . . . . . . . . . 474.2.3 Creation of an online repository . . . . . . . . . . . 47
4.3 Results and Discussion . . . . . . . . . . . . . . . . . . . . . . 484.3.1 Unique mechanisms were found in less than a fifth of
published modeling papers . . . . . . . . . . . . . . 484.3.2 Aggregation models were classified into six groups . 514.3.3 Nine protein aggregation networks are predicted to
have threshold behavior . . . . . . . . . . . . . . . . 534.3.4 Models and networks are stored in AggMod, a repos-
itory of protein Aggregation Models . . . . . . . . 554.4 Conclusion . . . . . . . . . . . . . . . . . . . . . . . . . . . . 57
V. A model of threshold behavior reveals rescue mechanisms ofbystander proteins in conformational diseases . . . . . . . . . 59
5.1 Introduction . . . . . . . . . . . . . . . . . . . . . . . . . . . 595.2 Model . . . . . . . . . . . . . . . . . . . . . . . . . . . . . . . 61
5.2.1 A model of bystander protein disappearance in thepresence of misfolded protein . . . . . . . . . . . . . 61
iv
5.2.2 A general mechanism of bystander and misfolded pro-tein interaction in conformational diseases . . . . . 62
5.2.3 Bystander isomer concentration at steady state . . . 655.2.4 Dimensionless bystander isomer concentration at steady
state . . . . . . . . . . . . . . . . . . . . . . . . . . 655.3 Results . . . . . . . . . . . . . . . . . . . . . . . . . . . . . . 68
5.3.1 The model can exhibit bistability . . . . . . . . . . 685.3.2 Influence of τu and λ on the threshold behavior . . . 725.3.3 Necessary conditions for the threshold behavior . . . 76
5.4 Conclusion . . . . . . . . . . . . . . . . . . . . . . . . . . . . 77
VI. Educational component: outlining a mathematical modelingcourse . . . . . . . . . . . . . . . . . . . . . . . . . . . . . . . . . . 84
6.1 Introduction . . . . . . . . . . . . . . . . . . . . . . . . . . . 846.2 Course Description and Philosophy . . . . . . . . . . . . . . . 856.3 Learning Objectives . . . . . . . . . . . . . . . . . . . . . . . 866.4 Course Organization . . . . . . . . . . . . . . . . . . . . . . . 876.5 Assessment . . . . . . . . . . . . . . . . . . . . . . . . . . . . 886.6 Summary . . . . . . . . . . . . . . . . . . . . . . . . . . . . . 88
VII. Conclusion . . . . . . . . . . . . . . . . . . . . . . . . . . . . . . . 90
APPENDICES . . . . . . . . . . . . . . . . . . . . . . . . . . . . . . . . . . 95A.1 Flux perturbation . . . . . . . . . . . . . . . . . . . . . . . . 96A.2 The shape of yr(x) . . . . . . . . . . . . . . . . . . . . . . . . 96B.1 Mathematical biology laboratory: modeling prion infection . . 98
B.1.1 Background . . . . . . . . . . . . . . . . . . . . . . 98B.1.2 The model . . . . . . . . . . . . . . . . . . . . . . . 99B.1.3 Problem Set . . . . . . . . . . . . . . . . . . . . . . 100B.1.4 Berkeley Madonna code . . . . . . . . . . . . . . . . 100
BIBLIOGRAPHY . . . . . . . . . . . . . . . . . . . . . . . . . . . . . . . . 103
v
LIST OF FIGURES
Figure
2.1 Multiple theoretical steady state behaviors can describe experimen-tally observed threshold phenomena. (A) A square hyperbolic doseresponse curve describes a monostable system in which there is asharp initial change in response to a change in dose and then the re-sponse plateaus. (B) In a system described by a sigmoidal saturationdose response curve, there is a one-to-one response. A sharp shiftin the steady state number of aggregates occurs in the threshold re-gion. (C-D) There are two types of switch-like saturation curves. (C)In a reversible bistable system, the system jumps to a high steadystate number of aggregates at thres2. If the system starts at a highresponse level, the dose must be reduced past thres2 to thres1 be-fore a low response level can be recovered. (D) In an irreversiblebistable system, once thres3 is passed, there is no way to recover thelow response state. The boxed regions in (A - D) are the thresholdregions for each dynamical behavior. In (A - D), solid lines denotestable steady states. In (C - D), unstable steady states are denotedby dotted lines. . . . . . . . . . . . . . . . . . . . . . . . . . . . . . 15
2.2 Steady state aggregation data can be captured by multiple dynamicalbehaviors. (A) Experimental time series data of aggregation forma-tion in a C. elegans model of Huntingtons disease [80] were extractedusing digitizing software [78]. (B) Data from (A) were replotted aspolyglutamine tail length (Q#) versus number of aggregates at day 14. 17
vi
2.3 Predicted outcomes of experimental studies distinguish the three dif-ferent theoretical steady state behaviors. Top panel: In a square hy-perbolic system, there is a one-to-one response of steady state numberof protein aggregates to the polyglutamine tail length (Q). There isa gradual, graded increase in the steady state level of aggregates asthe tail length increases. Middle top panel: In a sigmoidal dose re-sponse system, Middle bottom panel: The reversible switch systemoutside of the threshold region behaves similarly to the sigmoidalsystem. When the polyglutamine tail length is within the thresholdregion, the steady state number of protein aggregates is dependenton the initial number of protein aggregates in the system. Bottompanel: In the irreversible switch simulation, there is no recovery fromhigh aggregate numbers. Triangle represents high misfolded concen-tration (high Q#), square threshold range and diamond representsa low Q#. In the square hyperbolic graphs, the low and thresholdlines are nearly identical. . . . . . . . . . . . . . . . . . . . . . . . . 20
3.1 Examples of chemical pathways represented as directed bipartite graphswithout and with edge coloring. Pathways (denoted as P1, P2, andP3) are represented by black nodes and connect the reactants andproducts (represented as gray nodes). The edge coloring captures thestoichiometry of the pathway. In graphs with edge coloring, a greenedge represents one molecule of a species reacting or being produced.A blue edge represents the reaction or production of two moleculesof a given species. . . . . . . . . . . . . . . . . . . . . . . . . . . . . 31
3.2 The chemical motif were transformed into bipartite motifs. Thechemical motif ID (e.g. DabXFabc) and chemical reactions are listedwith the corresponding bipartite motif and motif ID (e.g. 17214571108).Enzyme catalyzed reactions are denoted by an arrow with the enzymecatalyst. In the bipartite motifs, species and reactions are representedby gray and black nodes, respectively. . . . . . . . . . . . . . . . . . 33
3.3 Frequency of bipartite motif appearing in the 16 transformed bistablereaction configurations. Motif 17214571108 appeared in the mostnetworks. The last two motifs (16920 and 164) were required toappear together in a network to correspond to the original chemicalmotif ( Figure 3.2) . . . . . . . . . . . . . . . . . . . . . . . . . . . 34
3.4 Significance profile for the 16 transformed bistable reaction configu-rations shows over and underrepresentation of motifs in the resultingbipartite networks. . . . . . . . . . . . . . . . . . . . . . . . . . . . 36
3.5 Normalized z-scores of three-node motifs for the 11 bistable mecha-nisms transformed into bipartite graphs with colored edges. Motifsappearing as over- or underrepresented across the majority of net-works are presented. Motifs discussed in the text are pictured. Themotif label is the motif ID assigned by FANMOD plus the adjacencymatrix corresponding to the motif. . . . . . . . . . . . . . . . . . . . 37
vii

3.6 Motifs of size five nodes appearing in (A) all transformed bistablemechanisms and (B) only in bistable mechanisms requiring edge col-oring. . . . . . . . . . . . . . . . . . . . . . . . . . . . . . . . . . . . 38
3.7 Two motifs of size seven nodes appearing or overrepresented acrossall transformed bistable reaction mechanisms. In both motifs, thereis a cycle between two species with an input and output into oneof the species in that cycle. Node identifiers and chemical pathwaysunderlying the motifs are listed for clarity. . . . . . . . . . . . . . . 39
4.1 Pie chart of models taken from peer-reviewed, published literature.The majority (56%) of modeling papers did not include a mechanisticdescription of the aggregation process. Of all of the modeling papersidentified, only 15% contained unique mechanisms. . . . . . . . . . . 49
4.2 Network clustering based on pairwise correlation of normalized z-scores for four-node motifs. The correlation scale is denoted by theheatmap colors where red is negatively correlated, green is positivelycorrelated and black is no correlation. . . . . . . . . . . . . . . . . . 52
4.3 Classification of aggregation bipartite networks with edge coloringusing four-node motifs. Examples of chemical reactions underlyingeach motif are given. ∗In class A, two networks did not have a dimer-ization event and a third network did not have a monomer addi-tion event. Abbreviations: reverse conformational change (RCC),reversible isomer addition (RIA), permanent isomer addition (PIA),reversible conformational change (RCC), permanent conformationalchange (PCC), homodimerization (D), heterodimerization (HD) . . 54
4.4 Screenshot of search results for ‘actin.’ The AggMod website is avail-able for free use at http://aggmod.ccmb.med.umich.edu. . . . . . . 55
5.1 Schematic diagram of a continuous flow reactor model of the endo-plasmic reticulum lumen (ER). In this model, the bystander proteinpool, composed of unfolded and folded isomers, has an inflow rateof [N0]/tN , where [N0] is the basal bystander protein concentrationand tN is the bystander ER residence time. The misfolded proteinhas an inflow rate equal to [M0]/tM , where [M0] is the basal mis-folded protein concentration and tM is the misfolded ER residencetime. Bystander and misfolded proteins interact with reaction rateR([N ], [M ]) which is a function of the bystander and misfolded pro-tein concentrations. The outflow rate of bystander and misfolded pro-teins follows first-order kinetics. The outflow of isomers is driven bythe ER-assisted folding (ERAF), ER-assisted degradation (ERAD),protein export and translocation pathways. . . . . . . . . . . . . . . 63
viii
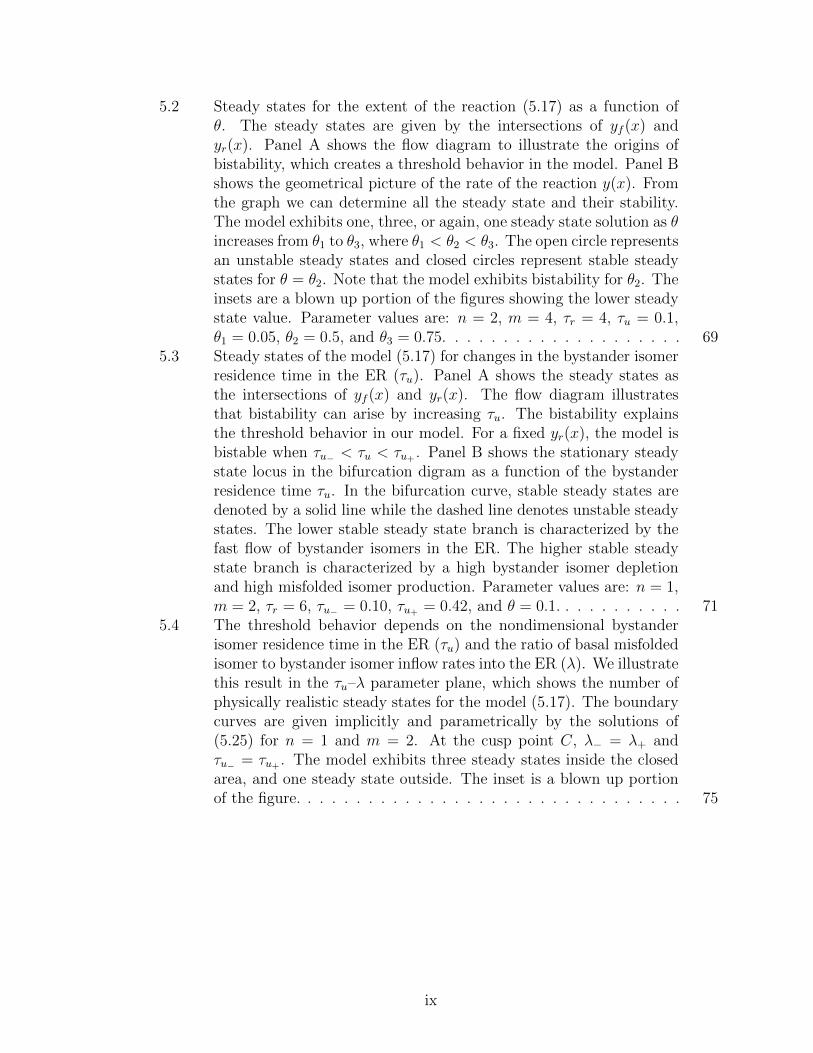
5.2 Steady states for the extent of the reaction (5.17) as a function ofθ. The steady states are given by the intersections of yf (x) andyr(x). Panel A shows the flow diagram to illustrate the origins ofbistability, which creates a threshold behavior in the model. Panel Bshows the geometrical picture of the rate of the reaction y(x). Fromthe graph we can determine all the steady state and their stability.The model exhibits one, three, or again, one steady state solution as θincreases from θ1 to θ3, where θ1 < θ2 < θ3. The open circle representsan unstable steady states and closed circles represent stable steadystates for θ = θ2. Note that the model exhibits bistability for θ2. Theinsets are a blown up portion of the figures showing the lower steadystate value. Parameter values are: n = 2, m = 4, τr = 4, τu = 0.1,θ1 = 0.05, θ2 = 0.5, and θ3 = 0.75. . . . . . . . . . . . . . . . . . . . 69
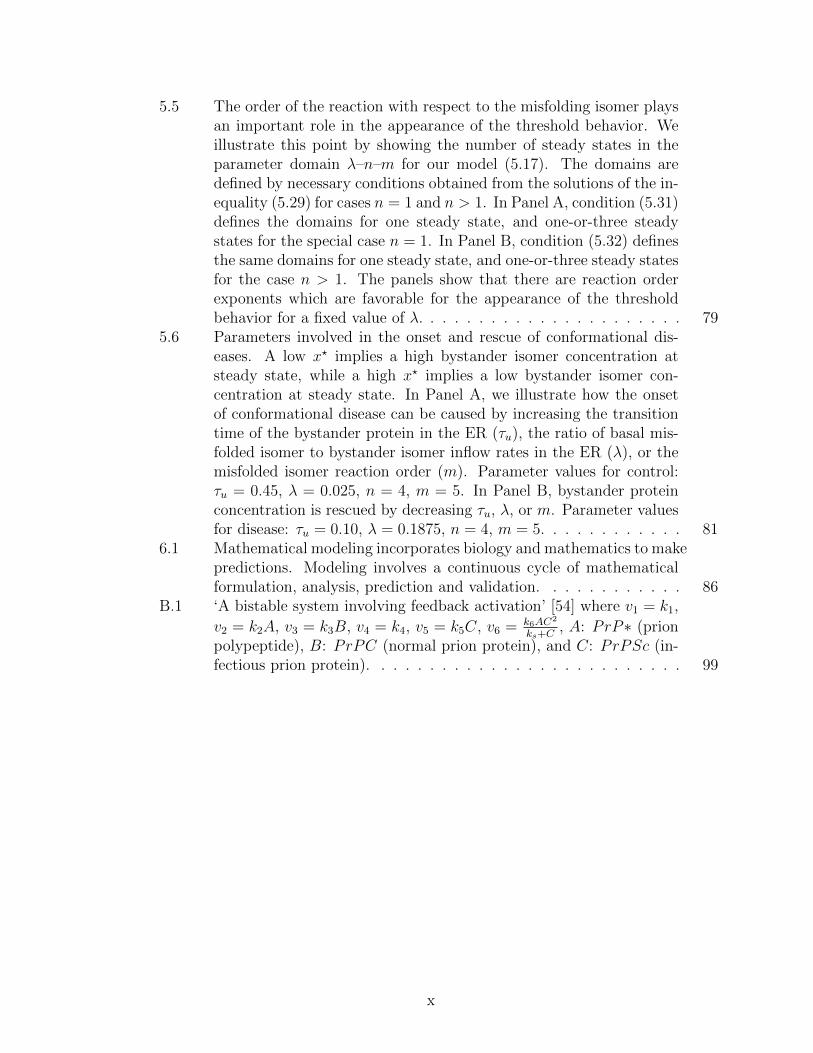
5.3 Steady states of the model (5.17) for changes in the bystander isomerresidence time in the ER (τu). Panel A shows the steady states asthe intersections of yf (x) and yr(x). The flow diagram illustratesthat bistability can arise by increasing τu. The bistability explainsthe threshold behavior in our model. For a fixed yr(x), the model isbistable when τu− < τu < τu+ . Panel B shows the stationary steadystate locus in the bifurcation digram as a function of the bystanderresidence time τu. In the bifurcation curve, stable steady states aredenoted by a solid line while the dashed line denotes unstable steadystates. The lower stable steady state branch is characterized by thefast flow of bystander isomers in the ER. The higher stable steadystate branch is characterized by a high bystander isomer depletionand high misfolded isomer production. Parameter values are: n = 1,m = 2, τr = 6, τu− = 0.10, τu+ = 0.42, and θ = 0.1. . . . . . . . . . . 71
5.4 The threshold behavior depends on the nondimensional bystanderisomer residence time in the ER (τu) and the ratio of basal misfoldedisomer to bystander isomer inflow rates into the ER (λ). We illustratethis result in the τu–λ parameter plane, which shows the number ofphysically realistic steady states for the model (5.17). The boundarycurves are given implicitly and parametrically by the solutions of(5.25) for n = 1 and m = 2. At the cusp point C, λ− = λ+ andτu− = τu+ . The model exhibits three steady states inside the closedarea, and one steady state outside. The inset is a blown up portionof the figure. . . . . . . . . . . . . . . . . . . . . . . . . . . . . . . . 75
ix
5.5 The order of the reaction with respect to the misfolding isomer playsan important role in the appearance of the threshold behavior. Weillustrate this point by showing the number of steady states in theparameter domain λ–n–m for our model (5.17). The domains aredefined by necessary conditions obtained from the solutions of the in-equality (5.29) for cases n = 1 and n > 1. In Panel A, condition (5.31)defines the domains for one steady state, and one-or-three steadystates for the special case n = 1. In Panel B, condition (5.32) definesthe same domains for one steady state, and one-or-three steady statesfor the case n > 1. The panels show that there are reaction orderexponents which are favorable for the appearance of the thresholdbehavior for a fixed value of λ. . . . . . . . . . . . . . . . . . . . . . 79
5.6 Parameters involved in the onset and rescue of conformational dis-eases. A low x? implies a high bystander isomer concentration atsteady state, while a high x? implies a low bystander isomer con-centration at steady state. In Panel A, we illustrate how the onsetof conformational disease can be caused by increasing the transitiontime of the bystander protein in the ER (τu), the ratio of basal mis-folded isomer to bystander isomer inflow rates in the ER (λ), or themisfolded isomer reaction order (m). Parameter values for control:τu = 0.45, λ = 0.025, n = 4, m = 5. In Panel B, bystander proteinconcentration is rescued by decreasing τu, λ, or m. Parameter valuesfor disease: τu = 0.10, λ = 0.1875, n = 4, m = 5. . . . . . . . . . . . 81
6.1 Mathematical modeling incorporates biology and mathematics to makepredictions. Modeling involves a continuous cycle of mathematicalformulation, analysis, prediction and validation. . . . . . . . . . . . 86
B.1 ‘A bistable system involving feedback activation’ [54] where v1 = k1,
v2 = k2A, v3 = k3B, v4 = k4, v5 = k5C, v6 = k6AC2
ks+C, A: PrP∗ (prion
polypeptide), B: PrPC (normal prion protein), and C: PrPSc (in-fectious prion protein). . . . . . . . . . . . . . . . . . . . . . . . . . 99
x
LIST OF TABLES
Table
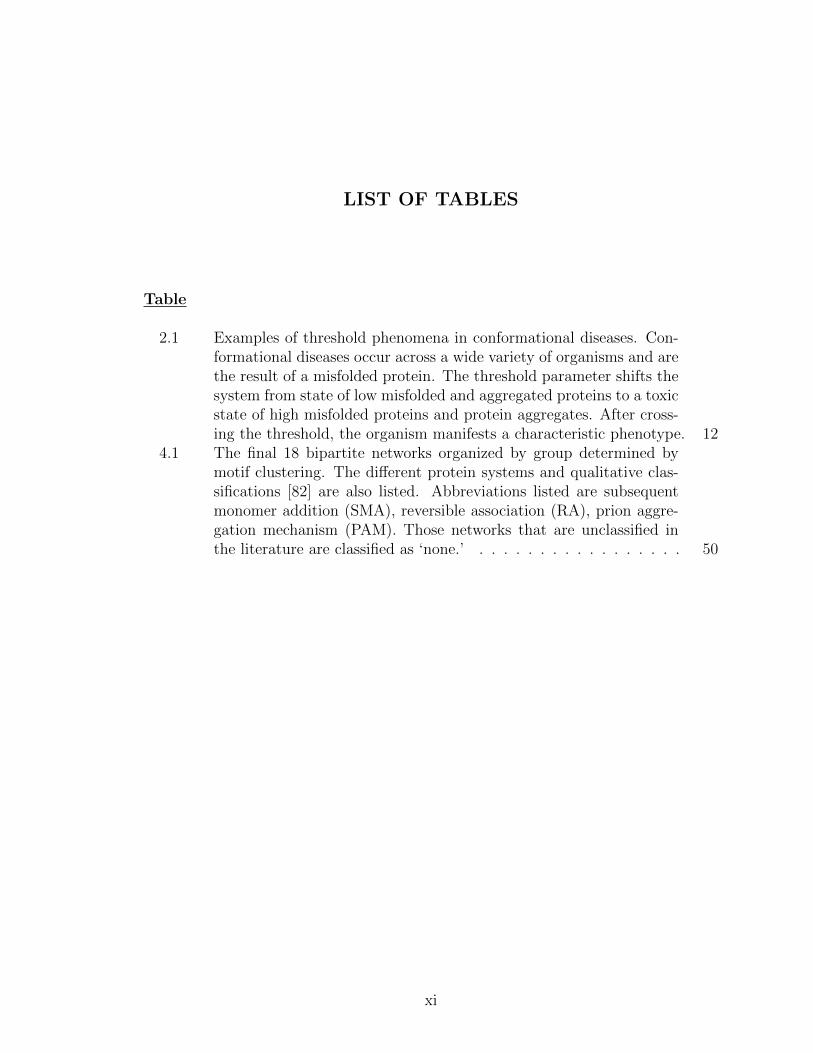
2.1 Examples of threshold phenomena in conformational diseases. Con-formational diseases occur across a wide variety of organisms and arethe result of a misfolded protein. The threshold parameter shifts thesystem from state of low misfolded and aggregated proteins to a toxicstate of high misfolded proteins and protein aggregates. After cross-ing the threshold, the organism manifests a characteristic phenotype. 12
4.1 The final 18 bipartite networks organized by group determined bymotif clustering. The different protein systems and qualitative clas-sifications [82] are also listed. Abbreviations listed are subsequentmonomer addition (SMA), reversible association (RA), prion aggre-gation mechanism (PAM). Those networks that are unclassified inthe literature are classified as ‘none.’ . . . . . . . . . . . . . . . . . 50
xi

LIST OF APPENDICES
Appendix
A. Bystander Model Appendix . . . . . . . . . . . . . . . . . . . . . . . . 96
B. Mathematical Biology Laboratory Appendix . . . . . . . . . . . . . . 98
xii
ABSTRACT
Defining chemical reaction mechanisms associated with threshold phenomena inconformational diseases
by
Conner Iknokwayyo Sandefur
Chair: Santiago Schnell
Conformational diseases arise from the failure of a protein to fold or remain in its
native conformational state. The resulting misfolded protein isomers are prone to
aggregation, a hallmark of conformational diseases. In some conformational diseases,
there is an observed threshold behavior characterized by a sudden shift from non-
toxic to toxic misfolded protein concentrations. Evidence suggests that basal protein
isomer concentrations, protein isomer interactions, pH, and temperature impact pro-
tein aggregation but the mechanism(s) underlying threshold behavior are unknown.
Identifying the factors underlying the sudden toxic shift in misfolded protein con-
centration is a key to controlling conformational disease. The central hypothesis of
this research is that a limited number of protein isomer interaction reaction mech-
anisms drive threshold behavior in conformational disease. In this work, I apply
mathematical and computational modeling techniques to identify reaction mecha-
nisms associated with threshold behavior in conformational diseases. First, I present
a mathematical model of native and misfolded protein isomer interactions and define
the model conditions under which threshold behavior occurs. Second, I apply a novel
xiii

computational approach to characterize known models of protein aggregation based
on reaction mechanisms and dynamical behavior. Finally, I organize these character-
izations into AggMod, an online repository of known models of protein aggregation.
xiv

CHAPTER I
Introduction
1.1 Introduction
A driving force of systems biology is the desire to understand the many interac-
tions that compose the pathways within a cell. Systems biology is interested in the
interactions and emergent properties that result from communication between differ-
ent system components. Reducing a system (e.g., a cell) to its parts (e.g., individual
genes and proteins) neglects component interaction and emergent properties. Build-
ing and investigating a complete interaction map provides insight into normal and
diseased individuals that might not be found by traditional methods.
Much of traditional biology has the central dogma of molecular biology at its basis.
This dogma states that DNA is transcribed into RNA which is translated into protein
[23] and has guided the study of individual genes and the proteins they encode. The
protein folding pathway provides an example of how the central dogma of molecular
biology does not explain many of the interactions within cells. DNA transcription
is initiated by proteins and is the first step in protein production. For a number of
eukaryotic proteins, the process continues with co-translation through ribosomes into
the endoplasmic reticulum (ER). Molecular chaperones and folding machinery aid in
folding protein into its native structure. This native state is not a random one but is
instead the result of both the amino acid sequence and the complex folding pathway.
1
These properly folded proteins are transported out of the ER for further processing.
The path from gene to protein is composed of many different and unknown in-
teractions between DNA, RNA, proteins, and small molecules. Protein folding is one
pathway, or subsystem, within the larger system of protein production. A systems
biology approach offers us an opportunity to understand the complicated pathway
of protein folding and the emergent properties that arise from interacting pathway
components.
Protein folding is often described by way of a folding energy landscape [16]. The
landscape is composed of different conformations of a given protein each corresponding
to a different energy level. The minimum energy, three-dimensional folded protein
structure is termed the ‘native state’ and for most proteins, is essential for proper
function [2]. Failure to fold properly results in misfolded protein conformations. These
protein conformations correspond to energy minima pockets within the folding energy
landscape.
Proteins may fail to properly fold through mutations, cellular stress, or stochas-
tic events [84]. A breakdown in the quality of protein production can lead to the
accumulation of toxic levels of misfolded and unfolded proteins. Improperly folded
proteins can form aggregates [79]. When the level of aggregates reaches a certain con-
centration, these protein complexes lead to proteotoxicity or loss or gain of function
diseases.
Amyloidosis diseases constitute the largest subset of conformational diseases. These
diseases are associated with the conversion of unfolded polypeptides and native pro-
teins into highly organized fibrillar aggregates known as amyloids [137]. Amyloid
formation occurs through activation of a monomer into an aggregate-prone species,
such as a misfolded protein. Monomers then aggregate together to form oligomers.
Protafilaments and fibril structures then form through oligomer and protafilaments
organization, respectively. Protein aggregation also occurs outside of the above or-
2
dered structure resulting in amorphous aggregates such as inclusion bodies. Recent
evidence suggests, however, that inclusion bodies also contain ordered aggregates.
Both ordered and disordered aggregates may be composed of misfolded proteins, un-
folded polypeptides, native proteins, protein folding intermediates, or a combination
of the four [82]. Recent reviews [16] have done well discuss the role of non-native con-
formational protein isomers in protein aggregation. Quite possibly, there are multiple
mechanisms of aggregation occurring within an organism affected by a conformational
diseases.
Aggregate formation in conformational diseases often displays a threshold phe-
nomenon characterized by a slight change in a biological system component driving
a dramatic shift in the system state from normal to disease. In some conformational
diseases, the concentration of aggregated protein can switch between non-toxic (low
concentration) and toxic (high concentration) in a threshold-dependent manner. In
chemical reactions, the appearance of a threshold phenomenon is characterized by two
stable steady states (and a third unstable steady state) coexisting within a certain
range of parameters [45, 28]. In dynamical and complex systems, this phenomenon
is known as bistability. In biochemistry, metabolic and signaling pathways exhibiting
bistability switch between the two stable steady states in response to a chemical signal.
For this reason, it is generally said that such pathways exhibit ‘switch-like behavior’
[32]. One key to controlling conformational diseases, therefore, is to understand the
underlying mechanisms responsible for the threshold phenomenon associated with
increased misfolded proteins and decreased native protein production.
The central focus of my thesis is to understand the essential conditions for thresh-
old phenomena in conformational diseases. My driving hypothesis is that the mech-
anisms by which different protein conformations interact in aggregation have specific
motifs resulting in the observed threshold phenomena. Understanding the factors
underlying the emergence of bistability in chemical mechanisms is fundamental to
3
targeting aggregate formation in conformational diseases.
1.2 Overview of thesis structure
In the following chapter, Chap. II, I begin with a review of aggregation reaction
mechanisms and experimentally observed threshold phenomena in conformational
disease. I review the current state of the aggregation literature and outline the
experimental evidence for threshold phenomena in the formation of misfolded and
aggregated protein. I follow with a discussion of how threshold phenomena can be
modeled mathematically (via a hyperbolic or sigmoidal curve or irreversible or re-
versible bistability). The chapter closes with a discussion of how these models can be
distinguished experimentally.
Chap. III begins with a review of our current understanding of characteristics
driving bistability in chemical reaction mechanisms. I then present and apply a novel
transformation to create a unique, one-to-one mapping of mechanism to bipartite
network to allow searching for motifs underlying threshold phenomena in bistable
systems. First, as a proof of concept, I use the network transformation and motif
mining to replicate the results in a previously published study on bistable motifs
([103]). I then present the results of searching bistable reaction mechanisms for motifs
using my methodology. These motifs will be used in the next chapter to predict
which aggregation mechanisms are and are not capable of threshold phenomena via
bistability.
In Chap. IV, I first discuss the creation of a library of aggregation models and
the quantitative classifications made using motif mining. I briefly discuss redundant
mechanisms in the aggregation literature as well as the highly correlated nature of
published mechanisms. I follow with predictions of dynamical behavior using the mo-
tifs from Chap. III. The chapter concludes with a description of the online repository,
AggMod, developed to house the library of protein aggregation mechanisms and the
4
associated motif information (classification and dynamical behavior predictions).
Threshold phenomena in protein aggregation is determined by a variety of factors,
not only the interactions of different protein conformations. In Chap. V, I present
a general mechanism of bystander and misfolded protein interaction which I use to
investigate additional factors involved in triggering threshold behavior in protein mis-
folding and aggregation. I describe the analysis of the model and discuss the findings
that slight changes in the bystander protein residence time in the ER or the ratio of
basal misfolded to bystander protein inflow rates can trigger the threshold behavior
in protein misfolding.
In Chap. VI, I present a course outline developed around using mathematical mod-
eling to explore biological phenomena. In particular, I present a course description
and philosophy. This is followed by learning objectives and course organization. I
conclude this chapter with a discussion of course assessment. An example laboratory
associated with this course is available in the Appendix.
This thesis concludes with a summary and some possible future directions.
5
CHAPTER II
Classifying protein aggregation in conformational
disease: current strategies and limitations
2.1 Introduction
Protein misfolding and aggregation are implicated in a wide array of conforma-
tional diseases. Abnormal misfolded protein levels are associated with the formation
of protein aggregates in neurodegenerative diseases such as Alzheimer’s, Parkinson’s,
Huntington’s [125], and prion encephalitis [101], as well as other diseases such as Mu-
tant INS-gene-induced Diabetes of Youth (MIDY) [50, 69], medullary carcinoma of
the thyroid [7], and the rare lung disease, pulmonary alveolar proteinosis [47]. The
diversity of conformational diseases is quite astounding.
In some conformational diseases, the mechanism of protein misfolding and aggre-
gation results in threshold phenomena. Threshold phenomena occur when a small
change in a system parameter (e.g. the basal misfolded protein concentration) results
in a dramatic shift in the overall system state. These phenomena are reoccurring
curiosities observed in many biological systems [15, 2, 95, 90, 132, 139, 73]. In con-
formational diseases, the number of misfolded proteins and aggregates can undergo
a dramatic shift from low, non-toxic to high, toxic levels resulting in disease onset
[80, 123, 63]. A well-formed characterization of the mechanism(s) driving threshold
6
behavior appearing in conformational disease remains elusive.
Here we review our current understanding of the mechanisms underlying threshold
phenomena in conformational diseases. We begin with a discussion of the current
characterizations of aggregation mechanisms. Next, we discuss experimental evidence
of threshold phenomena in the formation of toxic levels of misfolded and aggregated
proteins. A discussion of the dynamical behaviors capturing threshold phenomena
follows. We conclude our review with a summary and a discussion of recommended
next steps.
2.2 Classification of mechanisms of protein misfolding and
aggregation
Given the importance of understanding protein aggregation, mechanisms of pro-
tein misfolding and aggregation and the associated reaction kinetics models have been
studied for more than half a century [81, 82, 9]. A similarity across many of these
modeling studies is an attempt to describe the key intermediates involved in the aggre-
gation process of a specific protein. In an expansive review of the protein aggregation
literature, Morris et al. [82] grouped mathematical models of protein aggregation
based on the underlying mechanism. Some of these studies include a specific reaction
mechanism while others provide only a description of the underlying mechanism (i.e.
phenomenological models). Morris et al. [82] label these grouped models as ‘subse-
quent monomer addition I: early contributions,’ ‘subsequent monomer addition mech-
anism II: later contributions,’ ‘reverse association,’ ‘prion aggregation mechanisms,’
‘’Ockham’s razor’/minimalistic 2-step model,’ and ‘quantitative structure-activity re-
lationship models.’ This final group contains non-mechanistic models developed using
protein physicochemical properties and therefore discussion of this group is excluded
from this review.
7
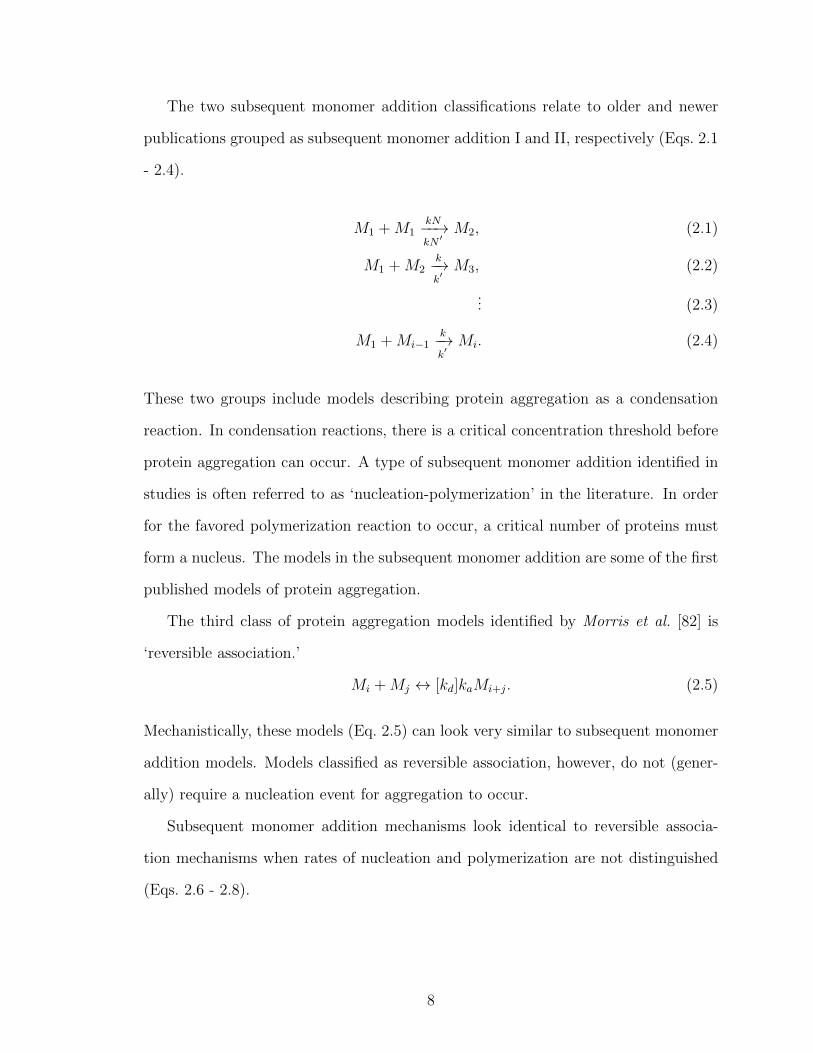
The two subsequent monomer addition classifications relate to older and newer
publications grouped as subsequent monomer addition I and II, respectively (Eqs. 2.1
- 2.4).
M1 +M1kN−−→kN ′
M2, (2.1)
M1 +M2k−→k′M3, (2.2)
... (2.3)
M1 +Mi−1k−→k′Mi. (2.4)
These two groups include models describing protein aggregation as a condensation
reaction. In condensation reactions, there is a critical concentration threshold before
protein aggregation can occur. A type of subsequent monomer addition identified in
studies is often referred to as ‘nucleation-polymerization’ in the literature. In order
for the favored polymerization reaction to occur, a critical number of proteins must
form a nucleus. The models in the subsequent monomer addition are some of the first
published models of protein aggregation.
The third class of protein aggregation models identified by Morris et al. [82] is
‘reversible association.’
Mi +Mj ↔ [kd]kaMi+j. (2.5)
Mechanistically, these models (Eq. 2.5) can look very similar to subsequent monomer
addition models. Models classified as reversible association, however, do not (gener-
ally) require a nucleation event for aggregation to occur.
Subsequent monomer addition mechanisms look identical to reversible associa-
tion mechanisms when rates of nucleation and polymerization are not distinguished
(Eqs. 2.6 - 2.8).
8
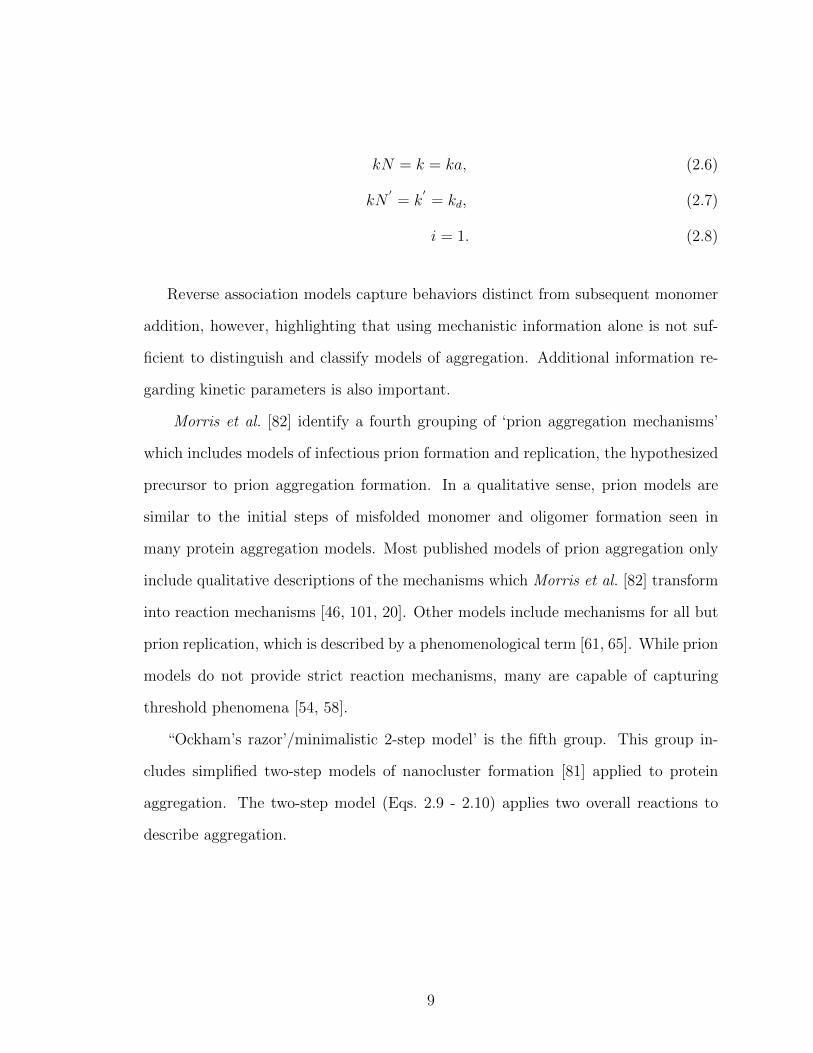
kN = k = ka, (2.6)
kN′= k
′= kd, (2.7)
i = 1. (2.8)
Reverse association models capture behaviors distinct from subsequent monomer
addition, however, highlighting that using mechanistic information alone is not suf-
ficient to distinguish and classify models of aggregation. Additional information re-
garding kinetic parameters is also important.
Morris et al. [82] identify a fourth grouping of ‘prion aggregation mechanisms’
which includes models of infectious prion formation and replication, the hypothesized
precursor to prion aggregation formation. In a qualitative sense, prion models are
similar to the initial steps of misfolded monomer and oligomer formation seen in
many protein aggregation models. Most published models of prion aggregation only
include qualitative descriptions of the mechanisms which Morris et al. [82] transform
into reaction mechanisms [46, 101, 20]. Other models include mechanisms for all but
prion replication, which is described by a phenomenological term [61, 65]. While prion
models do not provide strict reaction mechanisms, many are capable of capturing
threshold phenomena [54, 58].
“Ockham’s razor’/minimalistic 2-step model’ is the fifth group. This group in-
cludes simplified two-step models of nanocluster formation [81] applied to protein
aggregation. The two-step model (Eqs. 2.9 - 2.10) applies two overall reactions to
describe aggregation.
9
U1k1→M1, (2.9)
U1 +M1k2→ 2M1. (2.10)
The first step is an overall reaction describing nucleation while the second is an
overall reaction describing an autocatalytic aggregate concentration growth. The
minimalistic 2-step model fits experimental data from a wide variety of prion and
protein aggregation systems [82]. These models, due to use of overall reactions,
are inherently phenomenological. The rates describing steps one and two are not
actual rates but are instead a composition of many rates occurring across multiple
intermediate steps. While overall reactions do not capture the intermediate steps of
the full aggregation mechanism, they can be decomposed (‘unpacked’) into reaction
mechanisms composed of elementary (uni and bimolecular) reaction steps.
The Morris et al. [82] classifications are the result of gathering numerous and
diverse published protein aggregation mechanisms, a considerable undertaking. There
are some inconsistencies that remain due to the qualitative nature of the classifications
(Eqs. 2.6 - 2.8). Additionally, a recent paper by Bernackia and Murphy [9] address the
difficulty of interpreting aggregation mechanisms using minimalistic two-step models.
They also note that both a two-step minimalistic [81] and a subsequent monomer
addition model [13] both fit well to the same data.
2.3 Threshold phenomena are observed in the formation of
toxic misfolded and aggregated proteins
In some conformational diseases, misfolded and aggregated proteins are observed
to form via threshold phenomena. Huntington’s disease is a well-studied example
of this phenomenon. In both humans and Caenorhabditis elegans, a slight change
10
in the number of polyglutamine residues in the huntingtin protein tail is correlated
with a dramatic increase in the number of protein aggregates and disease onset.
Nerve cells of patients with Huntington’s disease have toxic inclusion bodies which
are associated with the expression of huntingtin protein with a 38-182 polyglutamine
length tail. The polyglutamine tail length can increase over successive generations
[93]. The increased tail length is associated with increased misfolding and aggregation
[62]. On the other hand, patients without the disease exhibit low levels of protein
aggregation and express a form of the protein with an 8-37 residue long polyglutamine
tail [113, 116, 112]. A similar threshold is correlated with the loss of motility in C.
elegans [80]. Additional examples of misfolded proteins involved in disease formation
are listed in Table 2.1.
The diversity in type and size of proteins involved, as well as the resulting disease
is quite astounding. Neuroserpin is a 410 amino acid protein involved protease inhi-
bition [89]. In a mouse model of familial encephalopathy with neuroserpin inclusion
bodies, increased neuroserpin misfolding results in aggregation and is associated with
seizure. Mutant INS-gene-induced Diabetes of Youth (MIDY) occurs when proin-
sulin undergoes misfolding due to mutation and forms complexes with non-misfolded
(‘bystander’) proinsulin. In a MIDY mouse model, misfolding of the 110 amino acid
sized insulin precursor occurs within the endoplasmic reticulum of β-cells and results
in decreased insulin secretion and reduced β-cell mass [50, 69]. A key to controlling
toxic protein misfolding and aggregation in some conformational diseases, therefore,
is an understanding of what drives threshold phenomena. The development of ther-
apies relies on accurate descriptions of the mechanisms of protein misfolding and
aggregation underlying the threshold phenomena.
11
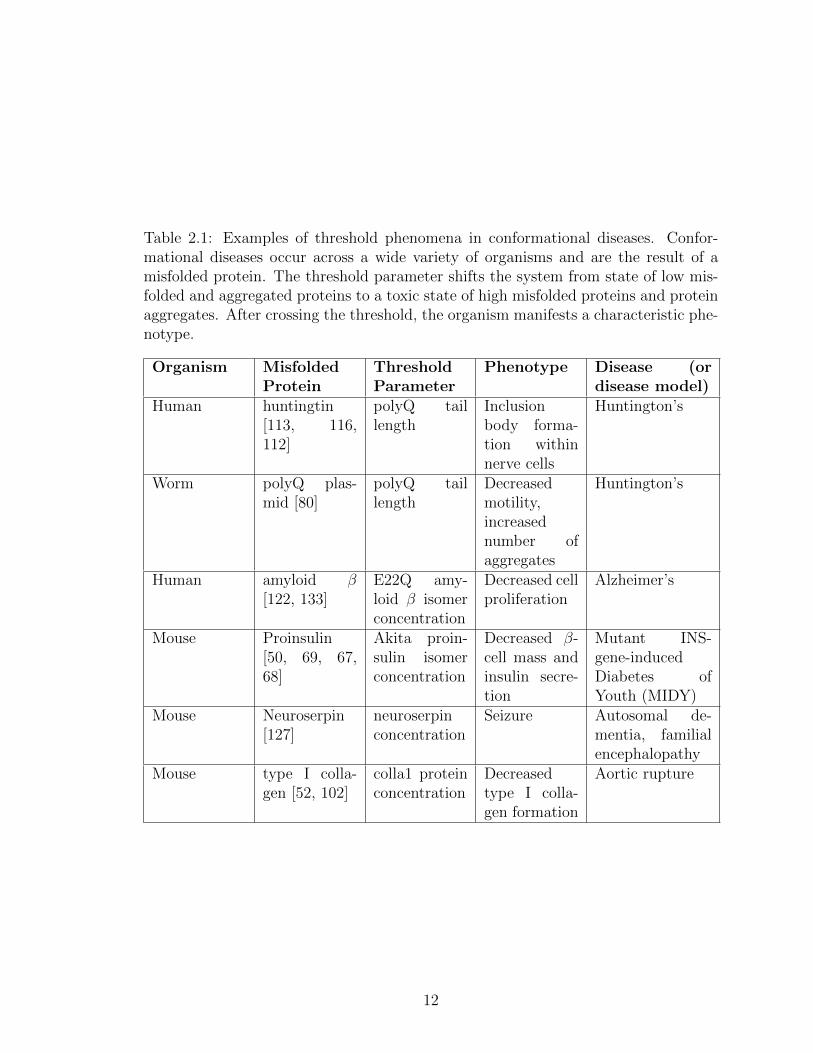
Table 2.1: Examples of threshold phenomena in conformational diseases. Confor-mational diseases occur across a wide variety of organisms and are the result of amisfolded protein. The threshold parameter shifts the system from state of low mis-folded and aggregated proteins to a toxic state of high misfolded proteins and proteinaggregates. After crossing the threshold, the organism manifests a characteristic phe-notype.
Organism MisfoldedProtein
ThresholdParameter
Phenotype Disease (ordisease model)
Human huntingtin[113, 116,112]
polyQ taillength
Inclusionbody forma-tion withinnerve cells
Huntington’s
Worm polyQ plas-mid [80]
polyQ taillength
Decreasedmotility,increasednumber ofaggregates
Huntington’s
Human amyloid β[122, 133]
E22Q amy-loid β isomerconcentration
Decreased cellproliferation
Alzheimer’s
Mouse Proinsulin[50, 69, 67,68]
Akita proin-sulin isomerconcentration
Decreased β-cell mass andinsulin secre-tion
Mutant INS-gene-inducedDiabetes ofYouth (MIDY)
Mouse Neuroserpin[127]
neuroserpinconcentration
Seizure Autosomal de-mentia, familialencephalopathy
Mouse type I colla-gen [52, 102]
colla1 proteinconcentration
Decreasedtype I colla-gen formation
Aortic rupture
12
2.4 Most available mechanisms of protein misfolding and ag-
gregation are not classified as capturing threshold phe-
nomena
Missing from almost all mechanistic models of protein aggregation is an explana-
tion of the threshold phenomena observed in the development of many conformational
diseases. Most published mechanistic models are analyzed for and fit to available time
series data of total protein loss or aggregation formation [82, 9]. These models are
not analyzed for dynamical behavior that might capture threshold phenomena. For
example, Pallitto and Murphy [92] present a mechanistic model of amyloid β aggre-
gation [92]. The resulting law of mass action model fits well to the time series data
and a thorough exploration of the impacts of pH and temperature on aggregation are
provided. This mechanism could be analyzed for threshold phenomena if the basal
amyloid β concentration, for example, was varied and the resulting system behavior
was analyzed. If a dramatic shift in aggregate formation occurred, this would sug-
gest that the amount of basal misfolded protein (amyloid β) was driving a threshold
phenomenon which was captured by the mechanistic model.
The majority of available models seeking to explain threshold phenomena in toxic
protein misfolding and aggregation are phenomenological [46, 101, 54, 61, 27, 107].
These models capture overall dynamical behavior but lack mechanistic information
describing the underlying reaction mechanism. While phenomenological models are
useful in understanding overall behavior, ‘unpacking’ the models into mechanisms
composed of all necessary intermediate steps can result in the loss of threshold be-
havior [114]. In order to regain threshold behavior, introduction of additional mech-
anistic information is often necessary. In an open system with influx and outflux of
both proteins (N and M), the overall cubic autocatalytic reaction is bistable under
certain conditions [115]. When the overall reaction is ‘unpacked’ into elementary re-
13

action steps, the overall behavior of the system is only maintained under restrictive
parameter conditions [28]. In the following sections, we provide evidence highlight-
ing the importance of using accurate mechanistic models to develop a comprehensive
picture of experimentally observed threshold behavior. To set the stage, we need to
understand threshold behavior as a dynamical phenomenon which we discuss next.
2.5 Threshold phenomena can be captured by dose response
curves
Qualitatively, threshold phenomena occur when small changes in a system param-
eter(s) cause large changes in system outputs. These phenomena can be captured
by dose response curves. In dynamical systems, dose response curves are also known
as bifurcation plots. In a standard bifurcation plot, the parameter value (‘dose’) is
plotted on the x-axis and a system variable (the ‘response’) is plotted on the y-axis.
All other parameters remain constant and the response in the system is visualized as
the dose increases or decreases. The number of responses a system has for a given
dose is the number of equilibrium points (steady states) a system variable has for a
given parameter set. These steady states can be unstable or stable. A system will
tend to be repelled away from unstable steady states and attracted towards the stable
ones.
There are three types of dose-response curves that capture threshold phenomena:
a square hyperbolic saturation curve, a sigmoid saturation curve, and a switch-like
saturation curve. A square hyberbolic dose response is a one-to-one response where
the response initially increases as the dose is increased (or decreased, depending on
the given system) and then finally plateaus ( Figure 2.1A). A hyperbolic dose response
curve represents a monostable system (a system with one stable steady state). For
any given dose, the system only has one stable steady state and therefore the system
14
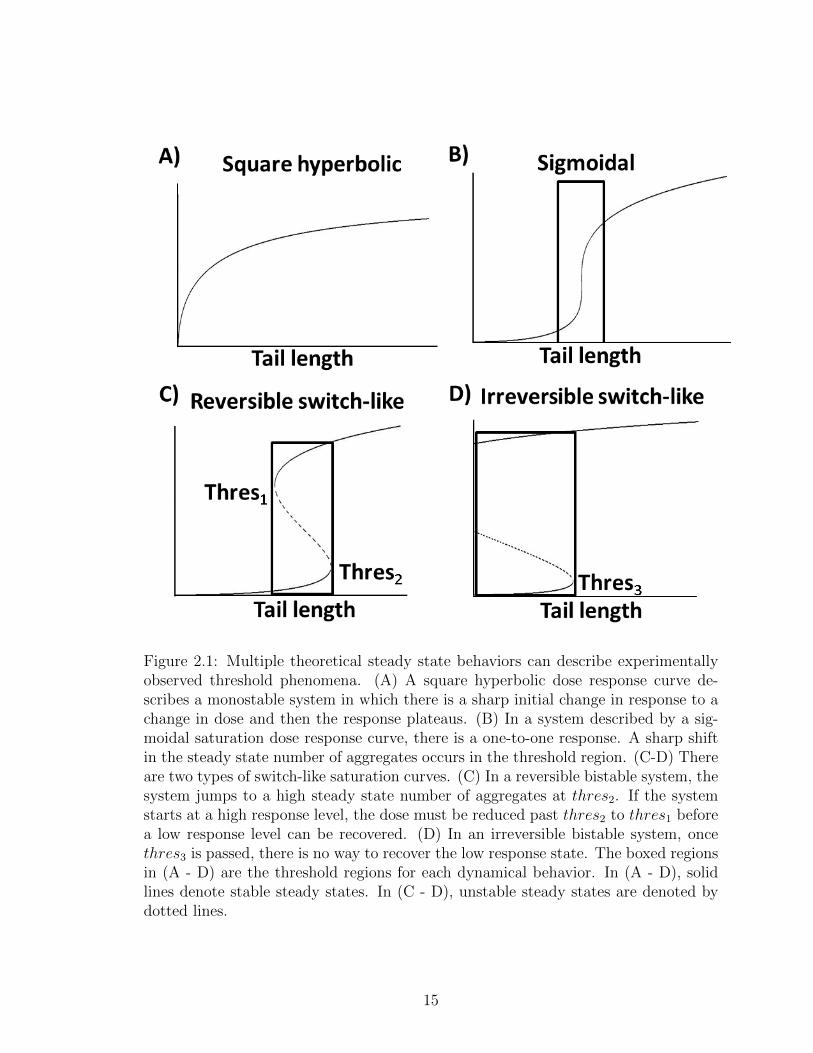
Figure 2.1: Multiple theoretical steady state behaviors can describe experimentallyobserved threshold phenomena. (A) A square hyperbolic dose response curve de-scribes a monostable system in which there is a sharp initial change in response to achange in dose and then the response plateaus. (B) In a system described by a sig-moidal saturation dose response curve, there is a one-to-one response. A sharp shiftin the steady state number of aggregates occurs in the threshold region. (C-D) Thereare two types of switch-like saturation curves. (C) In a reversible bistable system, thesystem jumps to a high steady state number of aggregates at thres2. If the systemstarts at a high response level, the dose must be reduced past thres2 to thres1 beforea low response level can be recovered. (D) In an irreversible bistable system, oncethres3 is passed, there is no way to recover the low response state. The boxed regionsin (A - D) are the threshold regions for each dynamical behavior. In (A - D), solidlines denote stable steady states. In (C - D), unstable steady states are denoted bydotted lines.
15
will always reach that equilibrium for a given parameter set.
A sigmoid saturation dose response curve describes a reversible behavior charac-
terized by a graded one-to-one response to a signal ( Figure 2.1B). Below a critical
threshold range, there is a gradual increase in response to a changing dose. Within
the critical threshold range ( Figure 2.1B box), there is a dramatic shift in the sys-
tem response. This dramatic shift occurs over a relatively small dose range but the
one-to-one (monostable) nature of the system is maintained.
A third dose response curve capturing threshold phenomena is a switch-like satu-
ration curve ( Figure 2.1C and Figure 2.1D). Outside of the critical threshold region,
this curve is similar to a sigmoid saturation curve. There is a one-to-one response
to a change in the dose. In other words, outside the threshold region, the system is
monostable. The behavior of the switch-like saturation curve inside the critical thresh-
old region, however, distinguishes this curve from the other two curves presented
here. Within the threshold region of a switch-like saturation curve ( Figure 2.1C box
and Figure 2.1D box), the system has two possible stable steady states (and a middle
unstable steady state). A switch-like saturation curve describes a bistable system,
where there are two possible stable steady states a system can attain within a de-
fined parameter ranged. Bistability has been used to describe threshold phenomena
observed in prion propagation and plaque formation [46, 101, 54, 61, 27, 107], protein
aggregation in C. elegans [107] and protein aggregation in conformational diseases
[115]. In many of these systems, an autocatalytic reaction between unfolded and mis-
folded proteins (or prions) creates additional misfolded proteins which can increase
to a toxic level. This positive feedback is tempered by folding and export of unfolded
proteins as well as misfolded protein degradation.
In a protein aggregation system with square hyperbolic and sigmoid saturation
dose response behavior, we expect to see graded increases and decreases in the steady
state number of protein aggregates in response to increasing and decreasing tail length,
16

Figure 2.2: Steady state aggregation data can be captured by multiple dynamicalbehaviors. (A) Experimental time series data of aggregation formation in a C. elegansmodel of Huntingtons disease [80] were extracted using digitizing software [78]. (B)Data from (A) were replotted as polyglutamine tail length (Q#) versus number ofaggregates at day 14.
17
respectively. The formation of toxic aggregates would be reversible through shortening
the polyglutamine tail length. Both of these systems have one-to-one dose-response
behavior. There is only one possible steady state in the number of aggregates that
the system can reach for a given set of parameters. Though one-to-one, the behaviors
are ‘switch-like’ as there is a dramatic increase in the number of aggregates when the
threshold parameter (e.g. the polyglutamine tail length) is within the threshold range
( Figure 2.1A and Figure 2.1B, boxed region). In the square hyperbolic, however,
there is no low dose response. As soon as the tail length increases, in this simulated
example, the steady state number of aggregates begins to grow dramatically.
There are important distinctions between the two switch-like saturation (bistable)
curves presented here. Similar to a sigmoid saturation system, in a reversible bistable
system, toxic aggregation can be reduced by decreasing the signal past the critical
threshold ( Figure 2.1C, boxed region). In contrast to a system with a sigmoid satu-
ration dose response, however, the initial number of aggregates (the initial condition
of the system) is important to the overall system behavior. In a certain range of
parameters, the system can end up in two different steady states, depending on the
initial conditions. In a bistable system, increasing the polyglutamine tail length be-
yond the threshold range (thres2) results in a dramatic shift to a high number of
protein aggregates. To reverse this switch in aggregate numbers, the polyglutamine
tail length driving misfolded protein production must be reduced beyond thres2 to
a lower value (thres1). This behavior is known as hysteresis and is in contrast to
the one-to-one response of both the square hyperbolic and sigmoid saturation dose
response systems.
As the threshold signal increases, irreversible bistable systems have behavior sim-
ilar to the monostable sigmoid saturation and the reversible bistable systems. At the
threshold point (thres3), there is a dramatic shift in the number of protein aggregates.
In a protein aggregation system with underlying irreversible bistable dynamical be-
18
havior, however, low aggregate levels are unrecoverable after crossing the threshold
( Figure 2.1D, boxed region). Decreasing the misfolded protein level by shortening
the polyglutamine tail length outside of the threshold region is impossible. In protein
aggregation systems with underlying irreversible bistable behavior, therapies imple-
mented after the appearance of toxic protein aggregates would only slightly reduce
the number of aggregates (making it difficult to recover normal function).
Understanding the differences of hyperbolic, sigmoidal dose response, reversible
and irreversible bistable systems is important to therapeutic intervention. In this
thesis, we are interested in determining the underlying dynamics of the formation of
toxic protein misfolding and aggregation. For example, there are multiple possible
steady state behaviors underlying steady state aggregate threshold phenomena in C.
elegans ( Figure 2.2A and Figure 2.2B). Due to the important therapeutic differences
of the presented dynamical behaviors, drug development needs to proceed with the
underlying dynamical behavior of the protein misfolding and aggregation system in
mind. This dynamical behavior is dictated by both the reaction mechanism and the
kinetic parameters [121].
2.6 Dynamical behaviors driving threshold phenomena can
be distinguished experimentally
Protein aggregate formation, in general, is either measured directly via absorbance
and fluorescence assays or indirectly through the measurement of total protein loss.
These experimental measurements generally begin with a system containing low, non-
toxic level of protein aggregates. The experiment progresses until the number (or
concentration) of aggregates reach an apparent steady state. The end result is a
time series data charting the increase in aggregates over time (either through direct
measurement or through direct correlation with total protein loss).
19
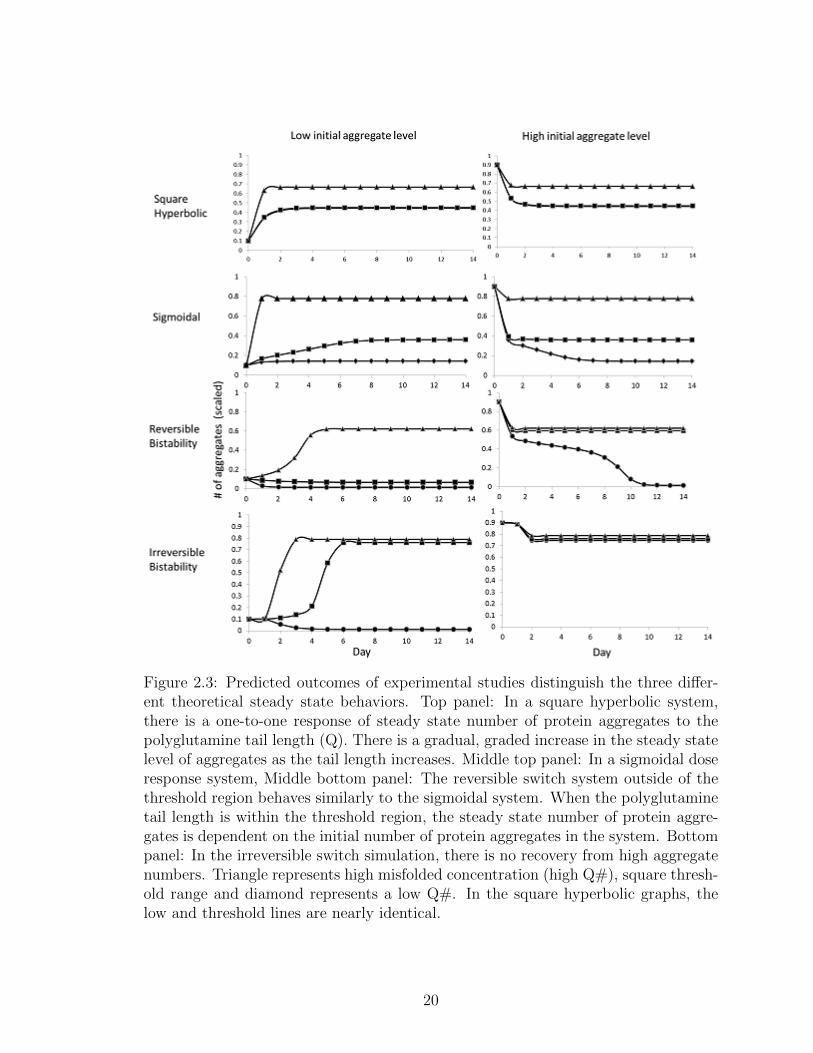
Figure 2.3: Predicted outcomes of experimental studies distinguish the three differ-ent theoretical steady state behaviors. Top panel: In a square hyperbolic system,there is a one-to-one response of steady state number of protein aggregates to thepolyglutamine tail length (Q). There is a gradual, graded increase in the steady statelevel of aggregates as the tail length increases. Middle top panel: In a sigmoidal doseresponse system, Middle bottom panel: The reversible switch system outside of thethreshold region behaves similarly to the sigmoidal system. When the polyglutaminetail length is within the threshold region, the steady state number of protein aggre-gates is dependent on the initial number of protein aggregates in the system. Bottompanel: In the irreversible switch simulation, there is no recovery from high aggregatenumbers. Triangle represents high misfolded concentration (high Q#), square thresh-old range and diamond represents a low Q#. In the square hyperbolic graphs, thelow and threshold lines are nearly identical.
20
Time series data for square hyperbolic, sigmoid saturation, and switch-like satu-
ration curves look very similar when the initial aggregate level is low. This makes
experimentally distinguishing these dynamical behaviors difficult. Experimental data
from protein aggregation systems beginning with both low and high aggregate num-
bers, however, would aid in distinguishing the systems ( Figure 2.3). Simulated time
series data a square hyperbolic and sigmoidal saturation system shows a reversible,
one-to-one signal to response ( Figure 2.3, top and top middle panels). The steady
state value of the number of aggregates is always the same for a given polyglutamine
tail length, regardless of the initial number of protein aggregates. The threshold range
for the square hyperbolic occurs when there is a physically realistic (non-negative)
level of protein aggregates. There is a dramatic shift to high aggregate level as soon
as the polyglutamine tail exists ( Figure 2.3, top panel). On the other hand, in a
sigmoidal saturation system, low and high levels of aggregates exist for short and long
tail lengths, respectively ( Figure 2.3, top middle panel).
A reversible switch-like saturation system looks very similar to a sigmoidal system
at short and long tail lengths, for high and low initial aggregate levels ( Figure 2.3,
bottom middle panel). There is a critical range of polyglutamine residues (the thresh-
old region), however, that gives a very distinctive behavior. Within this region, the
same steady state level of aggregates can exist for different polyglutamine tail lengths
depending of the initial number of aggregates. In a reversible switch-like satura-
tion system, the required tail length for a switch from toxic to non-toxic number of
protein aggregates would be much shorter than the tail length required for a switch
from non-toxic to toxic aggregate numbers (a hysteretic response). Therefore, a much
more reduced misfolded concentration would be necessary to recover normal aggregate
levels after the initial toxic protein aggregation threshold was passed. In contrast,
toxic aggregation in a system governed by irreversible switch-like saturation bistabil-
ity cannot be reduced after the threshold is crossed, regardless of the reduction in
21
polyglutamine tail length ( Figure 2.3, bottom panel). Designing experimental sys-
tems with the above factors in mind would aid in distinguishing predicted dynamical
behaviors underlying threshold phenomena, as well as aid in validation of proposed
protein aggregation mechanisms.
2.7 Conclusion
Conformational diseases are diverse, numerous and result from a protein failing
to fold into a native conformation. Increased misfolded and aggregated proteins are
hallmarks of many conformational diseases. Current classifications of mechanisms of
protein aggregation are qualitative. Use of qualitative classifications results in contra-
dictory descriptions of the same protein aggregation mechanism. Due to the strong
bias in the literature towards closed mechanisms of aggregation involving the creation
of homodimer, creating new mechanisms of aggregation is important. Addressing the
open nature of cellular systems, by developing new or expanding on published aggre-
gation mechanisms, would be a useful future step.
Threshold phenomena underlie toxic protein misfolding and aggregation in some
conformational diseases ( Table 2.1). A key to understanding and controlling these
conformational diseases lies in developing therapies targeting the important reactions
underlying threshold behavior. These reactions can be predicted by development
of aggregation mechanisms using theoretical and experimental means. These mecha-
nisms and associated kinetic parameters underlie the dynamical behavior of an aggre-
gation system. Dynamical behavior capturing threshold phenomena are square hyper-
bolic, sigmoid saturation, and switch-like saturation (bistability) ( Figure 2.1). Quan-
titative information about dynamical behavior and underlying mechanisms would aid
in creating more comprehensive classifications of models of protein misfolding and
aggregation. Future investigations into the mechanisms creating toxic protein mis-
folding and aggregation threshold phenomena would benefit from interdisciplinary
22
approaches.
While different dynamical behaviors can produce threshold behavior, there is in-
creasing evidence that biochemical threshold behavior is a result of bistability. In
the next chapter, we discuss what is known about mechanisms underlying bistable
behavior. We then introduce a novel methodology to identify reaction mechanisms
important to bistability. This sets the stage for the application of our new method-
ology to quantitatively characterize protein aggregation mechanisms.
23
CHAPTER III
Identification of motifs underlying bistable
chemical reaction mechanisms
3.1 Introduction
Chemical reaction mechanisms - developed by piecing together specific chemical
pathways (or reactions) - provide fine-grained representations of biological systems.
These representations capture the complete picture of the underlying chemical inter-
actions between biological components. The dynamics of mechanistic representations
can be captured by ordinary differential equations (ODEs). These ODEs model the
change of each component in the system (e.g. concentration of a protein) over time.
In theory, these systems can be solved analytically or numerically in order to give
information about steady state behavior [121].
As most biological systems are large and complex, the unfortunate reality is
that obtaining an accurate description of the steady state behavior is quite difficult.
Methodology such as homotopy exists to aid in estimating steady state behavior but
require an educated guess of the steady state solution(s) of a system. These estimated
guesses are often elusive in complex biological systems where the true steady state
behavior is unknown or unclear. Alternative methods are available to exclude sys-
tems incapable of certain behaviors (e.g. chemical reaction network theory or CRNT)
24
[29, 30, 22] but this group of methods only considers positive steady states. In biolog-
ical and chemical systems, one expects that a system component, such as a protein,
could be completely depleted from a system (i.e. have a value of zero at steady-state).
Though these alternative methods disregard a zero steady-state, they provide
a useful representation of chemical mechanisms as bipartite graphs. Bipartite graph
representations of chemical reaction networks (mechanisms) are generally composed of
two types of nodes: one type of node representing chemical species and a second node
type representing the chemical pathways (the individual steps in the mechanism).
The single type of directed edges of these bipartite graphs connect reactant and
product species nodes to their respective chemical pathway nodes. This particular
type of bipartite graph is sometimes referred to as a ‘species-reaction (SR)’ graph in
the literature [22].
Identifying specific component interactions (‘motifs’) underlying biological system
behavior is a major task of modern biology. Motif mining studies published thus far
almost unanimously explore associations between motifs and biological behavior in
single node type substrate graphs. CRNT illustrates that there are particular relation-
ships between species and pathways captured by bipartite graphs that are associated
with dynamical behaviors. Therefore, we hypothesize that we can identify motifs
important to dynamical behavior using bipartite graph representations of chemical
reaction networks.
3.2 Dynamical behavior underlying threshold phenomena have
been systematically characterized
Of particular interest is understanding the key motifs underlying cellular decision
making such as oocyte development, apoptosis, and oncogene activation, biological
behaviors that are hypothesized to be driven by bistability [15, 2, 95, 90, 132, 139, 73].
25
There remains considerable debate about the specific conditions necessary for bistabil-
ity. Evidence for bistability in biological processes can be found in an experimentally
observed hysteretic response. In Xenopus oocyte maturation, for example, there is an
irreversible, all or nothing switch towards maturation in response to a change in the
progesterone concentration. Returning to the original, pre-maturation progesterone
concentration cannot return the oocyte to an ‘immature’ state. This hysteretic re-
sponse is also observed in aggregation where the change in the pH [41], temperature
[75], and pressure [31] can drive a switch in the aggregated protein concentration.
But what are the mechanisms underlying proposed bistable biological systems?
Computational approaches have been employed to search for bistable behavior and
predictors of bistability in silico. Paladugu et al. [91] applied an evolutionary ap-
proach to developing chemical reaction configurations with bistable (and oscillatory)
behavior. Initially, random chemical reaction configurations of uni- and bi-molecular
interactions were generated. Configurations capable or near capable of desired dy-
namical behavior were used to generate the next set of configurations. In other words,
high fitness configurations were selected as ‘parents’ of the next generation.
Ramakrishnan and Bhalla [103] used a set of 12 chemical reactions identified as
commonly occurring in biology. They first performed a systematic exploration of all
possible reaction configurations of two, three and four chemical species, using all, one
to six, and one to three (of the set of 12 reactions), respectively. In the second stage,
they increased the number of reactions used and sampled a subset of all possible
reaction configurations of three, four, and five chemical species using seven to fifteen,
five, and one to four reactions (of the set of 12 reactions), respectively. With sparse
but broad ranged parameter sampling, the authors found that approximately 10% of
the full set and 5% of the subset of configurations were bistable.
All of the bistable networks identified by Ramakrishnan and Bhalla [103], contain
either enzyme catalyzed reactions or overall reaction rates and therefore do not pro-
26
vide mechanistic insight into bistable behavior. The study does point to an interesting
indication that there is a core set of smaller bistable reaction networks and that the
larger networks are expansions on this core. The authors connected all bistable con-
figurations via a directed acyclic graph. Bistable configurations served as the nodes
and the addition or removal of one of the 12 reactions served as an edge connecting
the configurations. From the graph, it appears that the larger bistable configurations
are children of smaller configurations. This suggests that while the number of total
bistable configurations is large, bistable behavior may be driven by a much smaller
group of three-species configurations.
A similar finding appears in a more recent study by Siegal-Gaskins et al. [124].
In this study, the authors apply CRNT [29, 30] to perform an in silico search on a
large set (40,680) of two-gene gene-regulatory networks (GRNs). A GRN consists of
interacting genes and proteins (which are, in general, transcription factors). In their
analysis, Siegal-Gaskins et al. [124] found a large number of bistable GRNs (36,771).
Further analysis determined that each of the 36,771 bistable GRNs contained one
of 11 possible core bistable networks (termed minimal bistable networks or MBNs)
containing three to eight species. An MBN contains the minimum number and type of
reactions to create a bistable system. Removing any one reaction from an MBN would
result in loss of bistability, creating a monostable system. As in the Ramakrishnan
and Bhalla [103] study, there was a set of bistable sub-networks which could be
found in larger bistable gene-regulatory networks. These findings are in line with the
mounting evidence that larger networks are made up of smaller sub-networks with
specific functions [131].
Despite studies investigating and characterizing theoretical systems capable of
threshold phenomena, the specific reactions underlying threshold behavior remain
unclear [96]. Some studies present evidence of three necessary conditions for bista-
bility [22, 138]: positive feedback loop(s), ultrasensitive dose-response curves, and a
27
mechanism to prevent a large increase in the concentration of any chemical species
(reactants, intermediates, and products) in the chemical reaction network. These are
the three characteristics identified in the ‘smallest bistable chemical reaction system’
published by [138]. Other evidence exists, however, that these three conditions may
not be necessary for bistability. Studies by two different groups demonstrated that
bistable systems can occur in absence of positive feedback loops [103, 88]. This can be
observed in the mass action MBNs as well [124]. For example, certain reactions ap-
pear together in six of seven MBNs creating a feedback loop. Depending on the other
reactions in the chemical network, the feedback can be positive or negative. In two
of these six chemical reaction networks, there is no positive feedback (only negative
feedback) due to the other reactions in chemical networks. Additionally, in certain
enzyme-catalyzed reactions, enzyme saturation is critical for bistability, while in oth-
ers, bistability results from a balance between competing reactions. This suggests
that ultrasensitivity, at least via enzyme saturation, is not a necessary requirement
for a bistable system [131, 139]. Certainly, the conditions underlying bistability in
chemical reaction networks remain open for investigation.
Here, we present a method to mine transformed chemical reaction networks (i.e.
mechanisms) to identify motifs underlying bistable behavior. First, as a proof of
concept, we apply our methodology to bistable network configurations found in a
previously published in silico study of bistability in biological systems [103]. We
illustrate that we can capture the ‘chemical motifs’ identified in the study as bipartite
motifs in the transformed chemical reaction networks. We discuss the importance of
comparing motif appearances against a random background by showing how using
motif frequencies may lead to spurious results. We then apply our method to a library
of published bistable mechanisms and identify two seven-node bipartite motifs found
across all the bistable mechanisms.
28
3.3 Materials and Methods
3.3.1 Bistable overall reaction configurations
The 16 bistable chemical reaction systems were obtained from a previous system-
atic study of ‘chemical motifs’ in computationally generated reaction configurations
[103]. These 16 systems are a subset of a computationally generated set of chemical
reaction systems. In the original study, Figure 2 presented example bistable models
from a final set of approximately 4500 bistable reaction configurations. We identified
this set of 16 reaction configurations as ‘overall reactions’ due to the assumption of
an instantaneous conversion of species made in the paper. For example, in an enzyme
catalyzed reaction such as autocatalysis, the chemical mechanism is generally com-
prised of two chemical pathways: a reversible association of enzyme with substrate
to form a complex (a + b↔ ab, where a is the substrate and b is the enzyme) and a
irreversible change of the complex into a product (ab→ b+ b). In the original paper,
the overall reaction a+ b→ 2b) was used to model this type of chemical mechanism.
In our study, reaction configurations with tri-molecular interactions and above
were removed (e.g. we did not include reaction configurations with the reaction 4a+
b↔ c). For example, the ‘Oxidation’ reaction 2a+ b↔ 2c is an overall reaction as it
encompasses multiple intermediate reaction steps. Chemically, there is no expectation
that two molecules of a and one molecule of b will combine instantaneously. Instead,
we expect that, for example, a and b will combine first and then this heterodimer will
combine with another molecule of a in a second chemical pathway (i.e. a + b ↔ ab
and then ab + a → 2c. An alternative set of chemical pathways is that a will first
associate with itself form a homodimer which then combines with b in the second
chemical pathway.
29

3.3.2 Bistable reaction mechanisms
To obtain the 11 reaction mechanisms, we searched the biomedical and chemical
literature. After searching, we obtained 105 potential chemical reaction configura-
tions. We removed all reaction configurations that did not meet our definition of a
chemical reaction mechanism. We defined a chemical reaction mechanism as one that
only contains chemical pathways where chemical pathways were defined as those with
only uni- and bi-molecular reactions resulting in a maximum of two species.
Additionally, we removed any reaction configurations that contained enzyme cat-
alyzed reactions without an intermediate complex step (e.g. the overall reaction
configurations described in section 3.3.1). Any other reaction configurations found in
the literature were removed after reviewing the paper to identify any violations of law
of mass action assumptions. For example, a model of bistability in a closed reactor
is published as bistable under the assumption of the non-linear Beer-Lamper’s Law
of light absorption [94]. The final eleven bistable reaction mechanisms used in this
study were M2 [94], M4 [21], M19 [21], M20 [22], M21 [22], M23 [74], M24 [24], M64
(unpublished), M102 [21], M103 [21], and M104 [24]
3.3.3 One-to-one transformation of mechanisms into bipartite graphs with
edge coloring
Chemical reaction configurations were transformed into directed bipartite net-
works with one node color (black) representing chemical pathways and a second node
color (gray) representing chemical species. In order to capture the stoichiometry of
the chemical reaction configurations, edges connecting species and pathway nodes
were colored in two ways. One node color (green) represented one species (a reac-
tant) entering a pathway node or one species (a product) exiting a pathway node. A
second node color (blue) represented when two of a given species entered into (re-
acted) or exited (produced) a pathway node. By definition, an edge between two
30
species nodes or an edge between two pathway nodes were not allowed in a bipartite
graph. Examples of the edges for the different reaction and product stoichiometries
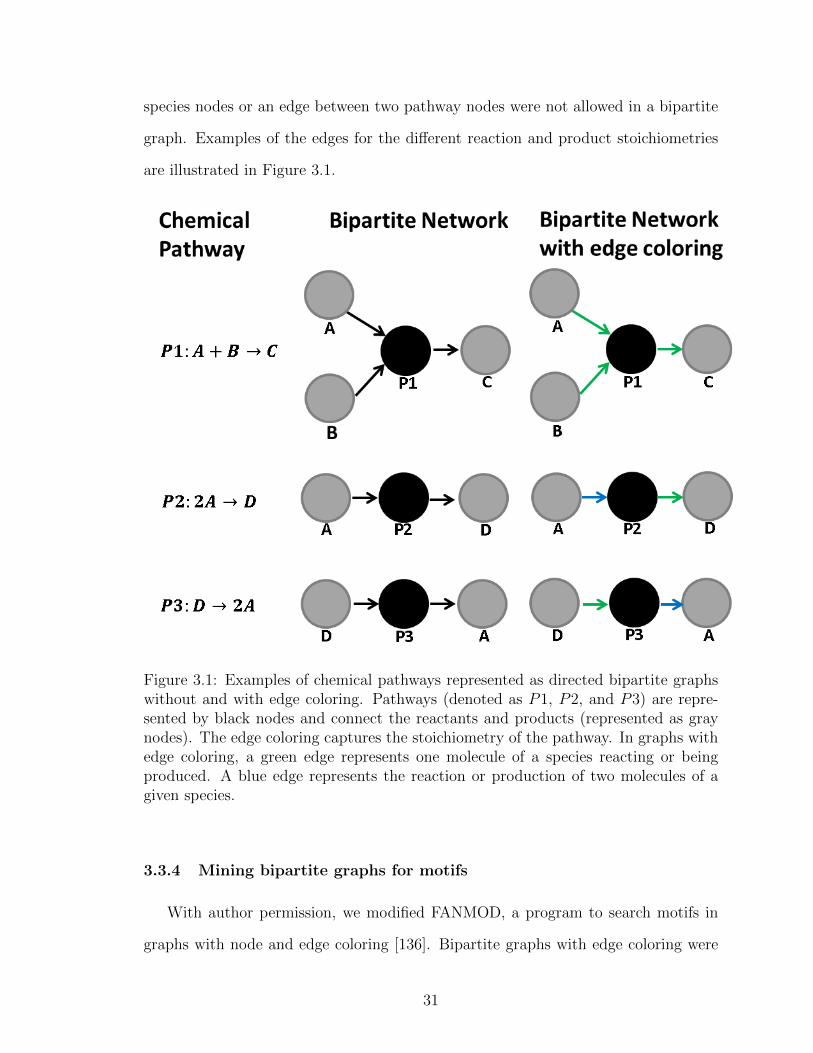
are illustrated in Figure 3.1.
Figure 3.1: Examples of chemical pathways represented as directed bipartite graphswithout and with edge coloring. Pathways (denoted as P1, P2, and P3) are repre-sented by black nodes and connect the reactants and products (represented as graynodes). The edge coloring captures the stoichiometry of the pathway. In graphs withedge coloring, a green edge represents one molecule of a species reacting or beingproduced. A blue edge represents the reaction or production of two molecules of agiven species.
3.3.4 Mining bipartite graphs for motifs
With author permission, we modified FANMOD, a program to search motifs in
graphs with node and edge coloring [136]. Bipartite graphs with edge coloring were
31
mined for motifs of size three-, four-, and five-nodes. Bipartite graphs without edge
coloring were mined for motifs of size six- and seven-nodes (due to software restric-
tions). To generate a background of 1000 random bipartite graphs, the ‘no regard’
background with regard to node and vertex coloring was used. FANMOD was modi-
fied to output the number of appearances of a subgraph in the original graph (corig),
the mean (cavg) and standard deviation (cstd) of the number of appearances of a
subgraph across the random background for all subgraph appearances. After min-
ing, subgraphs representing inert chemical pathways were removed (i.e. subgraphs
containing the network representation of A+B → A+B or 2A→ 2A were removed).
In order to identify subgraphs appearing with more or less frequency then expected
at random, a z-score for each subgraph was calculated in the following manner:
zi =corig − cavg
cstd(3.1)
where i represents subgraph i. In order to allow for comparison of motifs across
networks, a normalized z-score was calculated for each subgraph resulting in subgraph
z-scores ranging from -1 to 1 [77]. Subgraphs with a negative normalized z-score were
defined as underrepresented motifs and subgraphs with a positive normalized z-score
were defined as overrepresented motifs. Subgraphs with a z-score of zero did not
appear with any more and less frequency then what would be expected at random.
Motif IDs were generated by the FANMOD software [136].
3.4 Results
3.4.1 Original chemical motifs were captured by mining the transformed
bistable reaction configurations
Each ‘chemical motif’ in the original paper [103] had a bipartite graph repre-
sentation ( Figure 3.2). Motifs with six or more species and pathways were only
32
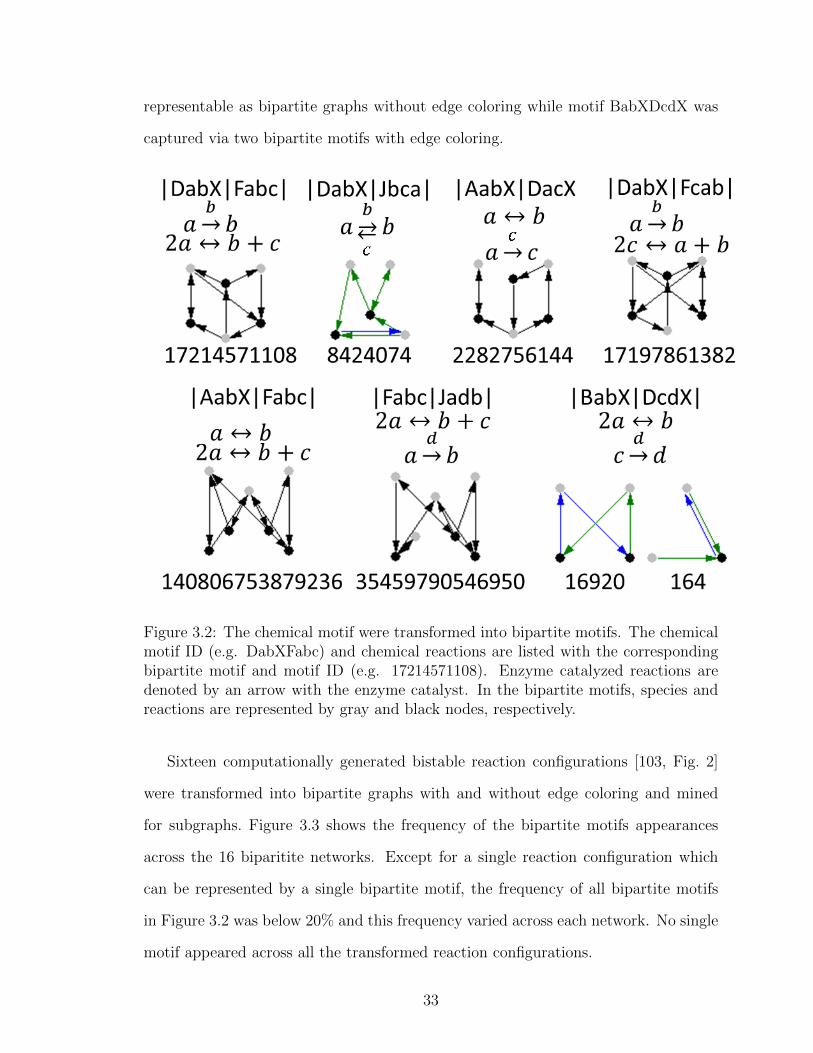
representable as bipartite graphs without edge coloring while motif BabXDcdX was
captured via two bipartite motifs with edge coloring.
Figure 3.2: The chemical motif were transformed into bipartite motifs. The chemicalmotif ID (e.g. DabXFabc) and chemical reactions are listed with the correspondingbipartite motif and motif ID (e.g. 17214571108). Enzyme catalyzed reactions aredenoted by an arrow with the enzyme catalyst. In the bipartite motifs, species andreactions are represented by gray and black nodes, respectively.
Sixteen computationally generated bistable reaction configurations [103, Fig. 2]
were transformed into bipartite graphs with and without edge coloring and mined
for subgraphs. Figure 3.3 shows the frequency of the bipartite motifs appearances
across the 16 biparitite networks. Except for a single reaction configuration which
can be represented by a single bipartite motif, the frequency of all bipartite motifs
in Figure 3.2 was below 20% and this frequency varied across each network. No single
motif appeared across all the transformed reaction configurations.
33

Figure 3.3: Frequency of bipartite motif appearing in the 16 transformed bistablereaction configurations. Motif 17214571108 appeared in the most networks. Thelast two motifs (16920 and 164) were required to appear together in a network tocorrespond to the original chemical motif ( Figure 3.2)
34
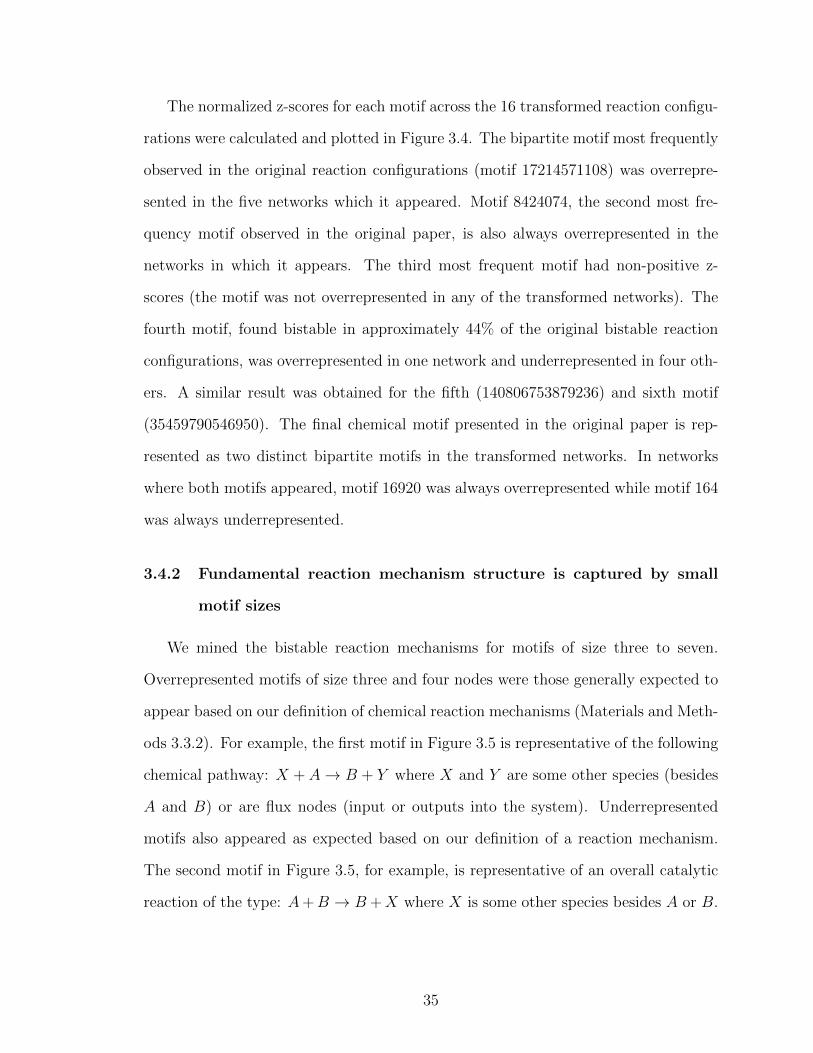
The normalized z-scores for each motif across the 16 transformed reaction configu-
rations were calculated and plotted in Figure 3.4. The bipartite motif most frequently
observed in the original reaction configurations (motif 17214571108) was overrepre-
sented in the five networks which it appeared. Motif 8424074, the second most fre-
quency motif observed in the original paper, is also always overrepresented in the
networks in which it appears. The third most frequent motif had non-positive z-
scores (the motif was not overrepresented in any of the transformed networks). The
fourth motif, found bistable in approximately 44% of the original bistable reaction
configurations, was overrepresented in one network and underrepresented in four oth-
ers. A similar result was obtained for the fifth (140806753879236) and sixth motif
(35459790546950). The final chemical motif presented in the original paper is rep-
resented as two distinct bipartite motifs in the transformed networks. In networks
where both motifs appeared, motif 16920 was always overrepresented while motif 164
was always underrepresented.
3.4.2 Fundamental reaction mechanism structure is captured by small
motif sizes
We mined the bistable reaction mechanisms for motifs of size three to seven.
Overrepresented motifs of size three and four nodes were those generally expected to
appear based on our definition of chemical reaction mechanisms (Materials and Meth-
ods 3.3.2). For example, the first motif in Figure 3.5 is representative of the following
chemical pathway: X +A→ B + Y where X and Y are some other species (besides
A and B) or are flux nodes (input or outputs into the system). Underrepresented
motifs also appeared as expected based on our definition of a reaction mechanism.
The second motif in Figure 3.5, for example, is representative of an overall catalytic
reaction of the type: A+B → B +X where X is some other species besides A or B.
35
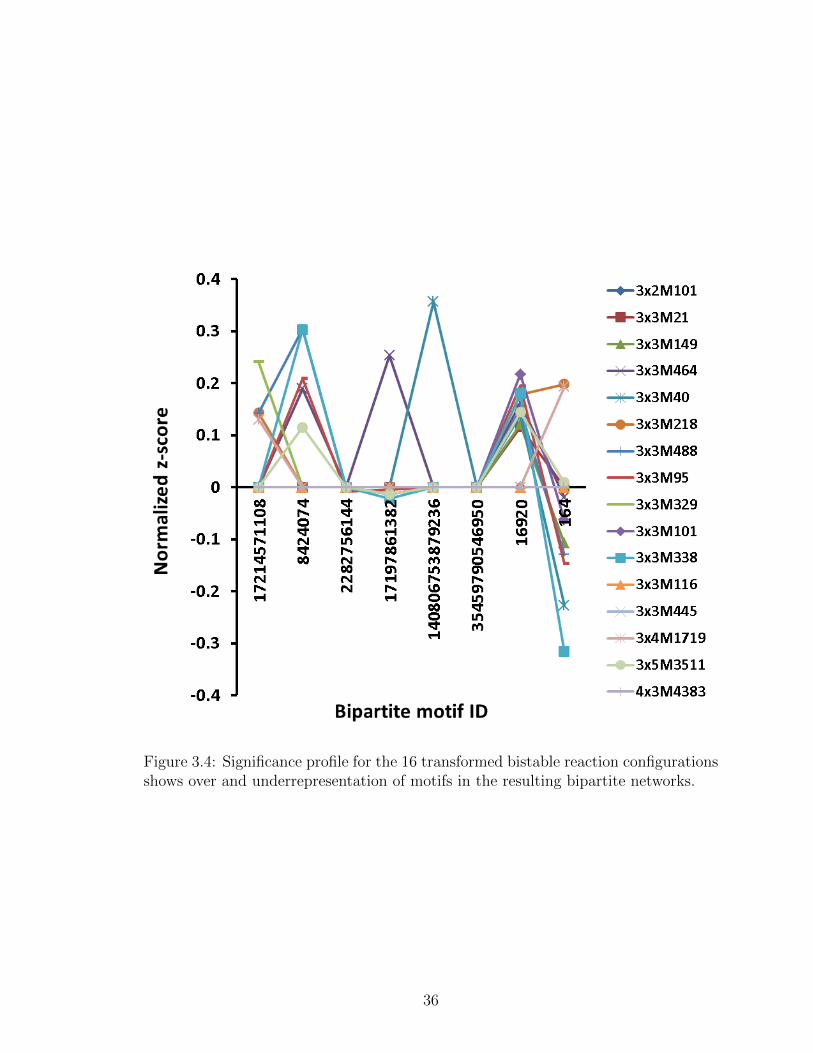
Figure 3.4: Significance profile for the 16 transformed bistable reaction configurationsshows over and underrepresentation of motifs in the resulting bipartite networks.
36
Figure 3.5: Normalized z-scores of three-node motifs for the 11 bistable mechanismstransformed into bipartite graphs with colored edges. Motifs appearing as over- orunderrepresented across the majority of networks are presented. Motifs discussed inthe text are pictured. The motif label is the motif ID assigned by FANMOD plus theadjacency matrix corresponding to the motif.
37

3.4.3 Identification of motifs underlying bistability
Figure 3.6: Motifs of size five nodes appearing in (A) all transformed bistable mech-anisms and (B) only in bistable mechanisms requiring edge coloring.
We mined the networks for motifs of size five and identified four motifs appearing
overrepresented across all networks ( Figure 3.6). The first motif (16646) is one in
which one species gives two different species in two different reactions. This is similar
to the single input motif (SIM) found in transcription networks where a single input
gives multiple outputs [3]. The second motif (67088) is a multiple input single output
(MISO) motif. In this motif, two separate species create a third species via two
separate chemical pathways. The third motif (532520) is similar to the second motif
where a single species received two inputs but this single species also acts as an input
38
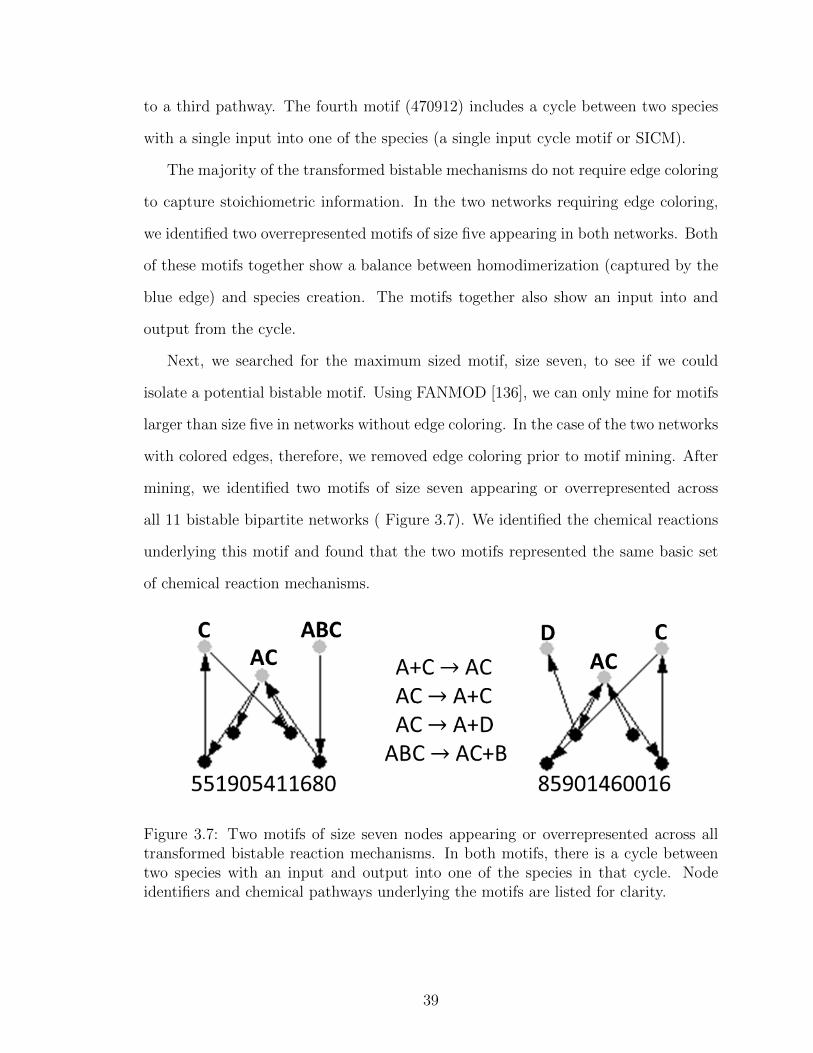
to a third pathway. The fourth motif (470912) includes a cycle between two species
with a single input into one of the species (a single input cycle motif or SICM).
The majority of the transformed bistable mechanisms do not require edge coloring
to capture stoichiometric information. In the two networks requiring edge coloring,
we identified two overrepresented motifs of size five appearing in both networks. Both
of these motifs together show a balance between homodimerization (captured by the
blue edge) and species creation. The motifs together also show an input into and
output from the cycle.
Next, we searched for the maximum sized motif, size seven, to see if we could
isolate a potential bistable motif. Using FANMOD [136], we can only mine for motifs
larger than size five in networks without edge coloring. In the case of the two networks
with colored edges, therefore, we removed edge coloring prior to motif mining. After
mining, we identified two motifs of size seven appearing or overrepresented across
all 11 bistable bipartite networks ( Figure 3.7). We identified the chemical reactions
underlying this motif and found that the two motifs represented the same basic set
of chemical reaction mechanisms.
Figure 3.7: Two motifs of size seven nodes appearing or overrepresented across alltransformed bistable reaction mechanisms. In both motifs, there is a cycle betweentwo species with an input and output into one of the species in that cycle. Nodeidentifiers and chemical pathways underlying the motifs are listed for clarity.
39
3.5 Discussion
The normalized z-scores for each motif across the 16 transformed reaction config-
urations were calculated and plotted in Figure 3.4. By comparing the original motifs
to a randomized background, we are able to obtain information about motif signifi-
cance. The top two most frequently observed chemical motifs (17214571108, 8424074
)are overrepresented in the networks in which they each appear. The results from
the normalized z-scores of the other motifs are less straightforward. The third most
frequent motif (2282756144, appearing in 44% of the original set of approximately
4500 bistable networks) was found to be underrepresented in one network suggesting
it is not necessarily important to bistable behavior in these networks. The fourth mo-
tif (17197861382) was found in approximately 41% of the original bistable reaction
configurations. This motif was underrepresented in four networks, again suggesting
the motif is not necessary for bistable behavior. We see similar inconclusive results
for motifs 5 (140806753879236) and motif 6 (35459790546950). The final chemical
motif presented in the original paper is represented as two distinct bipartite motifs
in the transformed networks. In networks where both motifs appeared, motif 16920
was always overrepresented while motif 164 was always underrepresented. Using the
normalized z-scores, we find that many of the motifs that are identified as appearing
more frequently across a set of bistable networks are not necessarily overrepresented
and can in fact be underrepresented in some networks.
These results speak to the spurious nature of using motif frequencies. Perhaps
motifs appearing with greater frequency across the original bistable reaction configu-
rations are a result of the inherent nature of the full set of reaction configurations. An
original set of twelve reactions were used to computationally generate the full config-
uration set. In a similar fashion, reaction mechanisms are generated based on a small
fundamental set of uni- and bi-molecular interactions producing a maximum of two
species. We identified motifs of size three that were overrepresented in our bistable
40
reaction mechanisms. The overrepresentation of a motif means that it appeared in
the original network. Several three-node motifs appeared with 100% frequency across
all eleven bistable mechanisms. These motifs are the bipartite graph representation
of some of the fundamental set of elementary chemical pathways found in all reac-
tion mechanisms (per our definition). These results indicate when analyzing bipartite
networks with colored edges, using motifs of size three and four nodes may aid in clas-
sifying networks by type (e.g. reaction mechanism versus overall reaction) but are
not necessarily useful in discriminating networks with different dynamical behaviors.
Additionally, these results highlight that the types of motifs identified in bistable
systems will differ based on the network classification. The ‘chemical motifs’ identified
as important to the bistable overall reaction configurations either were not identified
or were not overrepresented in the bistable chemical reaction mechanisms. The overall
reaction configurations have a topology very different from mechanisms which are
developed from elementary (uni- and bi-molecular) chemical pathways. An enzyme
catalyzed reaction mechanism includes an intermediate complex (E + S ↔ C →
P + E). In the original paper, some of the chemical reaction configurations assume
that the conversion from S to P through E is instantaneous and irreversible (E+S →
P + E). It has been shown that decomposing (‘unpacking’) overall reactions into a
set of intermediate elementary pathways results in the loss of bistable behavior [114].
One example of decomposing the bistable overall reaction configurations is presented
in the supplementary information of the original study [103].
The results of mining for five-node motifs show a balance that is required for input
and output from the cycle. For the two bistable systems requiring edge coloring to
capture all stoichiometric information, both overrepresented motifs contain cycles
between two species. The first motif (2692776208) has input into one species in the
cycle and the second motif (537399576) has output out of one of the cycle species.
Mapping back to the original chemical reaction mechanism, we find that the input
41

and output species are the same. Viewing these motifs in tandem, we see a balance
between a flux into and out of a species involved in a cycle.
In order to search for a potential bistable motif, we mined all transformed bistable
reaction mechanisms for motifs of seven nodes. The two motifs identified across all
bistable networks are actually two different representations of the same set of chemical
pathways, only the node identifiers are different. Due to software limitations, we were
only able to search for a maximum of seven-node motifs in networks with two node
colors (bipartite networks). We expect that once software capable of searching for a
motif of ten nodes (four reactions and the six species A, B, C, D, AC, and ABC)
within a bipartite graph is available, a single motif will be identified across all eleven
transformed bistable reaction mechanisms.
3.6 Conclusion
Our novel methodology to search for motifs in chemical reaction systems was suc-
cessful in obtaining motifs from the bistable systems presented in the systematic study
by Ramakrishnan and Bhalla [103]. We found that using frequencies of motifs across
networks of a particular dynamical behavior can give spurious results. By comparing
subgraph appearances to a randomized background, we were able to pinpoint some
motifs identified as ‘motifs in bistable switches’ to be underrepresented in some of the
bistable reaction configurations. On the one hand, these motifs may not be important
to bistable behavior in these minimal systems. On the other hand, motifs underrep-
resented across all bistable reaction configurations may point to possible means to
break bistability. Including these underrepresented motifs into a bistable reaction
configuration could lead to a loss of bistable behavior (a loss of function motif).
As far as we know, applying a bipartite graph transformation to elementary chem-
ical reaction mechanisms and mining these networks using motif mining software is
novel. Using motif information, we found that each bistable network in our sample
42
requires that a cycle between two species be present. Each network also requires an
input to one node in the cycle as well as an output from the same node in that species.
While the cycle retains a balance between the two species concentrations, the influx
into and outflux out of one species allows the steady state concentration to change
while keeping the concentration from increasing to a maximum. This novel bipartite
motif information points to specific chemical pathway combinations that may be im-
portant bistability. Using bipartite motifs found in the bistable mechanisms analyzed
here, we may be able to predict bistability in large systems where the dynamical
behavior is often unknown. Additionally, we hope that these results will encourage
additional motif mining algorithm and software development to search for single mo-
tifs driving bistability. In the next chapter, we use the network transformation and
motif mining described here to characterize aggregation and make predictions about
dynamical behavior of aggregation systems.
43
CHAPTER IV
Motifs characterizing protein aggregation
mechanisms and dynamics
4.1 Introduction
Over the last half century, mathematical modeling has been employed to study
protein misfolding and aggregation. To date, there are a few mathematical models
which can describe the threshold of protein misfolding and aggregation in confor-
mational and prion diseases as a bistable system [107, 54, 61]. These models are
phenomenological, however, and do not explain the threshold for protein aggregation
in a mechanistic manner [58]. Additionally, there is no agreed upon universal mecha-
nism of aggregation [16]. Current mechanistic models generally describe aggregation
due activation of a monomer (e.g. a protein misfolds). This is the major hypothesized
proximal event initiating aggregation in conformational disease.
Mechanistic models of protein aggregation are often classified based on qualita-
tively characteristics such as dimerization or monomer addition. In a recent review of
known models of protein aggregation, five categories of protein aggregation are listed:
(1) subsequent monomer addition, (2) reversible association, (3) prion aggregation,
(4) “Ockhams razor”/minimalistic 2-step model and (5) quantitative structure activ-
ity relationship models [82] (see Chapter II). These classifications do not include any
44
information about dynamical behavior; this information is important to describe the
protein misfolding and aggregation threshold phenomena.
The evidence discussed in Chapter III regarding bistability are based on the com-
putational creation of different types of chemical networks. A natural next line of
investigation is how relating these findings to aggregation mechanisms. Are there
reactions present in the above bistable networks that also exist in mechanisms of
protein aggregation? As discussed in Chapter II, there are few mechanistic models
of threshold behavior in protein aggregation. One of the only mechanistic bistable
models of protein aggregation was developed by Rieger et al. [107]. In this closed
model, protein aggregation occurs through the addition of unfolded protein to create
oligomers (of up to three monomers in size). While the total oligomer size is only
three, this model is one of the first to capture toxic protein aggregation threshold
via bistability using mass-action kinetics. Molecular chaperones are primary actors
in the model, aiding in folding and disaggregation processes. These are mechanistic
interactions, providing further insight into reaction mechanisms underlying the bista-
bility captured by this model. In this model, after dimerization, aggregate formation
is more thermodynamically favored. This introduces a positive feedback through the
parameters instead of directly through the mechanism, highlighting how both reaction
topology and parameter values impact dynamical behavior.
More comprehensive theoretical mechanistic studies of protein aggregation would
increase our understanding of toxic protein aggregation threshold phenomena as well
as the system properties underlying threshold phenomena in general. With a devel-
oped set of mechanisms capable of threshold phenomena in protein aggregation, we
might be able to identify the key reactions important for the dynamical behavior.
In this chapter, we present the use of network motifs (described in Chapter III) to
quantitatively characterize aggregation mechanisms. Specifically, we employ overrep-
resented motifs to classify published protein aggregation models. Second, we predict
45
aggregation mechanisms are (and are not) capable of threshold phenomena through
bistability. Finally, we present AggMod, an online repository of characterized macro-
scopic models of protein aggregation. Gaining knowledge of aggregation model mech-
anism and dynamical behavior is an important step in step in the development of
successful therapeutic strategies to modulate conformational diseases.
4.2 Materials and Methods
4.2.1 Creation of a library of protein aggregation mechanisms and net-
works
We first defined mechanisms as a complete list of the intermediate steps in protein
misfolding and aggregation. Each step in the mechanism must be an elementary
reaction, solely comprised of uni and/or bimolecular reactions. To obtain published
mechanisms of protein aggregation, literature searches were performed using PubMed
[36], Google Scholar [43], and Web of Knowledge [106]. Examples of search terms
used include ‘protein aggregation mechanism’, ‘kinetic mechanism aggregation’, and
‘mathematical model protein aggregation.’ .
Found mechanisms were transformed in bipartite networks with edge coloring (a
one-to-one transformation) using the procedure described in Chapter III. Redun-
dant networks could also be identified applying a change of variables in the origi-
nal mechanisms. For example, a published mechanism could contain the reaction
A + B → AB where A represents an unfolded protein, B represents a misfolded
protein, and AB represents the heterodimer of unfolded and misfolded protein. A
separate published mechanism could contain the reaction N+A→ NA where N rep-
resents a non-aggregation-prone protein, A represents an aggregation-prone protein,
and NA represents the heterodimer resulting from association of N and A. After
change of variable in the two mechanisms (A and N to U and B and A to M , re-
46
spectively), the resulting reaction is U + M → UM . All redundant networks were
removed from the network set prior to motif mining.
4.2.2 Motif mining and clustering
Bipartite networks with edge coloring were mined for motifs of size four and five
nodes and bipartite networks without edge coloring were mined for motifs of size
six and seven nodes using the method in Chapter III. Briefly, pairwise correlations
between the various networks were calculated using normalized z-scores based on
motifs of size four nodes. A normalized z-score ranged from -1 to 1, where a negative
normalized z-score described an ‘underrepresented’ motif and a positive normalized
z-score described an ‘overrepresented’ motif. Motif mining results for five, six and
seven node motifs were used to make threshold predictions.
4.2.3 Creation of an online repository
The library of protein aggregation mechanisms and networks (Section 4.2.1) were
stored in a MySQL database accessible through a public web-interface at
http://aggmod.ccmb.med.umich.edu. Each model describing the aggregation mecha-
nism was implemented and curated in Berkeley Madonna [72] and/or Mathematical
Modeling Language (MML) [105]. These implemented models were curated and an-
notated to meet Minimal Information Requested In the Annotation of biochemical
Models (MIRIAM) standards [85]. Four levels of curation were used (zero through
three). A model was given a curation level of zero when the peer-reviewed, published
paper describing the model into the repository. The model was moved to status one
after a curator implemented the model in a given format (e.g. Berkeley Madonna
or MML). A curation status of two was achieved when a curated checked a model
and determined it to be consistent with the published paper. A model reached sta-
tus three when is was checked for typographical errors, completeness (parameters,
47

equations, mass conservation and physical constrains), and unit consistency. If the
curated model differed from the published model, due to errors introduced into the
model during the publication process or missing information (e.g. parameter values
or initial conditions), the model was annotated describing these additions.
4.3 Results and Discussion
4.3.1 Unique mechanisms were found in less than a fifth of published
modeling papers
After searching the protein aggregation literature, we identified 120 published
mathematical models of protein aggregation for 29 different proteins ( Figure 4.1).
Not all of the papers contained a mechanistic description underlying the presented
system of ordinary differential equations. After removing those models without an
associated mechanism, 53 published models remained. The resulting 53 mechanisms
were transformed into bipartite graphs (i.e networks) with edge coloring. Of these 53
networks, 35 were redundant (duplicate) networks. Our final set of bipartite networks
based on published mechanisms of protein aggregation numbered 18 describing 29
different proteins ( Table 4.1).
Redundant networks often appeared as multiple papers applied the same mecha-
nisms to model aggregation of a particular protein. For example, Buswell and Mid-
delberg [12] published a model of lysozyme protein aggregation (M2). A year later,
Dong et al. [26] published a model describing lysozyme aggregation using the same
mechanism. Several years after these two groups published, M et al. [71] published a
paper on lysozyme aggregation based on the original paper by Buswell and Middelberg
[12]. All three models are built upon the same mechanism resulting in three identical
networks developed from the original set of 54 mechanisms.
From the network pairwise correlations using four node motifs, we found that all of
48
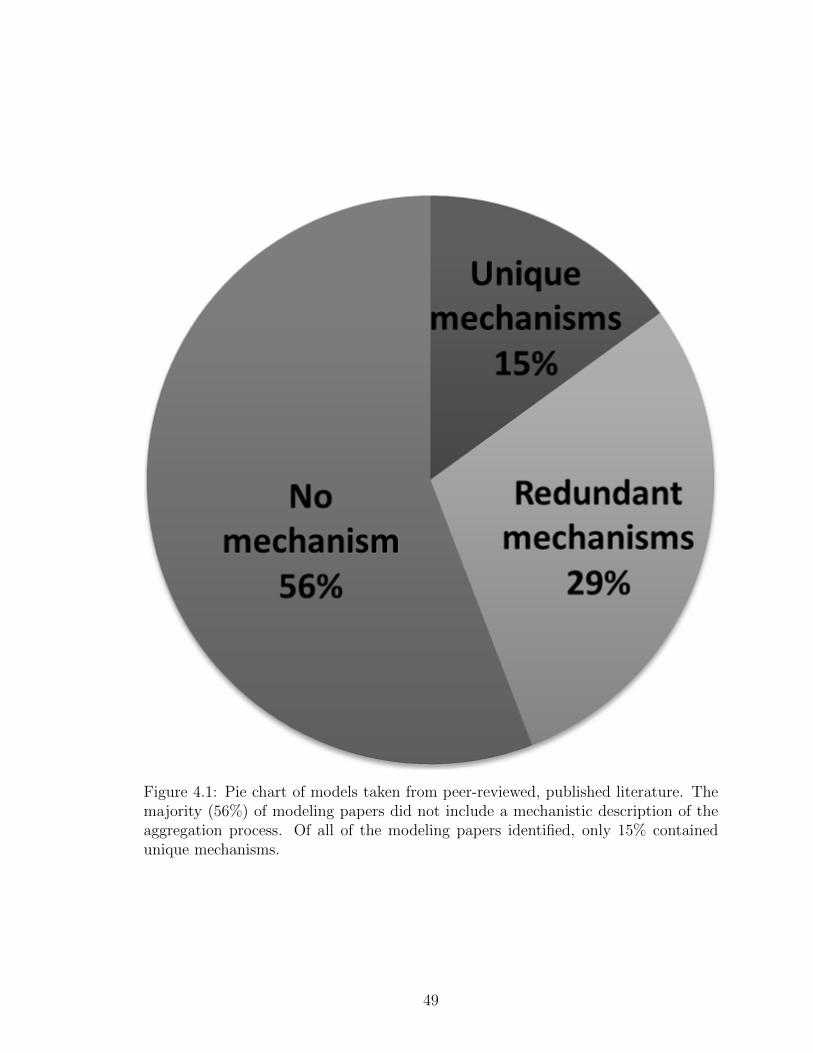
Figure 4.1: Pie chart of models taken from peer-reviewed, published literature. Themajority (56%) of modeling papers did not include a mechanistic description of theaggregation process. Of all of the modeling papers identified, only 15% containedunique mechanisms.
49
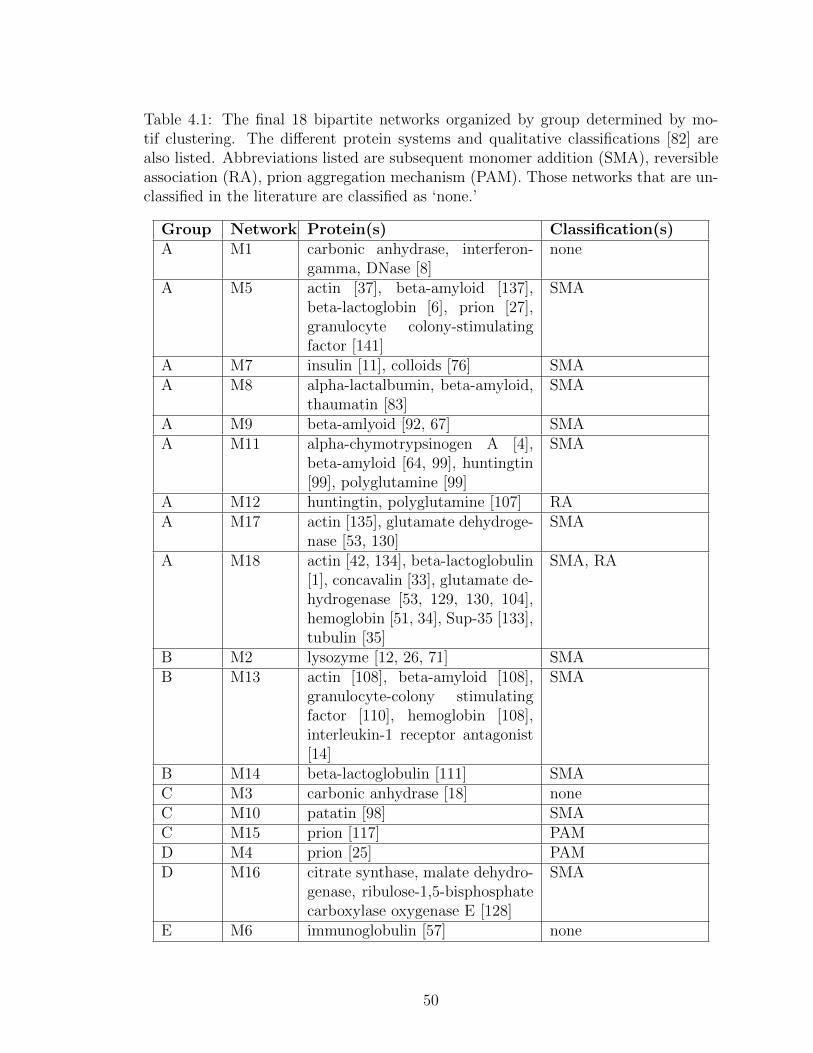
Table 4.1: The final 18 bipartite networks organized by group determined by mo-tif clustering. The different protein systems and qualitative classifications [82] arealso listed. Abbreviations listed are subsequent monomer addition (SMA), reversibleassociation (RA), prion aggregation mechanism (PAM). Those networks that are un-classified in the literature are classified as ‘none.’
Group Network Protein(s) Classification(s)A M1 carbonic anhydrase, interferon-
gamma, DNase [8]none
A M5 actin [37], beta-amyloid [137],beta-lactoglobin [6], prion [27],granulocyte colony-stimulatingfactor [141]
SMA
A M7 insulin [11], colloids [76] SMAA M8 alpha-lactalbumin, beta-amyloid,
thaumatin [83]SMA
A M9 beta-amlyoid [92, 67] SMAA M11 alpha-chymotrypsinogen A [4],
beta-amyloid [64, 99], huntingtin[99], polyglutamine [99]
SMA
A M12 huntingtin, polyglutamine [107] RAA M17 actin [135], glutamate dehydroge-
nase [53, 130]SMA
A M18 actin [42, 134], beta-lactoglobulin[1], concavalin [33], glutamate de-hydrogenase [53, 129, 130, 104],hemoglobin [51, 34], Sup-35 [133],tubulin [35]
SMA, RA
B M2 lysozyme [12, 26, 71] SMAB M13 actin [108], beta-amyloid [108],
granulocyte-colony stimulatingfactor [110], hemoglobin [108],interleukin-1 receptor antagonist[14]
SMA
B M14 beta-lactoglobulin [111] SMAC M3 carbonic anhydrase [18] noneC M10 patatin [98] SMAC M15 prion [117] PAMD M4 prion [25] PAMD M16 citrate synthase, malate dehydro-
genase, ribulose-1,5-bisphosphatecarboxylase oxygenase E [128]
SMA
E M6 immunoglobulin [57] none
50
the networks within our library are all closely related ( Figure 4.2). The fact that the
networks are closely correlated is in part due to more recent mechanisms being based
on those previously appearing in the literature. The original lysozyme network (M2
in class B) by Buswell and Middelberg [12] is partially based upon a model (M3 in
class C) by Cleland et al. [18] used to model carbonic anhydrase. Another member of
class B, is network (M13) by Roberts [108] proposed to describe actin, beta-amyloid,
and hemoglobin aggregation mechanisms. The Cleland et al. [18] study is also cited in
Roberts [108]. Along with the motif information, this lends evidence that the Cleland
et al. [18] network - develop to model carbonic anhydrase - is a common ancestor of
the Buswell and Middelberg [12] and Roberts [108] networks describing aggregation
mechanisms of four additional proteins.
4.3.2 Aggregation models were classified into six groups
Using the motif normalized z-scores, the set of unique aggregation networks clus-
tered into five groups. As some of the agregation networks had a small number of
nodes and edges, a four-node motif was the largest motif available to cluster without
reducing the sample size. We then identified overrepresented motifs found in each
cluster. Two overrepesented motifs occurred in all networks. These motifs are to be
expected in mass action networks and were observed across other non-aggregation
networks based on reaction mechanisms (e.g the bistable networks in Chapter III).
Published papers of aggregation models from our original sample without a mecha-
nism were organized into the sixth group.
The first group of networks, A, contained nine networks and was by far the largest
class, containing 50% of the total sample set. All networks in group A contain an over-
represented reversible protein conformation change motif. Additionally, all networks
in this group (save the smallest network, M1) have an overrepresented reversible iso-
mer addition motif. Finally, eight of ten networks contain a conformational change
51
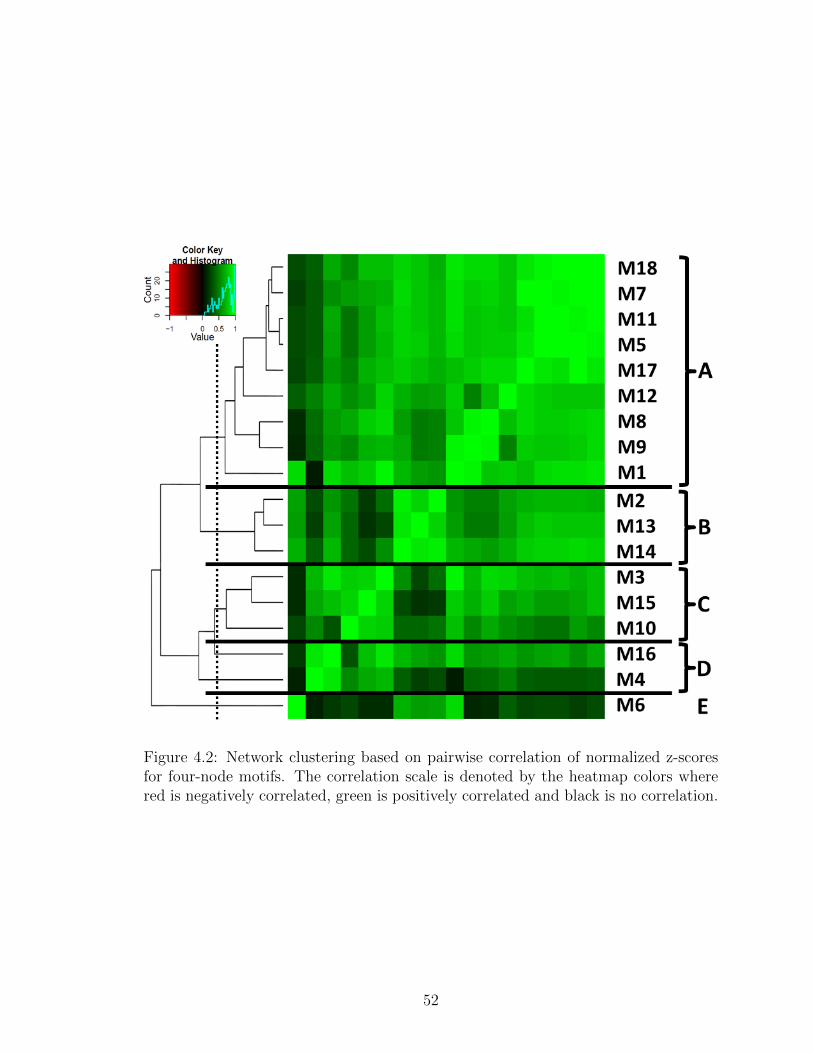
Figure 4.2: Network clustering based on pairwise correlation of normalized z-scoresfor four-node motifs. The correlation scale is denoted by the heatmap colors wherered is negatively correlated, green is positively correlated and black is no correlation.
52
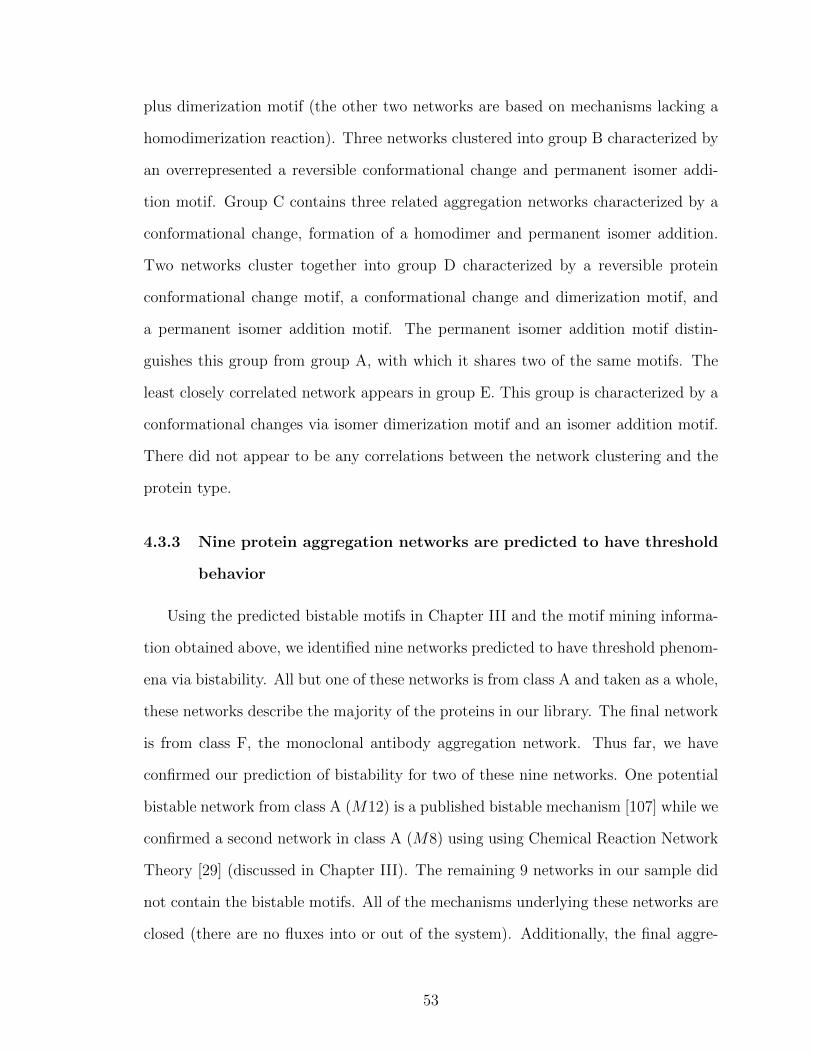
plus dimerization motif (the other two networks are based on mechanisms lacking a
homodimerization reaction). Three networks clustered into group B characterized by
an overrepresented a reversible conformational change and permanent isomer addi-
tion motif. Group C contains three related aggregation networks characterized by a
conformational change, formation of a homodimer and permanent isomer addition.
Two networks cluster together into group D characterized by a reversible protein
conformational change motif, a conformational change and dimerization motif, and
a permanent isomer addition motif. The permanent isomer addition motif distin-
guishes this group from group A, with which it shares two of the same motifs. The
least closely correlated network appears in group E. This group is characterized by a
conformational changes via isomer dimerization motif and an isomer addition motif.
There did not appear to be any correlations between the network clustering and the
protein type.
4.3.3 Nine protein aggregation networks are predicted to have threshold
behavior
Using the predicted bistable motifs in Chapter III and the motif mining informa-
tion obtained above, we identified nine networks predicted to have threshold phenom-
ena via bistability. All but one of these networks is from class A and taken as a whole,
these networks describe the majority of the proteins in our library. The final network
is from class F, the monoclonal antibody aggregation network. Thus far, we have
confirmed our prediction of bistability for two of these nine networks. One potential
bistable network from class A (M12) is a published bistable mechanism [107] while we
confirmed a second network in class A (M8) using using Chemical Reaction Network
Theory [29] (discussed in Chapter III). The remaining 9 networks in our sample did
not contain the bistable motifs. All of the mechanisms underlying these networks are
closed (there are no fluxes into or out of the system). Additionally, the final aggre-
53
Figure 4.3: Classification of aggregation bipartite networks with edge coloring usingfour-node motifs. Examples of chemical reactions underlying each motif are given.∗In class A, two networks did not have a dimerization event and a third network didnot have a monomer addition event. Abbreviations: reverse conformational change(RCC), reversible isomer addition (RIA), permanent isomer addition (PIA), reversibleconformational change (RCC), permanent conformational change (PCC), homodimer-ization (D), heterodimerization (HD)
54

gation step(s) are irreversible. At steady state, all species in these mechanisms will
have been converted to aggregates.
4.3.4 Models and networks are stored in AggMod, a repository of protein
Aggregation Models
Figure 4.4: Screenshot of search results for ‘actin.’ The AggMod website is availablefor free use at http://aggmod.ccmb.med.umich.edu.
Protein aggregation models derived from published, peer-reviewed papers, asso-
ciated mechanism, network (when available), and classification were organized into
AggMod, an online repository ( Figure 4.4). Models were implemented in Berke-
ley Madonna [72] and MML [105]. Berkeley Madonna is inexpensive, runs on both
Windows and Mac OS, and employs a user interface that allows utilization by non-
experts in mathematical and computational modeling. After downloading Berkeley
Madonna, users can upload time series data into a particular model and fit data to
55
the model. Models implemented in Berkeley Madonna are provided with parameter
sliders so that users can easily manipulate model parameters and obtain instant sim-
ulation results. Also, Berkeley Madonna has a built-in sensitivity analysis package
allowing users to quantify a given parameter’s influence on a system variable. (A free
version of Berkeley Madonna can be also be downloaded. This version includes all of
the functionality of the full version except models cannot be saved, graphs and tables
cannot be saved or copied and a watermark appears on all printouts.)
For users who only want to simulate the model and/or who cannot or do not
want to download extra software, models are also implemented in MML [105]. These
models run within the web browser using the JSim Java program housed on a server.
JSim reads XML formatted models and therefore allows for a more direct conversion
to other XML languages such as CellML and SBML. Code for models in these formats
are added as it becomes available.
Curation and annotation is important to the sharing and reuse of mathematical
models. Therefore, models in the AggMod repository undergo annotation in an effort
to meet MIRIAM standards. These standards provide guidelines for curation and
annotation of computational models related to reference correspondence, attribution
annotation and external resource annotation [85]. Each model has an individual web
page based on a single reference and includes a reaction schematic (when available)
for easy mapping of the model to the biological processes. The model web page
links to the file(s) implementing the model in public machine-readable format(s).
Additionally, each model file is annotated with the following information in order
to comply with MIRIAM standards: a model name based on the model reference, a
digital object identifier (DOI), name and contact information of the model encoder(s),
the date and time of creation, the date and time of the last modification and a
statement about the terms of distribution.
The AggMod repository provides a centralized location for models of macroscopic
56
mechanisms of protein aggregation. As far as we are aware, these models are not cur-
rently available in any other online databases. The site can be searched based on the
model name, abstract, original paper authors, title, network, classification, or protein
name. Models within the repository can also be browsed by protein or classification.
All models in AggMod are in the public domain and are freely distributable.
4.4 Conclusion
We have developed a library of 120 published protein aggregation models and
mechanisms modeling 29 unique protein systems. After transforming these mech-
anisms into networks, we identified overrepresented motifs and classified the ag-
gregation models into six groupings (the sixth class containing all models without
networks). We characterized the five groups of networks using motif information,
creating, as far as we are aware, the first quantitative classification of aggregation
mechanisms. We found that the networks were very similar in nature and the ma-
jority of networks were found within one class. We identified a potential bias in
the protein aggregation literature, perhaps due to new mechanisms being based on a
handful of unique published mechanisms. In order to address this bias in future ag-
gregation mechanism development, we propose the following alternative approaches.
The first approach is to use the motifs identified here as the core motifs when building
a network and then expand based on experimental data. The second approach is to
generate aggregation networks that do not use these core motifs but are still based
on experimental data.
Additionally, we successfully predicted threshold phenomena for two of nine pre-
dicted bistable networks in our library using bistable motif information. The re-
maining networks predicted to not have threshold phenomena via bistability were
determined to be monostable. It is still possible that these networks can manifest
threshold phenomena through a monostable switch-like response (Chapter II). We
57
are currently developing a methodology to assess dynamical behavior of the remaining
seven aggregation networks predicted to have threshold phenomena via bistability.
The aggregation models, mechanisms and networks are stored in an online repos-
itory: AggMod. Systems biologists have successfully created model repositories in
specific areas: the BioModels Database [86] is a repository of quantitative kinetic
models of biochemical and cellular systems, JWS Online [87] is a model repository of
kinetic models of biochemical pathways with a web-based simulation tool and Mod-
elDB [49] is a repository of computational neuroscience models. The stored models
in these repositories are derived from published, peer-reviewed papers. The AggMod
repository provides a centralized location for models of macroscopic mechanisms of
protein aggregation. As far as we are aware, these models are not currently avail-
able in any other online databases. These structured, human and computer readable
files allow AggMod to be a useful resource to both experimentalists and theoreticians
interested in mathematical models of protein aggregation. Additionally, by quantita-
tively classifying aggregation models in the AggMod library using chemical reaction
motifs, we hope to aid in future development of testable mechanisms towards the
ultimate goal of mitigating protein aggregation.
58
CHAPTER V
A model of threshold behavior reveals rescue
mechanisms of bystander proteins in
conformational diseases
5.1 Introduction
In Chapter III, we identified specific motifs important to bistability in bistable
mechanisms. We followed with an identification of motifs important to aggregation
and used this information to classify aggregation (Chapter IV). Along with inter-
actions (motifs) occurring in an aggregation mechanism, kinetic parameters are also
important to the dynamical behavior of a mechanism [45, 121]. Experimental evidence
suggests misfolded isomer or aggregate protein concentration can exhibit bistability
with changes in temperature [75], pressure [31], and pH [41]. There is also evidence
of guanidinium chloride concentration dependent bistability in the transition between
unfolded and folded transthyretin protein states [60].
Evidence suggests that misfolded proteins can interact with bystander isomers to
elicit a misfolded phenotype [40]. A bystander protein is one that, in the absence of
misfolded proteins, will be routed to its normal physiological pathway. The bystander
protein pool is composed of the unfolded isomers and native (folded) proteins. In the
presence of misfolded proteins, bystander proteins misfold resulting in decreased na-
59

tive protein levels and increased levels of protein aggregation [40]. This phenomenon
has recently been characterized in the autosomal dominant Mutant INS-gene Induced
Diabetes of Youth [68, 50, 69].
To date there are few mathematical models which can describe the threshold of
protein misfolding or aggregation in conformational diseases as a bistable system
[107, 54, 61, 97]. Generalizations of the Smoluschowski’s theory of coagulation have
been applied to investigate protein polymerization and aggregation [19]. However,
these models do not explain the threshold for protein misfolding or aggregation in a
mechanistic manner [58].
The lack of mechanistic models in the literature is not unexpected since exper-
imental determination of protein misfolding or aggregation pathways is technically
demanding [16]. A major difficultly lies in obtaining accurate characterization of
the diverse, short-lived intermediate misfolded and aggregate isomers that may oc-
cur during formation of both polymorphous and highly structured aggregates (“fib-
rils”). An alternative to focusing on the mechanism of misfolding or aggregation
itself is to investigate the progression of cellular dysfunction from the perspective of
bystander protein production. The bystander protein pool can be detected experi-
mentally through nonreducing Tris-Tricine-urea-SDS-PAGE if the misfolded protein
is the result of disulfide mispairing [140, 66, 67]. Loss-of-function diseases are char-
acterized by a reduction in native protein levels, which could be caused by protein
misfolding. Understanding the mechanisms that deplete bystander protein levels will
be important in the search for therapeutic interventions aimed at controlling confor-
mational diseases.
In this chapter, we present a general model describing the bystander protein dis-
appearance (loss-of-function) through direct or indirect interaction with misfolded
protein to explore threshold behavior in conformational diseases. Our model also
describes the production of misfolded isomers, which makes it applicable to investi-
60

gate toxic gain-of-function in conformational diseases. We find that a mathematical
formulation of our model can exhibit the threshold behavior typically found in some
conformational diseases. The threshold behavior is explained by the appearance of
bistability in our mathematical model. Furthermore, we find that bistability is a
function of two parameters: the bystander isomer residence time in the endoplasmic
reticulum lumen and the ratio of the basal inflow rates of misfolded to bystander
protein. We also derive the necessary conditions for the manifestation of the thresh-
old behavior based on this ratio and the order of the reaction with respect to the
misfolded and bystander isomers. After analyzing our model, we propose three mech-
anisms to rescue bystander protein in conformational diseases. Our results provide
mechanistic insight into the threshold behavior in conformational diseases and open
potential therapeutic avenues to regulate conformational diseases.
5.2 Model
5.2.1 A model of bystander protein disappearance in the presence of
misfolded protein
We model the process of protein production and folding in the endoplasmic retic-
ulum (ER) lumen as occurring within a continuous flow reactor ( Figure 5.1). In our
model, there is a continuous flow of the recently synthesized conformational isomers,
the bystander N and misfolded M proteins, which is the direct result of basal protein
synthesis and depletion [44, 48]. Under normal conditions, bystander and misfolded
proteins inflow with the constant basal rates [N0]/tN and [M0]/tM , respectively. [N0]
and [M0] represent, respectively, the basal concentrations of bystander and misfolded
protein. ti is the ER residence time of isomer i. Bystander unfolded isomers are de-
pleted through the ER-assisted folding pathway, while the bystander folded protein is
exported from the ER [5]. On the other hand, misfolded proteins are depleted from
61

the ER, either through ER-assisted degradation [84] or protein translocation [59]. We
assume that the rate of these outflow processes is of first-order kinetics. Therefore, the
system of differential equations governing the bystander N and misfolded M isomer
concentration in the ER lumen is:
d[N ]
dt=
[N0]− [N ]
tN−R([N ], [M ]) (5.1)
d[M ]
dt=
[M0]− [M ]
tM+R([N ], [M ]), (5.2)
where R([N ], [M ]) is the reaction rate between bystander and misfolded proteins.
Note that we are denoting concentration with square brackets.
In the next subsection we discuss the determination of the reaction rateR([N ], [M ])
between the bystander and misfolded proteins.
5.2.2 A general mechanism of bystander and misfolded protein interac-
tion in conformational diseases
The irreversible aggregation typical of conformational diseases is highly sensitive
to protein conformation. The misfolded protein pool (M) encompasses nonnative de-
natured and misfolded isomers. This pool is aggregation prone due to the exposure of
hydrophobic groups and disulfide bonds, which can result in strong, and irreversible
protein-protein contacts [18]. Therefore, there is compelling biochemical evidence
suggesting that the misfolded isoforms are responsible for the onset of certain confor-
mational diseases [82].
Protein aggregation is initiated by the reversible aggregation of misfolded isomers,
M , followed by structural rearrangements. These rearrangements lead to the forma-
tion of an intermediate committed to the aggregation pathway [109, 82]. Protein
aggregation proceeds as more misfolded isomers are committed to the aggregation
62

Figure 5.1: Schematic diagram of a continuous flow reactor model of the endoplas-mic reticulum lumen (ER). In this model, the bystander protein pool, composed ofunfolded and folded isomers, has an inflow rate of [N0]/tN , where [N0] is the basalbystander protein concentration and tN is the bystander ER residence time. The mis-folded protein has an inflow rate equal to [M0]/tM , where [M0] is the basal misfoldedprotein concentration and tM is the misfolded ER residence time. Bystander andmisfolded proteins interact with reaction rate R([N ], [M ]) which is a function of thebystander and misfolded protein concentrations. The outflow rate of bystander andmisfolded proteins follows first-order kinetics. The outflow of isomers is driven by theER-assisted folding (ERAF), ER-assisted degradation (ERAD), protein export andtranslocation pathways.
63
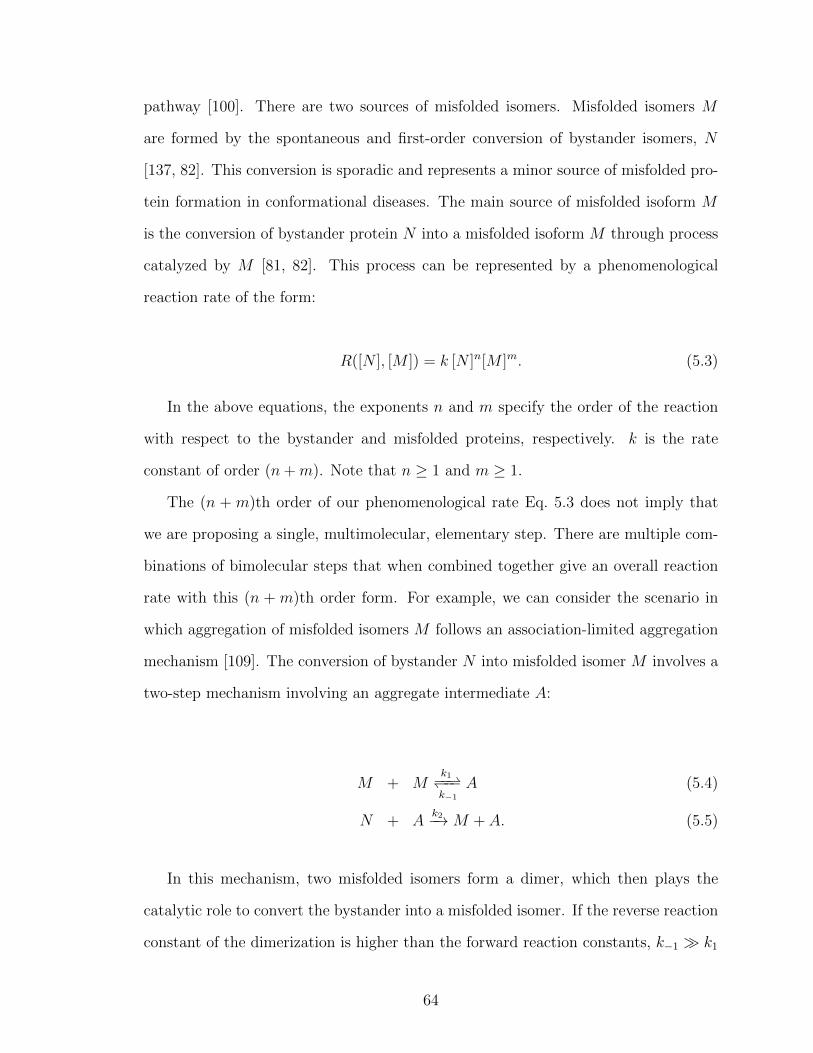
pathway [100]. There are two sources of misfolded isomers. Misfolded isomers M
are formed by the spontaneous and first-order conversion of bystander isomers, N
[137, 82]. This conversion is sporadic and represents a minor source of misfolded pro-
tein formation in conformational diseases. The main source of misfolded isoform M
is the conversion of bystander protein N into a misfolded isoform M through process
catalyzed by M [81, 82]. This process can be represented by a phenomenological
reaction rate of the form:
R([N ], [M ]) = k [N ]n[M ]m. (5.3)
In the above equations, the exponents n and m specify the order of the reaction
with respect to the bystander and misfolded proteins, respectively. k is the rate
constant of order (n+m). Note that n ≥ 1 and m ≥ 1.
The (n + m)th order of our phenomenological rate Eq. 5.3 does not imply that
we are proposing a single, multimolecular, elementary step. There are multiple com-
binations of bimolecular steps that when combined together give an overall reaction
rate with this (n + m)th order form. For example, we can consider the scenario in
which aggregation of misfolded isomers M follows an association-limited aggregation
mechanism [109]. The conversion of bystander N into misfolded isomer M involves a
two-step mechanism involving an aggregate intermediate A:
M + Mk1−−⇀↽−−k−1
A (5.4)
N + Ak2−→M + A. (5.5)
In this mechanism, two misfolded isomers form a dimer, which then plays the
catalytic role to convert the bystander into a misfolded isomer. If the reverse reaction
constant of the dimerization is higher than the forward reaction constants, k−1 � k1
64
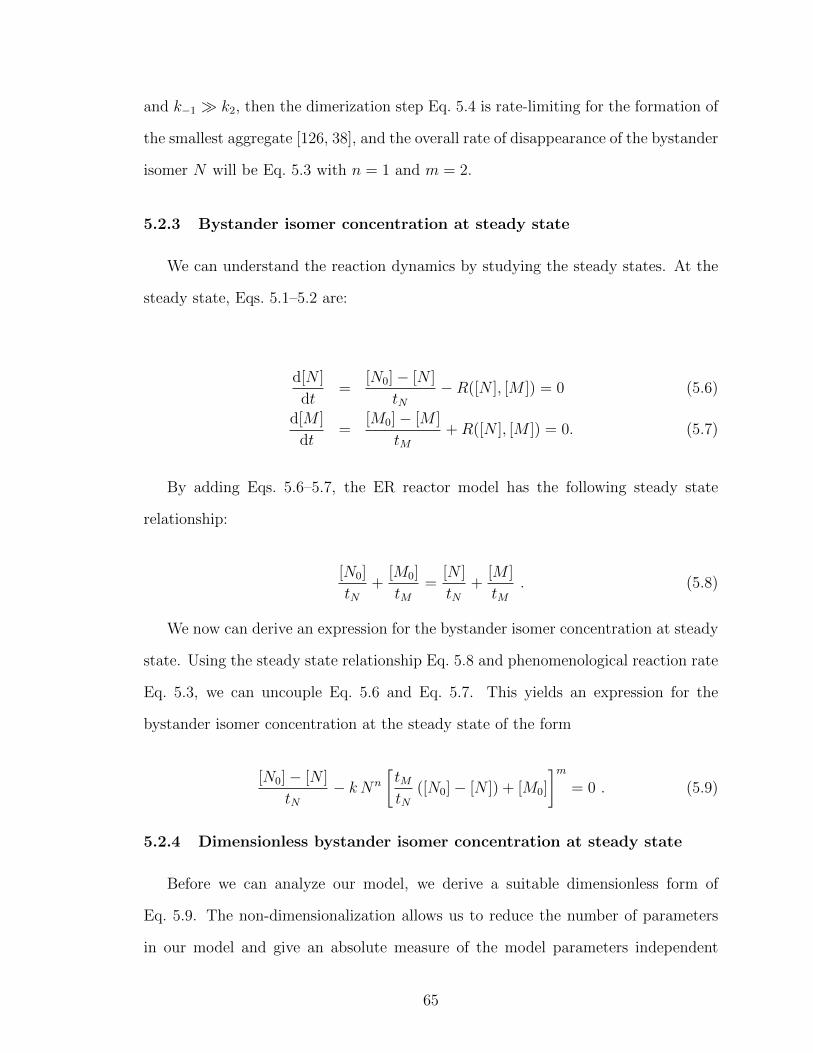
and k−1 � k2, then the dimerization step Eq. 5.4 is rate-limiting for the formation of
the smallest aggregate [126, 38], and the overall rate of disappearance of the bystander
isomer N will be Eq. 5.3 with n = 1 and m = 2.
5.2.3 Bystander isomer concentration at steady state
We can understand the reaction dynamics by studying the steady states. At the
steady state, Eqs. 5.1–5.2 are:
d[N ]
dt=
[N0]− [N ]
tN−R([N ], [M ]) = 0 (5.6)
d[M ]
dt=
[M0]− [M ]
tM+R([N ], [M ]) = 0. (5.7)
By adding Eqs. 5.6–5.7, the ER reactor model has the following steady state
relationship:
[N0]
tN+
[M0]
tM=
[N ]
tN+
[M ]
tM. (5.8)
We now can derive an expression for the bystander isomer concentration at steady
state. Using the steady state relationship Eq. 5.8 and phenomenological reaction rate
Eq. 5.3, we can uncouple Eq. 5.6 and Eq. 5.7. This yields an expression for the
bystander isomer concentration at the steady state of the form
[N0]− [N ]
tN− k Nn
[tMtN
([N0]− [N ]) + [M0]
]m= 0 . (5.9)
5.2.4 Dimensionless bystander isomer concentration at steady state
Before we can analyze our model, we derive a suitable dimensionless form of
Eq. 5.9. The non-dimensionalization allows us to reduce the number of parameters
in our model and give an absolute measure of the model parameters independent
65
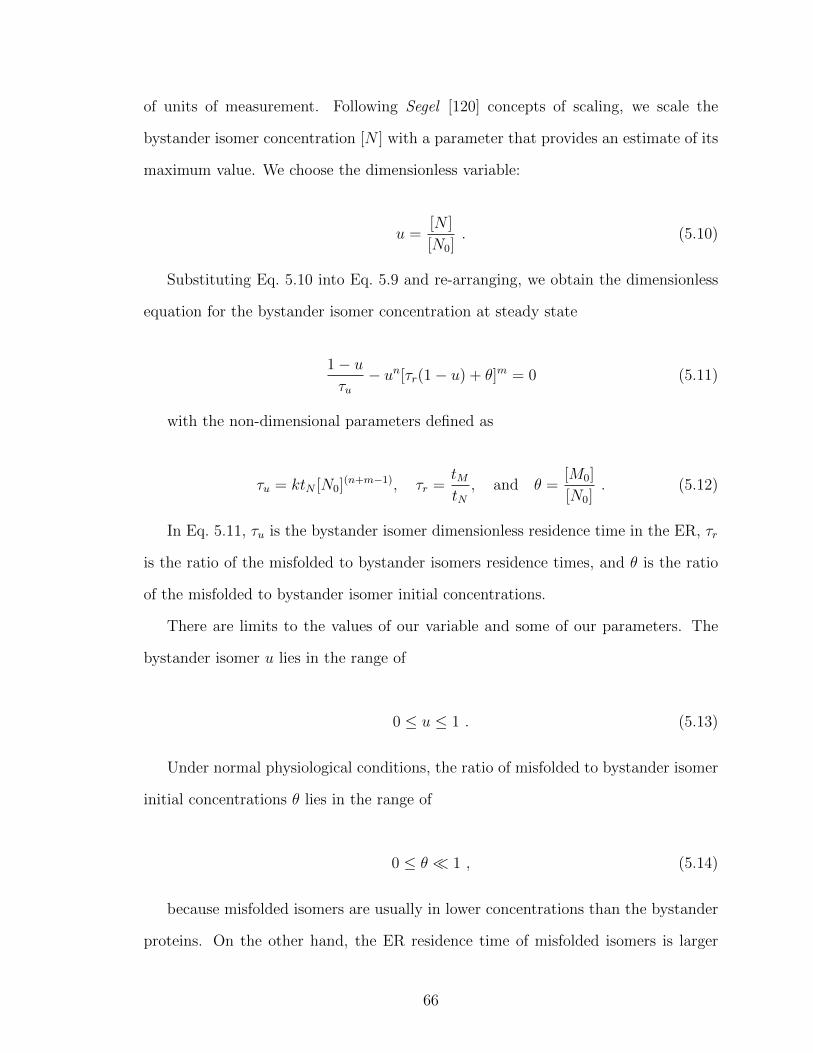
of units of measurement. Following Segel [120] concepts of scaling, we scale the
bystander isomer concentration [N ] with a parameter that provides an estimate of its
maximum value. We choose the dimensionless variable:
u =[N ]
[N0]. (5.10)
Substituting Eq. 5.10 into Eq. 5.9 and re-arranging, we obtain the dimensionless
equation for the bystander isomer concentration at steady state
1− uτu− un[τr(1− u) + θ]m = 0 (5.11)
with the non-dimensional parameters defined as
τu = ktN [N0](n+m−1), τr =
tMtN, and θ =
[M0]
[N0]. (5.12)
In Eq. 5.11, τu is the bystander isomer dimensionless residence time in the ER, τr
is the ratio of the misfolded to bystander isomers residence times, and θ is the ratio
of the misfolded to bystander isomer initial concentrations.
There are limits to the values of our variable and some of our parameters. The
bystander isomer u lies in the range of
0 ≤ u ≤ 1 . (5.13)
Under normal physiological conditions, the ratio of misfolded to bystander isomer
initial concentrations θ lies in the range of
0 ≤ θ � 1 , (5.14)
because misfolded isomers are usually in lower concentrations than the bystander
proteins. On the other hand, the ER residence time of misfolded isomers is larger
66

than the ER residence time of bystander isomers (tM � tN) [5]; this implies that τr
lies in the range of
τr � 1 . (5.15)
There are no bounds on τu.
Note that the misfolding reaction will be completed when the bystander and mis-
folded isomers have reached steady state. Therefore, we can define the extent of the
reaction, x, as
x = 1− u . (5.16)
At the beginning of the reaction x = 0. At the end of the reaction, the bystander
protein can be depleted to a low steady state concentration or the production of
misfolded isomer can reach a high steady state concentration. This makes our model
applicable to investigate loss-of-function disease due to bystander protein depletion
or toxic gain-of-function due to misfolded protein production. Substituting Eq. 5.16
into Eq. 5.11 yields an expression for the rate of the extent of the reaction at steady
state
y(x) = τ−1u x︸︷︷︸yf (x)
− (1− x)n(τrx+ θ)m︸ ︷︷ ︸yr(x)
= 0 . (5.17)
The above expression has two dimensionless rates: the bystander reactor flow rate
in the ER, yf (x), and the bystander reaction rate, yr(x). Our analysis will benefit
from the division of the model into these two rates as will be evident in the next
section.
67
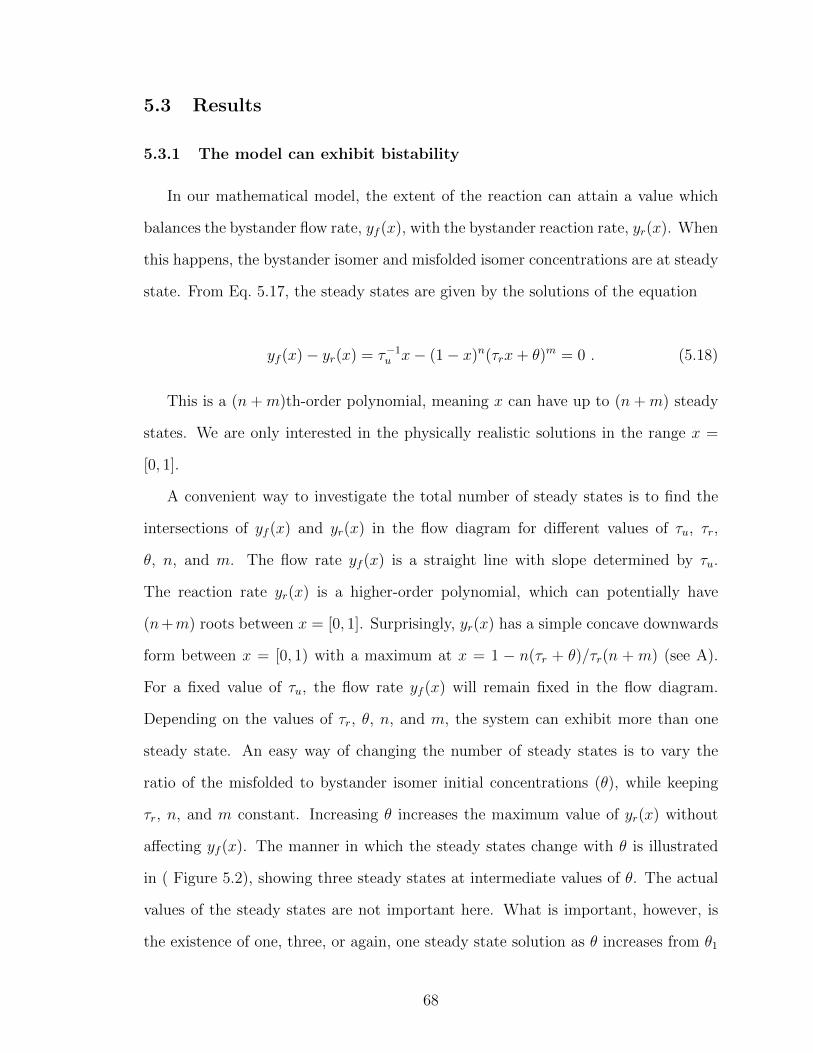
5.3 Results
5.3.1 The model can exhibit bistability
In our mathematical model, the extent of the reaction can attain a value which
balances the bystander flow rate, yf (x), with the bystander reaction rate, yr(x). When
this happens, the bystander isomer and misfolded isomer concentrations are at steady
state. From Eq. 5.17, the steady states are given by the solutions of the equation
yf (x)− yr(x) = τ−1u x− (1− x)n(τrx+ θ)m = 0 . (5.18)
This is a (n + m)th-order polynomial, meaning x can have up to (n + m) steady
states. We are only interested in the physically realistic solutions in the range x =
[0, 1].
A convenient way to investigate the total number of steady states is to find the
intersections of yf (x) and yr(x) in the flow diagram for different values of τu, τr,
θ, n, and m. The flow rate yf (x) is a straight line with slope determined by τu.
The reaction rate yr(x) is a higher-order polynomial, which can potentially have
(n+m) roots between x = [0, 1]. Surprisingly, yr(x) has a simple concave downwards
form between x = [0, 1) with a maximum at x = 1 − n(τr + θ)/τr(n + m) (see A).
For a fixed value of τu, the flow rate yf (x) will remain fixed in the flow diagram.
Depending on the values of τr, θ, n, and m, the system can exhibit more than one
steady state. An easy way of changing the number of steady states is to vary the
ratio of the misfolded to bystander isomer initial concentrations (θ), while keeping
τr, n, and m constant. Increasing θ increases the maximum value of yr(x) without
affecting yf (x). The manner in which the steady states change with θ is illustrated
in ( Figure 5.2), showing three steady states at intermediate values of θ. The actual
values of the steady states are not important here. What is important, however, is
the existence of one, three, or again, one steady state solution as θ increases from θ1
68
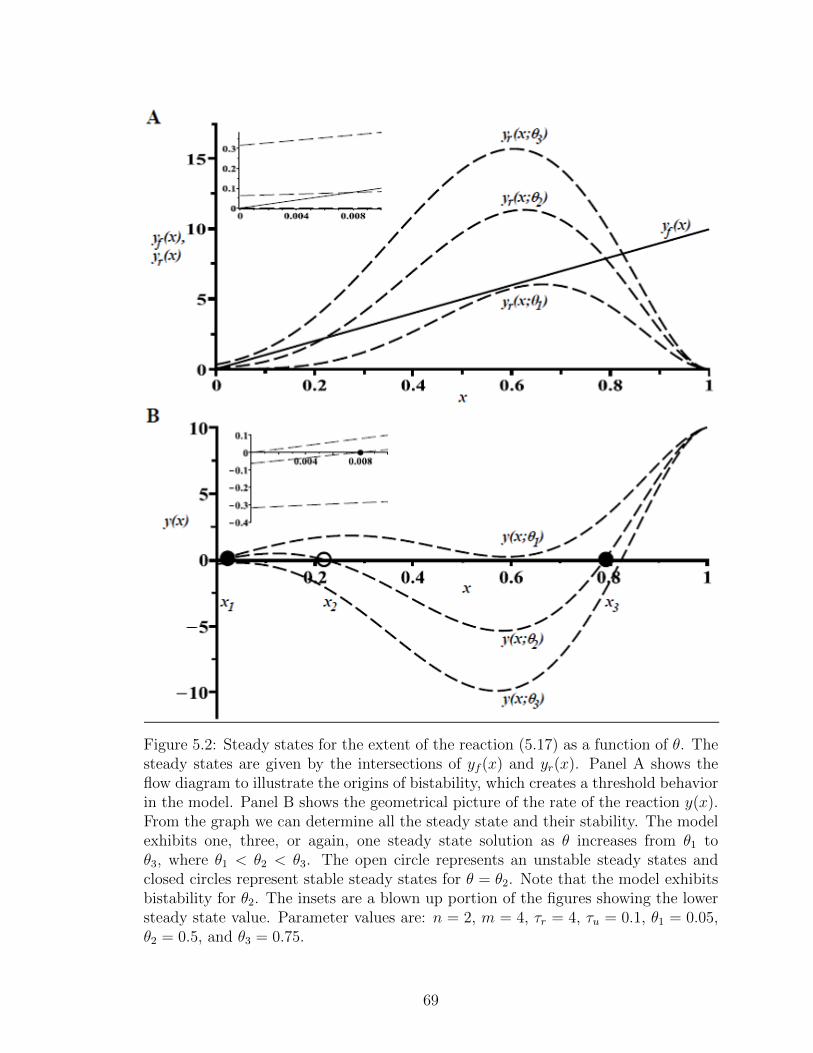
Figure 5.2: Steady states for the extent of the reaction (5.17) as a function of θ. Thesteady states are given by the intersections of yf (x) and yr(x). Panel A shows theflow diagram to illustrate the origins of bistability, which creates a threshold behaviorin the model. Panel B shows the geometrical picture of the rate of the reaction y(x).From the graph we can determine all the steady state and their stability. The modelexhibits one, three, or again, one steady state solution as θ increases from θ1 toθ3, where θ1 < θ2 < θ3. The open circle represents an unstable steady states andclosed circles represent stable steady states for θ = θ2. Note that the model exhibitsbistability for θ2. The insets are a blown up portion of the figures showing the lowersteady state value. Parameter values are: n = 2, m = 4, τr = 4, τu = 0.1, θ1 = 0.05,θ2 = 0.5, and θ3 = 0.75.
69

to θ3, where θ1 < θ2 < θ3. By inspection, x2 is linearly unstable, since ∂y(x)/∂x > 0
at x = x2, while x1 and x3 are stable steady states, since at these points ∂y(x)/∂x < 0
( Figure 5.2B). The model, therefore, exhibits bistability which creates the threshold
behavior found in some conformational diseases. A similar pattern in the change of
steady states can be observed for fixed τr, θ, n, and m, and varying the flow rate of
the bystander isomer (τu) ( Figure 5.3).
The model can exhibit physically unrealistic steady states if parameters are not
appropriately bounded. We need to set up limits for the critical point x = 1−n(τr +
θ)/τr(n+m), where yr(x) achieves a maximum. Given that the extent of the reaction
x is bounded by 0 and 1, the critical point may lie in the range
0 < 1− n (τr + θ)
τr (n+m)< 1 . (5.19)
We find that the condition given by Eq. 5.19 is valid when
θ
τr<m
n. (5.20)
Note that θ/τr is equivalent to the ratio of basal misfolded isomer to bystander
isomer inflow rates into the ER, which we define as
λ =θ
τr≡ [M0]/tM
[N0]/tN. (5.21)
The parameter λ plays an important role in the model as can be appreciated
in Figure 5.2. The variation of θ is effectively a variation of λ as the value of τr
remains constant. We also further investigate the influence of λ on the threshold
behavior in the sections below.
70

Figure 5.3: Steady states of the model (5.17) for changes in the bystander isomerresidence time in the ER (τu). Panel A shows the steady states as the intersections ofyf (x) and yr(x). The flow diagram illustrates that bistability can arise by increasingτu. The bistability explains the threshold behavior in our model. For a fixed yr(x),the model is bistable when τu− < τu < τu+ . Panel B shows the stationary steadystate locus in the bifurcation digram as a function of the bystander residence timeτu. In the bifurcation curve, stable steady states are denoted by a solid line whilethe dashed line denotes unstable steady states. The lower stable steady state branchis characterized by the fast flow of bystander isomers in the ER. The higher stablesteady state branch is characterized by a high bystander isomer depletion and highmisfolded isomer production. Parameter values are: n = 1, m = 2, τr = 6, τu− = 0.10,τu+ = 0.42, and θ = 0.1.
71
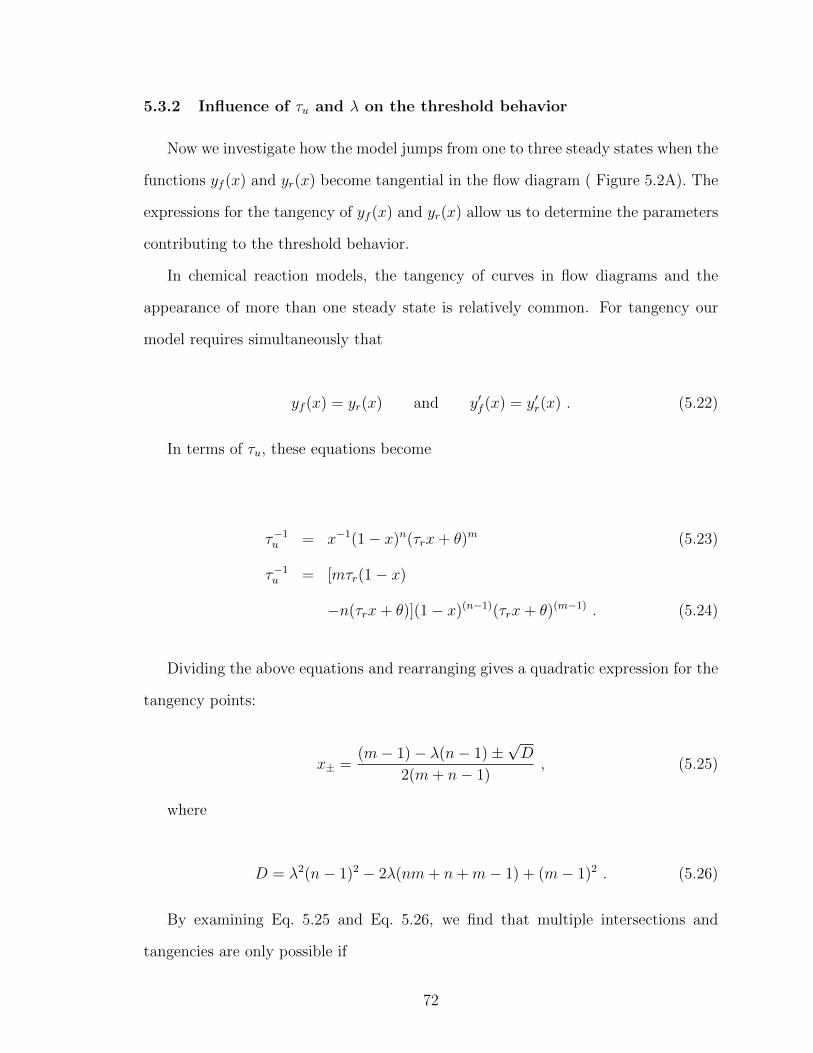
5.3.2 Influence of τu and λ on the threshold behavior
Now we investigate how the model jumps from one to three steady states when the
functions yf (x) and yr(x) become tangential in the flow diagram ( Figure 5.2A). The
expressions for the tangency of yf (x) and yr(x) allow us to determine the parameters
contributing to the threshold behavior.
In chemical reaction models, the tangency of curves in flow diagrams and the
appearance of more than one steady state is relatively common. For tangency our
model requires simultaneously that
yf (x) = yr(x) and y′f (x) = y′r(x) . (5.22)
In terms of τu, these equations become
τ−1u = x−1(1− x)n(τrx+ θ)m (5.23)
τ−1u = [mτr(1− x)
−n(τrx+ θ)](1− x)(n−1)(τrx+ θ)(m−1) . (5.24)
Dividing the above equations and rearranging gives a quadratic expression for the
tangency points:
x± =(m− 1)− λ(n− 1)±
√D
2(m+ n− 1), (5.25)
where
D = λ2(n− 1)2 − 2λ(nm+ n+m− 1) + (m− 1)2 . (5.26)
By examining Eq. 5.25 and Eq. 5.26, we find that multiple intersections and
tangencies are only possible if
72

n ≥ 1 and m ≥ 2 . (5.27)
By using the above expressions, we can investigate the influence of the τu on the
bistability, which creates the threshold behavior in our model. Substituting Eq. 5.25
into Eq. 5.23, we determine the critical bystander isomer dimensionless residence time
points τu∓ for tangency in the flow diagram:
τu∓ =x±
(1− x±)n(τrx± + θ)m. (5.28)
In the flow diagram ( Figure 5.3A), for a fixed yr, the family of flow rates yf
between the low flow rate yf (x; τu+) and high flow rate yf (x; τu−) exhibits three steady
states: two stable steady states and one unstable steady state. Therefore, the model
is bistable for τu− < τu < τu+ . The reaction has a single steady state for τu < τu− or
τu > τu+ .
The bifurcation diagram x versus τu ( Figure 5.3B) has an S-shaped curve. At
short bystander residence time with τu < τu− , the reaction has only one steady state
characterized by low bystander isomer depletion and low misfolded isomer produc-
tion. As the bystander residence time increases, but remains bounded by τu < τu+ ,
the bystander isomer depletion increases slightly along a low bystander isomer de-
pletion steady state branch. We call this branch ‘the fast flow’ branch because it is
characterized by the fast flow of bystander isomers in the ER lumen, which decreases
the probability of misfolded isomers to react with the bystander isomers. At a long
bystander residence time τu > τu+ , then the reaction moves to a new steady state
branch characterized by a high bystander isomer depletion and a high production of
misfolded isomer. We name this branch ‘the outbreak branch’ because the confor-
mational disease is manifested on this branch. Note that for τu− < τu < τu+ the
fast flow and outbreak branches co-exist. In the absence of perturbation, the system
73

will remain in one steady state branch. For example, a sustained and progressive
increase in the bystander residence time τu will cause a discontinuous change in the
steady state from the fast flow branch to the outbreak branch at τu+ . In this case,
τu+ becomes ‘the threshold behavior point’, where a sudden shift occurs between low
levels of bystander isomer depletion to high levels of bystander depletion. If τu is de-
creased progressively from a long bystander residence time τu > τu+ , the system will
remain on the outbreak branch, even as τu is reduced below the threshold behavior
point through the region where the two steady state branches co-exist. The system
will exhibit a discontinuous change in the steady state from the outbreak branch to
the fast flow branch at τu− . We call this critical point the ‘bystander isomer rescue
point’ because the bystander isomer concentration level increases from this point as
τu− decreases. The existence of two different critical points (to change between steady
state branches) as we progressively vary a parameter shows that our model exhibits
hysteresis.
Interestingly, the model also exhibits hysteresis for progressive variations of the
ratio of basal misfolded isomer to bystander isomer inflow rates λ into the ER. Al-
though we cannot determine analytically a closed-form solution for the critical λ±
points, we know that the variation of λ produces a discontinuity in the number of
the steady states from one to three, and back to one as we progressively increase λ
( Figure 5.2). Moreover, the x–λ bifurcation diagram has a S-shape curve similar to
the x–τu bifurcation diagram shown in Figure 5.3B with both a threshold behavior
point and the bystander isomer rescue point.
Now we are in the position of investigating the effects of both τu and λ on the
appearance of the threshold behavior. There is a domain in the τu–λ parameter plane
where the three physically realistic steady states of the model Eq. 5.11 exist and the
threshold behavior will appear. This is shown in Figure 5.4. The analytical expression
for the boundary curves is given parametrically and implicitly by substituting Eq. 5.25
74

into Eq. 5.28. The two roots τu± move closer together as λ increases. They intersect
at the cusp point C, where τu− = τu+ . The representation of the bistable area in
the τu–λ parameter plane also confirms that the model exhibits a hysteresis effect.
Suppose that we have a fixed λ between the critical points λ− and λ+, and τu moves
from zero vertically. As the value of τu increases, the system will discontinuously
jump from one steady state to three steady states back to one steady state. The
same discontinuous jump can be observed for a fixed τu as λ increases from zero
horizontally in Figure 5.4.
Figure 5.4: The threshold behavior depends on the nondimensional bystander isomerresidence time in the ER (τu) and the ratio of basal misfolded isomer to bystander iso-mer inflow rates into the ER (λ). We illustrate this result in the τu–λ parameter plane,which shows the number of physically realistic steady states for the model (5.17). Theboundary curves are given implicitly and parametrically by the solutions of (5.25) forn = 1 and m = 2. At the cusp point C, λ− = λ+ and τu− = τu+ . The model exhibitsthree steady states inside the closed area, and one steady state outside. The inset isa blown up portion of the figure.
75

5.3.3 Necessary conditions for the threshold behavior
To this point, the analysis of our model shows that there are three possible steady
states for the extent of the reaction. According to the parameter plane analysis
( Figure 5.4), the threshold behavior is a function of τu and λ. In reality, the model can
exhibit the threshold behavior if we guarantee the existence of two physically realistic
and distinct tangency points. The conditions for the existence of two realistic and
distinct tangency points will provide us with necessary conditions for the appearance
of the threshold behavior in our model. After careful examination of the tangency
point(s) given by Eq. 5.25, the model can have two real and distinct tangency points
if the discriminant D is greater than zero
D = λ2(n− 1)2 − 2λ(nm+ n+m− 1) + (m− 1)2 > 0 . (5.29)
As we discussed before, from the above inequality, the model requires n ≥ 1 and
m ≥ 2.
The analysis of Eq. 5.29 needs to be divided into two cases: n = 1 and n ≥ 1.
For the special case n = 1, the λ2 term is eliminated from the discriminant D, which
leads to the necessary condition
λ <(m− 1)2
4m. (5.30)
However, note that the condition (Eq. 5.20) for the model to exhibit a physically
realistic steady state when n = 1,
λ < m , (5.31)
is stronger than condition given by Eq. 5.30. Therefore, for the special case n = 1,
Eq. 5.31 is a necessary condition for the model to exhibit threshold behavior. For the
76
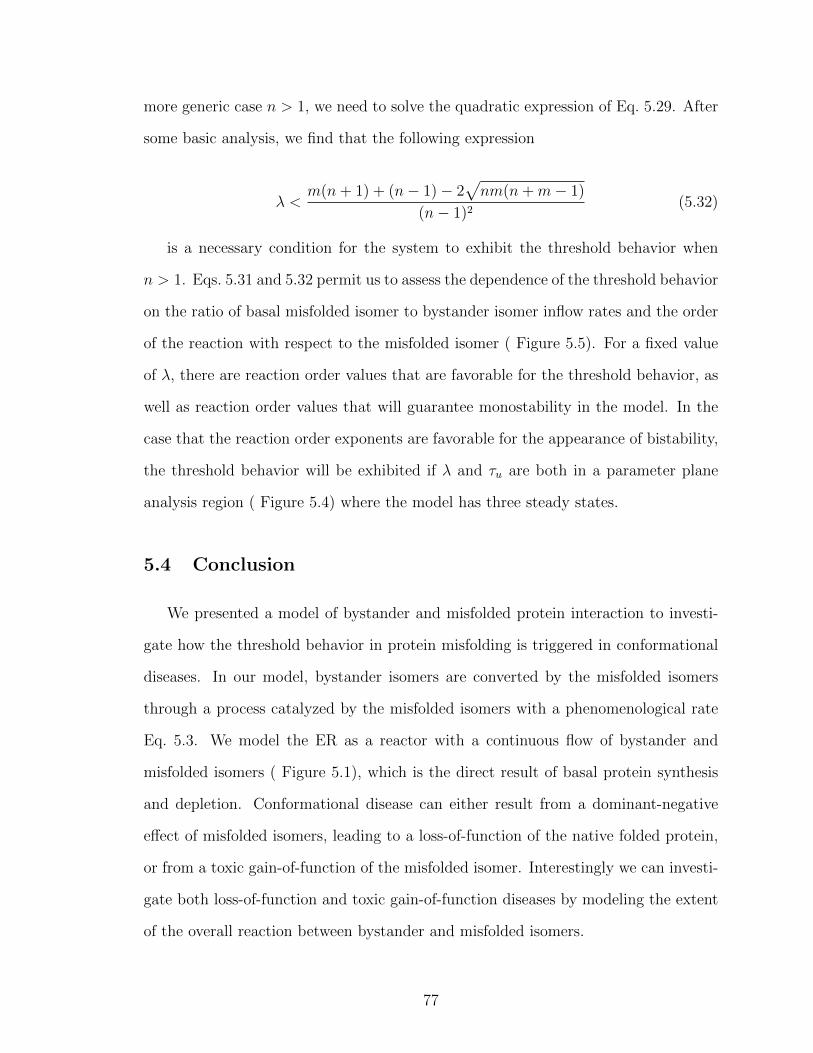
more generic case n > 1, we need to solve the quadratic expression of Eq. 5.29. After
some basic analysis, we find that the following expression
λ <m(n+ 1) + (n− 1)− 2
√nm(n+m− 1)
(n− 1)2(5.32)
is a necessary condition for the system to exhibit the threshold behavior when
n > 1. Eqs. 5.31 and 5.32 permit us to assess the dependence of the threshold behavior
on the ratio of basal misfolded isomer to bystander isomer inflow rates and the order
of the reaction with respect to the misfolded isomer ( Figure 5.5). For a fixed value
of λ, there are reaction order values that are favorable for the threshold behavior, as
well as reaction order values that will guarantee monostability in the model. In the
case that the reaction order exponents are favorable for the appearance of bistability,
the threshold behavior will be exhibited if λ and τu are both in a parameter plane
analysis region ( Figure 5.4) where the model has three steady states.
5.4 Conclusion
We presented a model of bystander and misfolded protein interaction to investi-
gate how the threshold behavior in protein misfolding is triggered in conformational
diseases. In our model, bystander isomers are converted by the misfolded isomers
through a process catalyzed by the misfolded isomers with a phenomenological rate
Eq. 5.3. We model the ER as a reactor with a continuous flow of bystander and
misfolded isomers ( Figure 5.1), which is the direct result of basal protein synthesis
and depletion. Conformational disease can either result from a dominant-negative
effect of misfolded isomers, leading to a loss-of-function of the native folded protein,
or from a toxic gain-of-function of the misfolded isomer. Interestingly we can investi-
gate both loss-of-function and toxic gain-of-function diseases by modeling the extent
of the overall reaction between bystander and misfolded isomers.
77

Previous studies [107, 54, 61, 97] showed that the threshold behavior in confor-
mational diseases is caused by the nonlinear phenomenon known as bistability. Our
mathematical model also displayed bistability, though it is qualitatively different from
the other models. In Rieger et al. [107], protein misfolding and aggregation are reg-
ulated by folding chaperones. In our model protein misfolding cannot be reversed by
folding chaperones. The other models [54, 61, 97] focus on the quantification of prion
infection dynamics. We do not investigate the role of protein misfolding in infection
by proteins. In our model, there are three possible steady states; two of these steady
states are stable to small perturbations and are easily observable under physiological
conditions. The stable steady state with the lower bystander isomer depletion and
lower misfolded production is characterized by the fast flow of bystander isomers in
the ER lumen. On the other hand, the stable steady state with the higher bystander
depletion and higher misfolded production causes the outbreak of the conformational
disease ( Figure 5.3). Our analysis showed that the appearance of the threshold be-
havior depends on two parameters: the ratio of basal misfolded isomer to bystander
isomer inflow rates λ, and the bystander isomer residence time τu ( Figure 5.4).
These parameters are external to the misfolding reaction mechanism, because they
are driven by the ER protein production, folding and export machinery. We also
found that there are values of the order of the reaction with respect to the misfolded
isomer that favor the appearance of the threshold behavior ( Figure 5.5). This reac-
tion order is an internal property of the reaction mechanism, because it can depend
specifically on the nature of the elementary reactions driving protein misfolding.
The appearance of bistability has important implications for the onset and res-
cue of conformational diseases. What are the factors that can cause the outbreak of
protein misfolding in conformational diseases? Here we must relate the parameters
controlling the appearance of bistability to the steady state values of the model x?
shown in Figure 5.6. A low x? implies a high bystander isomer concentration (and
78
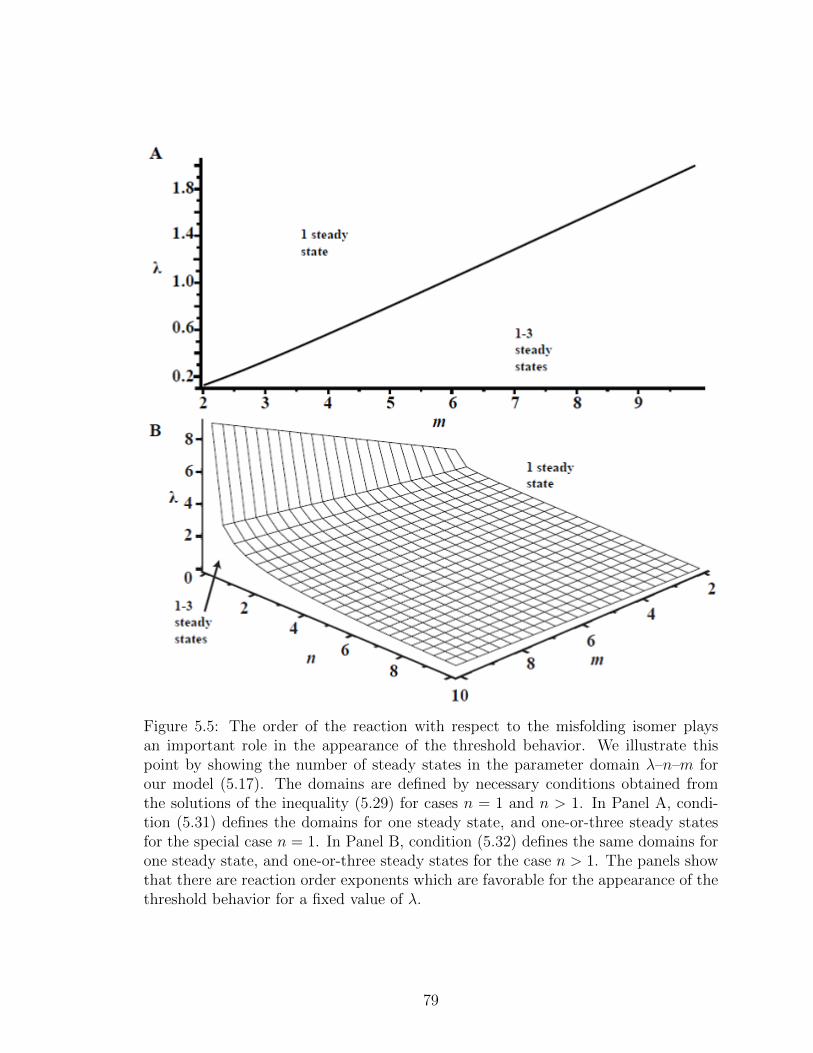
Figure 5.5: The order of the reaction with respect to the misfolding isomer playsan important role in the appearance of the threshold behavior. We illustrate thispoint by showing the number of steady states in the parameter domain λ–n–m forour model (5.17). The domains are defined by necessary conditions obtained fromthe solutions of the inequality (5.29) for cases n = 1 and n > 1. In Panel A, condi-tion (5.31) defines the domains for one steady state, and one-or-three steady statesfor the special case n = 1. In Panel B, condition (5.32) defines the same domains forone steady state, and one-or-three steady states for the case n > 1. The panels showthat there are reaction order exponents which are favorable for the appearance of thethreshold behavior for a fixed value of λ.
79
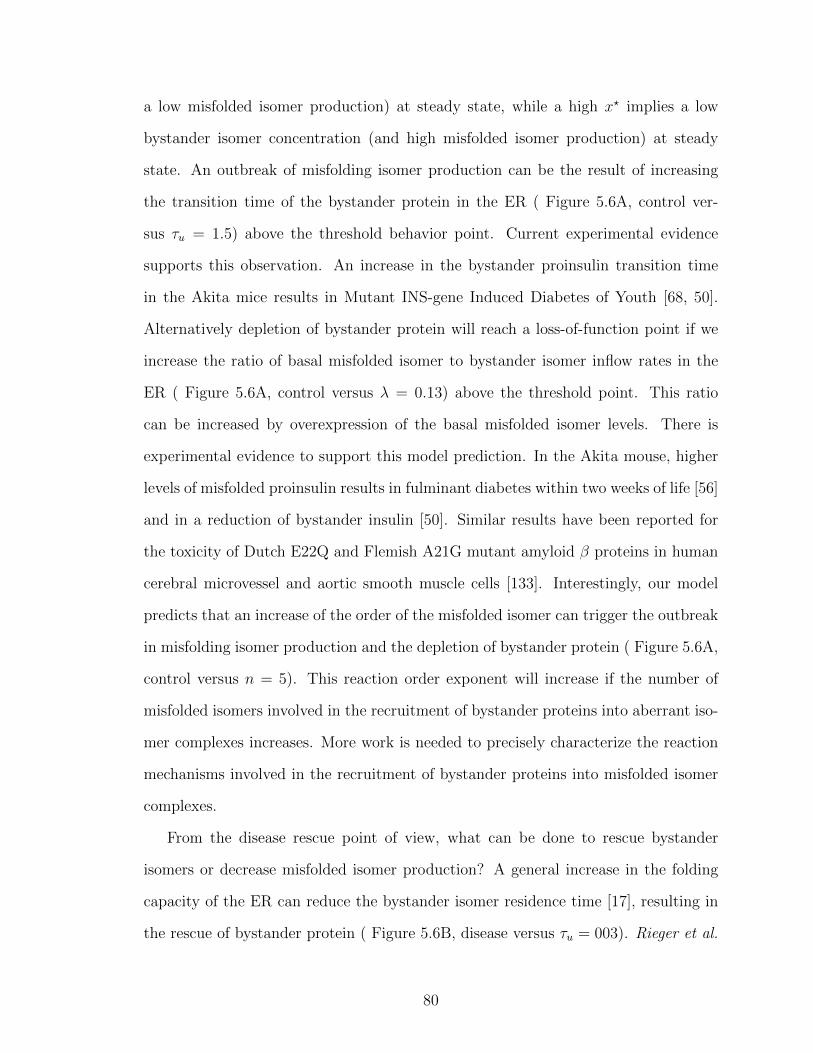
a low misfolded isomer production) at steady state, while a high x? implies a low
bystander isomer concentration (and high misfolded isomer production) at steady
state. An outbreak of misfolding isomer production can be the result of increasing
the transition time of the bystander protein in the ER ( Figure 5.6A, control ver-
sus τu = 1.5) above the threshold behavior point. Current experimental evidence
supports this observation. An increase in the bystander proinsulin transition time
in the Akita mice results in Mutant INS-gene Induced Diabetes of Youth [68, 50].
Alternatively depletion of bystander protein will reach a loss-of-function point if we
increase the ratio of basal misfolded isomer to bystander isomer inflow rates in the
ER ( Figure 5.6A, control versus λ = 0.13) above the threshold point. This ratio
can be increased by overexpression of the basal misfolded isomer levels. There is
experimental evidence to support this model prediction. In the Akita mouse, higher
levels of misfolded proinsulin results in fulminant diabetes within two weeks of life [56]
and in a reduction of bystander insulin [50]. Similar results have been reported for
the toxicity of Dutch E22Q and Flemish A21G mutant amyloid β proteins in human
cerebral microvessel and aortic smooth muscle cells [133]. Interestingly, our model
predicts that an increase of the order of the misfolded isomer can trigger the outbreak
in misfolding isomer production and the depletion of bystander protein ( Figure 5.6A,
control versus n = 5). This reaction order exponent will increase if the number of
misfolded isomers involved in the recruitment of bystander proteins into aberrant iso-
mer complexes increases. More work is needed to precisely characterize the reaction
mechanisms involved in the recruitment of bystander proteins into misfolded isomer
complexes.
From the disease rescue point of view, what can be done to rescue bystander
isomers or decrease misfolded isomer production? A general increase in the folding
capacity of the ER can reduce the bystander isomer residence time [17], resulting in
the rescue of bystander protein ( Figure 5.6B, disease versus τu = 003). Rieger et al.
80

Figure 5.6: Parameters involved in the onset and rescue of conformational diseases. Alow x? implies a high bystander isomer concentration at steady state, while a high x?
implies a low bystander isomer concentration at steady state. In Panel A, we illustratehow the onset of conformational disease can be caused by increasing the transitiontime of the bystander protein in the ER (τu), the ratio of basal misfolded isomer tobystander isomer inflow rates in the ER (λ), or the misfolded isomer reaction order(m). Parameter values for control: τu = 0.45, λ = 0.025, n = 4, m = 5. In PanelB, bystander protein concentration is rescued by decreasing τu, λ, or m. Parametervalues for disease: τu = 0.10, λ = 0.1875, n = 4, m = 5.
81
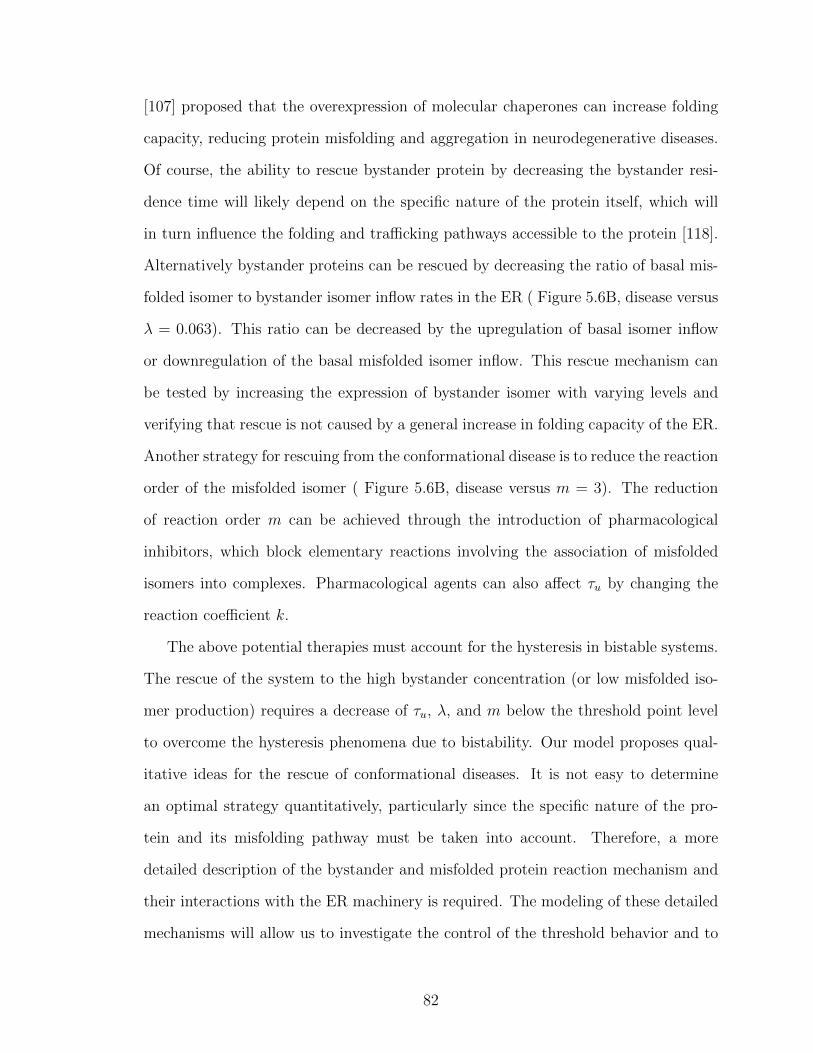
[107] proposed that the overexpression of molecular chaperones can increase folding
capacity, reducing protein misfolding and aggregation in neurodegenerative diseases.
Of course, the ability to rescue bystander protein by decreasing the bystander resi-
dence time will likely depend on the specific nature of the protein itself, which will
in turn influence the folding and trafficking pathways accessible to the protein [118].
Alternatively bystander proteins can be rescued by decreasing the ratio of basal mis-
folded isomer to bystander isomer inflow rates in the ER ( Figure 5.6B, disease versus
λ = 0.063). This ratio can be decreased by the upregulation of basal isomer inflow
or downregulation of the basal misfolded isomer inflow. This rescue mechanism can
be tested by increasing the expression of bystander isomer with varying levels and
verifying that rescue is not caused by a general increase in folding capacity of the ER.
Another strategy for rescuing from the conformational disease is to reduce the reaction
order of the misfolded isomer ( Figure 5.6B, disease versus m = 3). The reduction
of reaction order m can be achieved through the introduction of pharmacological
inhibitors, which block elementary reactions involving the association of misfolded
isomers into complexes. Pharmacological agents can also affect τu by changing the
reaction coefficient k.
The above potential therapies must account for the hysteresis in bistable systems.
The rescue of the system to the high bystander concentration (or low misfolded iso-
mer production) requires a decrease of τu, λ, and m below the threshold point level
to overcome the hysteresis phenomena due to bistability. Our model proposes qual-
itative ideas for the rescue of conformational diseases. It is not easy to determine
an optimal strategy quantitatively, particularly since the specific nature of the pro-
tein and its misfolding pathway must be taken into account. Therefore, a more
detailed description of the bystander and misfolded protein reaction mechanism and
their interactions with the ER machinery is required. The modeling of these detailed
mechanisms will allow us to investigate the control of the threshold behavior and to
82

develop a more complete and quantitative theory for the design of rescue strategies
for specific conformational diseases.
83
CHAPTER VI
Educational component: outlining a mathematical
modeling course
6.1 Introduction
Many colleges, particularly small and rural colleges and minority secondary insti-
tutions, do not have the infrastructure to support ’wet’ laboratories. Additionally,
rural colleges are increasingly employing online or distance learning, reducing student
access to hands-on laboratory experience students [10]. It is in these laboratories that
students would perform traditional experiments to test hypotheses formulated around
biological problems. One way to address this limitation is to employ mathematical
and computational models to test hypotheses and investigate biological problems.
Mathematical modeling is used to investigate a wide array of biological process
such as cell cycle control, gene expression, tissue and organ development and protein
folding pathways. Models are also employed to investigate mechanisms of protein
aggregation. As part of my dissertation, I developed an example mathematical biology
laboratory applied to bistable prion aggregation [54] (Appendix B). This laboratory is
a starting point for a ‘virtual biology laboratory’ I am interested in developing in the
future. This resource would allow students from the types of schools mentioned above
to gain similar skills as their counterparts at larger, more resource heavy institutions.
84
In this chapter, my focus is on developing a mathematical biology course de-
scription and an example laboratory. The course description includes the following
information: the course level, prerequisites, learning objectives, course organization,
and assessment. This chapter serves as the first step towards developing a math-
ematical biology course to address institution infrastructure and increased distance
learning.
6.2 Course Description and Philosophy
This course is a one semester course designed to introduce seniors and advanced
juniors students to using differential and difference equations to model biological sys-
tems. The course philosophy is centered around active student involvement in gather-
ing background information, generating hypotheses, developing and using sound and
realistic models to test hypotheses, and analyzing and writing the results. Students
will learn how to use mathematical modeling as a way to ask and answer questions
while engaging in scientific study of life sciences questions.
Throughout the course, students will be asked to read the scientific literature,
synthesize material read and presented in class, and use this information to develop
mathematical models based on the general approach outlined in Figure 6.1.
The expectation is that students will have successfully completed a first course in
calculus, introductory biology, and introductory chemistry prior to engaging in this
course. In terms of calculus concepts, a student will be expected to have prior expo-
sure to the study of functions of one variable, limits and continuity, algebraic func-
tion differentiation, introduction to integrals, and curve sketching. Students should
have been exposed to concepts in cellular and molecular biology, genetics, evolution
and diversity of organisms, plant anatomy and physiology and mammalian anatomy,
physiology and ecology. Finally, students should be familiar with general chemistry
concepts including stoichiometry, atomic structure, periodicity, chemical bonding,
85
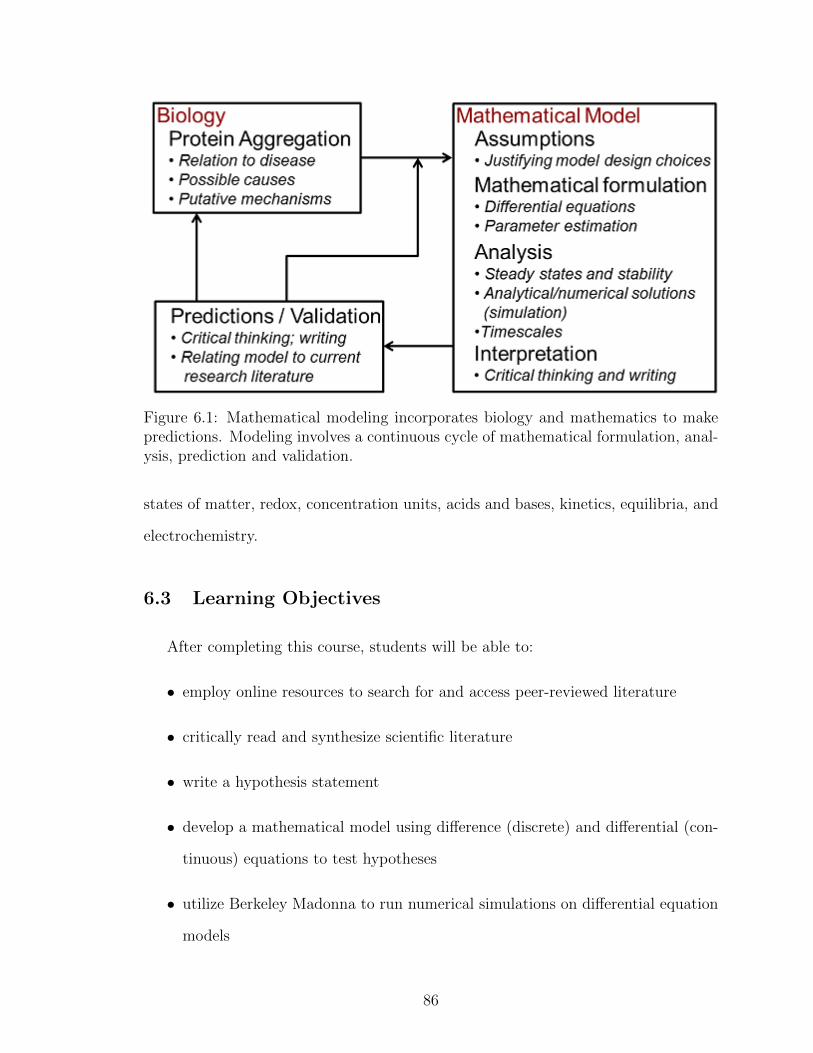
Figure 6.1: Mathematical modeling incorporates biology and mathematics to makepredictions. Modeling involves a continuous cycle of mathematical formulation, anal-ysis, prediction and validation.
states of matter, redox, concentration units, acids and bases, kinetics, equilibria, and
electrochemistry.
6.3 Learning Objectives
After completing this course, students will be able to:
• employ online resources to search for and access peer-reviewed literature
• critically read and synthesize scientific literature
• write a hypothesis statement
• develop a mathematical model using difference (discrete) and differential (con-
tinuous) equations to test hypotheses
• utilize Berkeley Madonna to run numerical simulations on differential equation
models
86
• create a phase portrait and perform a phase plane analysis of a two-dimensional
system
• calculate steady states and assess stability of two-dimensional ordinary differ-
ential equation models
• interpret a bifurcation diagram
• discuss and critique mathematical models of biological systems
6.4 Course Organization
As is often the case in educational modules, the labs within the educational module
will be laid out in a sequential manner. The concepts in the later labs will build upon
those concepts learned earlier in the sequence. The technology necessary to complete
these labs is minimal. Each lab will use Berkeley Madonna, a Windows and MacOS
software program that runs on any standard desktop. Berkeley Madonna is available
for free (with some minor limitations) and the full version is relatively inexpensive.
Berkeley Madonna is useful for analysis of dynamical systems. A dynamical sys-
tem is a mathematical formulation which describes the time evolution of some ’thing’
in a space; e.g. the number of foxes in a forest, the volume of water in a pipe, or
the number of people with AIDS in New York City. Ordinary differential equations
(ODEs) are used to represent dynamical systems. Once the ODEs are encoded in a
Berkeley Madonna readable format, one can simulate the change in some ’thing’ over
time based on certain conditions. These conditions are determined by the parameters
of the model. The ’thing(s)’ are represented as variables of the ODEs.
87
6.5 Assessment
Student learning will be assessed each course using a ungraded quiz at the begin-
ning of each laboratory and lecture. These quizzes will be reviewed by the instructor
to identify students who are struggling early in the course. At the end of each lec-
ture, students are also required to ask a question or make a comment about the
day’s lecture or laboratory in writing. These two ungraded activities will be used as
a real-time assessment of student learning and will be used to guide future classes
throughout the course.
Student grades will be based upon the following:
• critical quarterly self-evaluation (10%)
• biweekly homeworks, graded in teams by students (30%)
• team research paper and projects (30%)
• two take home exams (30%)
Peer graded homeworks will be reviewed by the instructor. At the midpoint and
end of the course, students will be asked to complete a course survey. This tool
(in concert with the daily quizzes and comments) will be used to guide the course
instructor.
6.6 Summary
The course proposed here is centered around introducing mathematical model-
ing for the life sciences using team-oriented activities and active student learning.
Throughout the course, the lectures and laboratories (e.g. B) will stress the power of
mathematical modeling. Students will be challenged to critically analyze the models
and use them to explore the biological systems they represent. Most importantly,
88

students will learn scientific reasoning and a powerful scientific tool - mathematical
models - in a course that is implementable at institutions with limited resources.
89
CHAPTER VII
Conclusion
Conformational diseases originate from the failure of specific proteins to adopt or
maintain their native conformational state [79]. Misfolded proteins are implicated in
the reduction of native protein levels and the formation of aggregates in a variety of
conformational diseases, such as β-amyloid toxicity, Charcot-Marie-Tooth, diabetes,
pre-senile dementia, and α1-antitrypsin deficiency with liver disease [119]. Proteins
misfold due to cellular stress as well as inherited or stochastic mutations [84].
The formation of misfolded proteins in conformational diseases often displays a
threshold behavior that is characterized by a sudden shift in the concentration of
proteins from low misfolded concentration (non-toxic) to high misfolded concentration
(toxic) levels. For example, an increase in mutant type I collagen expression above a
critical threshold results in an aortic rupture due to a breakdown in collagen formation
[102]. Vascular toxicity appears to occur in a dose dependent manner with β-amyloids,
which are a misfolded form of amyloid precursor protein and the main component of
aggregates found in patients with Alzheimer’s disease [133]. Both of these examples,
and several others, are the result of dominant negative mutations that give rise to
increased misfolded protein levels. Misfolded isomers exert a dominant-negative effect
(toxic gain-of-function) possibly through an interaction with a protein binding partner
expressed in cells [119]. A key to controlling conformational diseases, therefore, is
90
to understand the underlying mechanisms responsible for threshold behavior under
conditions of increased protein misfolding.
The threshold behavior in conformational diseases can arise from a sigmoidal dose-
response curve or the appearance of bistability within a certain range of parameters.
In dynamical and complex systems, bistability is characterized by two steady states
and a third unstable steady state [45, 28]. Experimental evidence suggests that this
threshold phenomenon is associated with bistability; misfolded isomer or aggregate
protein concentration can exhibit bistability with changes in temperature [75], pres-
sure [31], and pH [41]. There is also evidence of guanidinium chloride concentration
dependent bistability in the transition between unfolded and folded transthyretin
protein states [60]. To date there are few mathematical models which can describe
the threshold of protein misfolding or aggregation in conformational diseases as a
bistable system [107, 54, 61, 97]. Generalizations of the Smoluschowski’s theory of
coagulation have been applied to investigate protein polymerization and aggregation
[19]. However, these models do not explain the threshold for protein misfolding or
aggregation in a mechanistic manner [58].
In this thesis, we critically reviewed the aggregation literature and discussed cur-
rent qualitative classifications of aggregation mechanisms (Chapter II). We presented
evidence from the literature for a threshold phenomena in aggregation. Bistability is
one manner in which threshold phenomena can be described. The exact conditions
underlying bistability in chemical reaction networks are undefined. In Chapter III,
we presented a novel method to search for one type of condition (motifs) in chemical
reaction configurations. We applied this method to reproduce previously published
results of chemical motifs found in bistable reaction configurations [103]. Our method
was then applied to discover two novel motifs in a set of published bistable chemical
reaction mechanisms. These motifs differed from previously published motifs as our
reaction networks were developed from chemical mechanisms generated by uni and
91

bimolecular reactions.
Qualitative characterizations can result in classifying identical mechanisms (from
separate studies) into different categories. For example, Morris et al. [82] classify
a mechanism of bovine liver glutamate dehydrogenase aggregation by Thusius [129]
as ‘reverse association.’ This mechanism describes the indiscriminate aggregation
of monomers and polymers of any length. Certain cases of this mechanism look
identical to the ‘subsequent monomer association’ mechanism describing a nucleation
event [134]. The result is dual classification for identical mechanisms, confounding
clarification of mechanism(s) of protein aggregation.
In future studies, our method can be used to discriminate between network types
(e.g. overall reaction configurations versus mechanistic) and aid in clarifying in some
of the discrepancies found in the aggregation literature. First, we see that misfolded
proteins (often act as the instigator, interacting with different protein conformations
as the initial step in the aggregation reaction. This ‘activated monomer’ hypothesis
is proposed for a variety of different protein aggregation systems. For example, in
a model of insulin aggregation based on the “Ockham’s razor’/minimalistic 2-step
model’, insulin must undergo a transformation from a non-aggregating to aggregat-
ing species in order for the aggregation reaction to occur [39]. Amyloid β is an
aggregate prone species originating from amyloid precursor protein and is implicated
in the formation of protein aggregates in Alzheimer’s disease [92], which provides
another example of the ‘activated monomer’ hypothesis. Second, we see that het-
erodimerization occurs across most of the bistable networks. An inherent bias in
published mechanisms of protein aggregation is a predicted homodimerization (M1
+ M1) event. There are a handful of mechanisms that do predict dimerization of
two different conformations of the same protein. Mechanistic models of calcitonin
aggregation [55] and amyloid β aggregation [70] both have heterodimerization events.
Dimerization of misfolded and bystander (wild-type unfolded or folded) proinsulin
92
is experimentally observed in a MIDY mouse model and hypothesized to underlie
the dramatic decrease in insulin secretion and β-cell mass in this diabetic phenotype
[50, 69, 67, 68]. Third, many of the networks include both intermediates and a final
aggregate form. One of the issues of currently available aggregation models is that
those capturing dynamical behavior of threshold phenomena are phenomenological.
Several of the standardized networks presented here include intermediate steps and
retain bistable behavior. This suggests that mechanistic models of protein aggrega-
tion capturing threshold phenomena can be developed by applying what is known
of currently available bistable networks. Finally, some of these standardized bistable
networks are open. Most available mechanisms of protein aggregation are of closed
systems. It is known that fluxes can impact dynamical behavior [29, 30] and cellular
systems are inherently open systems.
Using our novel method, we identified aggregation motifs and created a quanti-
tative classification of our library of published models of protein aggregation (Chap-
ter IV). During this process, we discovered a possible bias in the aggregation lit-
erature. We completed this chapter with a prediction of dynamical behavior of the
aggregation mechanisms. We hope that this motif information can be used to gen-
erate novel unbiased aggregation mechanisms. A necessary future step would be to
experimentally test hypothesized mechanisms of threshold behavior in a way that
would distinguish square hyperbolic, sigmoid saturation, and switch-like saturation
(reversible and irreversible) systems
As other factors beyond motifs are important to dynamical behavior, we devel-
oped and analyzed a model of protein misfolding and aggregation in conformational
disease (Chapter V). We identified particular kinetic parameters important to bista-
bility. Within this chapter, we predicted pathways for recovery from abnormal protein
misfolding and aggregation that are experimentally testable. The final chapter (Chap-
ter VI) presents the beginnings of a mathematical biology course with an example
93

laboratory using a mathematical model of protein aggregation. This chapter will aid
in transferring research based results to the classroom; future science research begins
with the education of future scientists.
94

APPENDICES
95
APPENDIX A
Bystander Model Appendix
A.1 Flux perturbation
A.2 The shape of yr(x)
To distinguish between unique and multiple steady states we need to understand
the shape of yr(x) for x = [0, 1]. yr(x) is a (n+m)th order polynomial of the form
yr(x) = (1− x)n(τrx+ θ)m . (A.1)
First, we proceed to calculate the critical points of Eq. A.1 by determining the values
of x for which the derivative of Eq. A.1 with respect to x is equal to zero. This
becomes
y′r(x) = [mτr(1− x)− n(τrx+ θ)](1− x)(n−1)(τrx+ θ)(m−1)
= 0 . (A.2)
96
The critical values satisfying the above equation are:
x =
{− θτr, 1− n(τr + θ)
τr(n+m), 1
}. (A.3)
Using the second derivative test, we determine that the function yr(x) is concave
downward and has a maximum at the critical point x = 1− n(τr + θ)/τr(n+m):
y′′r
(x = 1− n(τr + θ)
τr(n+m)
)< 0. (A.4)
The maximum value is, therefore,
yr(x)max =
(n(τr + θ)
τr(n+m)
)n(m(τr + θ)
n+m
)m
. (A.5)
97
APPENDIX B
Mathematical Biology Laboratory Appendix
B.1 Mathematical biology laboratory: modeling prion infec-
tion
B.1.1 Background
Learning goals: introduction to prion diseases, understanding parameters and
variables, phase portraits, numerical solutions, steady states and stability
Prion diseases, also known as transmissible spongiform encephalopathies (TSEs),
are a family of neurodegenerative disorders affecting humans and animals. These dis-
eases often progress rapidly and always result in the death of the infected human or
animal. Prion diseases are thought to be caused by a proteinaceous infectious parti-
cle (prion), an infectious agent composed primarily of protein. Infectious abnormally
folded prions (PrPSC) induce abnormal folding of normal prion proteins (PrP). Mis-
folded prions form stable aggregated structures that accumulate in tissues, leading to
cellular damage and death.
Several mathematical models of prion diseases have been proposed, including the
one introduced below. In this model, Kacser and Small [54] propose that prion infec-
98
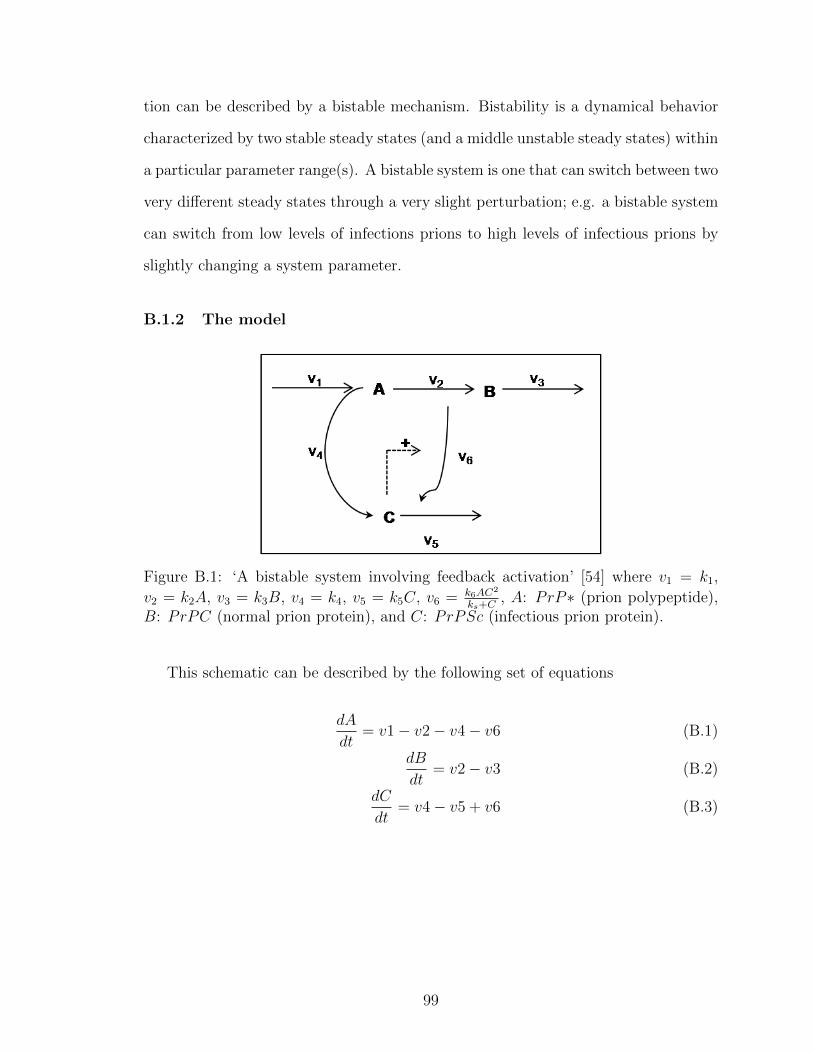
tion can be described by a bistable mechanism. Bistability is a dynamical behavior
characterized by two stable steady states (and a middle unstable steady states) within
a particular parameter range(s). A bistable system is one that can switch between two
very different steady states through a very slight perturbation; e.g. a bistable system
can switch from low levels of infections prions to high levels of infectious prions by
slightly changing a system parameter.
B.1.2 The model
Figure B.1: ‘A bistable system involving feedback activation’ [54] where v1 = k1,
v2 = k2A, v3 = k3B, v4 = k4, v5 = k5C, v6 = k6AC2
ks+C, A: PrP∗ (prion polypeptide),
B: PrPC (normal prion protein), and C: PrPSc (infectious prion protein).
This schematic can be described by the following set of equations
dA
dt= v1− v2− v4− v6 (B.1)
dB
dt= v2− v3 (B.2)
dC
dt= v4− v5 + v6 (B.3)
99
where the six rates describing prion infection are
v1 = k1 (B.4)
v2 = k2A (B.5)
v3 = k3B (B.6)
v4 = k4A (B.7)
v5 = k5C (B.8)
v6 =k6AC
2
ks + C(B.9)
B.1.3 Problem Set
1. Explain what each variable (A, B, and C) and each rate (v1, v2, v3, v4, v5 and
v6) means in biological terms.
2. Run the model using several different initial conditions. What do you notice?
Comment on the difference between the results.
3. Now investigate the effect that changing the k1 parameter has on the dynamical
behavior of the system. To do this, graph A, B, and C versus time for three
very different values of k1 while keeping the same initial conditions. Can you
estimate the value of k1 that results in a change in the behavior of the system?
4. Construct phase portraits of A vs. B, B vs. C and A vs. C using values of k1
that give the behaviors observed in Question 3. What do you notice about the
relationship between the three variables in the two cases?
B.1.4 Berkeley Madonna code
{DOI: 10.1006/jtbi.1996.0157}
{How Many Phenotypes From One Genotype? The Case of Prion Diseases}
100
{Kacser H, Small JR}
{J Theor Biol. 1996 Oct 7;182(3):209-18}
{Coded: June 03, 2010}
{Version 3.0; updated June 25, 2010}
{Berkeley Madonna version 8.3.18}
{Numerical Integration Method}
METHOD STIFF
STARTTIME = 0
STOPTIME=15
DT = 0.02
{Model Variables}
{A: Prp*, peptide product}
{B: PrPC, normal prion protein}
{C: PrPSc, infectious prion protein}
{Model Equations}
d/dt (A) = v1 - v2 - v4 - v6
d/dt (B) = v2 - v3
d/dt (C) = v4 - v5 + v6
{Rates}
v1 = k1
v2 = k2*A
101
v3 = k3*B
v4 = k4*A
v5 = k5*C
v6 = (k6*A*C*C)/(ks+C)
{Model Parameters}
k1 = 10
k2 = 7.5
k3 = 6.5
k4 = 0.06
k5 = 0.75
ks = 1
k6 = 1.25
{Initial Conditions}
INIT A = 1e-6
INIT B = 1e-6
INIT C = 1e-6
102

BIBLIOGRAPHY
103

BIBLIOGRAPHY
[1] Adams, E., and M. Lewis (1968), Sedimentation equilibrium in reacting sys-tems. vi. some applications to indefinite self-associations. studies with beta-lactoglobulin a, Biochemistry, 7, 1044–1053.
[2] Alberts, B., A. Johnson, J. Lewis, M. Raff, K. Roberts, and P. Walter (2008),Molecular Biology of the Cell, Fifth edition, Garland Science.
[3] Alon, U. (2007), Network motifs: theory and experimental approaches, NatureReviews Genetics, 8), 450–61.
[4] Andrews, J. M., Weiss, and C. J. Roberts (2008), Nucleation, growth, andactivation energies for seeded and unseeded aggregation of a-chymotrypsinogena, Biochemistry, 47 (8), 2397–2403, doi:10.1021/bi7019244, pMID: 18215071.
[5] Anelli, T., and R. Sitia (2008), Protein quality control in the early secretorypathway, EMBO J., 27, 315–327.
[6] Arnaudov, L. N., and R. de Vries (2007), Theoretical modeling of the kineticsof fibrilar aggregation of bovine beta-lactoglobulin at ph 2, The Journal ofChemical Physics, 126 (14), 145106, doi:10.1063/1.2717159.
[7] Bauer, H., U. Aebi, M. Hner, R. Hermann, M. Mller, and H. Merkle (1995),Architecture and polymorphism of fibrillar supramolecular assemblies producedby in vitro aggregation of human calcitonin, J. Struct. Biol., 115, 1–15.
[8] Baynes, B. M., and B. L. Trout (2004), Rational design of solution additivesfor the prevention of protein aggregation, Biophysical Journal, 87, 1631–1639.
[9] Bernackia, J. P., and R. M. Murphy (2009), Model discrimination and mecha-nistic interpretation of kinetic data in protein aggregation studies, Biophys. J.,96, 2871–2887.
[10] Bradford, G., and S. Wyatt (2010), Online learning and student satisfaction:Academic standing, ethnicity and their influence on facilitated learning, engage-ment, and information fluency, The Internet and Higher Education, 13 (3), 108– 114, doi:10.1016/j.iheduc.2010.02.005.
[11] Bromberg, L., J. Rashba-Step, and T. Scott (2005), Insulin particle formation insupersaturated aqueous solutions of poly(ethylene glycol), Biophysical Journal,89 (5), 3424 – 3433, doi:10.1529/biophysj.105.062802.
104
[12] Buswell, A., and A. Middelberg (2003), A new kinetic scheme for lysozymerefolding and aggregation, Biotechnol Bioeng, 83, 567–577.
[13] Chen, S., F. A. Ferrone, and R. Wetzel (2002), Huntington’s disease age-of-onsetlinked to polyglutamine aggregation nucleation, PNAS, 99, 11,884–11,889.
[14] Chi, E. Y., B. S. Kendrick, J. F. Carpenter, and T. W. Randolph (2005),Population balance modeling of aggregation kinetics of recombinant humaninterleukin-1 receptor antagonist, Journal of Pharmaceutical Sciences, 94 (12),2735–2748, doi:10.1002/jps.20488.
[15] Chickarmane, V., C. Troein, U. Nuber, H. Sauro, and C. Peterson (2006), Tran-scriptional dynamics of the embryonic stem cell switch, PLoS ComputationalBiology, 2(9), e123.
[16] Chiti, F., and C. M. Dobson (2006), Protein misfolding, functional amyloid,and human disease, Annu. Rev. Biochem., 75, 333–366.
[17] Christis, C., A. Fullaondo, D. Schildknegt, S. Mkrtchian, A. J. R. Heck, andI. Braakman (2010), Regulated increase in folding capacity prevents unfoldedprotein stress in the ER, J. Cell. Sci., 123, 787–794.
[18] Cleland, J. L., M. F. Powell, and S. J. Shire (1993), The development of stableprotein formulations: A close look at protein aggregation, deamidation, andoxidation, Crit. Rev. Ther. Drug. Carrier. Syst., 10, 307–377.
[19] Cohen, R. J., and G. B. Benedek (1982), Equilibrium and kinetic theory ofpolymerization and the sol-gel transition, J. Phys. Chem., 86, 3696–3714.
[20] Come, J., P. Fraser, and P. L. Jr (1993), A kinetic model for amyloid formationin the prion diseases: importance of seeding., PNAS, 90, 5959–5963.
[21] Conradi, C., D. Flockerzi, J. Raisch, , and J. Stelling (2007), Subnetwork anal-ysis reveals dynamic features of complex (bio)chemical networks, PNAS, 104,19,175–19,180.
[22] Craciun, G., Y. Tang, and M. Feinberg (2006), Understanding bistability incomplex enzyme-driven reaction networks, Proceedings of the National Academyof Sciences, USA, 103, 86978702.
[23] Crick, F. (1970), Central dogma of molecular biology, Nature, 227, 561–563.
[24] Cui, J., C. Chen, H. Lu, T. Sun, and P. Shen (2007), Two independent positivefeedbacks and bistability in the bcl-2 apoptotic switch, PLoS One, 1, e1469.
[25] Dima, R., and D. Thirumalai (2002), Exploring protein aggregation and self-propagation using lattice models: Phase diagram and kinetics, Protein Science,11 (5), 1036–1049, doi:10.1110/ps.4220102.
105

[26] Dong, X., Y. Huang, and Y. Sun (2004), Refolding kinetics of denatured-reducedlysozyme in the presence of folding aids, J Biotechnol, 114, 135–142.
[27] Eigen, M. (1996), Prionics or the kinetic basis of prion diseases, Biophys. Chem.,63, A1–18.
[28] Epstein, I. R., and J. A. Pojman (1998), An introduction to nonlinear chemicaldynamics, Oxford University Press, New York.
[29] Feinberg, M. (1987), Chemical reaction network structure and the stability ofcomplex isothermal reactorsi. the deficiency zero and deficiency one theorems,Chem Eng Sci, 42, 2229–2268.
[30] Feinberg, M. (1988), Chemical reaction network structure and the stability ofcomplex isothermal reactorsii. multiple steady states for networks of deficiencyone, Chem Eng Sci, 43, 1–25.
[31] Ferraro-Gonzales, A. D., S. O. S. J. L. Silva, and D. Foguel (2000), The preag-gregated state of an amyloidogenic protein: hydrostatic pressure converts na-tive transthyretin into the amyloidogenic state, Proc. Natl. Acad. Sci. USA, 97,6445–6450.
[32] Ferrell, J., and E. Machleder (1998), The biochemical basis of an all-or-nonecell fate switch in xenopus oocytes, Science, 280, 895–898.
[33] Ferrone, F. (1999), [17] analysis of protein aggregation kinetics, in Amyloid,Prions, and Other Protein Aggregates, Methods in Enzymology, vol. 309, editedby R. Wetzel, pp. 256 – 274, Academic Press, doi:10.1016/S0076-6879(99)09019-9.
[34] Ferrone, F., J. Hofrichter, H. Sunshine, and W. Eaton (1980), Kinetic studies onphotolysis-induced gelation of sickle cell hemoglobin suggest a new mechanism,Biophysical Journal, 32 (1), 361 – 380, doi:10.1016/S0006-3495(80)84962-9.
[35] Firestone, M., R. D. Levie, and S. Rangarajan (1983), On one-dimensionalnucleation and growth of living polymers i. homogeneous nucleation, Journalof Theoretical Biology, 104 (4), 535 – 552, doi:10.1016/0022-5193(83)90244-8.
[36] for Biotechnology Information, N. C. (), Pubmed.
[37] Frieden, C., and D. Goddette (1983), Polymerization of actin and actin-likesystems: evaluation of the time course of polymerization in relation to themechanism, Biochemistry, 22, 5836–5843.
[38] Gast, K., A. J. Modler, H. Damaschun, R. Krober, G. Lutsch, D. Zirwer,R. Golbik, and G. Damaschun (2003), Effect of environmental conditions onaggregation and fibril formation of barstar, Eur. Biophys. J., 32, 710–723.
106
[39] Gibson, T., and R. Murphy (2006), Inhibition of insulin fibrillogenesis withtargeted peptides, Protein Sci, 15, 1133–1141.
[40] Gidalevitz, T., A. Ben-Zvi, K. H. Ho, H. R. Brignull, and R. I. Morimoto (2006),Progressive disruption of cellular protein folding in models of polyglutaminediseases, Science, 311 (5766), 1471–1474.
[41] Giger, K., R. P. Vanam, E. Seyrek, and P. L. Dubin (2008), Suppression ofinsulin aggregation by heparin, Biomacromolecules, 9, 2338–2344.
[42] Goldstein, R., and L. Stryer (1986), Cooperative polymerization reactions. an-alytical approximations, numerical examples, and experimental strategy, Bio-physical Journal, 50 (4), 583 – 599, doi:10.1016/S0006-3495(86)83498-1.
[43] Google (), Scholar.
[44] Grant, A. G., and R. Hoffenberg (1977), The effect of dietary protein deprivationon protein synthesis in the isolated liver parenchymal cell, Br. J. Nutr., 38, 255–260.
[45] Gray, P., and S. K. Scott (1994), Chemical Oscillations and Instabilities, OxfordUniversity Press, Oxford.
[46] Griffith, J. (1967), Nature of the scrapie agent: Self-replication and scrapie,Nature, 215, 1043–1044.
[47] Gustafsson, M., J. Thyberg, J. Nslund, E. Eliasson, and J. Johansson (1999),Amyloid fibril formation by pulmonary surfactant protein c, FEBS Lett., 464,138–142.
[48] Hayase, K., and H. Yokogoshi (1994), Age affects brain protein synthesis inrats, J. Nutr., 124, 683–688.
[49] Hines, M. L., T. Morse, M. Migliore, N. T. Carnevale, , and G. M. Shepherd(2004), Modeldb: A database to support computational neuroscience, Journalof Computational Neuroscience, 17, 7–11.
[50] Hodish, I., M. Liu, G. Rajpal, D. Larkin, R. W. Holz, A. Adams, L. Liu, andP. Arvan (2010), Misfolded proinsulin affects bystander proinsulin in neonataldiabetes, J. Biol. Chem., 285, 685–694.
[51] Hofrichter, J., P. D. Ross, and W. A. Eaton (1974), Kinetics and mechanismof deoxyhemoglobin s gelation: A new approach to understanding sickle celldisease, PNAS, 71, 4864–4868.
[52] Ishida, Y., Kubota, A. Yamamoto, A. Kitamura, H. Bchinger, and K. Nagata(2006), Type i collagen in hsp47-null cells is aggregated in endoplasmic retic-ulum and deficient in n-propeptide processing and fibrillogenesis, Mol. Biol.Cell., 17, 2346–2355.
107
[53] Julien, M., and D. Thusius (1976), Mechanism of bovine liver glutamate de-hydrogenase self-assembly. iii. characterization of the association-dissociationstoichiometry with quasi-elastic light scattering, J Mol Biol, 101, 397–416.
[54] Kacser, H., and J. Small (1996), How many phenotypes from one genotype?The case of prion diseases, J. Theor. Biol., 182, 209–218.
[55] Kamihira, M., A. Naito, S. Tuzi, A. Nosaka, and H. Sait (2000), Conformationaltransitions and fibrillation mechanism of human calcitonin as studied by high-resolution solid-state 13c nmr, Protein Sci, 9, 867–877.
[56] Kayo, T., and A. Koizumi (1998), Mapping of murine dabetogenic gene modyon chromosome 7 at d7mit258 and its involvement in pancreatic islet and betacell development during the perinatal period, J. Clin. Invest., 101, 2112–2118.
[57] Kayser, V., N. Chennamsetty, V. Voynov, B. Helk, K. Forrer, and B. L. Trout(2011), Evaluation of a non-arrhenius model for therapeutic monoclonal an-tibody aggregation, Journal of Pharmaceutical Sciences, 100 (7), 2526–2542,doi:10.1002/jps.22493.
[58] Kellershohn, N., and M. Laurent (2001), Prion diseases: dynamics of the infec-tion and properties of the bistable transition, Biophys. J., 81, 2517–2529.
[59] Kincaid, M. M., and A. A. Cooper (2007), Misfolded proteins traffic from theendoplasmic reticulum (ER) due to ER export signals, Mol. Biol. Cell, 18 (2),455–463.
[60] Lai, Z., J. McCulloch, H. A. Lashuel, and J. W. Kelly (1997), Guanidinehydrochloride-induced denaturation and refolding of transthyretin exhibits amarked hysteresis: equilibria with high kinetic barriers, Biochemistry, 36,10,230–10,239.
[61] Laurent, M. (1996), Prion diseases and the ‘protein only’ hypothesis: a theo-retical dynamic study, Biochem. J., 318, 35–39.
[62] Legleiter, J., E. Mitchell, G. Lotz, E. Sapp, C. Ng, M. DiFiglia, L. Thompson,and P. Muchowski (2010), Mutant huntingtin fragments form oligomers in apolyglutamine length-dependent manner in vitro and in vivo, J. Biol. Chem.,285, 14,777–14,790.
[63] Librizzi, F., V. Foder, V. Vetri, C. L. Presti, and M. Leone (2007), Effects ofconfinement on insulin amyloid fibrils formation, Eur Biophys J, 36, 711–715.
[64] Lin, M.-S., L.-Y. Chen, H.-T. Tsai, S. S.-S. Wang, Y. Chang, A. Higuchi, andW.-Y. Chen (2008), Investigation of the mechanism of -amyloid fibril formationby kinetic and thermodynamic analyses, Langmuir, 24 (11), 5802–5808, doi:10.1021/la703369b, pMID: 18452319.
108
[65] Lindquist, S. (2000), But yeast prion offers clues about evolution, Nature, 408,17–18.
[66] Liu, M., J. Ramos-Castaeda, and P. Arvan (2003), Role of the connecting pep-tide in insulin biosynthesis, J. Biol. Chem., 278, 14,798–14,805.
[67] Liu, M., Y. Li, D. Cavener, and P. Arvan (2005), Proinsulin disulfide matura-tion and misfolding in the endoplasmic reticulum, J. Biol. Chem., 280, 13,209–13,212.
[68] Liu, M., I. Hodish, C. J. Rhodes, and P. Arvan (2007), Proinsulin maturation,misfolding, and proteotoxicity, Proc. Natl. Acad. Sci. USA, 204, 15,841–15,846.
[69] Liu, M., I. Hodish, L. Haataja, R. Lera-Lemus, G. Rajpal, J. Wright, andP. Arvan (2010), Proinsulin misfolding and diabetes: mutant ins gene-induceddiabetes of youth, Trends Endocrinol. Metab., 21, 652–659.
[70] Lomakin, A., D. Teplow, D. Kirschner, and G. Benedek (1997), Kinetic theoryof fibrillogenesis of amyloid beta protein, PNAS, 94, 7942–7947.
[71] M, M. P., M. Hafner, and C. Frech (2010), Mechanism of gemini disulfide de-tergent mediated oxidative refolding of lysozyme in a new artificial chaperonesystem, Protein J, 29, 457–465.
[72] Macey R, O. O. (2010), Berkeley madonna.
[73] Markevich, N., J. Hoek, and B. Kholodenko (2004), Signaling switches andbistability arising from multisite phosphorylation in protein kinase cascades,Journal of Cellular Biology, 164(3), 353–9.
[74] Martnez-Forero, I., A. Pelez-Lpez, and P. Villoslada (2010), Steady state detec-tion of chemical reaction networks using a simplified analytical method, PLoSOne, 5, e10,823.
[75] Meersman, F., and K. Heremans (2003), Temperature-induced dissociation ofprotein aggregates: accessing the denatured state, Biochemistry, 42, 14,234–14,241.
[76] Mer, V. K. L. (1952), Nucleation in phase transitions., Industrial & EngineeringChemistry, 44 (6), 1270–1277, doi:10.1021/ie50510a027.
[77] Milo, R., S. Itzkovitz, N. Kashtan, R. Levitt, S. Shen-Orr, I. Ayzenshtat,M. Sheffera, and U. Alon (2004), Superfamilies of evolved and designed net-works, Science, 303, 1538–1542.
[78] Mitchell, M. (2009), Engauge digitizer.
[79] Morimoto, R. I. (2008), Proteotoxic stress and inducible chaperone networks inneurodegenerative disease and aging, Genes Dev., 22, 1427–1438.
109
[80] Morley, J. F., H. R. Brignull, J. J. Weyers, and R. I. Morimoto (2002), Thethreshold for polyglutamine-expansion protein aggregation and cellular toxicityis dynamic and influenced by aging in caenorhabditis elegans, Proc. Natl. Acad.Sci. USA, 99, 10,417–10,422.
[81] Morris, A. M., M. A. Watzky, J. N. Agar, and R. G. Finke (2008), Fitting neuro-logical protein aggregation kinetic data via a 2-step, minimal “ockham’s razor”model: the Finke-Watzky mechanism of nucleation followed by autocatalyticsurface growth, Biochemistry, 47, 2413–2427.
[82] Morris, A. M., M. A. Watzky, and R. G. Finke (2009), Protein aggregationkinetics, mechanism, and curve-fitting: A review of the literature, Biochim.Biophys. Acta, 1794, 375–397.
[83] Nag, A., and R. S. Berry (2007), Thermodynamics and kinetics of compet-ing aggregation processes in a simple model system, The Journal of ChemicalPhysics, 127 (18), 184503, doi:10.1063/1.2777137.
[84] Nakatsukasa, K., and J. L. Brodsky (2008), The recognition and retrotransloca-tion of misfolded proteins from the endoplasmic reticulum, Traffic, 9, 861–870.
[85] Novre, N. L., et al. (2005), Minimum information requested in the annotationof biochemical models (miriam), Nature Biotechnology, 23, 1509–1515.
[86] Novre, N. L., et al. (2006), Biomodels database: a free, centralized databaseof curated, published, quantitative kinetic models of biochemical and cellularsystems, Nucleic Acids Research, 34, D689–D691.
[87] Olivier, B. G., and J. L. Snoep (2004), Web-based kinetic modelling using jwsonline, Bioinformatics, 20, 2143–2144.
[88] Ortega, F., J. Garces, F. Mas, B. Kholodenko, and M. Cascante (2006), Bista-bility from double phosphorylation in signal transduction, kinetic and structuralrequirements, FEBS Journal, 273, 3915–3926.
[89] Osterwalder, T., P. Cinelli, A. Baici, S. K. A. Pennella, S. Schrimpf, M. Meins,and P. Sonderegger (1998), The axonally secreted serine proteinase inhibitor,neuroserpin, inhibits plasminogen activators and plasmin but not thrombin, J.Biol. Chem, 273, 2312–2321.
[90] Ozbudak, E., M. Thattai, H. Lim, B. Shraiman, and A. V. Oudenaarden (2004),Multistability in the lactose utilization network of escherichia coli, Nature,427(6976), 737–40.
[91] Paladugu, S., V. Chickarmane, A. Deckard, J. Frumkin, M. McCormack, andH. Sauro (2006), In silico evolution of functional modules in biochemical net-works, Systems Biology, IEE Proceedings, 153, 223–235.
110

[92] Pallitto, M., and R. Murphy (2001), A mathematical model of the kinetics ofβ-amyloid fibril growth from the denatured state, Biophys J, 81, 1805–1822.
[93] Paulson, H., and K. Fischbeck (1996), Trinucleotide repeats in neurogeneticdisorders, Annu Rev Neurosci, 19, 79–107.
[94] Pimienta, V., D. Lavabre, G. Levy, J. Micheau, and J. Laplante (1995), Bistablephotochemical reactions, Journal of Molecular Liquids, 63, 121–173.
[95] Polager, S., and D. Ginsberg (2009), p53 and e2f: partners in life and death,Nature Reviews Cancer, 9(10), 738–48.
[96] Pomerening, J. (2008), Uncovering mechanisms of bistability in biological sys-tems, Current Opinions Biotechnology, 19(4), 381–8.
[97] Porcher, E., and M. Gatto (2000), Quantifying the dynamics of prion infection:a bifurcation analysis of Laurent’s model, J. Theor. Biol., 205, 283–296.
[98] Pots, A. M., H. Gruppen, H. H. J. de Jongh, M. A. J. S. van Boekel, P. Walstra,and A. G. J. Voragen (1999), Kinetic modeling of the thermal aggregation ofpatatin, Journal of Agricultural and Food Chemistry, 47 (11), 4593–4599, doi:10.1021/jf990191t.
[99] Powers, E. T., and D. L. Powers (2008), Mechanisms of protein fibril formation:Nucleated polymerization with competing off-pathway aggregation, BiophysicalJournal, 94 (2), 379 – 391, doi:10.1529/biophysj.107.117168.
[100] Privalov, P. L. (1996), Intermediate states in protein folding, J. Mol. Biol., 258,707–725.
[101] Prusiner, S. B. (1982), Novel proteinaceous infectious particles cause scrapie.,Science, 216, 136–144.
[102] Rahkonen, O., M. Su, H. Hakovirta, I. Koskivirta, S. G. Hormuzdi, E. Vuorio,P. Bornstein, and R. Penttinen (2003), Mice with a deletion in the first intronof the Col1a1 gene develop age-dependent aortic dissection and rupture, Circ.Res., 94, 83–90.
[103] Ramakrishnan, N., and U. Bhalla (2008), Memory switches in chemical reactionspace, PLoS Computational Biology, 4(7), e1000,122.
[104] Reisler, E., J. Pouyet, and H. Eisenberg (1970), Molecular weights, associa-tion, and frictional resistance of bovine liver glutamate dehydrogenase at lowconcentrations. equilibrium and velocity sedimentation, light-scattering stud-ies, and settling experiments with macroscopic models of the enzyme oligomer,Biochemistry, 9, 3095–3102.
[105] Resource, T. N. S. (2010), Jsim.
111
[106] Reuters, T. (2010), Web of knowledge.
[107] Rieger, T. R., R. I. Morimoto, and V. Hatzimanikatis (2006), Bistability ex-plains threshold phenomena in protein aggregation both in vitro and in vivo,Biophys. J., 90, 886–895.
[108] Roberts, C. J. (2003), Kinetics of irreversible protein aggregation: Analysis ofextended lumry-eyring models and implications for predicting protein shelf life,J. Phys. Chem. B, 107, 1194–1207.
[109] Roberts, C. J. (2007), Non-native protein aggregation kinetics, Biotechnol. Bio-eng., 98, 927–938.
[110] Roberts, C. J., R. T. Darrington, and M. B. Whitley (2003), Irreversible ag-gregation of recombinant bovine granulocyte-colony stimulating factor (bg-csf)and implications for predicting protein shelf life, Journal of PharmaceuticalSciences, 92 (5), 1095–1111, doi:10.1002/jps.10377.
[111] Roefs, S. P. F. M., and K. G. De Kruif (1994), A model for the denaturationand aggregation of -lactoglobulin, European Journal of Biochemistry, 226 (3),883–889, doi:10.1111/j.1432-1033.1994.00883.x.
[112] Ross, C. A., and M. A. Poirier (2004), Protein aggregation and neurodegener-ative disease, Nat. Med., 10, S10–S17.
[113] Rubinsztein, D. C., et al. (1996), Phenotypic characterization of individualswith 30-40 CAG repeats in the huntington disease (HD) gene reveals HD caseswith 36 repeats and apparently normal elderly individuals with 36-39 repeats,Am. J. Hum. Genet., 59, 16–22.
[114] Sabouri-Ghomi, M., A. Ciliberto, S. Kar, B. Novk, and J. Tyson (2008), An-tagonism and bistability in protein interaction networks, J Theor Biol, 250,209–218.
[115] Sandefur, C. I., and S. Schnell (2011), A model of threshold behavior revealsrescue mechanisms of bystander proteins in conformational diseases, Biophys J,100, 1864–1873.
[116] Sathasivam, K., I. Amaechi, L. Mangiarini, and G. Bates (1997), Identificationof an HD patient with a (CAG)180 repeat expansion and the propagation ofhighly expanded CAG repeats in lambda phage, Hum. Gen., 99, 692–695.
[117] Scheibel, T., J. Bloom, and S. L. Lindquist (2004), The elongation of yeastprion fibers involves separable steps of association and conversion, Proceedingsof the National Academy of Sciences of the United States of America, 101 (8),2287–2292, doi:10.1073/pnas.0308754101.
[118] Schnell, S. (2009), A model of the unfolded protein response: Pancreatic β-cellas a case study, Cellular Physiology and Biochemistry, 23, 233–244.
112
[119] Schroder, M., and R. J. Kaufman (2005), ER stress and the unfolded proteinresponse, Mut. Res-Fund. Mol. M., 569, 29–63.
[120] Segel, L. A. (1972), Simplification and scaling, SIAM Review, 14, 547–571.
[121] Segel, L. A. (1984), Modeling dynamic phenomena in molecular and cellularbiology, Cambridge University Press.
[122] Selkoe, D. (2001), Alzheimer’s disease: genes, proteins, and therapy, Physiol.Rev., 81, 741–766.
[123] Shorter, J., and S. Lindquist (2004), Hsp104 catalyzes formation and elimina-tion of self-replicating Sup35 prion conformers, Science, 304, 1793–1797.
[124] Siegal-Gaskins, D., M. Mejia-Guerra, G. Smith, and E. Grotewold (2010),Emergence of switch-like behavior in a large family of simple biochemical net-works, PLoS Comput Biol, 7, e1002,039.
[125] Soto, C. (2003), Unfolding the role of protein misfolding in neurodegenerativediseases, Nat. Rev. Neurosci., 4, 49–60.
[126] Speed, M., J. King, and D. Wang (1997), Polymerization mechanism of polypep-tide chain aggregation, Biotechnol. Bioeng., 54, 333–343.
[127] Takasawa, A., et al. (2008), Mutation-, aging-, and gene dosage-dependent ac-cumulation of neuroserpin (g392e) in endoplasmic reticula and lysosomes ofneurons in transgenic mice, J. Biol. Chem, 283, 35,606–35,613.
[128] Tehver, R., and D. Thirumalai (2008), Kinetic model for the couplingbetween allosteric transitions in groel and substrate protein folding andaggregation, Journal of Molecular Biology, 377 (4), 1279 – 1295, doi:10.1016/j.jmb.2008.01.059.
[129] Thusius, D. (1975), Mechanism of bovine liver glutamate dehydrogenase self-assembly: Ii. simulation of relaxation spectra for an open linear polymerizationproceeding via a sequential addition of monomer units, J. Mol. Biol, 94, 367–383.
[130] Thusius, D., P. Dessen, and J.-M. Jallon (1975), Mechanism of bovine liverglutamate dehydrogenase self-association: I. kinetic evidence for a random as-sociation of polymer chains, Journal of Molecular Biology, 92 (3), 413 – 432,doi:10.1016/0022-2836(75)90289-2.
[131] Tyson, J. J., and B. Novak (2010), Functional motifs in biochemical reactionnetworks, Ann Rev Phys Chem, 61, 219–240.
[132] Voigt, C., D. Wolf, and A. Arkin (2005), The bacillus subtilis sin operon: anevolvable network motif, Genetics, 169(3), 1187–202.
113

[133] Wang, Z., R. Natte, J. A. Berliner, S. G. van Duinen, and H. V. Vinters (2000),Toxicity of Dutch (E22Q) and Flemish (A21G) mutant amyloid β proteins tohuman cerebral microvessel and aortic smooth muscle cells, Stroke, 31, 534–538.
[134] Wegner, A., and J. Engel (1975), Kinetics of the cooperative association of actinto actin filament, Biophy. Chem., 3, 215–225.
[135] Wegner, A., and P. Savko (1982), Fragmentation of actin filaments, Biochem-istry, 21 (8), 1909–1913, doi:10.1021/bi00537a032.
[136] Wernicke, S., and F. Rasche (2006), Fanmod: a tool for fast network motifdetection, Bioinformatics, 22(9), 1152–3.
[137] Wetzel, R. (1996), For protein misassembly, it’s the “I” decade, Cell, 86, 699–702.
[138] Wilhelm, T. (2009), The smallest chemical reaction system with bistability,BMC Systems Biology, 3, 90.
[139] Xiong, W., and J. Ferrell (2003), A positive-feedback-based bistable ’memorymodule’ that governs a cell fate decision, Nature, 426(6965), 460–5.
[140] yan Zhang, B., M. Lui, and P. Arvan (2003), Behavior in the eukaryotic se-cretory pathway of insulin-containing fusion proteins and single-chain insulinsbearing various B-chain mutations, J. Biol. Chem., 278, 3687–3693.
[141] Zhdanov, V., and B. Kasemo (2004), Kinetics of protein aggregation with for-mation of unreactive intermediates, Langmuir, 20, 2543–2545.
114