de-novo amino acid sequence elucidation of protein top ... · “de-novo” amino acid sequence...
TRANSCRIPT

B American Society for Mass Spectrometry, 2014DOI: 10.1007/s13361-014-1053-2
J. Am. Soc. Mass Spectrom. (2015) 26:482Y492
RESEARCH ARTICLE
“De-novo” amino acid sequence elucidation of proteinG′e by combined “Top-Down” and “Bottom-Up” massspectrometry
Yelena Yefremova,1 Mahmoud Al-Majdoub,1 Kwabena F. M. Opuni,1 Cornelia Koy,1
Weidong Cui,2 Yuetian Yan,2 Michael L. Gross,2 Michael O. Glocker1
1Proteome Center Rostock, University Rostock Medical Center, Rostock, Germany2Department of Chemistry, Washington University in St. Louis, St. Louis, MO, USA
Abstract.Mass spectrometric de-novo sequencing was applied to review the aminoacid sequence of a commercially available recombinant protein G´ with great scien-tific and economic importance. Substantial deviations to the published amino acidsequence (Uniprot Q54181) were found by the presence of 46 additional amino acidsat the N-terminus, including a so-called “His-tag” as well as an N-terminal partial α-N-gluconoylation and α-N-phosphogluconoylation, respectively. The unexpected aminoacid sequence of the commercial protein G′ comprised 241 amino acids and resultedin amolecular mass of 25,998.9 ± 0.2Da for the unmodified protein. Due to the highermass that is caused by its extended amino acid sequence compared with the originalprotein G′ (185 amino acids), we named this protein “protein G′e.” By means of mass
spectrometric peptide mapping, the suggested amino acid sequence, as well as the N-terminal partial α-N-gluconoylations, was confirmed with 100% sequence coverage. After the protein G′e sequence was determined,we were able to determine the expression vector pET-28b from Novagen with the Xho I restriction enzymecleavage site as the best option that was used for cloning and expressing the recombinant protein G′e in E. coli. Adissociation constant (Kd) value of 9.4 nM for protein G′e was determined thermophoretically, showing that the N-terminal flanking sequence extension did not cause significant changes in the binding affinity to immunoglobulins.Keywords: Top-down MS, Bottom-up MS, MALDI ToF MS, ESI-MS, FTICR MS, Thermophoresis, Amino acidsequencing, PTM analysis, Kd value
Received: 5 October 2014/Revised: 20 November 2014/Accepted: 20 November 2014/Published Online: 6 January 2015
Introduction
Since DNA sequencing was introduced in the mid-seventiesof the last century, it gained great importance in suggesting
amino acid sequences of proteins by simple translation of thegene sequence [1]. However, significant possibilities of aminoacid sequence aberrations due to mutations, amino acid substi-tutions in (recombinant) proteins (e.g., by wobbling, [2]), or byaltering the expression system, are inherent to this DNA-based
protein sequence determination approach [3, 4]. Unexpectedpost-translational modifications (PTMs) are not accessible.
Continuously growing possibilities of mass spectrometry-based fragmentation techniques, such as collisional induced dis-sociation (CID) and electron capture dissociation (ECD), enor-mously facilitate direct sequence determination of even fairly largeintact proteins by so-called “top-down” protein sequencing [5].
Consequently, this mass spectrometry-driven amino acidsequencing approach opens the opportunity to revise DNA-derived sequence information of many proteins [6, 7]. Theimportance of these MS-based sequencing avenues for scien-tific projects has been emphasized by the fact that deviations inpreviously annotated amino acid sequences of several recom-binant proteins have been reported [8–10]. Here we apply thismass spectrometry-driven amino acid sequencing approach toprotein G′, a commercially available protein with great
Electronic supplementary material The online version of this article(doi:10.1007/s13361-014-1053-2) contains supplementary material, which isavailable to authorized users.
Correspondence to: Michael Glocker; e-mail: [email protected]
scientific and economic importance that is available frommanycompanies around the world.
Protein G was discovered as a cell-surface protein of differ-ent Streptococcus species in 1973 [11], and first amino acidsequences were reported in the mid-eighties [12, 13]. Its as-tounding binding properties to mammalian immunoglobulin G(IgG) fostered extensive research on functional optimization upto the mid-nineties [14–19]. Depending on the streptococcalstrain, protein G contains, in addition to three domains for IgGbinding, two or three domains that bind to mammalian serumalbumin [20, 21]. Initial difficulties in purification of protein Gdirectly from the streptococcal cell wall were overcome afterthe DNA sequence of its encoding gene was successfullyoverexpressed in E. coli [12, 22]. Later, truncated genes (e.g.,from the Streptococcus strain G 148) that encoded just for thethree IgG binding domains were cloned and expressed inE. coli. The shorter protein was named protein G′ [23] todifferentiate it from the full-length protein G. Owing to itsextraordinary high binding affinity to immunoglobulins, pro-tein G′ is now widely used in many immunologically andbiotechnologically applied techniques world-wide. Whencoupled to a chromatography resin, protein G′ has become anindispensable workhorse for affinity purification of antibodiesand of Ig-tagged recombinant proteins [24]. Versatile applica-tions of protein G′ have been reported numerously (reviewed in[25, 26]), from which only a few shall be mentioned: isolationof IgG fractions from patient samples; immuno-precipitation[27, 28]; depletion of IgG from biological samples [29, 30];Western blot analysis [31]; affinity membrane chromatography[32]; peptide immunoaffinity enrichment using protein-G′coated magnetic beads [33]; development of protein G′-coupled receptors [34]; and generation of immunosensors [35].
For studying the principles of function and the dynamics ofprotein G′-binding to IgG, knowledge of its structure is aprerequisite. Hence, the first piece of information, whenconducting a study on protein—protein interactions, is to col-lect the amino acid sequences of both interaction partners. Forprotein G′ this requirement sounds trivial, as recombinantprotein G′-containing products can be found in catalogs ofalmost every supplier in the biotechnological field, includingSigma-Aldrich, Merck-Millipore, Thermo-Scientific, Life-Technologies, and Biocat, to name just a few. According tothe product information provided by the suppliers, the com-mercial protein G′ carries three IgG binding domains, whichcalculate to a molecular mass of ca. 20 kDa. Yet, on sodiumdodecyl sulfate polyacrylamide gel electrophoresis (SDS-PAGE), protein G′ shows an apparent molecular weight ofca. 35 kDa [12]. Strikingly, despite the huge sales market forprotein G′, information about the amino acid sequence of thecommercial products is poor. Vendors of recombinant proteinG′ are rarely able to provide the amino acid sequence of theirproduct. Upon request, customers are referred to the literaturefrom the 1980s and 1990s. Although the amino-acid sequencethat is given in the respective reports stands in agreement withthe molecular mass of 20 kDa for protein G′ [23], the mass ofthe commercial product does not. Applyingmass spectrometric
analysis to the product in our hands, we found a mass increaseof 6 kDa for which no explanation was retrievable. Informationabout the existence of a His-tag and sometimes of biotinylationdid not explain the mass difference. Unfortunately, the aberrantSDS-PAGE migration behavior of protein G′ prevents easydiscovery of any size-related irregularities in the protein understudy.
Thus, to study the binding properties and possible influ-ences on these interactions of the mutual additional parts inprotein G′, we first had to determine the amino acid sequence ofthe commercially available product, from here on referred to as“protein G prime e (protein G′e).” We employed massspectrometry-based top-down “de-novo” sequencing, assistedby bottom-up approaches, for elucidating its amino acid se-quence and potential modifications. The newly determinedamino acid sequence of protein G′e was confirmed by massspectrometric peptide mapping. Finally, we assessed the disso-ciation constant of protein G′e towards IgG binding by micro-scale thermophoresis.
Materials and MethodsSDS PAGE Analysis of Intact Protein G′e
Protein G′e was obtained as lyophilized powder from Sigma(catalog no. P4689-5MG; lot no. SLBB8536V). A stock solu-tion (2 μg/μL) of protein G'e was prepared by dissolving 500μg of the protein in 250 μL of 100 mM ammonium bicarbon-ate, pH 8. Next, the stock solution was diluted with 100 mMammonium bicarbonate, pH 8, to obtain a working solutionwith a final protein G′e concentration of 1 μg/μL. One μL ofthis protein G′e working solution was mixed with 9 μL of waterand 2.5 μL of SDS sample buffer (312.5 mM tris-(hydroxy-methyl) aminomethane (TRIS), 10% SDS, 50% glycerol, 325mM dithiothreitol (DTT) and 6 mM bromophenol blue). Thismixture was loaded directly onto a NuPAGE 10% Bis-Tris gel(Invitrogen, Karlsruhe, Germany). The protein mass marker(Broad Range, New England BioLabs, Frankfurt/Main, Ger-many) was used to determine the apparent molecular mass ofthe loaded sample. The gel was placed into an electrophoresischamber, and power was applied for 1 h at 200 V; 3-(N-morpholino) propanesulfonic acid (MOPS) buffer (25 mMMOPS, 25 mM TRIS, 3.5 mM SDS, and 1 mMethylenediamine tetra-acetic acid) were used as running buffer.Afterwards, the gel was removed from the plates, and theproteins were fixed in the gel by bathing it for 1 h at roomtemperature in 50 mL of fixation solution (50% ethanol, 10%acetic acid). Proteins were stained overnight at room tempera-ture with 50 mL colloidal Coomassie brilliant blue G250 (CBBG250) solution that contains 2.3% phosphoric acid (85%), 10%ethanol, 5% aluminum sulfate 14–18 hydrate, and 0.02% CBBG250. Then, the gel was washed with 50 mL of destainingsolution [2.3% phosphoric acid (85%), 10% ethanol] twice for1 h, each, at room temperature. Stained gels were immediatelyscanned with the Umax Mirage II Scanner (Umax Data Sys-tems, Willich, Germany) [36].
Y. Yefremova et al.: “De-Novo” Sequencing of Protein G′e 483

Desalting of Intact Protein G′e
First, reversed phase (RP)-packed tip material (ZipTip C4 tips;Millipore, Billerica, MA, USA) was reconstituted using 50%ACN, pH 5.8, and an equilibration solution (0.1% TFA, pH1.7), respectively, by aspirating and dispensing 10 μL of eachsolution twice. Next, 5 μL of protein G′e working solution (seeabove) was mixed with 5 μL of equilibration solution andloaded onto the RP-packed tip (Zip Tip) material by aspiratingand dispensing 10 times. Next, washing was performed byaspirating and dispensing twice using 10 μL of equilibrationsolution. Then, protein G′e was eluted with 5 μL of 80% ACN,0.1% TFA, pH 1.7, by passing it through the RP-packed tip(ZipTip) material 10 times. The resulting concentration ofprotein G′e was 0.3 μg/μL. The concentration was determinedusing the Bio-Rad Protein Assay (Bio-Rad, Munich, Germany)[37, 38].
Nano-ESI MS Analysis of Intact Protein G′e
Protein G′e (150 μg) was dissolved in 150 μL of 2% aqueousacetic acid:MeOH (95:5, v/v), pH 2.5, to obtain a final proteinconcentration of 1 μg/μL. 5 μL of this solution was loaded intoan EconoTip emitter (ECONO10; New Objective Inc., Wo-burn, MA, USA) using a microloader pipette tip (Eppendorf,Hamburg, Germany). Mass spectra were acquired in thepositive-ion mode using a Waters electrospray ionization (ESI)Q-ToF II mass spectrometer (Waters MS-Technologies, Man-chester, UK), setting the mass window to m/z 100–4000 [39].The following experimental parameters were used for all mea-surements: capillary voltage, 1.5 kV; extractor cone, 3 V; radiofrequency (rf) lens, 1.2 V; source temperature, 60°C; nitrogencounter flow gas, 50 L/h; scan rate, 7 s/scan; digitization rate, 4GHz; microchannel plate detector voltage, 1950 V. Sample conevoltage settings were changed between 60 V and 160 V. Dataacquisition and processing was performed with the MassLynxsoftware ver. 4.0 (Waters MS-Technologies). External calibra-tion was performed with 1% phosphoric acid dissolved in atrifluoroethanol/water solution (50:50, v/v) [40, 41].
Top-Down Protein Sequencing of Intact Protein G′eby ESI-ECD-FT-ICR-MS
A syringe pump (Harvard PHD Ultra syringe pump; InstechLaboratories, Inc, Plymouth Meeting, PA, USA) was used toinfuse protein G′e (0.26 μg/μL dissolved in 0.1% FA in 60%ACN) at a flow rate of 200 nL/min for nano-electrosprayionization. The nano-ESI tips were prepared in-house fromsilica capillary tubing of 360 μm outer and 150 μm innerdiameters (Polymicro Technologies, Phoenix, AZ, USA) byusing a laser-based micropipette puller P-2000 (Sutter Instru-ment Co., Novato, CA, USA). ECD-based Fourier transform-ion cyclotron resonance (FT ICR) top-down sequencing wasperformed on a Bruker SolariX 12 T Fourier transform-ioncyclotron resonance (FT-ICR) mass spectrometer (BrukerDaltonics, Bremen, Germany) [42]. The following instrumen-tal settings were used: nano-ESI voltage, 0.9 kV; drying gas
temperature, 180°C; drying gas flow, 1.0 L/min. The Brukercontrol software does not provide a direct readout of the settingdelay between ion trapping and electron irradiation. The delayis estimated at tens of microseconds. The 26+ ion signal waschosen for isolation in the quadrupole region prior to transfer tothe ICR trap. A collision voltage of 2 V was applied foractivation of the precursor ions prior to ECD. The ECD cathodeheater current was 1.6 A, the bias was −0.4 eV, and duration ofthe electron beam was 0.1 ms. The FT ICR mass spectrometerwas externally calibrated with ubiquitin. Four thousand scansof 1 M data point spectrum were averaged. The acquired massspectra were further processed and analyzed with the DataAnalysis software (ver. 4.0. SP 5; Bruker Daltonics). Ion peakswere labeled by using the SNAP peak picking algorithm.Signal-to-noise threshold was set to 2 and the quality factorthreshold to 0.6. Fragment ion mass assignment was performedusing the BioTools 3.0 software (Bruker Daltonics), resultingin a MS/MS search error tolerance of below 25 ppm uponexternal calibration with ECD fragments of ubiquitin. Thepresumed amino acid sequence was edited and C″-type and Z′-type ions were automatically annotated and manually checked[43].
MALDI-ToF MS Analysis of Intact Protein G′e
A volume of 0.8 μL of desalted protein G′e (0.24 μg) wasdeposited on an AnchorChip 400/384 target plate (BrukerDaltonics) and mixed directly on the target with 2 μL of 2,5-dihydroxybenzoic acid solution (DHB; LaserBio Labs, Sophia-Antopolis, France; 5 μg/μL DHB in water/ACN/TFA; 49.9/50/0.1, v/v/v). MALDI spectra were acquired by using a Reflex IIIMALDI ToF mass spectrometer (Bruker Daltonics), equippedwith a SCOUT source, in positive-ion linear mode, setting theacceleration voltage to 20 kV. The mass window was set to0.7–41.3 kDa. A nitrogen laser (wavelength 337 nm, pulsewidth 3–5 ns) was used for desorption. Around 600 laser shotsper spectrum were summed and the accumulated spectra wereanalyzed with the FlexAnalysis 2.4 software (BrukerDaltonics). Spectra were externally calibrated using the proteincalibration standard I (Bruker Daltonics) [44, 45].
Protein Sequencing by MALDI-ISD-MS
A protein G′e stock solution (see above; 0.5 μL) was depositedon an AnchorChip 400/384 target plate (Bruker Daltonics).After complete solvent evaporation, 0.8 μL of sinapinic acid[LaserBio Labs, France; 10 mg/mL in EtOH:acetone(67:33, v/v)] was added. After drying, the matrix solutionaddition (0.8 μL, each) was repeated twice. Next, the driedsample–matrix mixture was washed with 5 μL of 1% TFAsolution. Matrix-assisted laser desorption/ionization (MALDI)-in source decay (ISD) mass spectra were acquired on a ReflexIII MALDI ToF mass spectrometer (Bruker Daltonics)equipped with a SCOUT source. Each single MALDI-ISDmass spectrum was acquired from 5000 summed laser shotsin the positive-ion mode over anm/z range 1000–10,000. Laserpower was set at 80%–90% to increase fragmentation. The
484 Y. Yefremova et al.: “De-Novo” Sequencing of Protein G′e
acceleration voltage was set to 20 kV, and reflector voltage was23 kV. Further data processing and analysis was performedusing FlexAnalysis 4.2 and BioTools 3.0 software (BrukerDaltonics). For ISD analysis, spectra were permanentlyassigned as “ISD-type.” Monoisotopic masses were labeled,and ion-signal assignment was performed manually bysubtracting m/z values of the neighboring signals, which cor-respond to loss of one amino acid. Next, deduced amino acidsequence was loaded into the sequence editor of BioTools andC″- and Y″-type ions were automatically annotated to verifythe manual assignment. With a mass tolerance of 0.7 Da,accurate assignment was possible for the ion signals withhigher m/z values above m/z 4000 and at the same time theassignment was accurate enough to correctly assign ion signalsbelow m/z 4000 [46].
In-Solution Digestion of Protein G′e with Trypsin
Protein G′e working solution (25 μL; see above), was subjectedto in-solution digestion with trypsin (Promega, Madison, WI,USA, reconstituted according to the manufacturer’s protocol) byusing an enzyme to substrate ratio of 1:100 (w/w). Digestion wasperformed at room temperature overnight. To stop digestion, theprotein–enzyme mixture was frozen and kept at −20°C [47].
Asp-N In-Solution Digestion of Protein G′e
Protein G′e working solution (25 μL; see above), was subjectedto in-solution digestion with Asp-N (Roche, Mannheim, Ger-many; reconstituted according to the manufacturer’s protocol)by using an enzyme to substrate ratio of 1:50 (w/w). Digestionwas performed at room temperature overnight. To stop thedigestion, the protein–enzyme mixture was frozen and kept at−20°C [48].
Desalting of Peptides from In-Solution Digestions
A volume of 5 μL of peptide solution derived from tryptic orAsp-N in-solution digestion of protein G′e (see above) wasdesalted with RP-packed tip (ZipTip C18 tips; Millipore, Bil-lerica, MA, USA). The RP-packed tip (ZipTip) material wasreconstituted with 50%ACN, pH 5.8, and with an equilibrationsolution (0.1% TFA, pH 1.7) by aspirating and dispensing10 μL of each solution twice. Next, 5 μL of the digest weremixed with 5 μL equilibration solution, and from this solutionpeptides were loaded onto the RP-packed tip (ZipTip) materialby aspirating and dispensing all the volume 10 times. After-wards, salts were removed with twice 10 μL of 0.1% TFA, pH1.7. Peptides were eluted with 5 μL of 80% ACN, 0.1% TFA,pH 1.7, by passing it through the RP-packed tip (ZipTip)device 10 times [49].
MALDI-ToF-MS Peptide Mapping
A volume of 0.8 μL of the protein G′e peptide mixture afterdesalting was prepared onto an AnchorChip 400/384 targetplate (Bruker Daltonics) with 2 μL of DHB (LaserBio Labs)matrix solution (5 μg/μL DHB in water/ACN/TFA, 49.9/50/
0.1 v/v/v). The preparation was allowed to dry, and the targetplate was introduced into the SCOUT source of the Reflex IIIMALDI ToF mass spectrometer (Bruker Daltonics). Spectra ofprotonated peptides (summing up about 600 laser shots) wereacquired either in reflector mode (mass window m/z 400–5000), or in linear mode (mass window m/z 2250–40,600).Acceleration and reflector voltages were 20 and 23 kV, respec-tively. Spectra were externally calibrated by using the peptidecalibration standard (reflector mode) and the protein calibrationstandard (linear mode) from Bruker Daltonics and recalibratedinternally using peptide ion signals derived from trypsinautoproteolysis. Mass spectra were further processed and ana-lyzed using the FlexAnalysis 4.2 and BioTools 3.0 software(Bruker Daltonics). Peptide ion signals were assigned andinterpreted manually comparing experimental m/z values witha peak list obtained from the theoretical digest of the presumedamino acid sequence of protein G′e, using the GPMAW ver.9.1 software (Lighthouse Data, Odense, Denmark) [50, 51].MS error tolerance for peptide mass fingerprinting was be-tween 20 and 30 ppm.
MALDI-QIT-ToF MS/MS Fragmentation
The protein G′e peptide mixture after desalting (0.8 μL) wasprepared on an AnchorChip 400/384 target plate (BrukerDaltonics). DHB (2 μL) (LaserBio Labs) matrix solution(5 μg/μL DHB in water/ACN/TFA, 49.9/50/0.1 v/v/v) wasadded. After drying, product ion (MS/MS) spectra were ac-quired on an Axima MALDI quadrupole ion trap (QIT) time offlight (ToF) mass spectrometer (Shimadzu Biotech, Manches-ter, UK) in the positive-ion mode by utilizing a 337 nm nitro-gen laser and a three-dimensional quadrupole ion trap suppliedwith a pulsed helium flow gas for cooling and argon gas tocause collisionally induced dissociation [52]. Spectra werecalibrated externally with a manually prepared peptide mixturecomposed of bradykinin (1–7) [M + H]+ 757.39, angiotensin II[M + H]+ 1046.53, angiotensin I [M + H]+ 1296.68, bombesin[M + H]+ 1619.81, N-acetyl renin substrate [M + H]+ 1800.93,ACTH (1–17) [M + H]+ 2093.08, ACTH (18–39) [M + H]+
2465.19, somatostatin [M + H]+ 3147.46, and insulin (oxidizedbeta chain) [M + H]+ 3494.64. For each spectrum, approxi-mately 2500 profiles were summed. Spectra processing andanalysis were performed by using the Launchpad software, ver.2.7.1 (Shimadzu Biotech). Ion-signal assignment and sequenceanalysis was performed with the de-novo sequencing softwareSeqLab ver. 1.5 (Shimadzu Biotech), and signal assignmentswere verified manually [53].
Protein G′e Interaction Analysis with IgG
A solution of 100 μL of protein G′e (10 μM) dissolved in100 mM ammonium acetate buffer, pH 6.9, was labeled with100 μL of the red fluorescent dye NT-647 (reconstituted ac-cording to the manufacturer’s protocol) using the MonolithProtein Labeling Kit RED-NHS (NanoTemper Technologies,Munich, Germany). After labeling, free dye was removed viafiltration through Gravity Flow Column B (NanoTemper
Y. Yefremova et al.: “De-Novo” Sequencing of Protein G′e 485

Technologies), and purified labeled protein G′e was collectedby adding 600 μL of a MicroScale Thermophoresis optimizedbuffer (containing 50 mM Tris (pH 7.6), 150 mM NaCl, 10mM MgCl2, and 0.05% Tween-20) to the column [54]. Next,protein-to-dye ratio was determined spectroscopically. Thenumber of fluorescent counts of labeled protein G′e was com-pared with a calibration curve of the dye alone and, from this,the approximate concentration of labeled protein G′e was foundto be 20 nM. Protein G′e concentration was kept constantduring the subsequent experiments. For affinity quantification,16 samples of intravenous immunoglobulin (IVIg) (OmrixBiopharmaceuticals, Nes-Ziona, Israel) were prepared in 1:1serial dilutions with the highest final concentration of 500 nM.Dilutions were performed by using a MicroScaleThermophoresis optimized buffer (see above) without Tween-20 [55]. Volumes of 10 μL of each serial dilutions of IgG weremixed with 10 μL of the fluorescently labeled protein G′esolution and incubated for approximately 10 min at roomtemperature. Next, each sample was loaded into one “Micro-Scale Thermophoresis Standard Treated Capillary”(NanoTemper Technologies) by means of capillary force. Adissociation constant (Kd) determination was performed with aMonolith NT.115 instrument using 20% MST power and 90%LED power. Laser-on time was 30 s and laser-off time was 5 s.As data output, the NanoTemper analysis software automati-cally plotted Fnorm values as a function of IgG concentration(titration curve with arbitrary intensity units) and calculated theKd value from the curve approximation by software-implemented algorithms [56].
ResultsMolecular Mass Determination of Protein G′e
From the suggested amino acid sequence (Uniprot: Q54181), amolecular mass of 20,118.0 Da (average mass) was calculatedfor protein G′. SDS-PAGE analysis showed a single, well-stained band for protein G′e at an apparent molecular mass ofca. 35 kDa (Figure 1 right), indicating high purity and homo-geneity. The anomalously high apparent molecular mass inSDS-PAGE stands in agreement with previous reports [23, 39].
NanoESI-MS analysis of protein G′e under acidic condi-tions showed a homogenous ion series of multiply charged ionswith charge states from [M + 14H]14+ to [M + 23H]23+ in them/z range between 1000 and 3000 with a maximum at thesignal for the [M + 20H]20+ protein ion (Figure 1 bottom andSupplementary Table 1). Under denaturing conditions, narrowmolecular ion signals were obtained that allowed differentia-tion of two closely spaced ion series (a and b). Surprisingly, theexperimentally determined molecular masses (average masses)were 25,998.9 ± 0.2 Da (a ion series) and 26,177.2 ± 0.5 Da (bion series), respectively, indicating the presence of two proteinspecies. Yet, neither of the two experimentally determinedmolecular masses matched the calculated mass of protein G′,indicating that the commercial protein was not protein G′ butpossessed a different amino-acid sequence. The heavier protein
G′e presumably harbored a covalent modification with a massof 178.3 Da. As neither the amino acid sequence database(Uniprot: Q54181) nor the provider (Sigma) was helpful toclarify the situation, we went on and determined the amino acidsequence “de-novo” by mass spectrometry.
Protein G′e “De-Novo” Sequence Determination
Our first “de-novo” mass spectrometric “top-down” sequenc-ing attempt made use of the MALDI-ISD-ToF-MSmethod andemployed a total of 38.5 pmol of protein G′e that was placed onthe AnchorChip target and mixed with sinapinic acid as matrix.The initial survey by linear modeMALDI-ToF-MS presented aspectrum with strong signals corresponding to singly and dou-bly charged proteins (Supplementary Figure 1 and Supplemen-tary Table 2), indicating an adequate quality of the preparation.
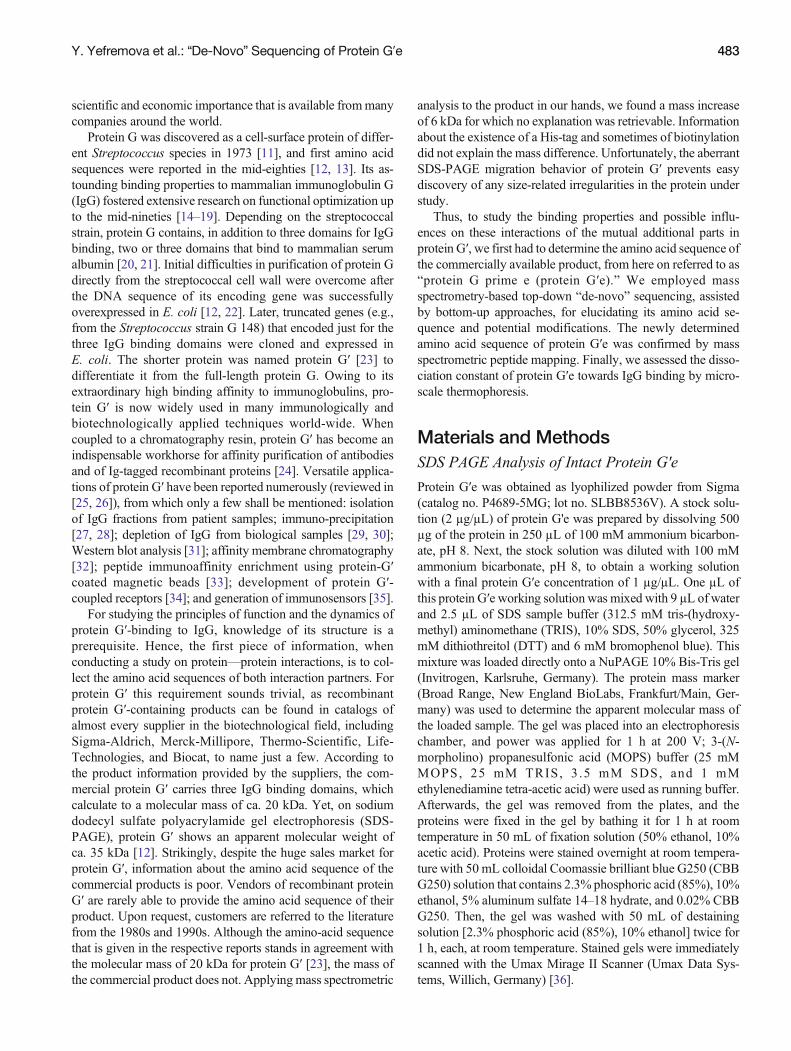
MALDI-ISD-ToF-MS top-down sequencing produced pri-marily C″-type fragment ions [46, 57] and best ISD fragmen-tation results were obtained using sinapinic acid matrix. Judg-ing from the fragment ion with the lowest m/z value (C″n; m/z1071.11), a short N-terminal partial sequence of 9 to 10 aminoacids was left unobserved. Themass difference between the C″nion and the C″n+1 ion (Δm 87.05) was indicative of a serineresidue. In total, 59 amino acids from the N-terminus could beidentified by reading the complete “C″-ion ladder” (Figure 2and Supplementary Table 3). In two cases, larger distancesbetween adjacent C″ ions were found than expected for singleamino-acid residues, indicating the presence of a peptide bondN-terminal to a proline residue [58]. A gap of 196.24 mass unitswas found between the intense ion signals C″n+4 and C″n+6 (m/z1415.38 and 1611.62). Subtracting the mass of a proline residuefrom the observed mass difference left the mass increment of a
Figure 1. Molecular mass analysis of protein G′e. SDS-PAGEanalysis of protein G′e (right) shows an anomalous apparentmolecular mass of ca. 35 kDa. Lane 1: protein mass markers.Lane 2: protein G′e (1.0 μg). Proteins were stained with colloidalCoomassie blue. Nano-ESI mass spectrum of protein G′e (bot-tom). ProteinG′e (19.2 μM)was dissolved in 2%aqueous aceticacid: methanol (95:5, v/v), pH 2.4. Multiply protonated proteinspecies are labeled. Two adjacent ion series (a and b) are found(see zoom view). For molecular mass assignment see Supple-mentary Table 1
486 Y. Yefremova et al.: “De-Novo” Sequencing of Protein G′e
valine residue. In fact, at m/z 1515.41 a poorly resolved ionsignal was found, confirming the “VP” dipeptide sequence.Similarly, the mass difference of 211.08 between ion signalsC″n+22 at m/z 3284.40 and C″n+24 at m/z 3496.64 could beassigned to the dipeptide “DP.” Again, a low-intensity ionsignal was observed at m/z 3399.46 and substantiated the as-signment. Interestingly, starting from the C″n+48 ion signal, thenext eleven C″ ion signals matched precisely with the first 11amino acid residues from the IgG binding part of protein G′(Uniprot: Q54181). Reading into the protein G′ sequence en-abled us to place the newly identified partial sequence at the N-terminus of protein G′e and confirmed the presence of C″-typefragment ions in the spectrum. Note, when aligning our newlydetermined sequence with the full length protein G (Uniprot:P19909), the identical sequence part of both could be extendedto 21 amino acids (starting from C″n+38).
As the very N-terminal amino acid sequence (ca. 9 to 10residues) was not yet determined, a bottom-up “de-novo” se-quencing experiment was performed using a MALDI-QIT-ToF-MSn instrument. Upon in-solution tryptic digestion ofprotein G′e, the MALDI-ToF mass spectrum of the resultingpeptides displayed six strong peptide ion signals of m/z1535.71, 1768.93, 1909.01, 1946.98, 2465.10, and 3425.47(Supplementary Figure 2 and Supplementary Table 4) togetherwith approximately two dozen ion signals of rather low abun-dance. As none of the intense ion signals could be matched tothe protein G′ sequence (Q54181) or to the full-length proteinG sequence (P19909), they were assumed to belong to the N-terminal flanking amino acid sequence and subjected to massspectrometric fragmentation.
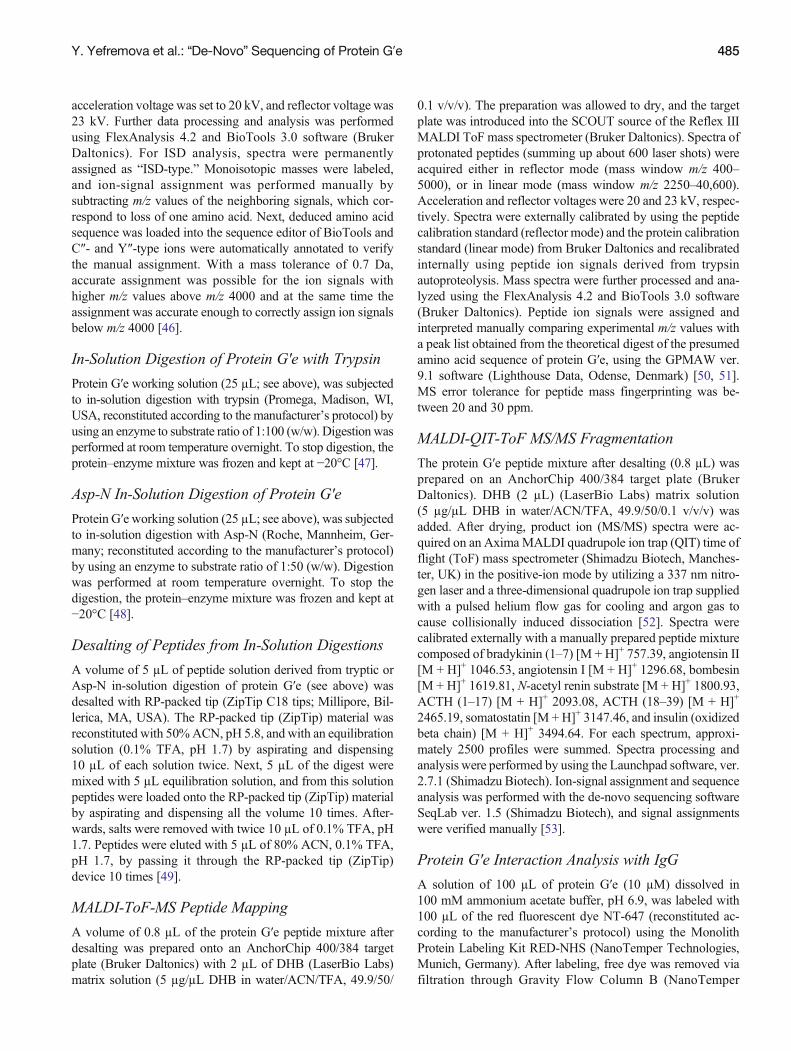
The precursor ion with signal at m/z 1768.93 yielded in theamino acid sequence GSSHHHHHHSSGLVPR by MS/MSfragmentation (Figure 3a and Supplementary Table 5). Thesequence of consecutively assembled six histidine residuesproved the existence of a so-called “His-tag” at the N-
terminus. This peptide also defined the very N-terminus ofprotein G′e and, starting with the SSGL-sequence, matchedthe suggested amino acid sequence obtained by MALDI-ISD-ToF-MS. Using a “de novo” sequencing software of theMALDI-QIT-ToF-MSn instrument, we were able to also de-duce the amino acid sequence of the peptide of m/z 1946.99.The best match is the amino acid sequence [178]GSSHHHHHHSSGLVPR, the same sequence as the one for thepeptide of m/z 1768.93, only with an extra mass of 178.3 Da(marked with [178]) at its N-terminus (Figure 3b; Supplemen-tary Table 6). This mass increment of 178.3 Da corresponds toan N-terminal gluconoylation that was occasionally found inrecombinant proteins that contain an N-terminal “GSS-His-tag” and were expressed in E. coli [59]. Note, this mass incre-ment was already detected by ESI-MS analysis of the intactprotein G′e.
MS/MS fragmentation of the precursor ion of m/z 1535.71produced abundant B-type and Y″-type ions (Supplementary
Figure 2. Top-down MALDI-ISD mass spectrometric se-quencing of protein G′e. C″-type ions are labeled (abbreviatedas Cn ions to reduce complexity, where n is the number of theamino acid residues). A sequence of 59 amino acids from theN-terminal region is identified (de-novo sequencing) by readingthe “C″ ion ladder”; mass tolerance was set to 0.7 Da; sinapinicacid was used as matrix. For molecular mass assignment seeSupplementary Table 3
Figure 3. Bottom-up MALDI-QIT-ToF MS/MS sequencing ofprotein G′e. (a) Fragment ion spectrum from precursor peptidewith ion signal at m/z 1768.93. The amino acid sequence of thepeptide is covered by Y″-type and B-type ions. (b) MALDI-QIT-ToF product-ion (MS/MS) spectrum of fragment ions from pep-tide ion ofm/z 1946.99. The amino acid sequence of the peptideis covered by Y″-type and B-type ions. Presence of an N-terminal extra mass of 178 Da is shown. For molecular massassignment see Supplementary Tables 5 and 6
Y. Yefremova et al.: “De-Novo” Sequencing of Protein G′e 487

Figure 3; Supplementary Table 7) from which the sequenceGSHMASMTGGQQMGR could be determined by using theaforementioned “de novo” sequencing software. This peptidesequence matched precisely with the partial sequence that wasdeduced by MALDI-ISD-ToF-MS to cover ions from C″n+8 toC″n+22. Similarly, the peptide ion of m/z at 1909.01 also pro-duced B-type and Y″-type ion series. From them, two largepeaks stood out at m/z 1107.75 and 1794.01. This stands inagreement with cleavage of D–P and D–K bonds, respectively(Supplementary Figure 4; Supplementary Table 8). Note, thedetermined partial sequence SVDKLAAALETY reads into theprotein G sequence (P19909), again standing in agreement withthe MALDI-ISD-ToF-MS top-down sequencing results.
By contrast, two peptide ions of m/z at 2465.10 and 3425.47gave rise to just two abundant fragment ions instead of producingan extended fragment ion series. Most interestingly, both precur-sors yielded fragment ions with exactly the same m/z values at1632.63 and 2318.94 (Supplementary Figure 5; SupplementaryTables 9 and 10). Obviously, most of the CID energy wasconsumed to cleave the peptide bonds at these two(predetermined) breaking points, likely at aspartic acid residues,and suppressed further fragmentation. Matching both precursorion masses to the newly determined amino acid sequence byMALDI-ISD-ToF-MS aligned the ion signal at m/z 2465.10 tothe partial sequence GSHMASMTGGQQMGRDPNSSSVDKand the ion signal at m/z 3425.47 to the partial sequenceGSHMASMTGGQQMGRDPNSSSVDKLAAALETYK. Thepartial sequence of the precursor of m/z 3425.47 extends at theC-terminal end owing to amissed cleavage at a “K” residue that islocated next to a “D.”Given that both peptides share the same N-terminal sequence, cleavage between dipeptides “DP” and “DK”produced the same B-type ions. The location of the “DP” dipep-tide adjacent to the arginine residue also explains the missedcleavage at this residue.
Combining the newly determined N-terminal sequence in-formation that was obtained from protein G′e by both MALDI-
ISD-MS and MALDI QIT-ToF MS/MS with the amino acidsequence of protein G′ (Q54181) allowed us to assemble anamino acid sequence for the unmodified protein G′e. Thissequence contained 241 amino acid residues from which amolecular mass of 25,999.55 (average mass) was calculated(Figure 4). This theoretical mass matched precisely the exper-imentally determined mass of the unmodified protein (seeabove). Likewise, an average molecular mass of 26,177.69could be calculated for the gluconoylated form of protein G′e.For the first time, we were able to discover an amino acidsequence elongation that encompassed 46 amino acids at theN-terminus of protein G′e as well as a partial post-translationalmodification. The deduced amino acid sequence reads into thefirst 21 amino acids of the protein G sequence (P19909).
To test whether the C-terminus of the presumed amino acidsequence was the expected one, we conducted another top-down amino acid sequencing experiment using ESI-ECD-FT-ICR-MS. For that, a nanoESI-MSmass spectrum was recordedunder acidic conditions, which showed a series of multiplyprotonated proteins in the mass range of m/z 700 to 1800.The [M + 26H]26+ ion of m/z 1001.0 (Supplementary Figure 6and Supplementary Table 11) was isolated and subjected toECD, giving rise to series of C″ and Z′ ions (Figure 5 andSupplementary Table 12). Detailed ECD fragment analysisshowed that from the C-terminus 94 amino acids (aa147–241)could be confirmed (cf. Figure 4). The N-terminal part of thesequence was covered from amino-acid position 1 up to amino-acid position 76. MS/MS error tolerance for ECD fragment ionsearching was below 25 ppm. Upon ECD, no cleavage occurredat proline residues, which stands in agreement with literaturereports [60].
Protein G′e Sequence Verification
We tested the presumed amino acid sequence of protein G′e (cf.Figure 4) bymass spectrometric peptide mapping. First, protein
Figure 4. Suggested amino acid sequence of protein G′e. Sequence parts covered byMALDI-ISD-MS fragmentation are indicatedwith arrows below the sequence. Sequence parts covered by ESI-ECD-FT-ICR-MS are indicated with arrows above the sequence.Assigned bond breakages (C″-type and Z′-type ions, respectively) are shown by vertical lines. Boxed amino acid sequence partswere covered by MALDI-QIT-ToF-MS/MS fragmentation analysis. Bold: sequence part of protein G (P19909; aa303–aa497). N-terminal modification by α-N-gluconoylation or α-N-6-phosphogluconoylation, respectively, is indicated by “#”
488 Y. Yefremova et al.: “De-Novo” Sequencing of Protein G′e

G′e was digested in solution with trypsin, and peptides weresubjected to MALDI-ToF-MS analysis. Almost all the ionsignals (i.e., intense and low-abundant ion signals of theresulting mass spectra) were assigned as tryptic peptides ofprotein G′e with MS error tolerance between 20 and 30 ppm(Figure 6 and Supplementary Table 13; cf. SupplementaryFigure 2). Three His-tag containing peptides were observed atm/z 1768.93, 1946.98, and 2026.95, respectively (Supplemen-tary Figure 7 and Supplementary Table 13), confirming partialN-terminal gluconoylation (mass increment of 178.14 Da) andpartial α-N-phosphogluconoylation (mass increment of 258.12Da); consistent with the MALDI-QIT-ToF-MSn sequencingresults. Combining partial sequences of all tryptic peptidesyielded 100% sequence coverage of protein G′e.
Peptide mapping of protein G′e by using Asp-N as proteasealso showed that the suggested amino acid sequence of proteinG′e could be matched to the majority of the obtained peptide
ion signals (Supplementary Figure 8 and SupplementaryTable 14). Again, both, αN-gluconoylation and α-N-6-phosphogluconoylation of the N-terminal peptides wereconfirmed, and sequence coverage was 100%.
Functional Analysis of Protein G′e
Microscale thermophoresis was performed to define whetherthe newly determined N-terminal flanking amino acid se-quence of protein G′e had an influence on the binding affinityto IgG. For this experiment, the protein G′e concentration waskept constant at ca. 20 nM, whereas the concentration of IgGwas varied between 15 pM and 500 nM. From 16 data points,corresponding to different IgG concentrations, the Kd value of9.4 nMwas determined for this noncovalent binding in a singleexperiment (Supplementary Figure 9). Thus, thermophoresisshowed that the binding of protein G′e to IgG (from IVIg) wasjust as strong as that of protein G′ (Kd ca. 10 nM) [61].Accordingly, we conclude that the N-terminal flanking se-quence in protein G′e that was added by genetic engineering(and contains a His-tag) does not adversely affect bindingproperties of protein G′e to IgG.
DiscussionBy definition, “de-novo” sequencing (by mass spectrometry)denotes the elucidation of a protein sequence without assis-tance of a sequence database [62]. A somewhat less stringent
Figure 6. MALDI-ToF-MS analysis of protein G′e peptidesderived from tryptic in-solution digestion measured in reflectormode (mass rangem/z 950–5000). Insert: linear mode spectrum(mass rangem/z 7000–16,000). Selected peptide ion signals arelabeled withm/z values. Numbers in parentheses indicate partialsequences of protein G′e. Mass increments of 178 and 258 Dathat are due to N-terminal modifications are shown; n.i. denotesnot identified. The suggested protein G′e sequence is coveredto 100%. For molecular mass assignments see SupplementaryTable 13
Figure 5. Top-down sequence analysis of protein G′e by ESI-ECD-FT-ICR MS. (a) Fragment ion spectrum (mass range m/z250–950) is dominated by C″-type ions (selected ions are la-beled). The insert shows the mass range of m/z 550–600. (b)Product ion mass spectrum (mass range m/z 1100–1800) isdominated by Z′-type ions. The insert shows the mass rangeofm/z 1480–1540. For molecular mass assignment see supple-mentary Table 12
Y. Yefremova et al.: “De-Novo” Sequencing of Protein G′e 489

version of this definition permits “minimal assistance fromgenomic data” [63]. One example of a mass spectrometric“de-novo” sequence determination with the help of top-downcombined with bottom-up approaches was the determination ofthe light chain of alemtuzumab, a monoclonal therapeuticantibody [64]. In another example, sequencing of a 21 kDacytochrome c4 from Thiocapsa roseopersicina was successfulby employing a combination of CID and ECD fragmentationexperiments on an instrument with a linear ion trap coupled to aFourier transform-ion cyclotron resonance mass spectrometer[65]. Given that neither genomic data nor precise informationabout the underlying amino acid sequence from protein G′wereavailable to us from the starting point and all along during thisstudy, our report presents an actual example of a mass spectro-metric “de-novo” sequence elucidation by which the N-terminal flanking amino acid sequence of protein G′e waselucidated.
Only after the complete protein G′e amino acid sequencewas experimentally determined were we able to narrow downthe likely (commercially available) cloning system that wasused for generating the recombinant protein G′e under study.We manually compared the N-terminal flanking amino acidsequence of protein G′e with those amino acid sequences in thelists of pET vectors, which are available for cloning and ex-pressing recombinant proteins in E. coli [66]. The best matchingvector-derived amino acid sequence was that of the expressionvector pET-28b from Novagen (www.richsinger.com/4402/pET28.pdf). From the ca. 10 possibilities to insert any codingDNA into the multiple cloning site, most likely the Xho Irestriction enzyme cleavage site was used. It should be men-tioned that without precise knowledge of the amino-acid se-quence of the recombinant protein under investigation, findingthe correct expression vector was almost impossible because onemust pick from over 500 possibilities (i.e., approximately 50plasmids, each providingmultiple cloning sites with typically ca.10 restriction enzyme recognition sequences).
Given that there are already “minor” structural changes inamino acid sequences—introduced either during genetic engi-neering or by post-translational modifications—which cancause crucial alterations in the overall functional activity of aprotein, precise knowledge of protein primary structures isessential for studies on protein–protein interaction dynamics.For example, a short elongation with just five charged hydro-philic amino acids (KKYPR) at the N-terminus of recombinanthuman epidermal growth factor caused a significant decrease inits biological activity [67].
Another example of minute structural changes causing sig-nificant activity effects is the optimization of pH response andpH sensitivity of the so-called B1 domain of protein G(representing the range of aa47 to aa101 in protein G′e). Bytargeted mutations, histidine residues were inserted at B1 do-main positions 31, 39, and 41, replacing the naturally occurringamino-acid residues glutamine, aspartic acid, and glutamicacid, respectively. This exchange improved binding stabilityto IgG at higher pH and at the same time caused electrostaticrepulsion of protein G from the binding interface of IgG under
acidic conditions [68] (residues are highlighted in Supplemen-tary Figure 10). In another protein engineering approach withthe so-called C2 domain of protein G (the C2 domain repre-sents aa117 to aa171 in protein G′e), asparagine residues 7 and36 of the C2 domain [69–71] were substituted with alanineresidues to solve a problem of low alkaline stability of proteinG. Interaction analysis showed that these amino acid substitutionsdid not affect the affinity to the Fc fragment of IgG [72]. Bycontrast, a 50-fold increase in the Kd value for IgG-binding (i.e.,weakening of the bond) occurs upon a single N34A mutation.Similarly, a K30A mutation results in a 350-fold increase in Kd,and a 580-fold increase in the Kd occurs with a W42A mutant.Interestingly, the E26A mutant almost abolished bindingcompletely, resulting in approximately a 4000-fold weaker Kd
value compared with the native B1 domain of protein G [73].
ConclusionOur study shows that with the help of mass spectrometric “de-novo” sequencing, the primary structure of protein G′e that isavailable from many companies around the world could besolved completely, revealing a 46-amino acid residue extensionat the N-terminus, the presence of an N-terminal His-tag, and apartial gluconoylation. This identification constitutes a firstessential step for subsequent studies of protein–protein inter-actions, which are underway. Although not self-evident, theaddition of 46 amino acids at the N-terminus of protein G′e didnot cause significant changes in its binding affinity toimmunoglobulins.
AcknowledgmentsThe authors express their thanks to Matthias Molnar and Fabi-an Zehender (NanoTemper Technologies GmbH, Munich,Germany) for providing access to the Monolith NT.115 instru-ment and for assistance with performing the experiments. Theyacknowledge the European Union IRSES grant “MS-LIFE” forresearcher exchange (PIRSES269256), German Academic Ex-change Service (DAAD) for providing a scholarship for YY,and the National Institute of General Medicine of the NIH ofthe USA (grant no. P41GM103422) for financial support.
References1. Maxam, A.M., Gilbert, W.: A new method for sequencing DNA. Proc.
Natl. Acad. Sci. U. S. A. 74, 560–564 (1977)2. Crick, F.H.: Codon–anticodon pairing: the wobble hypothesis. J.Mol. Biol.
19, 548–555 (1966)3. Biemann, K.: Laying the groundwork for proteomics: mass spectrometry
from 1958 to 1988. J. Proteom. 107, 62–70 (2014)4. She, Y.M., Haber, S., Seifers, D.L., Loboda, A., Chernushevich, I.,
Perreault, H., Ens, W., Standing, K.G.: Determination of the completeamino acid sequence for the coat protein of brome mosaic virus by time-of-flight mass spectrometry. Evidence for mutations associatedwith changeof propagation host. J. Biol. Chem. 276, 20039–20047 (2001)
5. Catherman, A.D., Skinner, O.S., Kelleher, N.L.: Top down proteomics:facts and perspectives. Biochem. Biophys. Res. Commun. 445, 683–693 (2014)
490 Y. Yefremova et al.: “De-Novo” Sequencing of Protein G′e
6. Hepner, F., Cszasar, E., Roitinger, E., Lubec, G.: Mass spectrometricalanalysis of recombinant human growth hormone (Genotropin®) revealsamino acid substitutions in 2% of the expressed protein. Proteome Sci. 3, 1(2005)
7. Zhang, H., Ge, Y.: Comprehensive analysis of protein modifications bytop-down mass spectrometry. Circ. Cardiovasc. Genet. 4, 711 (2011)
8. Ezkurdia, I., del Pozo, A., Frankish, A., Rodriguez, J.M., Harrow, J.,Ashman, K., Valencia, A., Tress, M.L.: Comparative proteomics revealsa significant bias toward alternative protein isoforms with conserved struc-ture and function. Mol. Biol. Evol. 29, 2265–2283 (2012)
9. Fermin, D., Allen, B.B., Blackwell, T.W., Menon, R., Adamski, M., Xu,Y., Ulintz, P., Omenn, G.S., States, D.J.: Novel gene and gene modeldetection using a whole genome open reading frame analysis in proteomics.Genome Biol. 7, R35 (2006)
10. Teramoto, K., Sato, H., Sun, L., Torimura, M., Tao, H.: A simple intactprotein analysis by MALDI-MS for characterization of ribosomal proteinsof two genome-sequenced lactic acid bacteria and verification of theiramino acid sequences. J. Proteome Res. 6, 3899–3907 (2007)
11. Kronvall, G.: A surface component in group A, C, and G streptococci withnon-immune reactivity for immunoglobulin G. J. Immunol. 111, 1401–1406 (1973)
12. Guss, B., Eliasson, M., Olsson, A., Uhlén, M., Frej, A.K., Jörnvall, H.,Flock, J.I., Lindberg, M.: Structure of the IgG-binding regions of strepto-coccal protein G. EMBO J. 5, 1567–1575 (1986)
13. Olsson, A., Eliasson, M., Guss, B., Nilsson, B., Hellman, U., Lindberg, M.,Uhlén, M.: Structure and evolution of the repetitive gene encoding strepto-coccal protein G. Eur. J. Biochem. 168, 319–324 (1987)
14. Akerström, B., Brodin, T., Reis, K., Björck, L.: Protein G: a powerful toolfor binding and detection of monoclonal and polyclonal antibodies. J.Immunol. 135, 2589–2592 (1985)
15. Alexander, P., Fahnestock, S., Lee, T., Orban, J., Bryan, P.: Thermody-namic analysis of the folding of the streptococcal protein G IgG-bindingdomains B1 and B2: why small proteins tend to have high denaturationtemperatures. Biochemistry 31, 3597–3603 (1992)
16. Derrick, J.P., Wigley, D.B.: The third IgG-binding domain from strepto-coccal protein G. An analysis by X-ray crystallography of the structurealone and in a complex with Fab. J. Mol. Biol. 243, 906–918 (1994)
17. Gallagher, T., Alexander, P., Bryan, P., Gilliland, G.L.: Two crystal struc-tures of the B1 immunoglobulin-binding domain of streptococcal protein Gand comparison with NMR. Biochemistry 33, 4721–4729 (1994)
18. Lian, L.Y., Yang, J.C., Derrick, J.P., Sutcliffe, M.J., Roberts, G.C.K.,Murphy, J.P., Goward, C.R., Atkinson, T.: Sequential 1H NMR assign-ments and secondary structure of an IgG-binding domain from protein G.Biochemistry 30, 5335–5340 (1991)
19. Sjöbring, U., Björck, L., Kastern, W.: Streptococcal protein G. Genestructure and protein binding properties. J. Biol. Chem. 266, 399–405(1991)
20. Akerström, B., Nielsen, E., Björck, L.: Definition of IgG- and albumin-binding regions of streptococcal protein G. J. Biol. Chem. 262, 13388–13391 (1987)
21. Björck, L., Kastern, W., Lindahl, G., Wideback, K.: Streptococcal proteinG, expressed by streptococci or by Escherichia coli, has separate bindingsites for human albumin and IgG. Mol. Immunol. 24, 1113–1122 (1987)
22. Fahnestock, S.R., Alexander, P., Nagle, J., Filpula, D.: Gene for animmunoglobulin-binding protein from a group G streptococcus. J.Bacteriol. 167, 870–880 (1986)
23. Goward, C.R., Murphy, J.P., Atkinson, T., Barstow, D.A.: xpression andpurification of a truncated recombinant streptococcal protein G. Biochem.J. 267, 171–177 (1990)
24. Ohlson, S., Nilsson, R., Niss, U., Kjellberg, B.M., Freiburghaus, C.: Anovel approach to monoclonal antibody separation using high performanceliquid affinity chromatography (HPLAC)with SelectiSpher-10 proteinG. J.Immunol. Methods 114, 175–180 (1988)
25. Boström, T., Nilvebrant, J., Hober, S.: Purification systems based onbacterial surface proteins. In: Ahmad, R. (Ed.) Protein Purification, p.224. InTech, Rijeka, Croatia, (2012)
26. Hage, D.S.: Affinity chromatography: a review of clinical applications.Clin. Chem. 45, 593–615 (1999)
27. Kaboord, B., Perr, M.: Isolation of proteins and protein complexes byimmunoprecipitation. Methods Mol. Biol. 424, 349–364 (2008)
28. Nomellini, J.F., Duncan, G., Dorocicz, I.R., Smit, J.: S-layer-mediateddisplay of the immunoglobulin G-binding domain of streptococcal proteinG on the surface of Caulobacter crescentus: development of animmunoactive reagent. Appl. Environ. Microbiol. 73, 3245–3253 (2007)
29. Faulkner, S., Elia, G., Hillard, M., O’Boyle, P., Dunn, M., Morris, D.:Immunodepletion of albumin and immunoglobulin G from bovine plasma.Proteomics 11, 2329–2335 (2011)
30. Fu, Q., Garnham, C.P., Elliott, S.T., Bovenkamp, D.E., Van Eyk, J.E.: Arobust, streamlined, and reproducible method for proteomic analysis ofserum by delipidation, albumin and IgG depletion, and two-dimensionalgel electrophoresis. Proteomics 5, 2656–2664 (2005)
31. Björck, L., Blomberg, J.: Streptococcal protein G: a sensitive tool fordetection of antibodies to human immunodeficiency virus proteins inWestern blot analysis. Eur. J. Clin. Microbiol. 6, 428–429 (1987)
32. Dancette, O.P., Taboureau, J.L., Tournier, E., Charcosset, C., Blond, P.:Purification of immunoglobulins G by protein A/G affinity membranechromatography. J. Chromatogr. B Biomed. Sci. Appl. 723, 61–68 (1999)
33. Zhao, L., Whiteaker, J.R., Pope, M.E., Kuhn, E., Jackson, A., Anderson,N.L., Pearson, T. W., Carr, S.A., Paulovich, A.G.: Quantification of pro-teins using peptide immunoaffinity enrichment coupled with mass spec-trometry. J. Vis. Exp. 53, 1–5 (2011)
34. Heng, B.C., Aubel, D., Fussenegger, M.: G protein coupled receptorsrevisited: therapeutic applications inspired by synthetic biology. Annu.Rev. Pharmacol. Toxicol. 54, 227–249 (2014)
35. Bae, Y.M., Oh, B.K., Lee, W., Lee, W.H., Choi, J.W.: Study on orientationof immunogrlobulin G on protein G layer. Biosens. Bioelectron. 21, 103–110 (2005)
36. Al-Majdoub, M., Koy, C., Lorenz, P., Thiesen, H.J., Glocker, M.O.: Massspectrometric and peptide chip characterization of an assembled epitope:analysis of a polyclonal antibody model serum directed against the Sjøgren/systemic lupus erythematosus autoantigen TRIM21. J. Mass Spectrom. 48,651–659 (2013)
37. Bradford, M.M.: A rapid and sensitive method for quantitation of micro-gram quantities of protein utilizing principle of protein-dye binding. Anal.Biochem. 72, 248–254 (1976)
38. Kienbaum, M., Koy, C., Montgomery, H.V., Drynda, S., Lorenz, P., Illges,H., Tanaka, K., Kekow, J., Guthke, R., Thiesen, H.J., Glocker, M.O.: MScharacterization of apheresis samples from rheumatoid arthritis patients forthe improvement of immunoadsorption therapy - a pilot study. Proteom.Clin. Appl. 3, 797–809 (2009)
39. Al-Majdoub, M., Opuni, K.F., Yefremova, Y., Koy, C., Lorenz, P., El-Kased, R.F., Thiesen, H.J., Glocker, M.O.: A novel strategy for rapidpreparation and isolation of intact immune complexes from peptide mix-tures. J. Mol. Recogn. 27, 566–574 (2014)
40. Bantscheff, M., Glocker, M.O.: Probing the tertiary structure ofmultidomain proteins by limited proteolysis and mass spectrometry. Eur.Mass Spectrom. 4, 279–285 (1998)
41. Happersberger, H.P., Przybylski, M., Glocker, M.O.: Selective bridging ofbis-cysteinyl residues by arsonous acid derivatives as an approach to thecharacterization of protein tertiary structures and folding pathways by massspectrometry. Anal. Biochem. 264, 237–250 (1998)
42. Chen, J.W., Cui, W.D., Giblin, D., Gross, M.L.: New protein footprinting:fast photochemical iodination combined with top-down and bottom-upmass spectrometry. J. Am. Soc. Mass Spectrom. 23, 1306–1318 (2012)
43. Zubarev, R.A., Kelleher, N.L., McLafferty, F.W.: Electron capture disso-ciation of multiply charged protein cations. A nonergodic process. J. Am.Chem. Soc. 120, 3265–3266 (1998)
44. Koy, C., Heitner, J.C., Woisch, R., Kreutzer, M., Serrano-Fernandez, P.,Gohlke, R., Reimer, T., Glocker, M.O.: Cryodetector mass spectrometryprofiling of plasma samples for HELLP diagnosis: an exploratory study.Proteomics 5, 3079–3087 (2005)
45. Pecks, U., Seidenspinner, F., Röwer, C., Reimer, T., Rath, W., Glocker,M.O.: Multifactorial analysis of affinity-mass spectrometry data from se-rum protein samples: a strategy to distinguish patients with preeclampsiafrom matching control Individuals. J. Am. Soc. Mass Spectrom. 21, 1699–1711 (2010)
46. El-Kased, R.F., Koy, C., Deierling, T., Lorenz, P., Qian, Z., Li, Y., Thiesen,H.J., Glocker, M.O.: Mass spectrometric and peptide chip epitope mappingof rheumatoid arthritis autoantigen RA33. Eur. J. Mass Spectrom. 15, 747–759 (2009)
47. El-Kased, R.F., Koy, C., Lorenz, P., Montgomery, H., Tanaka, K., Thiesen,H.J., Glocker, M.O.: A novel Mass spectrometric epitope mapping ap-proach without immobilization of the antibody. J. Proteom. Bioinform. 4,001–009 (2011)
48. Happersberger, H.P., Cowgill, C., Glocker, M.O.: Structural characteriza-tion of monomeric folding intermediates of recombinant humanmacrophage-colony stimulating factor beta (rhM-CSF beta) by chemicaltrapping, chromatographic separation and mass spectrometric peptide
Y. Yefremova et al.: “De-Novo” Sequencing of Protein G′e 491

mapping. J. Chromatogr. B Analyt. Technol. Biomed. Life Sci. 782, 393–404 (2002)
49. Al-Majdoub, M., Opuni, K.F.M., Koy, C., Glocker, M.O.: Facile fabrica-tion and instant application of miniaturized antibody-decorated affinitycolumns for higher-order structure and functional characterization ofTRIM21 epitope peptides. Anal. Chem. 85, 10479–10487 (2013)
50. Mikkat, S., Koy, C., Ulbrich, M., Ringel, B., Glocker, M.O.: Mass spec-trometric protein structure characterization reveals cause of migration dif-ferences of haptoglobin a chains in two-dimensional gel electrophoresis.Proteomics 4, 3921–3932 (2004)
51. Sinz, A., Bantscheff, M., Mikkat, S., Ringel, B., Drynda, S., Kekow, J.,Thiesen, H.J., Glocker, M.O.: Mass spectrometric proteome analyses ofsynovial fluids and plasmas from patients suffering from rheumatoid ar-thritis and comparison to reactive arthritis or osteoarthritis. Electrophoresis23, 3445–3456 (2002)
52. Koy, C., Mikkat, S., Raptakis, E., Sutton, C., Resch, M., Tanaka, K.,Glocker, M.O.: Matrix-assisted laser desorption/ionization-quadrupole iontrap-time of flight mass spectrometry sequencing resolves structures ofunidentified peptides obtained by in-gel tryptic digestion of haptoglobinderivatives from human plasma proteomes. Proteomics 3, 851–858 (2003)
53. Röwer, C., Koy, C., Hecker, M., Reimer, T., Gerber, B., Thiesen, H.J.,Glocker, M.O.: Mass spectrometric characterization of protein structuredetails refines the proteome signature for invasive ductal breast carcinoma.J. Am. Soc. Mass Spectrom. 22, 440–456 (2011)
54. Wienken, C.J., Baaske, P., Rothbauer, U., Braun, D., Duhr, S.: Protein-binding assays in biological liquids using microscale thermophoresis. Nat.Commun. 1, 1–7 (2010)
55. Jerabek-Willemsen, M., Wienken, C.J., Braun, D., Baaske, P., Duhr, S.:Molecular interaction studies usingmicroscale thermophoresis. AssayDrugDev. Technol. 9, 342–353 (2011)
56. Seidel, S.A.I., Dijkman, P.M., Lea, W.A., van den Bogaart, G., Jerabek-Willemsen, M., Lazic, A., Joseph, J.S., Srinivasan, P., Baaske, P.,Simeonov, A., Katritch, I., Melo, F.A., Ladbury, J.E., Schreiber, G., Watts,A., Braun, D., Duhr, S.:Microscale thermophoresis quantifies biomolecularinteractions under previously challenging conditions. Methods 59, 301–315(2013)
57. Roepstorff, P., Fohlman, J.: Proposal for a common nomenclature forsequence ions in mass spectra of peptides. Biomed. Mass Spectrom. 11,601 (1984)
58. Hardouin, J.: Protein sequence information by matrix-assisted laserdesorption/ionization in-source decay mass spectrometry. Mass Spectrom.Rev. 26, 672–682 (2007)
59. Geoghegan, K.F., Dixon, H.B., Rosner, P.J., Hoth, L.R., Lanzetti, A.J.,Borzilleri, K.A., Marr, E.S., Pezzullo, L.H., Martin, L.B., LeMotte, P.K.,McColl, A.S., Kamath, A.V., Stroh, J.G.: Spontaneous alpha-N-6-
phosphogluconoylation of a “His tag” in Escherichia coli: the cause ofextra mass of 258 or 178 Da in fusion proteins. Anal. Biochem. 267, 169–184 (1999)
60. Zubarev, R.A.: Electron-capture dissociation tandem mass spectrometry.Curr. Opin. Biotechnol. 15, 12–16 (2004)
61. Akerström, B., Björck, L.: A physicochemical study of protein G, a mol-ecule with unique immunoglobulin G-binding properties. J. Biol. Chem.261, 240–247 (1986)
62. Standing, K.G.: Peptide and protein de novo sequencing by mass spec-trometry. Curr. Opin. Struct. Biol. 13, 595–601 (2003)
63. Seidler, J., Zinn, N., Boehm, M.E., Lehmann, W.D.: De novo sequencingof peptides by MS/MS. Proteomics 10, 634–649 (2010)
64. Liu, X., Dekker, L.J., Wu, S., Vanduijn, M.M., Luider, T.M., Tolić, N.,Kou, Q., Dvorkin, M., Alexandrova, S., Vyatkina, K., Paša-Tolić, L.,Pevzner, P.A.: De novo protein sequencing by combining top-down andbottom-up tandem mass spectra. J. Proteome Res. 13, 3241–3248 (2014)
65. Branca, R.M., Bodó, G., Bagyinka, C., Prokai, L.: De novo sequencing of a21-kDa cytochrome c4 from Thiocapsa roseopersicina bynanoelectrospray ionization ion-trap and Fourier-transform ion-cyclotronresonance mass spectrometry. J. Mass Spectrom. 42, 1569–1582 (2007)
66. Rosenberg, A.H., Lade, B.N., Chui, D.S., Lin, S.W., Dunn, J.J., Studier,F.W.: Vectors for selective expression of cloned DNAs by T7 RNApolymerase. Gene 56, 125–135 (1987)
67. Svoboda, M., Bauhofer, A., Schwind, P., Bade, E., Rasched, I., Przybylski,M.: Structural characterization and biological activity of recombinant hu-man epidermal growth factor proteins with different N-terminal sequences.Biochim. Biophys. Acta 1206, 35–41 (1994)
68. Watanabe, H., Matsumaru, H., Ooishi, A., Feng, Y.W., Odahara, T., Suto,K., Honda, S.: Optimizing pH response of affinity between protein G andIgG Fc: how electrostatic modulations affect protein-protein interactions. J.Biol. Chem. 284, 12373–12383 (2009)
69. Frick, I.M., Wikström, M., Forsén, S., Drakenberg, T., Gomi, H., Sjobring,U., Björck, L.: Convergent evolution among immunoglobulin G-bindingbacterial proteins. Proc. Natl. Acad. Sci. U. S. A. 89, 8532–8536 (1992)
70. Gronenborn, A.M., Clore, G.M.: Identification of the contact surface of astreptococcal protein G domain complexed with a human Fc fragment. J.Mol. Biol. 233, 331–335 (1993)
71. Sauer-Eriksson, A.E., Kleywegt, G.J., Uhlén, M., Jones, T.A.: Crystalstructure of the C2 fragment of streptococcal protein G in complex withthe Fc domain of human IgG. Structure 3, 265–278 (1995)
72. Gülich, S., Linhult, M., Ståhl, S., Hober, S.: Engineering streptococcalprotein G for increased alkaline stability. Protein Eng. 15, 835–842 (2002)
73. Sloan, D.J., Hellinga, H.W.: Dissection of the protein G B1 domain bindingsite for human IgG Fc fragment. Protein Sci. 8, 1643–1648 (1999)
492 Y. Yefremova et al.: “De-Novo” Sequencing of Protein G′e