dead loss - changing markets
TRANSCRIPT

Dead LossThe high cost of poor farming practices and mortalities on salmon farms
February 2021
3
ContentsAbbreviations 6
Executive summary 7
1 Introduction 17
2 Methodology 20
21 Overall approach 21
22 Limitations and caveats 22
3 Findings 24
31 Economic issues 25
32 Environmental issues 31
33 Social issues 37
4 Conclusions and recommendations 41
41 Conclusions 42
42 Recommendations 43
Appendix 1 ndash Norway 46
Appendix 2 ndash Scotland 52
Appendix 3 ndash Canada 57
Appendix 4 ndash Chile 62
4
Table of TablesTable 1 Variables included and not included in country level analysis 9
Table 2 Estimated mortalities and associated losses by producer (2010-2019) 10
Table 3 Summary of costs for each variable by country (MUSD) 13
Table 4 Variables included and not included in country level analysis 21
Table 5 Mortality opportunity costs in Scotland Norway Canada and Chile 25
Table 6 Costs of lice control measures across four countries (MUSD) 27
Table 7 FMFO costs in four countries (MUSD) 28
Table 8 Top ten salmon producing companies by revenue (2018) (MUSD) 29
Table 9 Estimates of losses and associated costs (2010-2019) 30
Table 10 Estimates for cost of sea lice for top ten producers 2013-2019 (MUSD) 31
Table 11 Estimate of welfare loss to households from destruction of wild salmon stocks attributable to aquaculture (2013-2019) 33
Table 12 Estimate of indirect cost of use of forage fish in salmon farming 2013-2019 34
Table 13 Pollution Abatement Costs for four countries (MUSD) 36
Table 14 Cumulative costs of CO2 emissions in salmon farming (MUSD) 37
Table 15 Salmon welfare premium (MUSD) 38
Table 16 Summary of costs (in MUSD) 42
Table 17 Examples of positive benefits from salmon farming 42
Table 18 Opportunity costs of mortalities in Norway 46
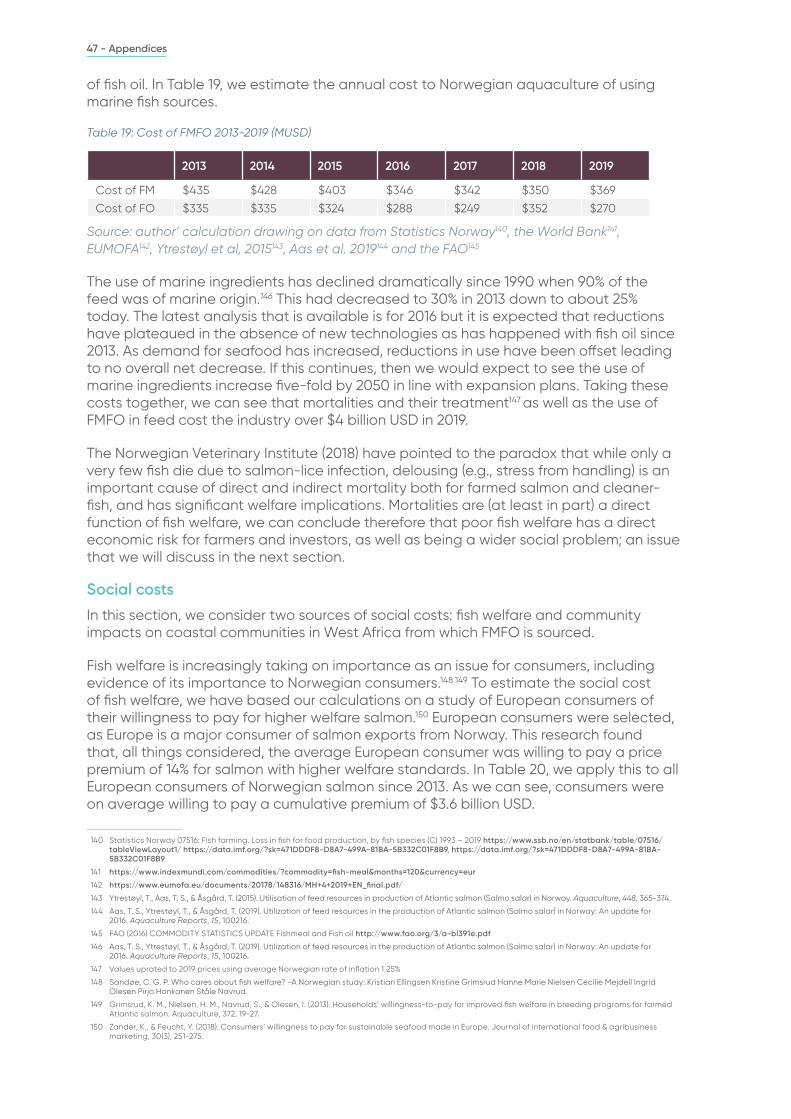
Table 19 Cost of FMFO 2013-2019 (MUSD) 47
Table 20 WTP calculation for higher fish welfare (MUSD) 48
Table 21 Assumptions in social calculations for Mauritania 48
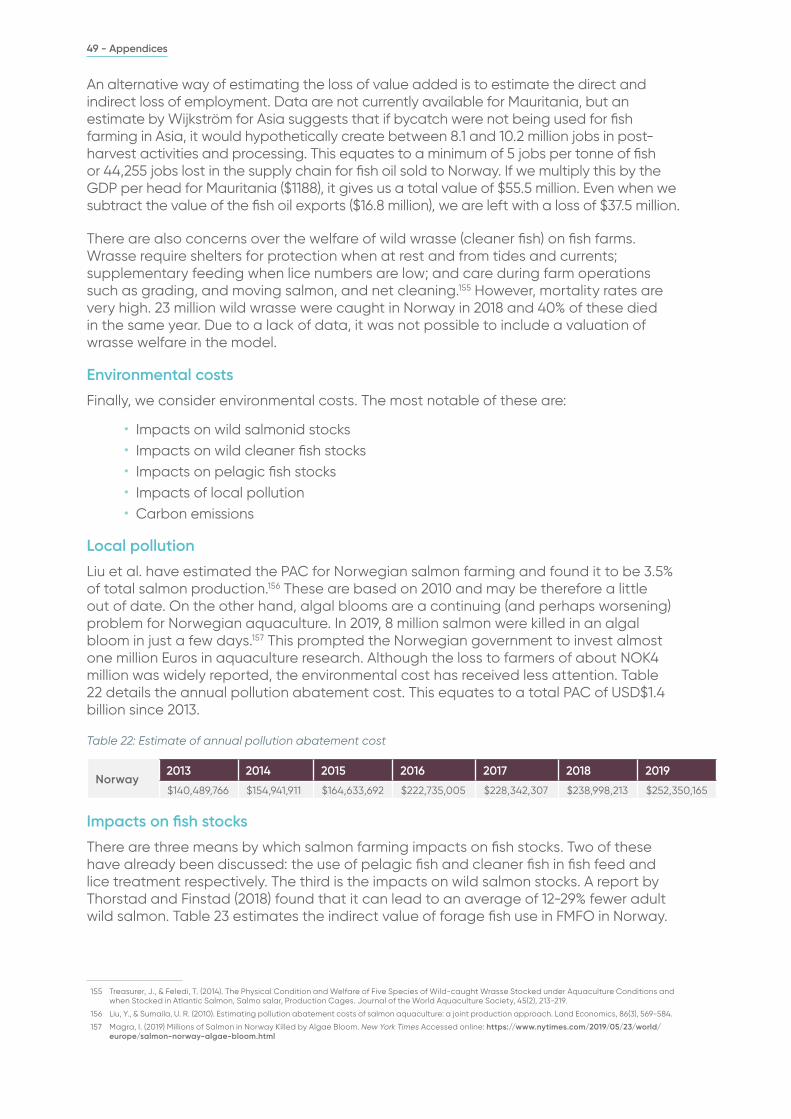
Table 22 Estimate of annual pollution abatement cost 49
Table 23 Loss of value as a result of forage fish being used in FMFO in Norway 2013-2019 50
Table 24 Emissions costs (MUSD) 51
Table 25 Summary of costs (MUSD) 51
5
Table 26 Opportunity costs of Scottish mortalities 2013-2019 52
Table 27 Estimate of cost of lice treatment in Scotland 2013-2019 (USD) 53
Table 28 Cost estimates FMFO in Scottish salmon farming (MUSD) 53
Table 29 Ownership of Scottish salmon farms 54
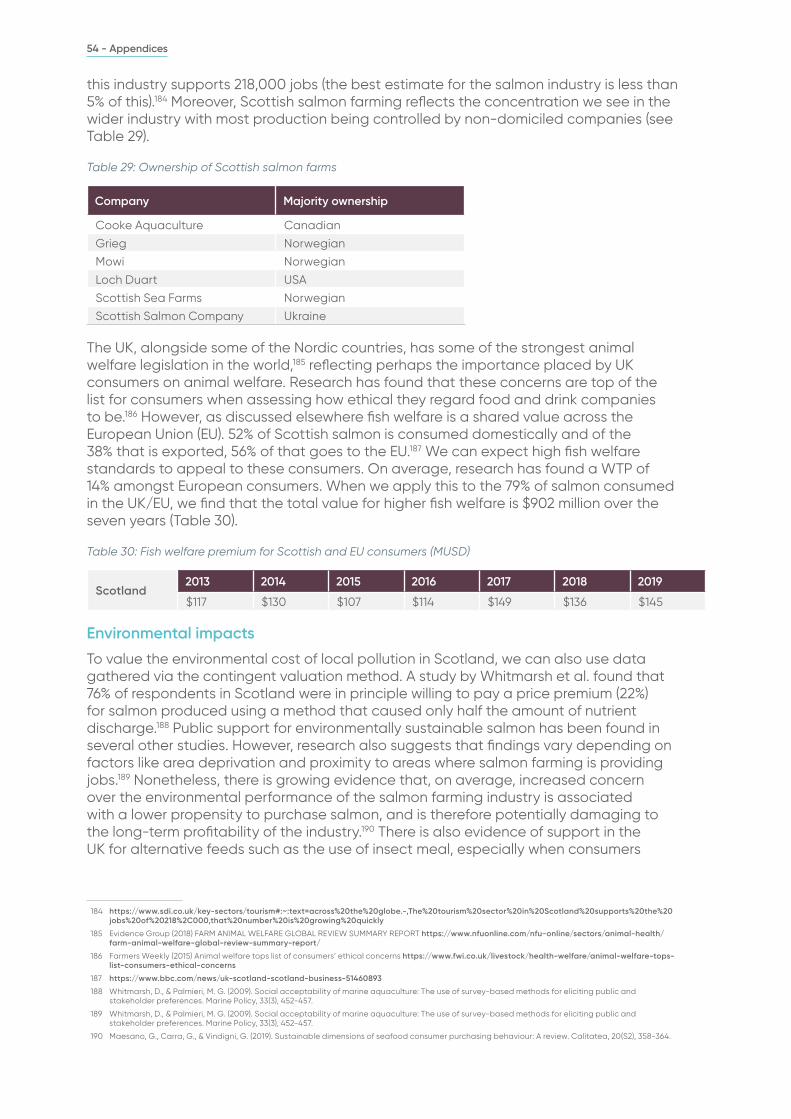
Table 30 Fish welfare premium for Scottish and EU consumers (MUSD) 54
Table 31 Willingness to pay for higher environmental standards 2013-2019 (MUSD) 55
Table 32 Ecosystem value of forage fish used in Scottish salmon production (MUSD) 55
Table 33 WTP estimates for restoration of salmon stocks 56
Table 34 Estimates of CO2 emissions from Scottish salmon farms 56
Table 35 Summary of costs (MUSD) 56
Table 36 Opportunity costs of mortalities in Canada 2013-2019 57
Table 37 Costs of sea lice treatment in Canada 2013-2019 (MUSD) 58
Table 38 Cost of FMFO in Canada 2013-2019 (MUSD) 58
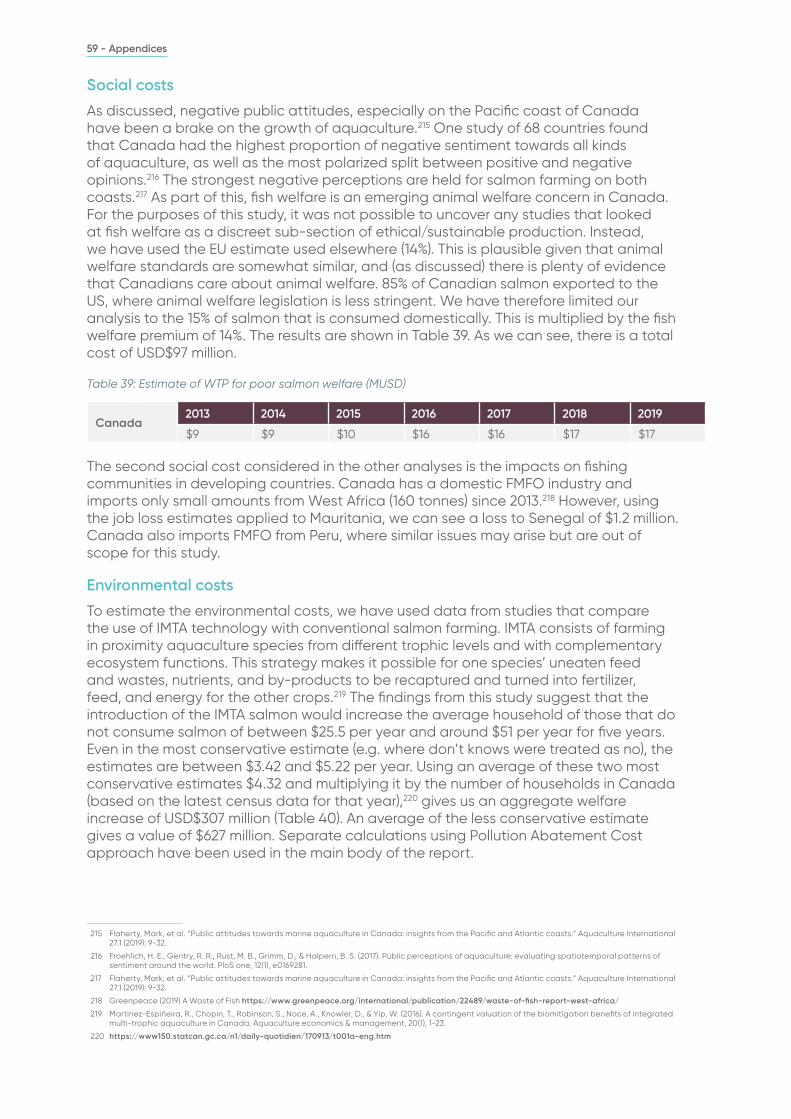
Table 39 Estimate of WTP for poor salmon welfare (MUSD) 59
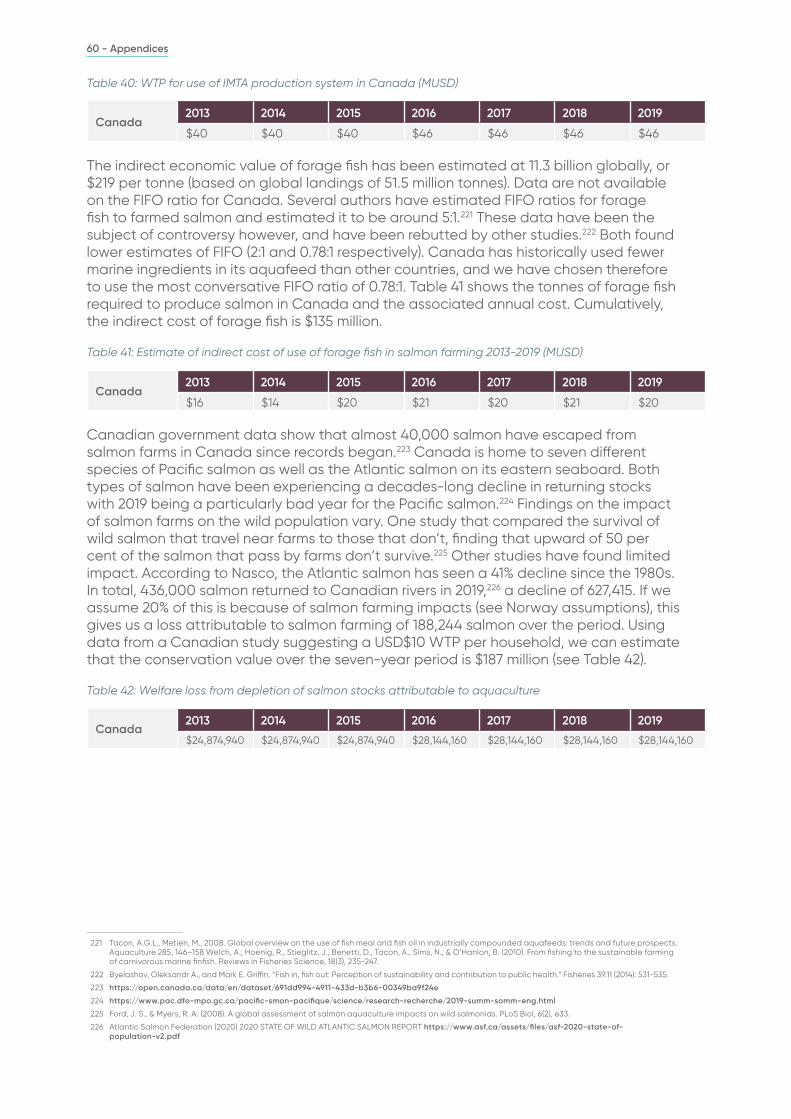
Table 40 WTP for use of IMTA production system in Canada (MUSD) 60
Table 41 Estimate of indirect cost of use of forage fish in salmon farming 2013-2019 (MUSD) 60
Table 42 Welfare loss from depletion of salmon stocks attributable to aquaculture 60
Table 43 Climate change costs in Canadian salmon farming 2013-2019 (MUSD) 61
Table 44 Summary of costs for Canadian salmon farming 2013-2019 (MUSD) 61
Table 45 FMFO calculations Chile (2013-2019) 63
Table of figuresFigure 1 Main causes of mortalities 30
6
AbbreviationsCO2 ndash carbon dioxide
CV ndash contingent valuation
DHC ndash direct human consumption
EU ndash European Union
FAO ndash Food and Agriculture Organisation of the United Nations
FIFO ndash Fish In Fish Out
FM ndash fish meal
FO ndash fish oil
GDP ndash Gross Domestic Product
GVP ndash Gross Value Added
IMTA ndash Integrated Multi Trophic Aquaculture
ISSF ndash Inside Scottish Salmon Feedlots
LCA ndash life cycle analysis
mt ndash million tonnes
MUSD ndash million United States Dollars
NASCO ndash North Atlantic Salmon Conversation Organisation
NOK ndash Norwegian kroner
PAC ndash pollution abatement costs
RAS ndash Recirculating Aquaculture Systems
SEPA ndash Scottish Environmental Protection Agency
t ndash Tonnes
UK ndash United Kingdom
USD ndash United States Dollars
WTP ndash willingness to pay
7 - Executive Summary
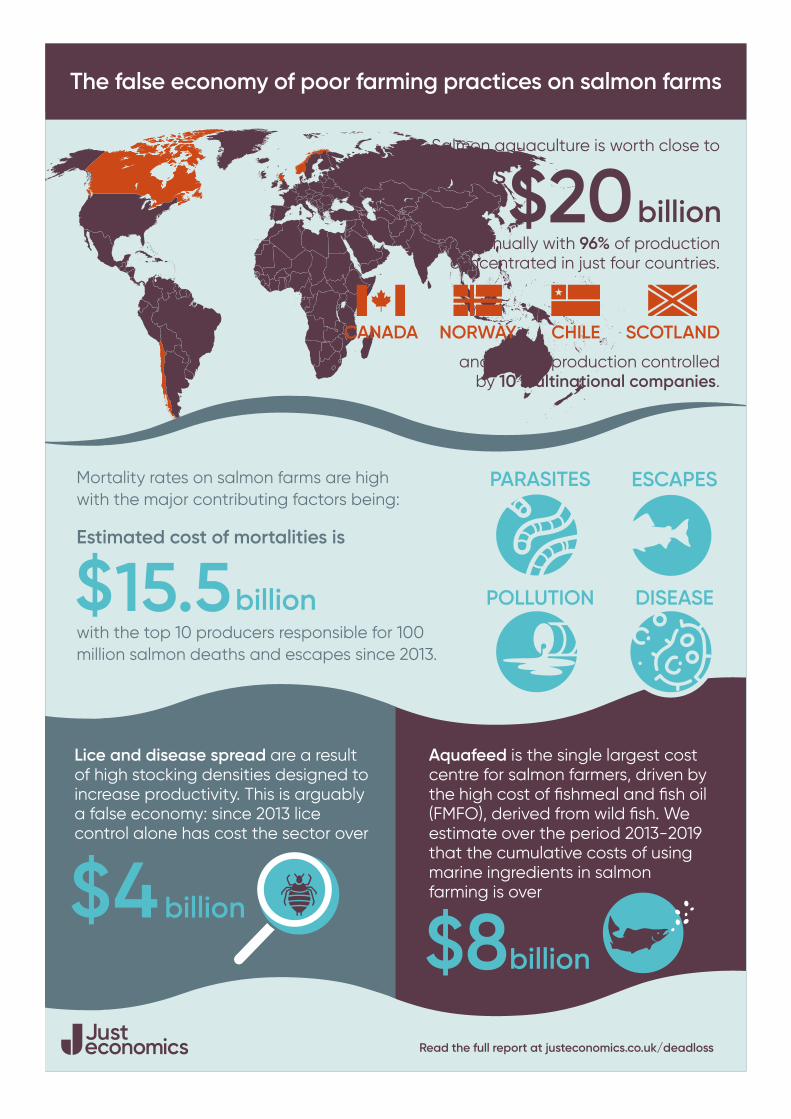
Executive summarySalmon aquaculture is worth close to USD$20 billion annually but is dominated by a small number of multinational producers operating in just four farming regions ndash Chile Norway Canada and Scotland Not only is it already the fastest growing food production sector in the world but a continued global growth in demand is expected However it also generates considerable controversy which has seen demand growth slow in developed countries not least due to negative consumer perceptions of farmed salmon
8 - Executive Summary
Although the big four producing countries all have ambitious plans for growth these are endangered by economic environmental and regulatory pressures Governments in these countries are largely uncritical of their salmon farming industries and official literature tends to promote a positive image A typical narrative is that of a clean and healthy source of protein that is helping to revive coastal communities Beneath the marketing discourse however transparency and accountability are extremely weak by comparison with land-based farming Data are often absent on important phenomena such as mortalities escapes and environmental impacts The sector lacks robust regulation and proper social environmental and economic accounting which makes it difficult to assess its impacts holistically
The report has two aims therefore
bull To highlight the unnecessary costs borne by the salmon industry because of poor fish husbandry and welfare and to estimate potential savings from improved farming practices and
bull To estimate the social and environmental costs of the salmon industry and to estimate the value to consumers and wider society of reducing those costs by improving social and environmental performance
The study was commissioned by the Changing Markets Foundation as part of its Fishing the Feed campaign The research was carried out independently by Just Economics
Aquaculture is a diverse farming practice and we acknowledge that it can make a positive contribution to food security and livelihoods However as the research highlights there are significant problems with the highly industrialised intensive form that salmon farming currently takes The aim of this report is to draw attention to these issues by placing financial values on the costs they incur to highlight their scale and importance
The report focuses on the four big producing countries (which account for 96 of farmed salmon production) and the top ten producers globally (which account for 50 of production) In conducting the research we encountered significant data limitations Table 1 lists the variables that were included and excluded (although for the producer analysis data were only available on two variables salmon mortality and lice fighting technologies) Decisions to exclude variables were based on data availability rather than importance and future research should seek to address these data gaps
9 - Executive Summary
Table 1 Variables included and not included in country level analysis
Cost category Variables included Variables not included
Economic Salmon mortality
Use of marine ingredients in feed
Use of lice fighting technologies
Costs of pesticides and medicines
Loss of tourismeco-tourism income
Costs of cleaner fish
Social Salmon welfare
Economic impacts of fish use in aquafeed
Cleaner fish welfare
Healthsocial impacts of use of fish in aquafeed
Health impacts of antibiotic and pesticide use
Environmental
Depletion of wild salmon stocks
Partial biodiversity loss due to depletion of pelagic fish stocks
Impacts of local pollution
Climate change impacts
Full biodiversity impacts of krill pelagic fish and cleaner fish stock depletion
Loss of wild sea trout stocks
Environmental impacts of pesticides antibiotics and medicine use
Impacts of other feed ingredients such as soy
For each variable included we drew on existing research to estimate incidence for each countryproducer and cost These were modelled for the seven years to 2019 ie from the point at which the industry began to expand rapidly The findings for each variable are discussed in turn beginning with economic costs
Economic costsMortality rates on salmon farms are high with parasites (and their treatments) disease (and their treatments) pollution and escapes being the major contributing factors Although some mortalities are inevitable the rates have increased dramatically in recent years and far outstrip those found in other forms of intensive farming The factors that induce mortality are often directly related to the quality of fish husbandry and mortality could therefore be considered an indication (and cost) of poor farming practices Mortalities data are only available for Norway and Scotland The combined cost since 2013 of mortalities in these two countries is estimated at USD$98 billion (89 billion in Norway and almost 922 million in Scotland) If we apply the average mortalities for these two countries to Canada and Chile we get an estimate of USD$768 million and $49 billion respectively Using this methodology the total cost across the four countries is USD$155 billion representing a huge opportunity cost for farmers The analysis also shows that reducing mortalities to 55 - closer to mortality rates on egg-laying hen farms - in Norway would represent an annual saving of over $892 million USD (based on 2019 volumes and prices)
Even when parasites and disease do not result in deaths their treatment is costly and the presence of lice in particular is a barrier to sector expansion There are also clear consumer concerns about the use of medicines and chemicals to control them Lice and disease spread are hastened by high stocking densities which are designed to increase the productivity of farms However this is arguably a false economy Estimates of the cost of controlling lice alone is between 6 and 85 of the cost of production Using these data we estimate a cost to the sector from lice control of over $4 billion since 2013
10 - Executive Summary
Aquafeed is the single largest cost centre for salmon farmers with much of this being driven by the high cost of fish meal (FM) and fish oil (FO) which are derived from wild fish We estimate that the cumulative costs of using marine ingredients in salmon farming is over $8 billion in the four countries over the period (2013-2019)
We can also apply these estimates to the top ten producers which had combined total revenues of USD$12 billion dollars in 2018 By comparing the expected and actual harvest for these companies since 2010 (Table 2) we can see that between them they were responsible for the loss ndash through mortalities and escapes - of over half a million tonnes of salmon during this period (or about 100 million salmon) This equates to almost USD$37 billion In about 70 of cases the cause of mortality is either not known or not disclosed For the remaining 30 the leading cause is sea lice followed by disease and algal blooms (as a result of pollutants) Using a global estimate of 6 for the cost of combatting sea lice allows us to estimate a cost for these companies (UDS$35 billion since 2013)1 This gives a combined cost of mortalities and lice treatment of USD$71 billion or 12 of revenues over the period
Table 2 Estimated mortalities and associated losses by producer (2010-2019)
Company Volume of losses (tonnes) Cost (MUSD)
Seafood Mowi 252521 $1719
Leroy Seafood 66975 $456
Grieg Seafood 64992 $442
Australis 34042 $231
Blumar 32236 $219
Norway Royal Salmon 28342 $193
Bakkafrost 21058 $143
Salmar 15929 $108
Camanchaca 11550 $78
Seafood Invermar 9256 $63
Total 536901 $3656
Environmental costsSalmon farming is generating and running up against several environmental pressures which are inextricably linked to its commercial success and these are a major source of risk for the industry Atlantic salmon can only be farmed under certain conditions and as seas warm and available locations become exploited the industry is running out of viable sites for new farms This means that new sources of growth are dwindling creating pressure to locate farms in less suitable environments and to increase stocking densities which further exacerbate environmental pressures
1 In the previous section we report that the lice control estimates for the four countries is $4bn These were developed from lice treatment costs per kg whereas this figure derives from a percentage of revenue As discussed in the main body of the report the country-level analysis most likely underestimates the cost of lice
11 - Executive Summary
Aquaculture activities are an interconnected part of the ecosystem in which they exist and salmon farms make use of lsquofreersquo coastal ecosystem services such as clean water appropriate temperatures nutrient levels and so on They also contribute to their deterioration however due to local pollution impacts from uneaten feed and faeces which are directly discharged into the marine environment The Pollution Abatement Cost (PAC) measures the amount that would be required to preserve or restore a unit of an environmental good Unless the full PAC is accounted for salmon farms are lsquofree ridingrsquo on these environmental services A PAC has been calculated for Norwegian salmon farming Although one of the best environmental performers of the countries included here this still amounts to an economic cost of 35 of total production When this is applied across the four countries it gives us a total cost of over USD$4 billion since 2013
Salmon farming is also impacting negatively on wild fish stocks There are three ways in which this manifests damage to wild salmon stocks the use of pelagic fish in FMFO and the use of cleaner fish in parasite control
There have been serious concerns about the status of wild Atlantic salmon stocks for many years now and the numbers of returning salmon are at an all-time low Several studies have reviewed the social economic and cultural value of the Atlantic salmon which has an iconic status within communities along the Atlantic seaboard This value can be observed in contingent valuation studies that show high lsquoWillingness to Payrsquo (WTP) amongst households to protect and restore wild salmon stocks Although the reasons for declining salmon stocks are many and varied it is widely believed that salmon farming is a contributing factor Farms spread lice and disease to wild populations and pollute local areas through which returning salmon will sometimes pass Escaped farmed salmon also hybridise with wild populations and reduce their ability to survive in the wild Our economic analysis of the loss of salmon stocks attributable to salmon farms is focused on Canada Norway and Scotland where the contingent valuation studies have been carried out We find the value destroyed by salmon farming through loss of wild stocks to be USD$308 million
Pelagic fish are highly nutritious forage fish and are the main fish source used in the production of FMFO used in salmon feed Almost one-fifth of the worldrsquos annual wild fish catch is taken out of the ocean for this purpose the majority of which is used in seafood farming However (in addition to being a key source of protein for many coastal communities) forage fish also play a central role in the ecosystem as they are the primary food source for many marine mammals seabirds and larger fish and some species such as sardinella in West Africa are now heavily overfished Valuing their role in the ecosystem is extremely complex but just considering their contribution to the commercial catch of carnivorous species gives us an additional lsquohiddenrsquo value of $219 per tonne Applying this to FMFO use in our four countries gives us an indication of the ecosystem value of forage fish lost to fish farming (USD$178 billion over the seven years) Data suggest that the removal of wild fish from feed formulations has plateaued if this is the case we would expect to see these costs rise considerably in line with the expansion of production that is planned in all of the countries studied (a fivefold increase in Norway by 2050 and a doubling in Scotland by 2030 to give just two examples)
12 - Executive Summary
Compared with salmon there is limited research on cleaner fish and their biodiversity impacts and welfare are only discussed in a limited way in the literature More research is required therefore to fully account for the impacts of salmon farming on wild fish populations
Finally we consider climate change impacts Aquaculture is often positioned as a low carbon alternative to land-based farming and whilst the farmgate emissions are low relative to agriculture it is argued that these figures underestimate the true carbon cost once feed and airfreight are taken into consideration Life Cycle Analysis (LCA) provides a more complete estimate of carbon emissions because it includes impacts throughout the supply chain LCA of carbon emissions across producer countries shows that Norway has the lowest impacts whereas impacts are consistently highest in Scotland However due to data limitations we have applied the Norwegian LCA estimates to the four countries This analysis reveals that the minimum social cost of carbon from salmon farming in the four countries is almost USD$83 billion during the timeframe studied
Social issues
The main social issue included in this report is the impact on salmon welfare As we have seen farm profitability and salmon welfare are inextricably linked In the short-term there may be a financial incentive to take shortcuts with fish husbandry but over time these lead to disease lice stress and ultimately higher mortality rates which also result in financial losses It is therefore in the long-term interests of farms to keep densities at the optimum level for fish health and welfare and to adopt the highest farming standards Moreover there are strong and growing consumer preferences for high fish welfare especially in Europe A European study finds that the average European consumer would be willing to pay 14 more for salmon with higher welfare standards If we apply this to European and Canadian consumers of salmon (where attitudes are similar) we get a value of $46 billion2
The final cost considered is the impact of diverting forage fish away from direct human consumption (DHC) in low and middle-income countries for use in the FMFO industry in large part to feed European aquaculture Countries such as those along the West African seaboard have significant food security issues In addition the growth of the FMFO industry may lead to net economic losses because of the loss of jobs in traditional fishing and food preparation (especially for women) Finally as already discussed these waters are already heavily fished and further declines in the catch will disproportionately affect local fishing communities Data limitations mean it was difficult to value these financial losses However a case study for Norway which imported 84 thousand tonnes of fish oil from Mauritania in 2018 shows a loss to Mauritania in 2019 of USD$375 million
Conclusions and recommendationsThe demand for seafood is expected to increase in coming years and part of this will have to be met by increased aquaculture production Fish farming has the potential therefore to be a significant source of social economic and environmental value but farming practices matter greatly and determine whether the industry can be considered a net loss or net benefit to society Although we encountered significant data gaps this analysis has allowed us to place a value on some of the costs of salmon farming as currently practiced It suggests that salmon aquaculture has produced private and external costs of USD$47 billion since 2013 (see Table 3 for a summary of these) When we segment these into private and external costs we can see that around 60 fall to producers and 40 to wider society (USD$28 billion and USD$19 billion respectively)
2 Studies of welfare tend to be conducted amongst consumers rather than producer citizens and the calculations have been focused on these consumers where data are available and animal welfare issues are most salient
13 - Executive Summary
Table 3 Summary of costs for each variable by country (MUSD)
Canada Norway Chile Scotland Total
Mortalities 768 8908 4939 922 15539
Lice 111 2142 1647 463 4365
FMFO 454 4832 2045 859 8192
Total economic cost 1333 15969 8631 2233 28096
Salmon stocks 187 52 Insufficient data 68 308
Pelagic fish stocks 135 665 302 680 1784
Local pollution 189 2328 1268 288 4073
Climate change 425 5224 2282 425 8356
Total environmental cost 936 8269 3852 1461 14521
Fish welfare 97 3675 Insufficient data 902 4674
Total social cost 97 3675 Insufficient data 902 4674
Total 2366 27913 13304 4596 47291
Considering the full range of costs and benefits may well demonstrate positive benefits from aquaculture (and even salmon farming) Yet what this report shows is that there are substantial costs that are not currently included on the balance sheet and that the scope for improved environmental and social performance is considerable In addition a combination of growing environmental impacts consumer demand for ethical and environmentally friendly products and direct losses from poor fish husbandry are creating long run economic risks to the industry that can only be mitigated by investing in better farming practices and reduction of environmentally harmful aspects such as use of wild-caught fish
Our recommendations focus on the four most significant stakeholders in salmon farming governments investors farmers and consumers each of which has a role to play in transitioning to a more sustainable aquaculture and food system
For governments
Economic benefits of salmon farming need to be balanced against other coastal industries such as tourism angling and wider environmental impacts Governments should be prepared to support alternative technologies that improve social and environmental standards as these are likely to be net beneficial in the long run
Better oversight and more robust regulation of salmon farming should lead over time to competitive advantage as consumers increasingly seek out more ethical and environmentally friendly products Governments can lead the way on this by restricting licences to companies that meet higher social and environmental standards
The industry would benefit from guidelines for sustainable feed ingredients along with stricter due diligence and governance frameworks in aquafeed supply chains Governments should also support the phase-out of whole wild-caught fish for use in aquafeed Furthermore aquaculture that relies on wild-caught fish should not receive any subsidies or other public support measures Policy should support the development of alternative technologies (for feedstuffs and farming methods) and provide effective economic incentives
14 - Executive Summary
Governments should also require more transparent reporting in this industry and should resist industry pressure not to publish mortalities data that are in the public interest In addition consumers increasingly expect transparency in supply chains and companiessectors which fail to respond to that expectation will place themselves at a disadvantage in the market
More generally there is a need to improve the quality of social economic and environmental accounting in salmon farming This would have the dual benefit of supporting more holistic decision-making and incentivising better farming practices By revealing costs and benefits governments could create a race to the top amongst salmon farmers and a level playing field for small producers that may be operating to higher standards At a minimum governments (eg in Scotland) should refrain from making a priori economic arguments in favour of salmon farming given the narrowness of these arguments and their responsibilities to a wider group of stakeholders
For investors
As a result of growing environmental and regulatory pressures investment decisions are required that drive a rapid transition towards alternative feeds and better farming practices These already exist but require more investment to make them viable in the short-term
Although the risks of existing farming practices are often understood investors continue to support them due to short-term returns This creates a barrier to the adoption of new technologies and improved practices and investors need to take a long-term view This may involve accepting lower returns in the short term but as discussed in this paper issues with both supply and demand should create competitive advantage in the long run
For farmers
Mortalities lice treatments and disease are creating huge costs for farmers and damaging the reputation of farmed salmon Significant opportunities exist to dramatically improve the environmental and social performance of salmon production through a focus on the development of least-environmental cost (as opposed to least-economic-cost) feed formulations These technologies exist - and have been shown to work - and producers could appeal to the growing consumer demand for an ethical product by being early adopters of these formulations As the cost of marine ingredients is expected to increase these may also prove to be a lower cost alternative in the medium term
As demonstrated in this report poor fish husbandry is a false economy as it leads to significant direct and indirect costs We recommend therefore that farmers adopt better husbandry such as stocking densities commensurate with higher survival rates
For consumers
Salmon was once a high value food that was only available in season and consumed on special occasions In line with the need for investment from all stakeholders some consumers should also be prepared to pay more for salmon where their economic circumstances allow andor to consume it less frequently As part of this consumers could seek out alternatives to carnivorous fish such as molluscs that provide dietary and economic benefits at lower social economic and environmental costs
and 50 of production controlled by 10 multinational companies
annually with 96 of productionconcentrated in just four countries
Salmon aquaculture is worth close to
with the top 10 producers responsible for 100 million salmon deaths and escapes since 2013
Mortality rates on salmon farms are high with the major contributing factors being
Estimated cost of mortalities is
48
DISEASE
PARASITES
POLLUTION
ESCAPES
Aquafeed is the single largest cost centre for salmon farmers driven by the high cost of fishmeal and fish oil (FMFO) derived from wild fish We estimate over the period 2013-2019 that the cumulative costs of using marine ingredients in salmon farming is over
Lice and disease spread are a result of high stocking densities designed to increase productivity This is arguably a false economy since 2013 lice control alone has cost the sector over
The false economy of poor farming practices on salmon farms
Read the full report at justeconomicscoukdeadloss
CANADA CHILENORWAY SCOTLAND
billion
Yet there is a strong lsquowillingness to payrsquo amongst consumers in the four countries to preserve wild salmon As a result we estimate a loss to communities of since 2013
Salmon farming is also contributing to the decline of wild salmon through
LICE amp DISEASE SPREAD POLLUTION HYBRIDISATION
The false economy of poor farming practices on salmon farms continued
Read the full report at justeconomicscoukdeadloss
is the estimated cost of pollution for the four countries since 2013 Pollutants from salmon aquaculture include
uneaten feed and faeces which are directly discharged into the marine environment
Is the estimated social cost of carbon from salmon farming Although positioned as a low carbon alternative to meat life cycle analysis reveals a higher cost than reported
Since 2013 the unaccounted cost of salmon farming across the four countries is over
Consumers in Europe and Canada have shown a high willingness to pay for better fish welfare We estimate the cost of poor fish welfare at
A partial valuation of the ecosystem benefits of forage fish lost to fish farming due to the use of FMFOis around
18 6
8347
17 - Introduction
1 IntroductionSalmon farming is a highly concentrated industry Just four countries - Canada Chile Scotland and Norway ndash account for 96 of global production3 Moreover 50 of all farmed salmon globally is produced by just ten publicly traded farmed salmon companies with combined revenues of $12 billion in 20184
3 FAO (2019) The State of World Fisheries and Aquaculture httpwwwfaoorgstate-of-fisheries-aquaculture
4 Planet Tracker (2020) Loch-ed profits httpsplanet-trackerorgtracker-programmesoceansseafoodloch-ed
18 - Introduction
Historically salmon farming has been a highly profitable industry so much so that salmon has become the largest single fish by commodity value5 Between 2012 and 2016 salmon stock prices appreciated by 435 per year6 Consumer demand is also expected to grow in both developed and developing markets in the coming years7 More recently however the industry is encountering economic environmental and regulatory pressures that endanger future growth After years of remarkable financial performance productivity growth has slowed and market risks have increased These have been compounded in 2020 by the Covid-19 pandemic which has seen the price of salmon slump due to oversupply8
Aquaculture lacks proper social and environmental reporting which could improve decisions about where when and under what conditions salmon farming is desirable9 In its absence salmon farmers are incentivised to pursue short-run commercial ends10
which create long-run economic social and environmental risks11 Some of these are direct costs from poor fish welfare (eg mortalities resulting from poor fish husbandry or damaged consumer demand) whereas others are indirect such as pollution-induced mortalities of farmed fish These will ultimately increase the cost of doing business and most likely impact on consumer preferences for farmed salmon both of which will affect the future profitability of the sector
The aim of this report is to address the limitations in reporting by estimating the private and external costs of the industry The research is scoped to only consider salmon farming and associated costs We acknowledge that wider aquaculture has many positive impacts especially in low-income countries where research finds positive impacts on livelihoods and food security12 Salmon farming has also been found to generate public and private benefits These include consumer and producer surplus Consumer surplus refers to the benefits of being able to purchase cheaper salmon (which is an important - albeit not the only - source of omega 3 oils and animal proteins) and producer surplus to the profits made by producers There are also benefits to governments through tax transfers and local communities which receive some benefit from industry and employment
However there are large number of stakeholders affected by salmon farming and each groupentity bears different costs and benefits Economic analyses are often conducted from the perspective of a limited number of stakeholders (eg focusing on employment benefits13 but excluding costs borne by other coastal stakeholders)14 To counter this this study focuses largely on the costs that have often been excluded from economic analyses to date
5 Ibid
6 Misund B amp Nygaringrd R (2018) Big fish Valuation of the worldrsquos largest salmon farming companies Marine Resource Economics 33(3) 245-261
7 Gephart J A Golden C D Asche F Belton B Brugere C Froehlich H E amp Klinger D H (2020) Scenarios for global aquaculture and its role in human nutrition Reviews in Fisheries Science amp Aquaculture 1-17
8 Intrafish (2020) Larger sizes cause salmon prices to plunge again amid COVID-19 impacts httpswwwintrafishcomcoronaviruscovid-19-live-farmed-salmon-prices-plunge-again-alaska-pollock-gets-a-lift-beijing-issues-warning2-1-746616
9 Georgakopoulos G amp Thomson I (2005 March) Organic salmon farming risk perceptions decision heuristics and the absence of environmental accounting In Accounting Forum (Vol 29 No 1 pp 49-75) No longer published by Elsevier
10 Aanesen M amp Mikkelsen E (2020) Cost-benefit analysis of aquaculture expansion in Arctic Norway Aquaculture Economics amp Management 24(1) 20-42
11 Taranger G L Karlsen Oslash Bannister R J Glover K A Husa V Karlsbakk E amp Madhun A S (2015) Risk assessment of the environmental impact of Norwegian Atlantic salmon farming ICES Journal of Marine Science 72(3) 997-1021
12 Beacuteneacute C Arthur R Norbury H Allison E H Beveridge M Bush S amp Thilsted S H (2016) Contribution of fisheries and aquaculture to food security and poverty reduction assessing the current evidence World Development 79 177-196
13 Riddington G Radford A and Gibson H (2020) The Economic Contribution of Open Cage Salmon Aquaculture to Scotland A Review of the Available Economic Evidence httpswwwsalmon-troutorgwp-contentuploads202004Riddington-Radford-Gibson-Economic-Contribution-of-Salmon-Aquaculture-to-Scotlandpdf
14 Young N Brattland C Digiovanni C Hersoug B Johnsen J P Karlsen K Mhellip Thorarensen H (2019) Limitations to growth Social-ecological challenges to aquaculture development in five wealthy nations Marine Policy 104 216ndash224
19 - Introduction
The report has two aims therefore
bull To highlight to key stakeholders the unnecessary costs borne by the salmon industry because of poor fish husbandry and welfare and to estimate potential savings from improved farming practices and
bull To estimate the wider social and environmental costs of the salmon industry and to estimate the value to consumers and wider society of reducing those costs by improving social and environmental performance
The study was commissioned by the Changing Markets Foundation as part of its Fishing the Feed campaign The research was carried out independently by Just Economics
The report provides a focus on each of the four main producer countries We begin with a short summary of the issues in salmon farming before going on to describe the methodology We then discuss each country in turn and conclude with a set of recommendations for investors governments farmers and consumers
20 - Methodology
2 MethodologyThe analysis focuses on the four top salmon producing countries Norway Scotland Chile and Canada as well as the top ten producers In this section we describe the overall approach before going on to discuss the limitations and caveats
21 - Methodology
21 Overall approach
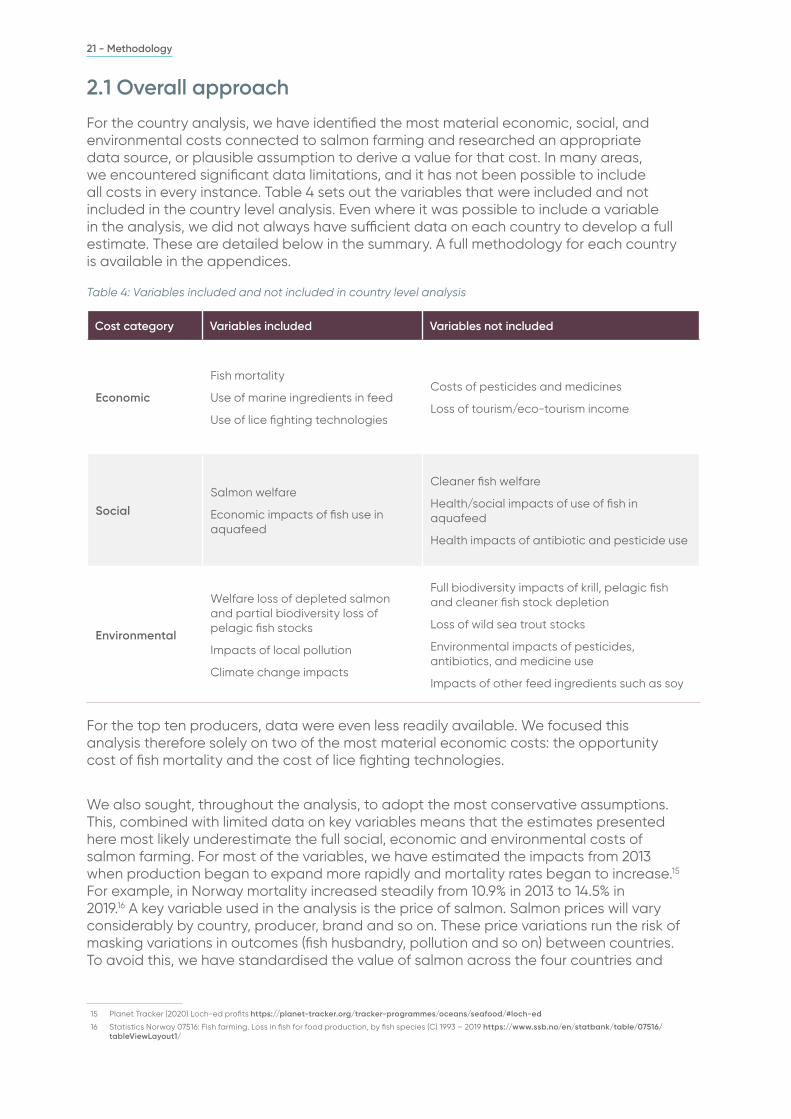
For the country analysis we have identified the most material economic social and environmental costs connected to salmon farming and researched an appropriate data source or plausible assumption to derive a value for that cost In many areas we encountered significant data limitations and it has not been possible to include all costs in every instance Table 4 sets out the variables that were included and not included in the country level analysis Even where it was possible to include a variable in the analysis we did not always have sufficient data on each country to develop a full estimate These are detailed below in the summary A full methodology for each country is available in the appendices
Table 4 Variables included and not included in country level analysis
Cost category Variables included Variables not included
Economic
Fish mortality
Use of marine ingredients in feed
Use of lice fighting technologies
Costs of pesticides and medicines
Loss of tourismeco-tourism income
Social
Salmon welfare
Economic impacts of fish use in aquafeed
Cleaner fish welfare
Healthsocial impacts of use of fish in aquafeed
Health impacts of antibiotic and pesticide use
Environmental
Welfare loss of depleted salmon and partial biodiversity loss of pelagic fish stocks
Impacts of local pollution
Climate change impacts
Full biodiversity impacts of krill pelagic fish and cleaner fish stock depletion
Loss of wild sea trout stocks
Environmental impacts of pesticides antibiotics and medicine use
Impacts of other feed ingredients such as soy
For the top ten producers data were even less readily available We focused this analysis therefore solely on two of the most material economic costs the opportunity cost of fish mortality and the cost of lice fighting technologies
We also sought throughout the analysis to adopt the most conservative assumptions This combined with limited data on key variables means that the estimates presented here most likely underestimate the full social economic and environmental costs of salmon farming For most of the variables we have estimated the impacts from 2013 when production began to expand more rapidly and mortality rates began to increase15 For example in Norway mortality increased steadily from 109 in 2013 to 145 in 201916 A key variable used in the analysis is the price of salmon Salmon prices will vary considerably by country producer brand and so on These price variations run the risk of masking variations in outcomes (fish husbandry pollution and so on) between countries To avoid this we have standardised the value of salmon across the four countries and
15 Planet Tracker (2020) Loch-ed profits httpsplanet-trackerorgtracker-programmesoceansseafoodloch-ed
16 Statistics Norway 07516 Fish farming Loss in fish for food production by fish species (C) 1993 ndash 2019 httpswwwssbnoenstatbanktable07516tableViewLayout1
22 - Methodology
the top producers by using the annual average IMF salmon export price17 This allows us to hold the price of salmon constant which enables more accurate comparisons between countries However it may over- or underestimate costs in certain areas
For each variable we have estimated the scale of the problem produced by the salmon industry and identified a method of valuing the cost of this impact For the economic costs this was relatively straightforward For example for mortalities we have taken annual mortalities since 2013 and multiplied them by the price salmon fetched in that same year For the environmental costs we have mainly relied on the findings from studies by environmental economists that have estimated life cycle costs or pollution abatement costs of salmon farms However for some variables where studies were not available we have also generated assumptions rooted largely in the academic literature These assumptions have been documented in the discussion below
Of the three categories of costs social costs are the most challenging to estimate In this section we have mainly relied on stated preference method (SPM) SPM refers to a family of tools and techniques used in cost benefit analysis to estimate the value of non-market-traded goods and services18 In general terms respondents are asked to rank rate or choose between different hypothetical scenarios that contain a mix of different attributes How people value those different attributes ndash their willingness to pay (WTP) - can then be inferred from the choices they make Stated preference methods are useful for estimating lsquonon-use valuersquo Whereas lsquouse valuersquo is derived from the consumption of a good or service non-use value quantifies the benefit we derive from goods or service that we cannot consume19 There are different forms of non-use value that are relevant here These include
bull Existence value - the benefit we derive from knowing that a phenomenon exists even if we may never directly encounter it (eg an endangered species)
bull Option value - captures the value we derive from preserving a particular resource base for future generations and
bull Bequest value - refers to the value we place on being able to bequeath it to future generations
This approach is especially apposite for valuing phenomena like fish welfare and wild fish stocks which we know are of significant value to consumers including those within the top producer countries of Norway Canada and Scotland20
22 Limitations and caveats
The study was limited substantially by data limitations especially for Chile In some instances assumptions had to be used (eg extrapolated from other countries) Whilst we always sought to do these in a plausible way this is always a second-best option A second limitation is that the analysis only takes account of costs The study has been scoped as such but it could be developed in the future into a more holistic cost benefit study A third caveat is that the study is limited only to salmon which is already a well-researched type of aquaculture Aquaculture is a diverse industry involving many kinds of seafood farmed in different ways by different types of farmers This ranges from artisanal family-owned producers in developing countries to industrial-scale farming usually operating transnationally Although salmon farming is largely dominated by
17 httpsdataimforgsk=471DDDF8-D8A7-499A-81BA-5B332C01F8B9
18 Carson Richard T and W Michael Hanemann ldquoContingent valuationrdquo Handbook of environmental economics 2 (2005) 821-936
19 Pearce D W amp Turner R K (1990) Economics of natural resources and the environment JHU press
20 Riepe C Meyerhoff J Fujitani M Aas Oslash Radinger J Kochalski S amp Arlinghaus R (2019) Managing river fish biodiversity generates substantial economic benefits in four European countries Environmental management 63(6) 759-776
23 - Methodology
the latter this is not the case for other species This study does not therefore draw any wider conclusions about aquaculture more generally Finally although the study draws on evidence from alternative technologies and alternative feeds it does not model the relative costs of using these approaches The study mostly considers mainstream practice as it has operated over the past seven years However the authors acknowledge that there are lots of innovations in the industry many of which have the potential to improve social and environmental outcomes These will be considered again in the conclusions and recommendations sections
24 - Findings
3 FindingsIn this section we summarise the findings for both the country-and producer-level analyses This synthesises the data from the individual studies to create estimates that are largely global given the dominance of these four countries in global production We present these according to the three cost categories beginning with economic issues We also include costs for the top ten producers with a full write up for each country available in the appendices
25 - Findings
31 Economic issues
There are three economic variables that we consider
bull Opportunity costs of mortalitiesbull Cost of marine ingredients in feedbull Cost of lice fighting technologies
Opportunity costs of mortalities
Mortality rates on salmon farms are high and represent a substantial opportunity cost to salmon farmers21 Major contributing factors are lice disease and their treatments as well as algal blooms and warming seas Salmon are also lost through escapes and many mortalities are unexplained22 Annual mortality statistics are only available for Norway and Scotland and both countries have seen increases in their rates since 2013 as the industry generates and runs up against increasing environmental pressures These stem from licedisease-induced mortalities and warming seas but also the fact that most of the available viable sites in both countries have already been exploited and there is a shortage of suitable coastline for open net cage farming23
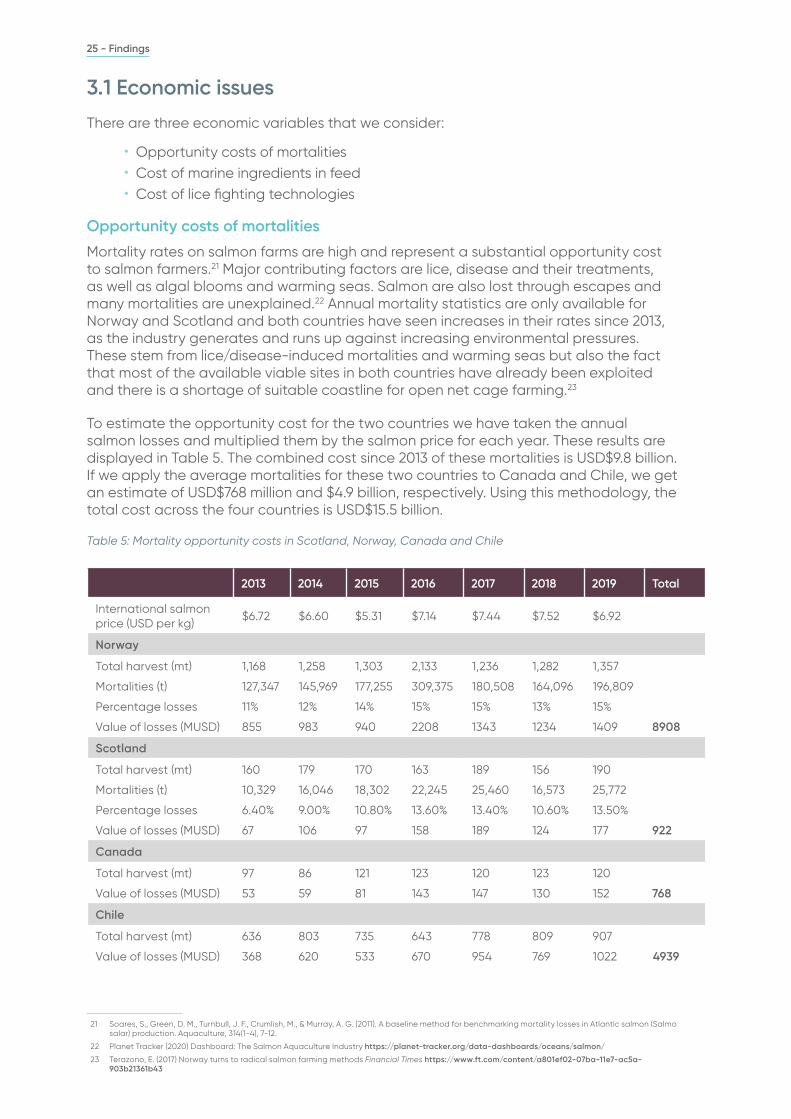
To estimate the opportunity cost for the two countries we have taken the annual salmon losses and multiplied them by the salmon price for each year These results are displayed in Table 5 The combined cost since 2013 of these mortalities is USD$98 billion If we apply the average mortalities for these two countries to Canada and Chile we get an estimate of USD$768 million and $49 billion respectively Using this methodology the total cost across the four countries is USD$155 billion
Table 5 Mortality opportunity costs in Scotland Norway Canada and Chile
2013 2014 2015 2016 2017 2018 2019 Total
International salmon price (USD per kg)
$672 $660 $531 $714 $744 $752 $692
Norway
Total harvest (mt) 1168 1258 1303 2133 1236 1282 1357
Mortalities (t) 127347 145969 177255 309375 180508 164096 196809
Percentage losses 11 12 14 15 15 13 15
Value of losses (MUSD) 855 983 940 2208 1343 1234 1409 8908
Scotland
Total harvest (mt) 160 179 170 163 189 156 190
Mortalities (t) 10329 16046 18302 22245 25460 16573 25772
Percentage losses 640 900 1080 1360 1340 1060 1350
Value of losses (MUSD) 67 106 97 158 189 124 177 922
Canada
Total harvest (mt) 97 86 121 123 120 123 120
Value of losses (MUSD) 53 59 81 143 147 130 152 768
Chile
Total harvest (mt) 636 803 735 643 778 809 907
Value of losses (MUSD) 368 620 533 670 954 769 1022 4939
21 Soares S Green D M Turnbull J F Crumlish M amp Murray A G (2011) A baseline method for benchmarking mortality losses in Atlantic salmon (Salmo salar) production Aquaculture 314(1-4) 7-12
22 Planet Tracker (2020) Dashboard The Salmon Aquaculture Industry httpsplanet-trackerorgdata-dashboardsoceanssalmon
23 Terazono E (2017) Norway turns to radical salmon farming methods Financial Times httpswwwftcomcontenta801ef02-07ba-11e7-ac5a-903b21361b43
26 - Findings
Although the total figure relies on an estimate from Scotland and Norway we know that salmon farms everywhere are experiencing similar environmental pressures because of poor fish husbandry environmental practices and global warming Indeed in Chile we would expect higher mortalities due to less stringent environmental regulations and a high incidence of lice infestation in recent years24 Even if we restrict the analysis to Norway and Scotland the exercise reveals the scale of the economic cost this represents The mortality rate of juveniles is expected to be even higher but there is poor reporting of mortality in hatcheries25 It is not possible therefore to include estimates of juvenile losses in this study and the figures presented here are therefore likely to underrepresent the scale and cost of salmon mortality
Unfortunately it is also expected that high mortalities will continue to be a problem for the industry Whilst some mortalities are expected in any farming practice salmon mortalities are high by the standards of other commonly farmed species Studies of other aquaculture species have found survival rates of up to 99 once stocking densities are kept low26 27 In addition mortality rates on egg laying hen farms are between 5 and 628 It is interesting to note that reducing mortalities to 55 on salmon farms in Norway would represent an annual saving of $892 million USD (based on 2019 volumes and prices)
Lice fighting technologies
Parasite and disease fighting technologies also represent a major cost to the industry But they are also a function of poor fish husbandry and therefore a potentially avoidable cost There are also clear consumer concerns about the use of medicines and chemicals to control diseases and parasites29 When fish farms have high stocking densities ndash that is fish are crowded together in a small environment with poor water flow - the spread of infectious diseases is hastened30 It also increases fish stress and makes them more susceptible to disease Moreover lice are more likely to spread rapidly in these conditions and natural methods of removing lice such as going upriver are not available to the salmon
In this section we aggregate our estimates of the cost of using lice fighting technologies to slow the spread of parasites Due to data limitations we have not included the cost of disease control methods However as we will see addressing the lice threat represents a substantial cost on its own
There are two means by which sea lice create costs for farmers First lice have been shown to reduce fish growth and appetite31 and second damage control measures can be costly and some (such as delousing) can directly cause mortalities (as a result of stress from handling and secondary infections)32 Cleaner fish are endorsed by some as a more natural alternative to medication but (leaving aside the impacts on their welfare) they are an ongoing cost as they are euthanised at the end of each growing cycle at which point a new crop are required In addition questions have been raised over their efficacy at reducing lice on a national scale33
24 Mowi (2019) Annual Report httpscorpsiteazureedgenetcorpsitewp-contentuploads202003Mowi_Annual_Report_2019pdf
25 Dyrevern (2019) New report reveals unnaturally high mortality in aquaculture hatcheries httpsdyrevernnodyrevernnew-report-reveals-unnaturally-high-mortality-in-aquaculture-hatcheries
26 Hayat M A Nugroho R A amp Aryani R (2018) Influence of different stocking density on the growth feed efficiency and survival of Majalaya common carp (Cyprinus carpio Linnaeus 1758) F1000Research 7
27 Ronald N Gladys B amp Gasper E (2014) The effects of stocking density on the growth and survival of Nile tilapia (Oreochromis niloticus) fry at son fish farm Uganda Journal of Aquaculture Research and Development 5(2) 222
28 Anon (nd) Understanding Mortality Rates of Laying Hens in Cage-Free Egg Production Systems httpswwwhumanesocietyorgsitesdefaultfilesdocsmortality-cage-free-egg-production-systempdf
29 Zander K amp Feucht Y (2018) Consumersrsquo willingness to pay for sustainable seafood made in Europe Journal of international food amp agribusiness marketing 30(3) 251-275
30 Nicholson B (2006) Fish Diseases in Aquaculture The Fish Site httpsthefishsitecomarticlesfish-diseases-in-aquaculture
31 Abolofia J Asche F amp Wilen J E (2017) The cost of lice quantifying the impacts of parasitic sea lice on farmed salmon Marine Resource Economics 32(3) 329-349
32 httpsonlinelibrarywileycomdoi101111raq12299
33 httpswwwsciencedirectcomsciencearticleabspiiS0020751920300126
27 - Findings
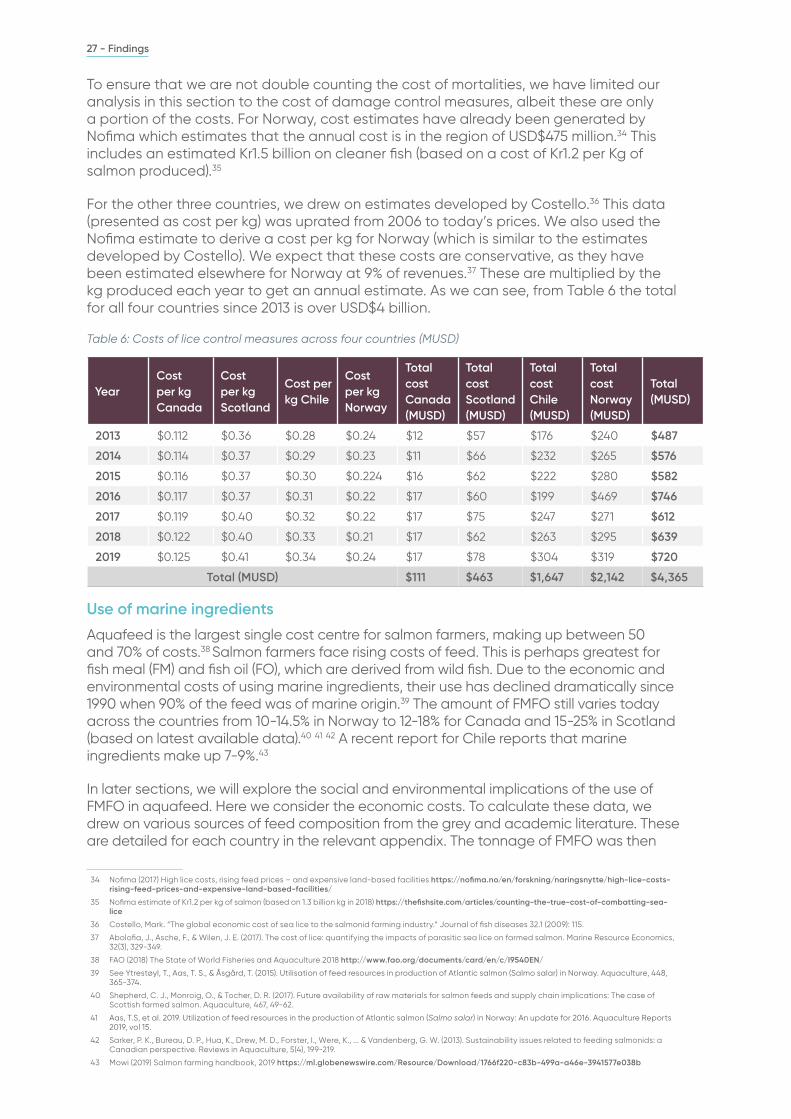
To ensure that we are not double counting the cost of mortalities we have limited our analysis in this section to the cost of damage control measures albeit these are only a portion of the costs For Norway cost estimates have already been generated by Nofima which estimates that the annual cost is in the region of USD$475 million34 This includes an estimated Kr15 billion on cleaner fish (based on a cost of Kr12 per Kg of salmon produced)35
For the other three countries we drew on estimates developed by Costello36 This data (presented as cost per kg) was uprated from 2006 to todayrsquos prices We also used the Nofima estimate to derive a cost per kg for Norway (which is similar to the estimates developed by Costello) We expect that these costs are conservative as they have been estimated elsewhere for Norway at 9 of revenues37 These are multiplied by the kg produced each year to get an annual estimate As we can see from Table 6 the total for all four countries since 2013 is over USD$4 billion
Table 6 Costs of lice control measures across four countries (MUSD)
YearCost per kg Canada
Cost per kg Scotland
Cost per kg Chile
Cost per kg Norway
Total cost Canada (MUSD)
Total cost Scotland (MUSD)
Total cost Chile (MUSD)
Total cost Norway (MUSD)
Total (MUSD)
2013 $0112 $036 $028 $024 $12 $57 $176 $240 $487
2014 $0114 $037 $029 $023 $11 $66 $232 $265 $576
2015 $0116 $037 $030 $0224 $16 $62 $222 $280 $582
2016 $0117 $037 $031 $022 $17 $60 $199 $469 $746
2017 $0119 $040 $032 $022 $17 $75 $247 $271 $612
2018 $0122 $040 $033 $021 $17 $62 $263 $295 $639
2019 $0125 $041 $034 $024 $17 $78 $304 $319 $720
Total (MUSD) $111 $463 $1647 $2142 $4365
Use of marine ingredients
Aquafeed is the largest single cost centre for salmon farmers making up between 50 and 70 of costs38 Salmon farmers face rising costs of feed This is perhaps greatest for fish meal (FM) and fish oil (FO) which are derived from wild fish Due to the economic and environmental costs of using marine ingredients their use has declined dramatically since 1990 when 90 of the feed was of marine origin39 The amount of FMFO still varies today across the countries from 10-145 in Norway to 12-18 for Canada and 15-25 in Scotland (based on latest available data)40 41 42 A recent report for Chile reports that marine ingredients make up 7-943
In later sections we will explore the social and environmental implications of the use of FMFO in aquafeed Here we consider the economic costs To calculate these data we drew on various sources of feed composition from the grey and academic literature These are detailed for each country in the relevant appendix The tonnage of FMFO was then
34 Nofima (2017) High lice costs rising feed prices ndash and expensive land-based facilities httpsnofimanoenforskningnaringsnyttehigh-lice-costs-rising-feed-prices-and-expensive-land-based-facilities
35 Nofima estimate of Kr12 per kg of salmon (based on 13 billion kg in 2018) httpsthefishsitecomarticlescounting-the-true-cost-of-combatting-sea-lice
36 Costello Mark ldquoThe global economic cost of sea lice to the salmonid farming industryrdquo Journal of fish diseases 321 (2009) 115
37 Abolofia J Asche F amp Wilen J E (2017) The cost of lice quantifying the impacts of parasitic sea lice on farmed salmon Marine Resource Economics 32(3) 329-349
38 FAO (2018) The State of World Fisheries and Aquaculture 2018 httpwwwfaoorgdocumentscardencI9540EN
39 See Ytrestoslashyl T Aas T S amp Aringsgaringrd T (2015) Utilisation of feed resources in production of Atlantic salmon (Salmo salar) in Norway Aquaculture 448 365-374
40 Shepherd C J Monroig O amp Tocher D R (2017) Future availability of raw materials for salmon feeds and supply chain implications The case of Scottish farmed salmon Aquaculture 467 49-62
41 Aas TS et al 2019 Utilization of feed resources in the production of Atlantic salmon (Salmo salar) in Norway An update for 2016 Aquaculture Reports 2019 vol 15
42 Sarker P K Bureau D P Hua K Drew M D Forster I Were K amp Vandenberg G W (2013) Sustainability issues related to feeding salmonids a Canadian perspective Reviews in Aquaculture 5(4) 199-219
43 Mowi (2019) Salmon farming handbook 2019 httpsmlglobenewswirecomResourceDownload1766f220-c83b-499a-a46e-3941577e038b
28 - Findings
multiplied by the price of each commodity in the given year44 The results are displayed in Table 7 As we can see the cumulative costs are over USD$8 billion over the period
Table 7 also shows that the costs of FMFO has remained relatively stable over the period This is in spite of the fact that the Fish inFish out (FIFO) ratio has decreased (especially in Chile) As demand for salmon has continued to rise the total amount of wild fish required has remained high It demonstrates that unless marine ingredients are largely replaced as feed the pressures on wild fish stocks will continue to increase in line with demand for salmon
Table 7 FMFO costs in four countries (MUSD)
2013 2014 2015 2016 2017 2018 2019 Total
Norway FM cost $435 $428 $403 $346 $342 $350 $369 $2676
Norway FO cost $335 $335 $324 $288 $249 $352 $270 $2156
Scotland FM cost $64 $70 $66 $62 $71 $58 $70 $466
Scotland FO cost $61 $63 $56 $51 $51 $57 $50 $393
Canada FM cost $23 $30 $36 $35 $37 $41 $40 $246
Canada FO cost $19 $26 $30 $29 $32 $35 $34 $208
Chile FM cost $219 $190 $162 $136 $110 $109 $108 $1037
Chile FO cost $205 $176 $151 $130 $102 $139 $101 $1007
Total cost $1366 $1321 $1232 $1081 $998 $1144 $1047 $8192
The reduction in the use of FMFO is driven partly by concern over impacts on wild fish stocks but also by increasing costs45 Most observers agree that as wild fish stocks come under increased pressure and as the aquaculture industry expands the costs of FMFO are set to rise 46 47A variety of alternate proteins have been identified to partially replace fishmeal and fish oil These include insect feed algae and bacterial protein Analyses of the price differential between alternative and traditional feeds finds that the former are currently more expensive 48 However there are promising results from trials on the use of these feeds One producer estimates that they could produce bacterial protein as an alternative feed for $1000 per tonne49 which is substantially less than the 2019 fish meal price of $1418 In addition significant investment is going into the alternative feed industries to scale production of these alternatives The expectation is that over time they will be price competitive and eventually cheaper than FMFO Insect meal has an added benefit of being generated by breaking down food waste into fats and proteins It is estimated that food waste leads to pound500 billion in lost value annually and Black Soldier Fly larvae can reduce food waste volume by up to 95 over a rapid two-week growing cycle50
In the short term the environmental benefits of using this highly promising insect meal in fish feed do not align with the economic interests of the aquaculture industry However in principle this positive externality could be incorporated into any social and environmental accounting of the aquaculture industry were these feeds to replace FMFO thereby (as will be discussed below) improving the social return from this industry
44 Commodity prices were taken from the World Bank httpswwwindexmundicomcommoditiescommodity=fish-mealampmonths=120ampcurrency=eur EUFMA
45 Davidson J Barrows F T Kenney P B Good C Schroyer K amp Summerfelt S T (2016) Effects of feeding a fishmeal-free versus a fishmeal-based diet on post-smolt Atlantic salmon Salmo salar performance water quality and waste production in recirculation aquaculture systems Aquacultural Engineering 74 38-51
46 Holland J (2017) Algae becoming increasingly relevant due to soaring fishmeal and fish oil demand prices httpswwwseafoodsourcecomnewssupply-tradealgae-becoming-increasingly-relevant-due-to-soaring-fishmeal-and-fish-oil-demand-prices
47 FAO (2020) Early closure of the Peruvian fishing season pushes prices up httpwwwfaoorgin-actionglobefishmarket-reportsresource-detailenc1268631
48 Arru B Furesi R Gasco L Madau F A amp Pulina P (2019) The introduction of insect meal into fish diet the first economic analysis on European sea bass farming Sustainability 11(6) 1697
49 Filou E (2020) Move over fishmeal Insects and bacteria emerge as alternative animal feeds httpsnewsmongabaycom202004move-over-fishmeal-insects-and-bacteria-emerge-as-alternative-animal-feeds
50 Cordis (2017) Investigating the commercial feasibility of a novel biological enhancement technology for creating a sustainable high value insect-derived protein supplement for the EU aquaculture market httpscordiseuropaeuprojectid775922reportingit
29 - Findings
Costs for top ten producers
Table 8 lists the top ten salmon producers by revenues in 201851
Table 8 Top ten salmon producing companies by revenue (2018) (MUSD)
Company name HQ Total revenues in 2018 (MUSD)
Mowi Norway $4502
Leroy Seafood Norway $2783
Salmar Norway $1395
Grieg Seafood Norway $922
Norway Royal Salmon Norway $625
Bakkafrost Faroe Islands $504
Blumar Chile $503
Australis Chile $361
Camanchaca Chile $332
Invermar Chile $230
Source Planet Tracker
The total revenues for these companies in 2018 were USD$12157 billion dollars In this section we calculate the expected losses to these companies stemming from two highly material costs mortalities and lice fighting technologies As discussed elsewhere lice outbreaks and mortalities from disease escapes predators and parasites are an indicator of both poor fish husbandry and sub-optimal fish welfare These estimates will demonstrate that they also have a direct economic cost
Using data from Planet Trackerrsquos Salmon Dashboard Database it is possible to calculate the number of mortalities and escapes by comparing the expected and actual harvest since 201052 These data are drawn from the annual reports of the companies in question Table 9 shows the results of these calculations As we can see there has been a difference of over half a million tonnes of salmon between actual and expected harvest over this period This equates to almost USD$37 billion as set out in Table 2 (based on the average of the international salmon prices since 2010) Our estimate for the top four producing countries is USD$155 billion (see earlier discussion) Given that these countries make up 96 of global production we might expect the cost to be closer to USD$775 billion There are two potential explanations First there were gaps for several years in the dashboard and due to the lack of transparencyagreed methodologies for reporting on mortalities there may well be other inconsistencies The second is that salmon farmers assume a minimum amount of mortalities per number of smolts released into pens and most likely incorporate this into their harvest calculations In this scenario the difference between expected and actual harvests is therefore a measure of excess deaths rather than total deaths As a result of both of these scenarios the volumes and costs reported here may well underestimate the total losses from mortalities
51 Planet Tracker (2020) Loch-ed profits httpsplanet-trackerorgtracker-programmesoceansseafoodloch-ed
52 Planet Tracker (2020) Dashboard The Salmon Aquaculture Industry httpsplanet-trackerorgdata-dashboardsoceanssalmon
30 - Findings
Table 9 Estimates of losses and associated costs (2010-2019)
Company Volume of losses (tonnes) Cost (MUSD)
Seafood Mowi 252521 $1719
Leroy Seafood 66975 $456
Grieg Seafood 64992 $442
Australis 34042 $231
Blumar 32236 $219
Norway Royal Salmon 28342 $193
Bakkafrost 21058 $143
Salmar 15929 $108
Camanchaca 11550 $78
Seafood Invermar 9256 $63
Total 536901 $3656
These data also allow us to consider the main reasons for mortalities These are displayed in Figure 1 As we can see almost half are unexplained and in almost 20 no reason is given Unexplained mortalities are those for which the cause of death has not been established unlike those where no reason has been stated in the report It is unclear as to why this proportion is so high given that research shows it should be possible to provide reasons in the vast majority of cases53 The other 30 of causes are split between algal blooms (9) disease (11) and sea lice (15) In addition over 2000 tonnes of escapes were reported which equates to 400000 adult salmon (assuming they are harvested at about 5kg)54
Figure 1 Main causes of mortalities
Unexplained
No reason
Sea lice
Disease
Algal blooms
46
19
15
11
9
The biggest known contributor to mortalities for these companies is therefore sea lice Substantial amounts of money are spent to combat sea lice including cleaner fish delousing and freshwater bathing They are also a major contributor to mortalities (from the process of delousing as well as the parasites themselves) and a bottleneck to further expansion due to regulations designed to minimise lice infestations55
In our country-level analyses we used data from Costello (2009) (see above) to estimate the costs of treating sea lice This study arrived at a global estimate of 6 of total revenues Using this estimate we can also estimate the costs of parasite control to the top salmon producers Table 10 shows the revenues for each company since 2013 along with the parasite control estimates Revenues have been adjusted for companies that produce commodities other than salmon (eg Blumar) All revenue data are extracted
53 Aunsmo A Bruheim T Sandberg M Skjerve E Romstad S amp Larssen R B (2008) Methods for investigating patterns of mortality and quantifying cause-specific mortality in sea-farmed Atlantic salmon Salmo salar Diseases of aquatic organisms 81(2) 99-107
54 Anon (2017) Salmon Farming Industry Handbook httpwwwmowicomglobalassetsinvestorshandbook2018-salmon-industry-handbookpdf
55 Kragesteen T J Simonsen K Visser A W amp Andersen K H (2019) Optimal salmon lice treatment threshold and tragedy of the commons in salmon farm networks Aquaculture 512 734329
31 - Findings
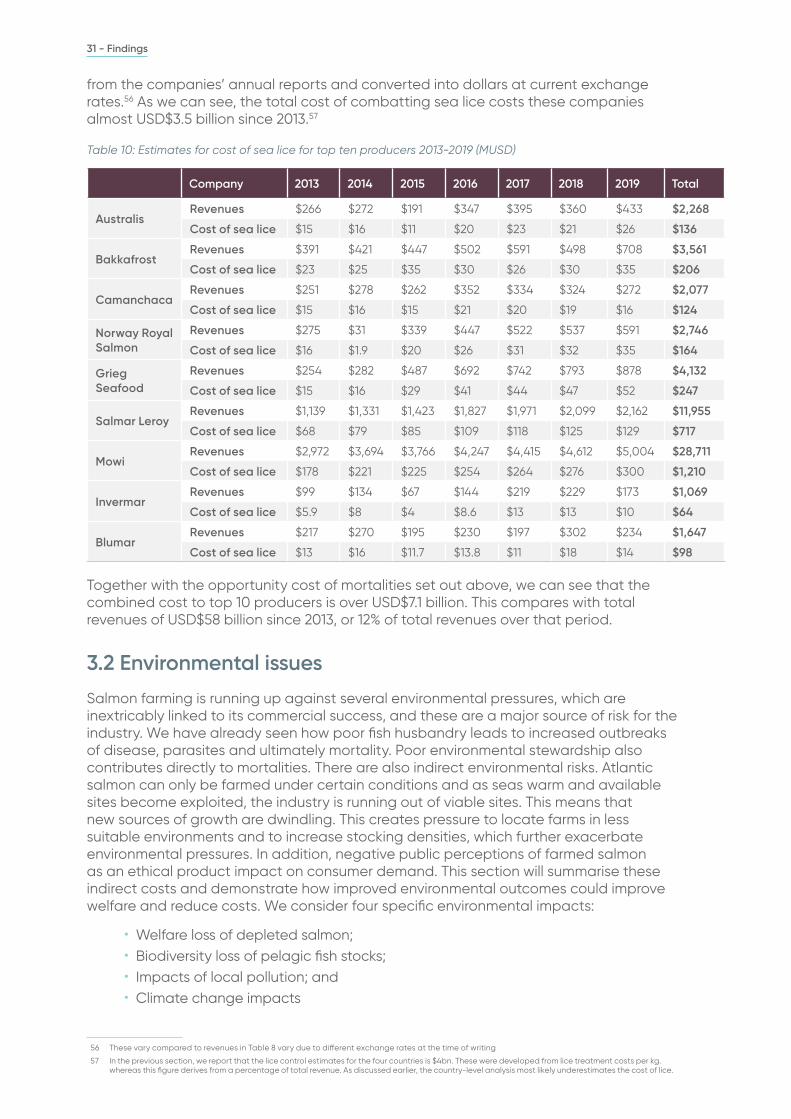
from the companiesrsquo annual reports and converted into dollars at current exchange rates56 As we can see the total cost of combatting sea lice costs these companies almost USD$35 billion since 201357
Table 10 Estimates for cost of sea lice for top ten producers 2013-2019 (MUSD)
Company 2013 2014 2015 2016 2017 2018 2019 Total
AustralisRevenues $266 $272 $191 $347 $395 $360 $433 $2268
Cost of sea lice $15 $16 $11 $20 $23 $21 $26 $136
BakkafrostRevenues $391 $421 $447 $502 $591 $498 $708 $3561
Cost of sea lice $23 $25 $35 $30 $26 $30 $35 $206
CamanchacaRevenues $251 $278 $262 $352 $334 $324 $272 $2077
Cost of sea lice $15 $16 $15 $21 $20 $19 $16 $124
Norway Royal Salmon
Revenues $275 $31 $339 $447 $522 $537 $591 $2746
Cost of sea lice $16 $19 $20 $26 $31 $32 $35 $164
Grieg Seafood
Revenues $254 $282 $487 $692 $742 $793 $878 $4132
Cost of sea lice $15 $16 $29 $41 $44 $47 $52 $247
Salmar LeroyRevenues $1139 $1331 $1423 $1827 $1971 $2099 $2162 $11955
Cost of sea lice $68 $79 $85 $109 $118 $125 $129 $717
MowiRevenues $2972 $3694 $3766 $4247 $4415 $4612 $5004 $28711
Cost of sea lice $178 $221 $225 $254 $264 $276 $300 $1210
InvermarRevenues $99 $134 $67 $144 $219 $229 $173 $1069
Cost of sea lice $59 $8 $4 $86 $13 $13 $10 $64
BlumarRevenues $217 $270 $195 $230 $197 $302 $234 $1647
Cost of sea lice $13 $16 $117 $138 $11 $18 $14 $98
Together with the opportunity cost of mortalities set out above we can see that the combined cost to top 10 producers is over USD$71 billion This compares with total revenues of USD$58 billion since 2013 or 12 of total revenues over that period
32 Environmental issues
Salmon farming is running up against several environmental pressures which are inextricably linked to its commercial success and these are a major source of risk for the industry We have already seen how poor fish husbandry leads to increased outbreaks of disease parasites and ultimately mortality Poor environmental stewardship also contributes directly to mortalities There are also indirect environmental risks Atlantic salmon can only be farmed under certain conditions and as seas warm and available sites become exploited the industry is running out of viable sites This means that new sources of growth are dwindling This creates pressure to locate farms in less suitable environments and to increase stocking densities which further exacerbate environmental pressures In addition negative public perceptions of farmed salmon as an ethical product impact on consumer demand This section will summarise these indirect costs and demonstrate how improved environmental outcomes could improve welfare and reduce costs We consider four specific environmental impacts
bull Welfare loss of depleted salmonbull Biodiversity loss of pelagic fish stocksbull Impacts of local pollution andbull Climate change impacts
56 These vary compared to revenues in Table 8 vary due to different exchange rates at the time of writing
57 In the previous section we report that the lice control estimates for the four countries is $4bn These were developed from lice treatment costs per kg whereas this figure derives from a percentage of total revenue As discussed earlier the country-level analysis most likely underestimates the cost of lice
32 - Findings
Welfare loss of depleted salmon
Salmon farming impacts on fish stocks in three ways Two of these have already been touched on the use of pelagic fish in FMFO and the use of cleaner fish in parasite control The third is the impact on wild salmon and trout stocks58 A recent study found that the presence of a salmon farm can lead to an average of 12-29 fewer adult wild salmon in the local area59 Salmon farms create risks to wild fish in several ways
bull Hybridisation - This is where escaped farmed salmon breed with the wild populations reducing their ability to survive in the wild Research suggests that these effects are likely to be passed on to future generations60
bull Inducing mortality by spreading lice and diseasebull Local pollution
There has been serious concern about the status of wild Atlantic salmon stocks for many years now The numbers of returning salmon have been plummeting61 and reports from 2020 show that they are now at an historic low62 Whilst progress has been made in managing the interactions between farmed and wild salmon serious risks remain and large-scale escapes are still regularly reported from salmon farms with Chile and Norway accounting for 60 of the largest escapes63 In this section we seek to value the loss of wild salmon stocks and estimate the damage that is attributable to salmon farms
In a review of the literature on the social economic and cultural value of Atlantic salmon Myrvold et al argue that this iconic fish provides humans with a range of values benefits and gifts64 The review identified 41 studies of the different values of wild Atlantic salmon published between 2009 and 2019 Although these are dominated by economic studies relative (for example) to studies of cultural value it is nonetheless clear that the salmon has played - and continues to play - a role in the social environmental and cultural life of communities along the Atlantic seaboard The loss of habitat experienced by wild salmon - and driven in part by the expansion of aquaculture - is therefore something we would expect the public to be concerned about This is confirmed by several contingent valuation studies on willingness to pay for salmon conservation In a survey of the Canadian public Pinfold65 demonstrated over 80 support for investments in salmon restoration in the range of $450 to $1250 per tax-paying household translating into a total economic value of $57 million In a US study of the non-market benefits of the Pacific Coho salmon the authors66 found that a programme aimed at increasing numbers of returning salmon can generate sizable benefits of up to $518 million per year for an extra 100000 returning fish even if the species is not officially declared recovered It also found that the public attaches additional benefits to achieving conservation goals quickly Studies such as these have prompted NASCO67 to claim that non-use values such as existence and bequest values may now substantially exceed values associated with recreational angling which themselves exceed the commercial value of salmon as food
58 It has been noted that mortality of sea trout is likely to be higher than in wild salmon because they usually remain in coastal waters where fish farms are situated (see Thorstad E B amp Finstad B (2018) Impacts of salmon lice emanating from salmon farms on wild Atlantic salmon and sea trout)
59 Thorstad E B amp Finstad B (2018) Impacts of salmon lice emanating from salmon farms on wild Atlantic salmon and sea trout
60 Hindar K Fleming I A McGinnity P amp Diserud O (2006) Genetic and ecological effects of salmon farming on wild salmon modelling from experimental results ICES Journal of Marine Science 63(7) 1234-1247
61 Nasco (2020) State of North Atlantic Salmon httpsnascointwp-contentuploads202005SoS-final-onlinepdf
62 Atlantic Salmon Federation (2020) 2020 State of Wild Atlantic Salmon Report httpswwwasfcaassetsfilesasf-2020-state-of-population-v2pdf
63 Navarro L (2019) Here are the largest recorded farmed salmon escapes in history Intrafish httpswwwintrafishcomaquaculturehere-are-the-largest-recorded-farmed-atlantic-salmon-escapes-in-history2-1-388082
64 Myrvold K M Mawle G W Andersen O amp Aas Oslash (2019) The Social Economic and Cultural values of wild Atlantic salmon A review of the literature for the period 2009-2019 and an assessment of changes in values
65 Pinfold G (2011) Economic Value of Wild Atlantic Salmon Prepared by Gardner Pinfold Accessed online httpswwwasfcaassetsfilesgardner-pinfold-value-wild-salmonpdf
66 Lewis D J Dundas S J Kling D M Lew D K amp Hacker S D (2019) The non-market benefits of early and partial gains in managing threatened salmon PloS one 14(8) e0220260
67 Nasco (2020) The value of salmon Accessed online httpwwwnascointvalue_changeshtml
33 - Findings
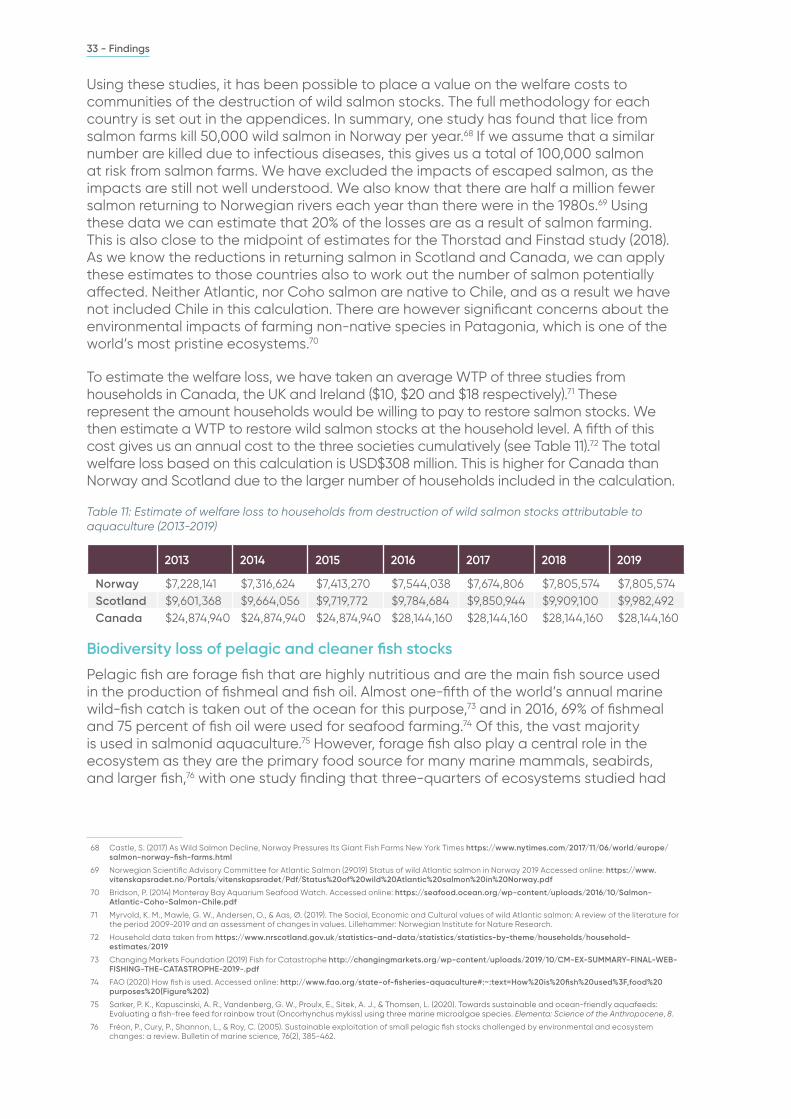
Using these studies it has been possible to place a value on the welfare costs to communities of the destruction of wild salmon stocks The full methodology for each country is set out in the appendices In summary one study has found that lice from salmon farms kill 50000 wild salmon in Norway per year68 If we assume that a similar number are killed due to infectious diseases this gives us a total of 100000 salmon at risk from salmon farms We have excluded the impacts of escaped salmon as the impacts are still not well understood We also know that there are half a million fewer salmon returning to Norwegian rivers each year than there were in the 1980s69 Using these data we can estimate that 20 of the losses are as a result of salmon farming This is also close to the midpoint of estimates for the Thorstad and Finstad study (2018) As we know the reductions in returning salmon in Scotland and Canada we can apply these estimates to those countries also to work out the number of salmon potentially affected Neither Atlantic nor Coho salmon are native to Chile and as a result we have not included Chile in this calculation There are however significant concerns about the environmental impacts of farming non-native species in Patagonia which is one of the worldrsquos most pristine ecosystems70
To estimate the welfare loss we have taken an average WTP of three studies from households in Canada the UK and Ireland ($10 $20 and $18 respectively)71 These represent the amount households would be willing to pay to restore salmon stocks We then estimate a WTP to restore wild salmon stocks at the household level A fifth of this cost gives us an annual cost to the three societies cumulatively (see Table 11)72 The total welfare loss based on this calculation is USD$308 million This is higher for Canada than Norway and Scotland due to the larger number of households included in the calculation
Table 11 Estimate of welfare loss to households from destruction of wild salmon stocks attributable to aquaculture (2013-2019)
2013 2014 2015 2016 2017 2018 2019
Norway $7228141 $7316624 $7413270 $7544038 $7674806 $7805574 $7805574Scotland $9601368 $9664056 $9719772 $9784684 $9850944 $9909100 $9982492Canada $24874940 $24874940 $24874940 $28144160 $28144160 $28144160 $28144160
Biodiversity loss of pelagic and cleaner fish stocks
Pelagic fish are forage fish that are highly nutritious and are the main fish source used in the production of fishmeal and fish oil Almost one-fifth of the worldrsquos annual marine wild-fish catch is taken out of the ocean for this purpose73 and in 2016 69 of fishmeal and 75 percent of fish oil were used for seafood farming74 Of this the vast majority is used in salmonid aquaculture75 However forage fish also play a central role in the ecosystem as they are the primary food source for many marine mammals seabirds and larger fish76 with one study finding that three-quarters of ecosystems studied had
68 Castle S (2017) As Wild Salmon Decline Norway Pressures Its Giant Fish Farms New York Times httpswwwnytimescom20171106worldeuropesalmon-norway-fish-farmshtml
69 Norwegian Scientific Advisory Committee for Atlantic Salmon (29019) Status of wild Atlantic salmon in Norway 2019 Accessed online httpswwwvitenskapsradetnoPortalsvitenskapsradetPdfStatus20of20wild20Atlantic20salmon20in20Norwaypdf
70 Bridson P (2014) Monteray Bay Aquarium Seafood Watch Accessed online httpsseafoodoceanorgwp-contentuploads201610Salmon-Atlantic-Coho-Salmon-Chilepdf
71 Myrvold K M Mawle G W Andersen O amp Aas Oslash (2019) The Social Economic and Cultural values of wild Atlantic salmon A review of the literature for the period 2009-2019 and an assessment of changes in values Lillehammer Norwegian Institute for Nature Research
72 Household data taken from httpswwwnrscotlandgovukstatistics-and-datastatisticsstatistics-by-themehouseholdshousehold-estimates2019
73 Changing Markets Foundation (2019) Fish for Catastrophe httpchangingmarketsorgwp-contentuploads201910CM-EX-SUMMARY-FINAL-WEB-FISHING-THE-CATASTROPHE-2019-pdf
74 FAO (2020) How fish is used Accessed online httpwwwfaoorgstate-of-fisheries-aquaculture~text=How20is20fish20used3Ffood20purposes20(Figure202)
75 Sarker P K Kapuscinski A R Vandenberg G W Proulx E Sitek A J amp Thomsen L (2020) Towards sustainable and ocean-friendly aquafeeds Evaluating a fish-free feed for rainbow trout (Oncorhynchus mykiss) using three marine microalgae species Elementa Science of the Anthropocene 8
76 Freacuteon P Cury P Shannon L amp Roy C (2005) Sustainable exploitation of small pelagic fish stocks challenged by environmental and ecosystem changes a review Bulletin of marine science 76(2) 385-462
34 - Findings
at least one highly andor extremely dependent predator77 Although these fish may have historically been undervalued this low commercial price has failed to take account of their wider economic and environmental value Forage fish comprise 35-30 of global fish landings78 (FAO 2015 data from 2011 to 2013) with an annual catch value of $56 billion USD79 (compared with the catch value of $877 billion USD for all marine fisheries80
Forage fish provide a range of ecosystem services that are external to the market value of the fish therefore Measuring and valuing these benefits holistically is challenging given the interconnected and complex nature of the marine ecosystem One proxy that we can consider is the estimate for the indirect value of forage fish (ie its contribution to the value of the commercial catch of predators which is estimated to be worth $113 billion) If we assume that this is based on global landings of about 515 million tonnes81
this gives us a figure of $219 per tonne It is possible therefore to place a proxy value on the ecosystem loss of the total use of forage fish in each of the countries included in this analysis These calculations are set out in Table 12 As we can see the total indirect cost of the use of forage fish in salmon farming is almost USD$18 billion
Table 12 Estimate of indirect cost of use of forage fish in salmon farming 2013-2019
2013 2014 2015 2016 2017 2018 2019
Canada $16676986 $14749795 $20827399 $21100028 $20592863 $21042291 $20621445
Scotland $90328324 $100740000 $95674860 $91735307 $106765828 $87809824 $107211560
Norway $97333014 $100206774 $98997243 $89165197 $89362881 $92662362 $98105070
Chile euro58139715 euro52357001 euro46574288 euro40791574 euro35008861 euro35008861 euro35008861
These figures only considered ex-vessel prices of predator fish dependent on forage fish However this is very likely an underestimate of the full economic benefits of predator fish (eg downstream benefits such as the supply chains of processors distributors and end consumers)82 It also most likely underestimates wider ecosystem benefits to nonmarket predators such as seabirds seals and so on As well as the existence value of these species discussed elsewhere there can be additional economic benefits such as ecotourism revenue (whale watching bird watching etc)83 As pointed out by Koehn et al focusing on the costs for fisheries is only part of the cost benefit analysis84 Froehlich et al assess whether FMFO use can circumvent forage fish limits (eg through greater consistent inclusion of fish byproducts) They find that this is possible by the middle of the 21st century However global shifts towards more pescatarian diets will make this impossible and increase the requirement for long-term nutrient equivalent feed sources85
The final wild fish impact is on cleaner fish These are fish with a specialist feeding strategy which involves removing lice from infested salmon There are two main species used lumpfish and wrasse These fish had limited commercial value until their function as cleaner fish in captivity was discovered and their use has increased dramatically in the last decade as a result of salmonrsquos evolving resistance to pharmaceutical
77 Pikitch E Boersma PD Boyd IL Conover DO Cury P Essington T Heppell SS Houde ED Mangel M Pauly D Plagaacutenyi Eacute Sainsbury K and Steneck RS 2012 Little Fish Big Impact Managing a Crucial Link in Ocean Food Webs Lenfest Ocean Program Washington DC 108 pp
78 FAO (Food and Agriculture Organization of the United Nations) (2015) The state of world fisheries and aquaculture Opportunities and challenges
79 Pikitch E K Rountos K J Essington T E Santora C Pauly D Watson R amp Cury P (2014) The global contribution of forage fish to marine fisheries and ecosystems Fish and Fisheries 15(1) 43-64
80 Sumaila U R Cheung W Dyck A Gueye K Huang L Lam V amp Zeller D (2012) Benefits of rebuilding global marine fisheries outweigh costs PloS one 7(7) e40542
81 Ibid
82 Christensen V Steenbeek J amp Failler P (2011) A combined ecosystem and value chain modelling approach for evaluating societal cost and benefit of fishing Ecological Modelling 222(3) 857ndash864
83 Koehn L E Essington T E Marshall K N Sydeman W J Szoboszlai A I amp Thayer J A (2017) Trade-offs between forage fish fisheries and their predators in the California Current ICES Journal of Marine Science 74(9) 2448-2458
84 Ibid
85 Froehlich H E Jacobsen N S Essington T E Clavelle T amp Halpern B S (2018) Avoiding the ecological limits of forage fish for fed aquaculture Nature Sustainability 1(6) 298-303
35 - Findings
treatments86 In order to prevent disease transmission cleaner fish are culled at the end of the production cycle meaning that new fish are needed when the next production cycle begins87 The capture of wild fish has led to stock depletion88 and farming of cleaner fish is now underway However as with salmon there is evidence of farmed cleaner fish escaping and hybridising with local populations89 Compared with salmon there is limited research on cleaner fish their biodiversity impacts and welfare are mentioned in passing but not widely studied The main economic value of lumpfish has been for their roe but this is a niche and limited market Several wrasse species are commonly used as display fish due to their vibrant colours It is also interesting to note as Erkinharju et al point out90 that a species of wrasse has recently been reported as the first fish to seemingly pass the mirror mark test a behavioural technique used to measure and determine whether an animal possesses self-awareness Although the study has received criticism such findings may have implications for fish welfare and subsequently the use of cleaner fish in aquaculture Despite this due to the uncertainty around potential impacts it has not been possible to quantify any cleaner fish costs in this study However more research is required on the implications of use of both wild and farmed cleaner fish especially in light of survey findings showing that fish farmers question whether cleaner fish are an effective delousing method that actually results in fewer delousing operations91
Impacts of local pollution
Aquaculture activities are an interconnected part of the ecosystem in which they exist and salmon farms make use of lsquofreersquo coastal ecosystem services such as fresh clean water appropriate temperatures nutrient levels and so on92 They also contribute to their deterioration however as a result of local pollution impacts Pollutants from salmon aquaculture consist of uneaten feed and faeces which are directly discharged into the marine environment These result in eutrophication from the accumulation of nutrients like phosphorous and nitrogen or what are known as algal blooms These can lead to large mortality events and the economic costs of these has been at least partly included above
For the environmental impacts there are two available methods to estimate their costs the pollution abatement cost (PAC) consumer WTP for higher environmental standards Data exist on the former for Norway and the latter for Canada and Scotland However to increase consistency between the countries we have used the PAC and applied the Norwegian figure to the other three countries
The pollution abatement cost (PAC) measures the amount that would be required to preserve or restore a unit of the environmental good in question 93 Unless the full PAC is accounted for salmon farms are lsquofree ridingrsquo on free environmental services Liu et al have found the PAC for Norway to be 35 of total salmon production94 Although a little out of date we know that algal blooms are a continuing - and perhaps worsening - problem for Norwegian aquaculture (in 2019 8 million salmon were killed in an algal
86 Faust E Halvorsen K T Andersen P Knutsen H amp Andreacute C (2018) Cleaner fish escape salmon farms and hybridize with local wrasse populations Royal Society Open Science 5(3) 171752
87 Erkinharju T Dalmo R A Hansen M amp Seternes T (2020) Cleaner fish in aquaculture review on diseases and vaccination Reviews in Aquaculture
88 Kennedy J Durif C M Florin A B Freacutechet A Gauthier J Huumlssy K amp Hedeholm R B (2019) A brief history of lumpfishing assessment and management across the North Atlantic ICES Journal of Marine Science 76(1) 181-191
89 Faust E Halvorsen K T Andersen P Knutsen H amp Andreacute C (2018) Cleaner fish escape salmon farms and hybridize with local wrasse populations Royal Society Open Science 5(3) 171752
90 Erkinharju T Dalmo R A Hansen M amp Seternes T (2020) Cleaner fish in aquaculture review on diseases and vaccination Reviews in Aquaculture
91 The Norwegian Institute of Marine Research is also concerned about the methodrsquos lack of documented effectiveness httpsnorwegianscitechnewscom202004cleaner-fish-being-sacrificed-in-the-fight-against-salmon-lice
92 Custoacutedio M Villasante S Calado R amp Lilleboslash A I (2020) Valuation of Ecosystem Services to promote sustainable aquaculture practices Reviews in Aquaculture 12(1) 392-405
93 Nikitina E (2019) Opportunity cost of environmental conservation in the presence of externalities Application to the farmed and wild salmon trade-off in Norway Environmental and resource economics 73(2) 679-696
94 Liu Y amp Sumaila U R (2010) Estimating pollution abatement costs of salmon aquaculture a joint production approach Land Economics 86(3) 569-584
36 - Findings
bloom in just a few days)95 Due to the lack of comparable data for the other countries we have also applied this estimate As with Norway the evidence would suggest that algal blooms continue to be a problem for the other three countries In addition environmental standards are at least as high (and in many cases higher) in Norway than the other countries Separate calculations on WTP for higher environmental standards have been calculated for Scotland and Canada and are provided in the appendices Table 13 provides details of the PACs for each country
Table 13 Pollution Abatement Costs for four countries (MUSD)
2013 2014 2015 2016 2017 2018 2019 Total
Norway $274 $290 $242 $533 $322 $337 $328 $2328
Scotland $37 $41 $31 $40 $49 $41 $46 $288
Canada $22 $19 $22 $30 $31 $32 $29 $189
Chile $149 $185 $136 $160 $202 $213 $219 $1268
As we can see from Table 13 the estimate for cumulative local pollution costs across the four countries is over USD$4 billion
Climate change impacts
Although aquaculture is often positioned as a sustainable alternative to other forms of farming there are substantial CO2 emissions from air freight and aquafeed which are not usually accounted for in environmental reports Whilst the farmgate emissions from aquaculture are low relative to agriculture it is argued that these estimates underestimate the true carbon cost96 Life cycle analysis provides a more complete estimate of carbon emissions because it includes impacts throughout the supply chain Life cycle analysis of carbon emissions across producer countries shows that Norway has the lowest impacts per unit production whereas impacts are consistently highest in the UK due to the embedded carbon in the feedstuffs used97 Several studies also show that feed provision is the single most important contributor to resource use and emissions98
Sintef have estimated the full CO2 emissions for Norway including previously uncounted impacts These include the impacts of the use of soy in fish feed and its impact on deforestation in Brazil (all of Norwayrsquos soy is sourced in Brazil) It also takes account of air freight in the distribution of salmon which is increasing due to the increased importance of China as a consumer of Norwegian salmon The total carbon emissions produced by the sector are 9685 million tonnes (or about 8 kg of carbon per kg of salmon) There are various methods for costing carbon emissions and a wide literature on the appropriate valuations to use If we conservatively use the carbon tax applied by Norway to fishing to this figure ($27 USD per tonne) we get an annual value of $255 million per year99 However this value is substantially higher when a social cost of carbon is applied Table 14 shows the emissions costs associated with each of the four countries based on the Norwegian LCA data and using the UKrsquos Department for Climate Change estimate of USD$72 per tonne100 This gives a total cumulative emissions cost of USD$83 billion An important caveat here is that these estimates are certainly lower than emissions from alternative protein sources such as land-based animals However the purpose of the
95 Magra I (2019) Millions of Salmon in Norway Killed by Algae Bloom New York Times Accessed online httpswwwnytimescom20190523worldeuropesalmon-norway-algae-bloomhtml
96 Newton R W amp Little D C (2018) Mapping the impacts of farmed Scottish salmon from a life cycle perspective The International Journal of Life Cycle Assessment 23(5) 1018-1029
97 Pelletier N Tyedmers P Sonesson U Scholz A Ziegler F Flysjo A amp Silverman H (2009) Not all salmon are created equal life cycle assessment (LCA) of global salmon farming systems
98 Ibid
99 Bruvoll A and Dalen H (2009) Pricing of CO2 emissions in Norway Accessed online httpswwwssbnoaenglishpublikasjonerpdfdoc_200916_endoc_200916_enpdf
100 Defra (2006) The social cost of carbon (SCC) review httpsassetspublishingservicegovukgovernmentuploadssystemuploadsattachment_datafile243816aeat-scc-reportpdf
37 - Findings
section is to highlight that emissions from this industry are higher than the industry tends to claim
Table 14 Cumulative costs of CO2 emissions in salmon farming (MUSD)
2013 2014 2015 2016 2017 2018 2019
Norway $626 $674 $699 $1144 $663 $687 $728
Scotland $86 $96 $91 $87 $101 $83 $102
Canada $52 $46 $65 $66 $64 $66 $64
Chile $264 $345 $326 $285 $329 $354 $376
33 Social issues
In this section we consider two of the main social concerns relating to salmon farming
bull Salmon welfare and bull Impacts of diverting pelagic fish away from direct human consumption for use
in FMFO
Salmon welfare
Salmon welfare is a result among other things of the fishrsquos health environment farming methods and routines and is a direct function of factors such as stocking density prevalence of parasites and disease and water quality101 Given that these factors also determine profitability fish welfare is arguably negatively correlated with profitability in the short-term However there is also a long run economic argument to be made There is plenty of evidence that poor fish husbandry increases mortality and the need for costly disease and lice fighting technologies102 Moreover there are strong and growing consumer preferences for ethically produced seafood especially in Europe103 In Norway for example surveys have found that animal welfare is more important to consumers than other ethical consideration such as organic local production and environmental standards104 Although it may not be as high on the agenda as land-based animal welfare a Eurobarometer survey from 2016105 found that two-thirds of adults across nine European markets agree that fish are sentient and that fish feel negative emotions In addition animal husbandry issues are gaining weight in consumersrsquo food choices including preferences for higher fish welfare106 although this tends to be higher for consumers who understand sustainability issues consume seafood regularly and have higher incomes
These consumer preferences can be incorporated into an economic analysis using contingent valuation studies The calculation applied to Norway Scotland and Canada was based on an estimate that the average European consumer was willing to pay a price premium of 14 for salmon with higher welfare standards 107 In Table 4 we apply this to EuropeanNorwegianUK consumers of Norwegian and Scottish salmon and to domestic consumers of Canadian salmon (15) This is plausible as there is plenty of
101 Stien L H Toslashrud B Gismervik K Lien M E Medaas C Osmundsen T amp Stoslashrkersen K V (2020) Governing the welfare of Norwegian farmed salmon Three conflict cases Marine Policy 117 103969
102 Norwegian Veterinary Institute (2018) Fish Health Report 2018 httpswwwvetinstnorapporter-og-publikasjonerrapporter2019fish-health-report-2018
103 Zander K amp Feucht Y (2018) Consumersrsquo willingness to pay for sustainable seafood made in Europe Journal of international food amp agribusiness marketing 30(3) 251-275
104 Salmon Group (2020) Fish welfare in fish farming httpssalmongroupnowp-contentuploads202009SG_Fiskevelferd_ENG_Digitalpdf
105 Savanta ComRes Eurogroup for Animals CIWF Fish Welfare Survey Accessed online httpscomresglobalcompollseurogroup-for-animals-ciwf-fish-welfare-survey
106 Inter alia Kalshoven K amp Meijboom F L (2013) Sustainability at the crossroads of fish consumption and production ethical dilemmas of fish buyers at retail organizations in The Netherlands Journal of agricultural and environmental ethics 26(1) 101-117 Kupsala S Jokinen P amp Vinnari M (2013) Who cares about farmed fish Citizen perceptions of the welfare and the mental abilities of fish Journal of Agricultural and Environmental Ethics 26(1) 119-135 Pieniak Z Vanhonacker F amp Verbeke W (2013) Consumer knowledge and use of information about fish and aquaculture Food policy 40 25-30
107 Zander K amp Feucht Y (2018) Consumersrsquo willingness to pay for sustainable seafood made in Europe Journal of international food amp agribusiness marketing 30(3) 251-275
38 - Findings
evidence that Canadians care about animal welfare and animal welfare standards are somewhat similar in Canada and the EU We have excluded salmon consumed outside of the EUNorwayUKCanada These results are displayed in Table 15 The total cost across the four countries from poor fish welfare is USD$467 billion
Table 15 Salmon welfare premium (MUSD)
2013 2014 2015 2016 2017 2018 2019
Norway $271 $374 $434 $629 $603 $649 $713
Scotland $117 $130 $107 $114 $149 $136 $145
Canada $9 $9 $10 $16 $16 $17 $17
This proxy value demonstrates that fish welfare is material to consumers Although the valuation approach could potentially be criticised as being anthropomorphic valuation is intrinsically a human endeavour meaning that value can only be ascribed to humans hence the emphasis on human perception of welfare in this instance
There are also concerns over the welfare of wild wrasse on fish farms Wrasse require shelters for protection when at rest and from tides and currents supplementary feeding when lice numbers are low and care during farm operations such as grading and moving salmon and net cleaning108 However mortality rates are very high For example 23 million wild wrasse were caught in Norway in 2018 and 40 of these died in the same year Due to a lack of data on welfare impacts it was not possible to include a valuation of cleaner fish welfare in the model
Impacts of diverting pelagic fish away from direct human consumption (DHC)
This section considers the impacts of diverting forage fish away from DHC in low and middle-income countries for use in the FMFO industry in large part to feed European aquaculture In this context the two most important regions for pelagic fish are West Africa and the Pacific coast of South America most notably Peru
Peru is the top exporter of fishmeal and fish oil worldwide and landings of anchoveta are used nearly exclusively for FMFO production despite a proactive national food policy aimed at favouring their direct human consumption in an effort to tackle Perursquos substantial undernutrition problem109 There has also been a long-term decline in anchoveta stocks110 As with sardine these support a wide variety of species This includes other fish that are then used for DHC Research quoted by the Changing Markets Foundation shows that the decline of fish stocks now leads to Peruvians eating more frozen imported fish111 Unfortunately there are limited data quantitative data available on Peru to incorporate into this analysis112
108 Treasurer J amp Feledi T (2014) The Physical Condition and Welfare of Five Species of Wild-caught Wrasse Stocked under Aquaculture Conditions and when Stocked in Atlantic Salmon Salmo salar Production Cages Journal of the World Aquaculture Society 45(2) 213-219
109 Freacuteon P Sueiro J C Iriarte F Evar O F M Landa Y Mittaine J F amp Bouchon M (2014) Harvesting for food versus feed a review of Peruvian fisheries in a global context Reviews in Fish Biology and Fisheries 24(1) 381-398
110 Tegel S (2013) Peru Where have all the anchovies gone Accessed online httpswwwpriorgstories2013-04-14peru-where-have-all-anchovies-gone
111 Changing Markets Foundation (2019) Until the Seas run Dry httpchangingmarketsorgwp-contentuploads201904REPORT-WEB-UNTILL-THE-SEAS-DRYpdf
112 For more information on anchoveta and FMFO in Peru see Changing Marketrsquos Foundation What Lies Beneath report httpchangingmarketsorgwp-contentuploads202011What_Lies_Beneath_full_reportpdf
39 - Findings
Another growing exporter of FMFO are the countries along the West African coast Senegal Mauritania and the Gambia 15 percent of Africarsquos catches are reported as destined for non-food uses such as FMFO and most of this comes from West Africa113 where it has been identified as a future growth area The biodiversity losses from use of fish in aquafeed have been discussed above Here we consider the socio-economic cost for local fishing communities The main pelagic species fished in West Africa is sardinella and Cashion et al argue that 90 of this food is food-grade or prime food-grade fish114 This is important in three ways First West African countries have significant food security issues (almost 30 of under-5s experience stunting as a result of under-nutrition)115 Fish are an important provider of nutrients and animal protein and it is argued that current and potentially increasing use for non-DHC may represent a challenge to global food security116
Second the growth of the FMFO industry may lead to net economic losses The companies are largely foreign-owned and funded by foreign investment117 Production has a shorter local supply chain than the direct selling of fish locallyregionally and other forms of processing such as canning or freezing 118 This means that a smaller proportion of the value added from the fish is being captured by local people This decreases the stocks available for local fishermen and the subsequent jobs that are created from the building of boats through to the preparing of meals using the fish such as smoking at local markets Many of these roles employ women who may have few employment opportunities In a review of the contribution of fisheries to livelihoods and nutrition Beneacute et al conclude that the evidence convincingly shows that womenrsquos roles in capture fisheries and their contribution either go unrecorded or are undervalued and remain largely invisible in national statistics
Finally demand for small pelagics increases the pressure on fish stocks in the region These areas are already heavily overfished largely through the access that European and Chinese trawlers have to the waters119 The current rates of extraction are found to be driving several species towards extinction120 This is further placing the livelihoods of those that depend on fishing at risk leading to increasing poverty and forced migration121 122 The most threatened species include forage fish such as sardinella and the UN estimates that declining availability could seriously undermine food security across the region123
113 Wijkstroumlm U N (2009) The use of wild fish as aquaculture feed and its effects on income and food for the poor and the undernourished In Fish as feed inputs for aquaculture practices sustainability and implications (Vol 518 pp 371-407) FAO Rome
114 Cashion T Le Manach F Zeller D amp Pauly D (2017) Most fish destined for fishmeal production are food-grade fish Fish and Fisheries 18(5) 837-844
115 Global Nutritional Report (2020) Western Africa Nutrition Profile httpsglobalnutritionreportorgresources nutrition-profilesafricawestern-africa~text=The20Western20Africa20subregion20experiencesthe20global20average20of2021925
116 Beacuteneacute C Arthur R Norbury H Allison E H Beveridge M Bush S amp Thilsted S H (2016) Contribution of fisheries and aquaculture to food security and poverty reduction assessing the current evidence World Development 79 177-196
117 Greenpeace (2019) A Waste of Fish httpswwwgreenpeaceorginternationalpublication22489waste-of-fish-report-west-africa
118 Wijkstroumlm U N (2009) The use of wild fish as aquaculture feed and its effects on income and food for the poor and the undernourished In Fish as feed inputs for aquaculture practices sustainability and implications (Vol 518 pp 371-407) FAO Rome
119 Munshi N (2020) The Fight for West Africarsquos Fish httpswwwftcomcontent0eb523ca-5d41-11ea-8033-fa40a0d65a98
120 httpswwwodiorgsitesodiorgukfilesresource-documents10665pdf
121 Joumlnsson J H amp Kamali M (2012) Fishing for development A question for social work International Social Work 55(4) 504-521
122 Alder J amp Sumaila U R (2004) Western Africa a fish basket of Europe past and present The Journal of Environment amp Development 13(2) 156-178
123 httpswwwiucnorgnewssecretariat201701overfishing-threatens-food-security-africaE28099s-western-and-central-coast-many-fish-species-region-face-extinction-E28093-iucn-report
40 - Findings
The main country in our study to import FMFO from West Africa is Norway which is the second largest importer of FMFO from Mauritania Most marine ingredients used in Canada Chile and Scotland come from Peru Due to limited quantitative evidence on the impacts in relation to Peru we have excluded these from the analysis Estimates have been produced for Norway and are described in Box 1
Box 1 Estimate of cost to Mauritania of exported FMFO to Norway
In 2019 Norway imported almost 85 thousand tonnes of fish oil from Mauritania for use in the salmon farming industry Data are not currently available for Mauritania but an estimate by Wijkstroumlm for Asia suggests that if bycatch were not being used for fish farming in Asia it would hypothetically create between 81 and 102 million jobs in post-harvest activities and processing This equates to a minimum of 5 jobs per tonne of fish or 44255 jobs lost in the supply chain for the amount of fish oil sold to Norway If we multiply this by the GDP per head for Mauritania ($1188) it gives us a total value of $555 million Even when we subtract the value of the fish oil exports ($168 million) we are left with a loss of $375 million in 2019 There was insufficient data to carry out a retrospective analysis
41 - Conclusions and recommendations
4 Conclusions and recommendations
The demand for seafood is expected to increase in coming years and organisations like the World Bank and the FAO argue that this will have to be met by increased aquaculture production Although a highly profitable sector it has also generated considerable controversy and growth has stagnated in industrialised countries not least due to negative public perceptions of the aquaculture industry especially in Europe124 This along with the many non-economic costs (eg pollution fish welfare) present risks to the industry and are likely to result in economic costs over time
124 Bacher K (2015) Perceptions and misconceptions of aquaculture a global overview GLOBEFISH Research Programme 120 I
42 - Conclusions and recommendations
41 Conclusions
In this paper we have sought to fill gaps in understandings of the economic social and environmental costs of salmon farming in the top producing countries The estimates presented in this analysis are summarised in Table 16 We have used a conservative approach throughout and although we encountered significant data gaps we have been able to provide values for most of the variables The analysis suggests that salmon aquaculture has produced private and external costs of almost USD$50 billion over the 7-year period being studied
Table 16 Summary of costs (in MUSD)
Variable Canada Norway Chile Scotland Total
Mortalities 768 8908 4939 922 15539
Lice 111 2142 1647 463 4365
FMFO 454 4832 2045 859 8192
Total economic cost 1333 15969 8631 2233 28096
Salmon stocks 187 52 Insufficient data 68 308
Pelagic fish stocks 135 665 302 680 1784
Local pollution 189 2328 1268 288 4073
Climate change 425 5224 2282 425 8356
Total environmental cost 936 8269 3852 1461 14521
Fish welfare 97 3675 Insufficient data 902 4674
Total social cost 97 3675 Insufficient data 902 4674
Total 3587 27913 13304 4596 47291
This report has focused on the negative externalities from salmon farming On the benefit side we might want to consider factors such as consumer and producer surplus of increased aquaculture as well as employment in coastal communities where there may be limited industry Table 17 lists some of the economic benefits that have been found elsewhere
Table 17 Examples of positive benefits from salmon farming
Location Benefit
NorwayFisheries value chain is estimated to contribute USD$11 billion to GDP per annum125
British ColombiaSalmon farming supports 7000 jobs in coastal communities and contributes about $15 billion to the provincial economy annually
ChileEstimated to have created a total of 60000 jobs since it began to grow in the 1990s126
ScotlandEstimated to have contributed $2 billion to the Scottish economy annually
However it is not uncommon for economic studies to be commissioned by the industry itself or governments keen to support expansion (see Box 2 for a discussion of the use of cost benefit analysis in Scotland) Whilst this study has excluded positive impacts it has also been unable to assess some negative impacts such as the effects on coastal tourism For example a study in Norway that compares consumerproducer surplus to
125 Johansen U Bull-Berg H Vik L H Stokka A M Richardsen R amp Winther U (2019) The Norwegian seafood industryndashImportance for the national economy Marine Policy 110 103561
126 Naru A amp Shoaib F (2019) International Trade of Chilean and Tasmanian Salmon and the Governmental Human Resource Policy enabling its Expansion Latin American Journal of Trade Policy 2(3) 5-14
43 - Conclusions and recommendations
opportunity costs for landsea use finds that parts of the producer surplus have to be reinvested in the regional economy to create a positive return for a region127
Considering the full range of costs and benefits may well demonstrate positive benefits from aquaculture (and even salmon farming) Yet what this report shows is that there are substantial costs that are not included on the balance sheet and that the scope for improved environmental and social performance is considerable In addition a combination of growing environmental risks consumer demand for ethical products and limits to poor fish husbandry are creating long run economic risks to the industry that can only be mitigated by investing in more sustainable farming practices
Box 2 Cost benefit analysis and Scottish salmon farming
There have been several recent attempts to demonstrate the positive contribution of salmon farming to the Scottish economy and local rural communities128 These have been commissioned by both the Scottish Government and the Scottish salmon industry For example the Scottish Salmon Producerrsquos Organisation has calculated that the industry is worth over pound2 billion to the economy annually Reports by Imani and Westbrook (2017) and Marsh (2019) also found net positive benefits The latter reports have been critiqued by Riddington et al129 for Salmon and Trout Conservation Scotland who found that estimates for Gross Value Added (GVA) and employment were overestimated by 124 and 251 respectively The report concluded the evidence did not support industry expansion when the impacts to the whole of society are considered This report was peer reviewed by Bridge Economics130 who firmly endorsed the critiques and concluded that addressing quantitative oversights to bring the analysis in line with the Treasuryrsquos guidance on cost benefit analysis would have led to a less charitable assessment of the underlying economic arguments These critiques are not arguing that salmon farming is net negative to Scotland rather that the economic analyses contain positive biases and are partial because they do not consider costs and benefits to a wide enough range of stakeholders and exclude non-economic impacts
42 Recommendations Our recommendations focus on the four most significant stakeholders in salmon farming governments investors farmers and consumers The industry requires increased investment in technologies to address environmental economic and social risks described in this report Each of these groups has the potential to benefit andor bear costs from salmon farming and each should as a result be prepared to contribute proportionately towards the transformation that is required Bespoke recommendations for each group are therefore provided
127 Aanesen M amp Mikkelsen E (2020) Cost-benefit analysis of aquaculture expansion in Arctic Norway Aquaculture Economics amp Management 24(1) 20-42
128 SSPO (2020) Estimation of the Wider Economic Impacts of the Aquaculture Sector in Scotland httpswwwscottishsalmoncoukreportswider-economic-impacts-of-the-scottish-aquaculture-sector Imani Developments and Steve Westbrook httpimanidevelopmentcomwpcontentuploads201708Value-of-Scottish-Aquaculture-2017-Reportpdf Richard MarshFour Consulting (2019) Key Figures for Scottish Salmon httpsd178ivhysawughcloudfrontnet1556530716salmon-impactpdf
129 Riddington G Radford A and Gibson H (2020) The Economic Contribution of Open Cage Salmon Aquaculture to Scotland A Review of the Available Economic Evidence httpswwwsalmon-troutorgwp-contentuploads202004Riddington-Radford-Gibson-Economic-Contribution-of-Salmon-Aquaculture-to-Scotlandpdf
130 Bridge Economics (2020) Peer Review of the Economic Contribution of Salmon Aquaculture to Scotland httpswwwsalmon-troutorgwp-contentuploads202004Peer-Review-of-the-Economic-Contribution-of-Salmon-Aquaculture-to-Scotland-exec-summarypdf
44 - Conclusions and recommendations
For governments
Economic benefits of salmon farming need to be balanced against other coastal industries such as tourism angling and wider environmental impacts Better oversight and more robust regulation of salmon farming should lead over time to competitive advantage as consumers increasingly seek out more ethical and environmentally friendly products Governments can lead the way on this by restricting licences to companies that meet higher social and environmental standards
The industry would benefit from guidelines for sustainable feed ingredients along with stricter due diligence and governance frameworks in aquafeed supply chains Governments should also support the phase-out of whole wild-caught fish for use in aquafeed Furthermore aquaculture that relies on wild-caught fish should not receive any subsidies or other public support measures
Policy should support the development of alternative technologies (for feedstuffs and better farming methods) and provide economic incentives for a transition to more sustainable ingredients and farming practices
Governments should require more transparent reporting in this industry as is required in agriculture and should resist industry pressure not to publish mortalities data that are in the public interest Countries such as Canada that do not publish these data may be placing themselves at a disadvantage if mortalities data are more positive than those reported here In addition consumers increasingly expect transparency in supply chains and companiessectors which fail to respond to that expectation will place themselves at a disadvantage in the market
More generally there is a need to improve the quality of social economic and environmental accounting in salmon farming This would have the dual benefit of supporting more holistic decision-making and incentivising better farming practices By revealing costs and benefits governments could create a race to the top amongst salmon farmers and a level playing field for small producers that may be operating to higher standards At a minimum governments (eg in Scotland) should refrain from using economic analysis to make a priori economic arguments in favour of salmon farming given their responsibilities to a wider group of stakeholders
For investors
As a result of growing environmental and regulatory pressures investment decisions are required that drive a rapid transition towards alternative feeds and farming practices These technologies already exist but require more investment to make them viable in the short-term
Although the risks of existing farming practices are often understood investors continue to support them perhaps to the continued short-run profitability of the sector This creates a barrier to the adoption of new technologies and improved practices and investors need to take a long-term view This may involve accepting lower returns in the short term but as discussed in this paper issues with both supply and demand should create competitive advantage in the long run
45 - Conclusions and recommendations
For farmers
Mortalities lice treatments and disease are creating huge costs for the farmers and damaging the reputation of farmed salmon Significant opportunities exist to dramatically improve the environmental and social performance of salmon production through a focus on the development of least-environmental cost (as opposed to least-economic-cost) feed formulations These technologies exist and have been shown to work and producers should in particular work with the aquafeed industry to remove wild caught fish entirely from the formulations This would also appeal to the growing consumer demand for an ethical product In addition the cost of marine ingredients is expected to increase these may also prove to be a lower cost alternative in the medium term
As demonstrated in this report poor fish husbandry is a false economy as it leads to significant direct and indirect costs We recommend therefore that farmers adopt better practices such as stocking densities commensurate with higher survival rates Finally the industry should also prioritise cultivating non-carnivorous species or those that require less or no feed
For consumers
Salmon was once a high value food that was only available in season and consumed on special occasions In line with the need for investment from all stakeholders some consumers should also be prepared to pay more for salmon where their economic circumstances allow andor to consume it more infrequently As part of this consumers could seek out alternatives to carnivorous fish such as molluscs that provide dietary and economic benefits at lower social economic and environmental costs However many consumers will always choose low-cost products especially those in constrained economic circumstances and the onus should be largely on the industry - and the governments that give it licence to operate - to improve its performance
46 - Appendices
Appendix 1 ndash Norway
Norway is the worldrsquos largest producer of Atlantic salmon producing 13 million tonnes in 2018 or 52 of the global production131 According to governmental plans the production of farmed Atlantic salmon is set to grow five-fold by 2050132 to meet expected increases in global demand133
Economic costs
Historically Norway has had ideal conditions for salmon farming but in recent years the industry has been plagued by high mortality rates as the industry generates -and runs up against - increasing environmental pressures In 2018 it is estimated that over 52 million salmon were lost (13 of production) for varying reasons including diseasessea lice and associated treatments pollution and escapes134
Taking annual salmon losses and multiplying them by the salmon price for each year reveals the scale of the economic cost this represents Table 18 shows the percentage lost each year and the relevant price135 As we can see these mortalities result in a direct economic loss over the seven years of over USD$8 billion
Table 18 Opportunity costs of mortalities in Norway
2013 2014 2015 2016 2017 2018 2019
Total harvest (mt) 1168 1258 1303 2133 1236 1282 1357
Mortalities (t) 127347 145969 177255 309375 180508 164096 196809
Percentage losses 11 12 14 15 15 13 15
Value of losses (MUSD) 855 983 940 2208 1343 1234 1409
It is interesting to note that reducing mortalities to 55 on salmon farms in Norway would represent an annual saving of over $892 million USD (based on 2019 volumes and prices)
Substantial amounts are also spent in efforts to minimise mortalities by combatting disease and parasite infestations According to Nofima treating sea lice cost Kr45 billion in 2017 or 475 million dollars136 This includes an estimated NOK15 billion on cleaner fish (based on a cost of NOK12 per Kg of salmon produced)137 As the Norwegian Veterinary institute points out disease costs the aquaculture industry enormous sums of money results in poor fish-welfare reflects poorly on the aquaculture industry and is environmentally unfriendly Whilst more effective disease control will be costly in the long run it will be more profitable and will lead the industry in a more sustainable direction138
The final economic cost considered here is that of fishmeal and fish oil (FMFO) In 2016 the Norwegian salmon industry utilised 162 million tonnes of feed ingredients139 Soy protein concentrate accounted for 19 of the feed ingredients marine protein sources accounted for 145 and marine oils 104 The remainder was made up of wheat and plant-based oils This the equivalent of 245050 tonnes of fishmeal and 175760 tonnes
131 FAO (2019) The State of World Fisheries and Aquaculture httpwwwfaoorgstate-of-fisheries-aquaculture
132 Bailey J L amp Eggereide S S (2020) Indicating sustainable salmon farming The case of the new Norwegian aquaculture management scheme Marine Policy 117 103925
133 Aanesen M amp Mikkelsen E (2020) Cost-benefit analysis of aquaculture expansion in Arctic Norway Aquaculture Economics amp Management 24(1) 20-42
134 Nofima (2017) High lice costs rising feed prices ndash and expensive land-based facilities httpsnofimanoenforskningnaringsnyttehigh-lice-costs-rising-feed-prices-and-expensive-land-based-facilities
135 Data from Statistics Norway httpswwwssbnoenfiskeoppdrett
136 Nofima (2017) High lice costs rising feed prices ndash and expensive land-based facilities httpsnofimanoenforskningnaringsnyttehigh-lice-costs-rising-feed-prices-and-expensive-land-based-facilities
137 Nofima estimate of Kr12 per kg of salmon (based on 13 billion kg in 2018) httpsthefishsitecomarticlescounting-the-true-cost-of-combatting-sea-lice
138 Norwegian Veterinary Institute (2018) Fish Health Report 2018 httpswwwvetinstnorapporter-og-publikasjonerrapporter2019fish-health-report-2018
139 Aas TS et al 2019 Utilization of feed resources in the production of Atlantic salmon (Salmo salar) in Norway An update for 2016 Aquaculture Reports 2019 vol 15
47 - Appendices
of fish oil In Table 19 we estimate the annual cost to Norwegian aquaculture of using marine fish sources
Table 19 Cost of FMFO 2013-2019 (MUSD)
2013 2014 2015 2016 2017 2018 2019
Cost of FM $435 $428 $403 $346 $342 $350 $369
Cost of FO $335 $335 $324 $288 $249 $352 $270
Source authorrsquo calculation drawing on data from Statistics Norway140 the World Bank141 EUMOFA142 Ytrestoslashyl et al 2015143 Aas et al 2019144 and the FAO145
The use of marine ingredients has declined dramatically since 1990 when 90 of the feed was of marine origin146 This had decreased to 30 in 2013 down to about 25 today The latest analysis that is available is for 2016 but it is expected that reductions have plateaued in the absence of new technologies as has happened with fish oil since 2013 As demand for seafood has increased reductions in use have been offset leading to no overall net decrease If this continues then we would expect to see the use of marine ingredients increase five-fold by 2050 in line with expansion plans Taking these costs together we can see that mortalities and their treatment147 as well as the use of FMFO in feed cost the industry over $4 billion USD in 2019
The Norwegian Veterinary Institute (2018) have pointed to the paradox that while only a very few fish die due to salmon-lice infection delousing (eg stress from handling) is an important cause of direct and indirect mortality both for farmed salmon and cleaner-fish and has significant welfare implications Mortalities are (at least in part) a direct function of fish welfare we can conclude therefore that poor fish welfare has a direct economic risk for farmers and investors as well as being a wider social problem an issue that we will discuss in the next section
Social costs
In this section we consider two sources of social costs fish welfare and community impacts on coastal communities in West Africa from which FMFO is sourced
Fish welfare is increasingly taking on importance as an issue for consumers including evidence of its importance to Norwegian consumers148 149 To estimate the social cost of fish welfare we have based our calculations on a study of European consumers of their willingness to pay for higher welfare salmon150 European consumers were selected as Europe is a major consumer of salmon exports from Norway This research found that all things considered the average European consumer was willing to pay a price premium of 14 for salmon with higher welfare standards In Table 20 we apply this to all European consumers of Norwegian salmon since 2013 As we can see consumers were on average willing to pay a cumulative premium of $36 billion USD
140 Statistics Norway 07516 Fish farming Loss in fish for food production by fish species (C) 1993 ndash 2019 httpswwwssbnoenstatbanktable07516tableViewLayout1 httpsdataimforgsk=471DDDF8-D8A7-499A-81BA-5B332C01F8B9 httpsdataimforgsk=471DDDF8-D8A7-499A-81BA-5B332C01F8B9
141 httpswwwindexmundicomcommoditiescommodity=fish-mealampmonths=120ampcurrency=eur
142 httpswwweumofaeudocuments20178148316MH+4+2019+EN_finalpdf
143 Ytrestoslashyl T Aas T S amp Aringsgaringrd T (2015) Utilisation of feed resources in production of Atlantic salmon (Salmo salar) in Norway Aquaculture 448 365-374
144 Aas T S Ytrestoslashyl T amp Aringsgaringrd T (2019) Utilization of feed resources in the production of Atlantic salmon (Salmo salar) in Norway An update for 2016 Aquaculture Reports 15 100216
145 FAO (2016) COMMODITY STATISTICS UPDATE Fishmeal and Fish oil httpwwwfaoorg3a-bl391epdf
146 Aas T S Ytrestoslashyl T amp Aringsgaringrd T (2019) Utilization of feed resources in the production of Atlantic salmon (Salmo salar) in Norway An update for 2016 Aquaculture Reports 15 100216
147 Values uprated to 2019 prices using average Norwegian rate of inflation 125
148 Sandoslashe C G P Who cares about fish welfare -A Norwegian study Kristian Ellingsen Kristine Grimsrud Hanne Marie Nielsen Cecilie Mejdell Ingrid Olesen Pirjo Honkanen Staringle Navrud
149 Grimsrud K M Nielsen H M Navrud S amp Olesen I (2013) Householdsrsquo willingness-to-pay for improved fish welfare in breeding programs for farmed Atlantic salmon Aquaculture 372 19-27
150 Zander K amp Feucht Y (2018) Consumersrsquo willingness to pay for sustainable seafood made in Europe Journal of international food amp agribusiness marketing 30(3) 251-275
48 - Appendices
Table 20 WTP calculation for higher fish welfare (MUSD)
Norway2013 2014 2015 2016 2017 2018 2019
$271 $374 $434 $629 $603 $649 $713
Source authorrsquos own based on data from comtrade151
This proxy value demonstrates that fish welfare is material to consumers Although the valuation approach could potentially be criticised as being anthropomorphic valuation is intrinsically a human endeavour meaning that value can only be ascribed to humans hence the emphasis on human perception of welfare in this instance
In 2016 169000 tonnes of feed were used in Norwegian salmon farming Of this 145 was fishmeal and 104 was fish oil (Nofima) Of this 6 and 4 were sourced from West Africa Mauritania was the main West African supplier of marine ingredients to Norway in 2019
Mauritania has recently developed a fishmeal industry based on these small pelagics and it has shown strong growth since 2010 as a result of higher prices for marine ingredients152 It is argued that this is already impacting on regional stocks and that these are likely to increase as the fishmeal industry expands153 There is limited research especially of a quantitative nature on the potential impacts of the expansion of this industry
In 2018 Norway imported almost 84 thousand tonnes of fish oil from Mauritania for use in the salmon farming industry To estimate the potential loss of value added we compare the value added from canning (based on Moroccan data) with producing FMFO (29 and 10 respectively)154 (see Table 21 for a list of the assumptions used) The total annual cost of diverting the 90 of this fish that is suitable for DHC to fish oil is over $1 million per year
Table 21 Assumptions in social calculations for Mauritania
Assumptions Values
Value added of fishing 903000000
fleet pelagics 722400000
Fish produced 1500000
Value added of canning 29
Tonnes of pelagics canned 139000
Value added canning 209496000
Total FMFO production 172000
Value added of FMFO 10
Value added FMFO 72240000
Difference 137256000
Difference per tonne in USD 1268
151 httpscomtradeunorg
152 Corten A Braham C B amp Sadegh A S (2017) The development of a fishmeal industry in Mauritania and its impact on the regional stocks of sardinella and other small pelagics in Northwest Africa Fisheries research 186 328-336
153 Ibid
154 Data are drawn from Greenpeace A Waste of Fish CEIC httpswwwceicdatacomenmoroccofish-production-consumption-and-processingfish-processing-volume-fish-meal-and-fish-oil ITC trade map and Government of Mauritania httpwwwpechesgovmrIMGpdfrapport_finalcadre_d_investissementpdf
49 - Appendices
An alternative way of estimating the loss of value added is to estimate the direct and indirect loss of employment Data are not currently available for Mauritania but an estimate by Wijkstroumlm for Asia suggests that if bycatch were not being used for fish farming in Asia it would hypothetically create between 81 and 102 million jobs in post-harvest activities and processing This equates to a minimum of 5 jobs per tonne of fish or 44255 jobs lost in the supply chain for fish oil sold to Norway If we multiply this by the GDP per head for Mauritania ($1188) it gives us a total value of $555 million Even when we subtract the value of the fish oil exports ($168 million) we are left with a loss of $375 million
There are also concerns over the welfare of wild wrasse (cleaner fish) on fish farms Wrasse require shelters for protection when at rest and from tides and currents supplementary feeding when lice numbers are low and care during farm operations such as grading and moving salmon and net cleaning155 However mortality rates are very high 23 million wild wrasse were caught in Norway in 2018 and 40 of these died in the same year Due to a lack of data it was not possible to include a valuation of wrasse welfare in the model
Environmental costs
Finally we consider environmental costs The most notable of these are
bull Impacts on wild salmonid stocksbull Impacts on wild cleaner fish stocksbull Impacts on pelagic fish stocksbull Impacts of local pollutionbull Carbon emissions
Local pollution
Liu et al have estimated the PAC for Norwegian salmon farming and found it to be 35 of total salmon production156 These are based on 2010 and may be therefore a little out of date On the other hand algal blooms are a continuing (and perhaps worsening) problem for Norwegian aquaculture In 2019 8 million salmon were killed in an algal bloom in just a few days157 This prompted the Norwegian government to invest almost one million Euros in aquaculture research Although the loss to farmers of about NOK4 million was widely reported the environmental cost has received less attention Table 22 details the annual pollution abatement cost This equates to a total PAC of USD$14 billion since 2013
Table 22 Estimate of annual pollution abatement cost
Norway2013 2014 2015 2016 2017 2018 2019
$140489766 $154941911 $164633692 $222735005 $228342307 $238998213 $252350165
Impacts on fish stocks
There are three means by which salmon farming impacts on fish stocks Two of these have already been discussed the use of pelagic fish and cleaner fish in fish feed and lice treatment respectively The third is the impacts on wild salmon stocks A report by Thorstad and Finstad (2018) found that it can lead to an average of 12-29 fewer adult wild salmon Table 23 estimates the indirect value of forage fish use in FMFO in Norway
155 Treasurer J amp Feledi T (2014) The Physical Condition and Welfare of Five Species of Wild-caught Wrasse Stocked under Aquaculture Conditions and when Stocked in Atlantic Salmon Salmo salar Production Cages Journal of the World Aquaculture Society 45(2) 213-219
156 Liu Y amp Sumaila U R (2010) Estimating pollution abatement costs of salmon aquaculture a joint production approach Land Economics 86(3) 569-584
157 Magra I (2019) Millions of Salmon in Norway Killed by Algae Bloom New York Times Accessed online httpswwwnytimescom20190523worldeuropesalmon-norway-algae-bloomhtml
50 - Appendices
Table 23 Loss of value as a result of forage fish being used in FMFO in Norway 2013-2019
Norway2013 2014 2015 2016 2017 2018 2019
$16676986 $14749795 $20827399 $21100028 $20592863 $21042291 $20621445
These figures only considered ex-vessel prices of predator fish dependent on forage fish However this is very likely an underestimation of the full economic benefits of predator fish (eg downstream benefits or supply chains through processors distributors and consumers It also most likely underestimates wider ecosystem benefits to nonmarket predators such as seabirds seals and so on As well as the existence value of these species discussed elsewhere there can be additional economic benefits such as ecotourism revenue (whale watching bird watching etc)158 Froehlich et al assess whether FMFO use can circumvent forage fish limits (eg through greater consistent inclusion of fish byproducts) They find that this is possible by the middle of the 21st century However global shifts towards more pescatarian diets will make this impossible and increase the requirement for long-term nutrient equivalent feed sources159
As discussed above salmon farms cause damage to wild salmon stocks through local pollution and the spreading of lice and disease In addition escaped salmon breed with local populations and their offspring are genetically less likely to survive and research suggests that these effects are likely to last down the generations160 Rates of returning salmon in Norway are less than half what they were in the 1980s161 According to the Norwegian Scientific Committee on the Atlantic Salmon the largest declines are seen in western and middle Norway and negative impacts of salmon farming have contributed to this Escaped farmed salmon are the primary threat to wild salmon followed by salmon lice and infections They also argue that the present level of mitigation measures is too low to stabilize and reduce the threat Impacts on escaped salmon are difficult to model but it is estimated that lice from salmon farms kill 50000 wild salmon per year162 We know that returning salmon are about half a million fewer than in the 1980s163 If we conservatively assume about 150000 of these are as a result of salmon farming (we know 50000 are due to lice infestations and assume 75000 are due to hybridisation and 25000 due to infectious diseases) This is about 30 of the lost wild salmon population No studies were identified on Norwegian valuations of salmon conservation but we have taken an average of three figures per household from Canada the UK and Ireland ($10 $20 and $18 respectively)164 These represent the amount households would be willing to pay to restore salmon stocks Applying the average of these to the lost salmon stocks gives us an annual figure of $11 million USD We would suggest that this is a reasonable proxy for the value destroyed in Norwegian society by farmed fish impacts on wild populations
158 Koehn L E Essington T E Marshall K N Sydeman W J Szoboszlai A I amp Thayer J A (2017) Trade-offs between forage fish fisheries and their predators in the California Current ICES Journal of Marine Science 74(9) 2448-2458
159 Froehlich H E Jacobsen N S Essington T E Clavelle T amp Halpern B S (2018) Avoiding the ecological limits of forage fish for fed aquaculture Nature Sustainability 1(6) 298-303
160 Hindar K Fleming I A McGinnity P amp Diserud O (2006) Genetic and ecological effects of salmon farming on wild salmon modelling from experimental results ICES Journal of Marine Science 63(7) 1234-1247
161 Norwegian Scientific Advisory Committee for Atlantic Salmon (29019) Status of wild Atlantic salmon in Norway 2019 Accessed online httpswwwvitenskapsradetnoPortalsvitenskapsradetPdfStatus20of20wild20Atlantic20salmon20in20Norwaypdf
162 Castle S (2017) As Wild Salmon Decline Norway Pressures Its Giant Fish Farms New York Times httpswwwnytimescom20171106worldeuropesalmon-norway-fish-farmshtml
163 Norwegian Scientific Advisory Committee for Atlantic Salmon (29019) Status of wild Atlantic salmon in Norway 2019 Accessed online httpswwwvitenskapsradetnoPortalsvitenskapsradetPdfStatus20of20wild20Atlantic20salmon20in20Norwaypdf
164 Myrvold K M Mawle G W Andersen O amp Aas Oslash (2019) The Social Economic and Cultural values of wild Atlantic salmon A review of the literature for the period 2009-2019 and an assessment of changes in values Lillehammer Norwegian Institute for Nature Research
51 - Appendices
The final wild fish impact is on wrasse stocks However these impacts are much ignored in the literature and could not be incorporated into this analysis This is concerning especially considering that surveys done by NTNU Social Research reveal that fish farmers question whether cleaner fish are an effective delousing method that actually results in fewer delousing operations165
The aquaculture industry is often positioned as a sustainable alternative to land-based animal farming However as critics have pointed out this is often based on flawed analysis that does not take into account the full CO2 costs of salmon farming Sintef have estimated the full CO2 emissions for Norway taking account of previously uncounted impacts These include the impacts of the use of soy in fish feed and its impact on deforestation in Brazil (all of the Norwayrsquos soy is sourced in Brazil) It also takes account of air freight in the distribution of salmon which is increasing due to the increased importance of China as a consumer of Norwegian salmon The total carbon emissions produced by the sector are 9685 million tonnes There are various methods for costing carbon emissions and a wide literature on the appropriate valuations to use If we conservatively use the carbon tax applied by Norway to fishing to this figure ($27 USD per tonne) we get an annual value of $255 million per year166 However this value is substantially higher when a social cost of carbon is applied Table 24 shows the emissions costs based on the Norwegian LCA data and using the UKrsquos Department for Climate Change estimate of USD$72 per tonne ($52 billion)
Table 24 Emissions costs (MUSD)
Norway2013 2014 2015 2016 2017 2018 2019
$626 $ 674 $699 $1144 $663 $687 $728
Conclusion
A summary of the costs included in this study is provided in Table 25 As we can see this analysis gives us a total cost since 2013 of almost USD$28 billion
Table 25 Summary of costs (MUSD)
Norway
Mortalities 8908
Lice 2142
FMFO 4832
Total economic cost 15969Salmon stocks 52
Pelagic fish stocks 665
Local pollution 2328
Climate change 5224
Total environmental cost 8269Fish welfare 3675
Total social cost 3675Total 27913
165 The Norwegian Institute of Marine Research is also concerned about the methodrsquos lack of documented effectiveness httpsnorwegianscitechnewscom202004cleaner-fish-being-sacrificed-in-the-fight-against-salmon-lice
166 Bruvoll A and Dalen H (2009) Pricing of CO2 emissions in Norway Accessed online httpswwwssbnoaenglishpublikasjonerpdfdoc_200916_endoc_200916_enpdf
52 - Appendices
Appendix 2 ndash Scotland
Although Scotlandrsquos share of total salmon production is small relative to Norway and Chile (76) it is an extremely important industry to the economies of both Scotland and the UK It is currently the UKrsquos biggest food export (in 2019 94300 tonnes was exported to 54 countries an increase of 26 per cent on 2018 figures)167 and it is also valued by UK consumers (60 of production is consumed domestically)
The industry has grown by 91 since 1997 and is dominated by six large companies controlling 99 of the market168 In addition the industry has widely publicised plans to grow further with a target of increasing growth by another 100-165 from a 2018 baseline by 2030169
Economic losses
Salmon deaths are reported by fish farming companies and published online by the Scottish Environment Protection Agency In 2013 the Scottish government stopped publishing aggregate figures on mortalities allegedly as a result of industry pressure170 Analysis of deaths reported to the SEPA by Inside Scottish Salmon Feedlots (ISSF) suggest a large increase in mortalities since 2002 (an increase from 31 to 135) The main causes of deaths reported are infections algal blooms and delousing treatments
To estimate the economic losses of these mortalities we have taken the proportion of mortalities as a share of total farmed salmon production for Scotland in each year studied (base on FAO data)171 Production has increased by 16 since 2013 However losses have also increased by 60 over that period as has the value of those losses Cumulatively this equates to 134727 tonnes of salmon with a value of $922 million Had mortalities been maintained at 64 since 2013 this would have represented a cumulative saving to the industry of almost $400 million However if survival rates similar to 2002 could be regained (about 97) this will represent a cumulative saving of $668 million over the period
Table 26 Opportunity costs of Scottish mortalities 2013-2019 172
2013 2014 2015 2016 2017 2018 2019
Total harvest (mt) 160 179 170 163 189 156 190
Mortalities (t) 10329 16046 18302 22245 25460 16573 25772
Percentage losses 640 900 1080 1360 1340 1060 1350
Value of losses (MUSD) $67 $106 $97 $158 $189 $124 $177
To estimate the damage control cost of lice we take an estimate derived by Costello (2009) for Scotland173 This was euro025 per kg of salmon produced based on 2006 production and prices We have uprated this based on the UK inflation rate and convert to dollars (see Table 27) These costs are multiplied by the total amount of salmon produced in each of the years giving a cumulative cost of $463million or 67 of total sales which is comparable with Costellorsquos estimate for the global cost of sea lice (6)
167 Scottish Salmon (2020) Scottish salmon exports explained httpswwwscottishsalmoncoukfactsbusinessscottish-salmon-exports-explained~text=Scottish20salmon20is20both20Scotlandrsquosper20cent20on20201820figures
168 Marine Scotland Science (2018) Scottish fish farm production survey 2018 httpswwwgovscotpublicationsscottish-fish-farm-production-survey-2018
169 Feedback (2019) Fishy business Accessed Online httpsfeedbackglobalorgwp-contentuploads201906Fishy-business-the-Scottish-salmon-industrys-hidden-appetite-for-wild-fish-and-landpdf
170 Edwards R (2020) Farmed salmon deaths from disease reach record high httpstheferretscotfarmed-salmon-deaths-disease-reach-record-high~text=E2809CMass20mortalities20are20a20functioncommercially20damaging20for20salmon20farmers
171 httpwwwfaoorgfisherystatisticsglobal-aquaculture-productionqueryen
172 Data not available for 2019 calculation based on tonnage of mortalities multiplied by the global salmon price for 2019 httpswwwimforgenResearchcommodity-prices
173 Costello M (2009) The global economic cost of sea lice to the salmonid farming industry Journal of fish diseases 32(1) 115
53 - Appendices
Table 27 Estimate of cost of lice treatment in Scotland 2013-2019 (USD)
Year Cost per kg Scotland Total cost Scotland
2013 $036 $57
2014 $037 $66
2015 $037 $62
2016 $037 $60
2017 $040 $75
2018 $040 $62
2019 $041 $78
It is not clear if the Costello estimates included include the costs of over 15 million farmed cleaner fish174 and about 30000 wild caught wrasse175 used in Scottish salmon farming annually The financial costs of cleaner fish have been increasing and are likely to be significantly higher than when Costellorsquos estimates were derived176
Scottish salmon contains a higher quantity of marine ingredient in its feed and indeed is marketed on this basis177 Data on FMFO content in feed is available for 2014178 and these have been utilised to create estimates for 2013 and the intervening years We know in that year that 25 of the 220000 tonnes of feed utilised was fish meal and 15 was fish oil Given that Scotland continues to have a higher proportion of marine content in its feed (some of its labels are as high as 51)179 we believe that this is unlikely to have decreased significantly in the intervening years Estimates are based therefore on the ratio of FMFO to production in 2014 and the cost of feedstuffs and result in a cumulative figure of USD$859 million (Table 3)180
Table 28 Cost estimates FMFO in Scottish salmon farming (MUSD)
2013 2014 2015 2016 2017 2018 2019
Scotland FM cost $64 $70 $66 $62 $71 $58 $70
Scotland FO cost $61 $63 $56 $51 $51 $57 $50
Social costs
Although Scottish salmon is promoted in the UK as a local product and a good employer of local people a closer look at the numbers tells a different story First fewer than 25 of feedstuffs originate in the UK181 with most of the marine ingredients coming from Peru Peru is the top exporter of fishmeal and fish oil (FMFO) worldwide and landings of anchoveta are used nearly exclusively for FMFO production despite a proactive national food policy aimed at favouring their direct human consumption in an effort to tackle Perursquos substantial undernutrition problem182
Second only about 2000 people are directly employed by salmon farms Even if we consider the 10000 employed through the supply chain this falls far short of the proportion employed in the tourism sector183 Scottish government data suggest that
174 Open Seas (2017) Cleaning up the lsquocleaner fishrsquo Accessed online httpswwwopenseasorguknewscleaning-up-the-cleaner-fish
175 Scottish Salmon Search for wild wrasse Accessed online httpswwwscottishsalmoncouksearchpageskeys=wild20wrasse
176 Open Seas (2017) Cleaning up the lsquocleaner fishrsquo Accessed online httpswwwopenseasorguknewscleaning-up-the-cleaner-fish
177 Feedback (2019) Fishy business Accessed Online httpsfeedbackglobalorgwp-contentuploads201906Fishy-business-the-Scottish-salmon-industrys-hidden-appetite-for-wild-fish-and-landpdf
178 Shepherd J Monroig O amp Tocher DR (2017) Future availability of raw materials for salmon feeds and supply chain implications the case of Scottish farmed salmon Aquaculture 467 pp 49-62
179 Ibid
180 World Bank FAO and EUFMA
181 Newton R W amp Little D C (2018) Mapping the impacts of farmed Scottish salmon from a life cycle perspective The International Journal of Life Cycle Assessment 23(5) 1018-1029
182 Freacuteon P Sueiro J C Iriarte F Evar O F M Landa Y Mittaine J F amp Bouchon M (2014) Harvesting for food versus feed a review of Peruvian fisheries in a global context Reviews in Fish Biology and Fisheries 24(1) 381-398
183 Schweisforth L (2018) The tragic demise of Scotlandrsquos salmon httpssustainablefoodtrustorgarticlesthe-tragic-demise-of-scotlands-salmon
54 - Appendices
this industry supports 218000 jobs (the best estimate for the salmon industry is less than 5 of this)184 Moreover Scottish salmon farming reflects the concentration we see in the wider industry with most production being controlled by non-domiciled companies (see Table 29)
Table 29 Ownership of Scottish salmon farms
Company Majority ownership
Cooke Aquaculture Canadian
Grieg Norwegian
Mowi Norwegian
Loch Duart USA
Scottish Sea Farms Norwegian
Scottish Salmon Company Ukraine
The UK alongside some of the Nordic countries has some of the strongest animal welfare legislation in the world185 reflecting perhaps the importance placed by UK consumers on animal welfare Research has found that these concerns are top of the list for consumers when assessing how ethical they regard food and drink companies to be186 However as discussed elsewhere fish welfare is a shared value across the European Union (EU) 52 of Scottish salmon is consumed domestically and of the 38 that is exported 56 of that goes to the EU187 We can expect high fish welfare standards to appeal to these consumers On average research has found a WTP of 14 amongst European consumers When we apply this to the 79 of salmon consumed in the UKEU we find that the total value for higher fish welfare is $902 million over the seven years (Table 30)
Table 30 Fish welfare premium for Scottish and EU consumers (MUSD)
Scotland2013 2014 2015 2016 2017 2018 2019
$117 $130 $107 $114 $149 $136 $145
Environmental impacts
To value the environmental cost of local pollution in Scotland we can also use data gathered via the contingent valuation method A study by Whitmarsh et al found that 76 of respondents in Scotland were in principle willing to pay a price premium (22) for salmon produced using a method that caused only half the amount of nutrient discharge188 Public support for environmentally sustainable salmon has been found in several other studies However research also suggests that findings vary depending on factors like area deprivation and proximity to areas where salmon farming is providing jobs189 Nonetheless there is growing evidence that on average increased concern over the environmental performance of the salmon farming industry is associated with a lower propensity to purchase salmon and is therefore potentially damaging to the long-term profitability of the industry190 There is also evidence of support in the UK for alternative feeds such as the use of insect meal especially when consumers
184 httpswwwsdicoukkey-sectorstourism~text=across20the20globe-The20tourism20sector20in20Scotland20supports20the20jobs20of202182C000that20number20is20growing20quickly
185 Evidence Group (2018) FARM ANIMAL WELFARE GLOBAL REVIEW SUMMARY REPORT httpswwwnfuonlinecomnfu-onlinesectorsanimal-healthfarm-animal-welfare-global-review-summary-report
186 Farmers Weekly (2015) Animal welfare tops list of consumersrsquo ethical concerns httpswwwfwicouklivestockhealth-welfareanimal-welfare-tops-list-consumers-ethical-concerns
187 httpswwwbbccomnewsuk-scotland-scotland-business-51460893
188 Whitmarsh D amp Palmieri M G (2009) Social acceptability of marine aquaculture The use of survey-based methods for eliciting public and stakeholder preferences Marine Policy 33(3) 452-457
189 Whitmarsh D amp Palmieri M G (2009) Social acceptability of marine aquaculture The use of survey-based methods for eliciting public and stakeholder preferences Marine Policy 33(3) 452-457
190 Maesano G Carra G amp Vindigni G (2019) Sustainable dimensions of seafood consumer purchasing behaviour A review Calitatea 20(S2) 358-364
55 - Appendices
are educated on the benefits 191 Using data from the Whitmarsh study enables us to estimate the willingness of consumers to pay for salmon reared to higher environmental standards To be conservative we have limited this calculation to UK consumers as the data used is drawn from a Scottish survey (see Table 31) This results in a $655 million cost over the seven years Separate calculations using Pollution Abatement Cost approach have been used in the main body of the report
Table 31 Willingness to pay for higher environmental standards 2013-2019 (MUSD)
Scotland2013 2014 2015 2016 2017 2018 2019
$85 $95 $78 $83 $109 $99 $105
As discussed above forage fish provide a range of ecosystem services that are external to the market value of the fish themselves Measuring these benefits holistically is challenging given the interconnected and complex nature of the marine ecosystem One proxy that we can consider is the economic value of predators that depend on forage fish for their survival The economic value of this is estimated at 113 billion globally or $219 per tonne (based on global landings of 515 million tonnes) In Scotland 460000 tonnes of forage fish are required to produce around 179000 tonnes of salmon192 This is a ratio of about 261 If we apply this ratio to Scottish landings since 2013 we can estimate the volume of forage fish consumed by the industry each year and apply our wild to farmed fish ratio The results are displayed in Table 32 The cumulative ecosystem loss is estimated to be in the region of $680 million However as discussed elsewhere this potentially grossly underestimates the full ecosystemexistence value as it does not include non-market prey such as seals and seabirds not to mention the economic value of marine tourism193
Table 32 Ecosystem value of forage fish used in Scottish salmon production (MUSD)
Scotland2013 2014 2015 2016 2017 2018 2019
$90 $100 $95 $91 $106 $87 $107
Worryingly if traditional feed formulations have plateaued in terms of reducing FMFO then we would expect the absolute number of wild caught fish to increase dramatically in line with plans to expand production In the case of Scotland this would mean doubling the volume of wild caught fish by 2020
Scottish government data show that over 35 million salmon have escaped from salmon farms since 1990 when records began Of these fewer than 100000 have been recovered suggesting an annual net figure of about 289000 per year In August of this year Mowi Scotland confirmed 48834 escapes from just one facility There are concerns about the impacts of escaped salmon on the wild population through infectious diseases lice and interbreeding194 In response to this event Fisheries Management Scotland has launched a research project on wild salmon genetics to gauge the impact of any interbreeding between wild and farm-raised salmon We also know that salmon stocks have seen dramatic declines The total rod catch for 2018 was the lowest on record and under 50 of the average for the period 2000-09195 Research by Scottish Enterprise has documented the negative economic effects of declining salmon stocks on rural businesses in Scotland196 Rod catches are only part of the story and there is
191 Popoff M MacLeod M amp Leschen W (2017) Attitudes towards the use of insect-derived materials in Scottish salmon feeds Journal of Insects as Food and Feed 3(2) 131-138
192 Feedback (2019) Fishy business Accessed Online httpsfeedbackglobalorgwp-contentuploads201906Fishy-business-the-Scottish-salmon-industrys-hidden-appetite-for-wild-fish-and-landpdf
193 Koehn L E Essington T E Marshall K N Sydeman W J Szoboszlai A I amp Thayer J A (2017) Trade-offs between forage fish fisheries and their predators in the California Current ICES Journal of Marine Science 74(9) 2448-2458
194 Ford J S amp Myers R A (2008) A global assessment of salmon aquaculture impacts on wild salmonids PLoS Biol 6(2) e33
195 Scottish Enterprise (2019) INVESTIGATION INTO THE IMPACT OF DECLINE IN SALMON NUMBERS ON RURAL BUSINESSES httpfmsscotwp-contentuploads201911Fraser-Associates-Impact-of-Decline-in-Salmon-Numbers-on-Rural-Businesses-Final-Draft-11-09-19-1pdf
196 Ibid
56 - Appendices
a similar finding for returning salmon the stocks of which have more than halved in the 20 years to 2016 to just over a quarter of a million As with our Norway estimates if we assume that 20 of these are due to salmon farming impacts we arrive at an estimate of 71000 wild salmon being lost to fish farming each year Using the same methodology as for Norway we estimate a WTP to restore wild salmon stocks in Scotland of $48 million at the household level A fifth of this cost gives us an annual cost to Scottish society of $15 million or $68 million cumulatively (see Table 30)197
Table 33 WTP estimates for restoration of salmon stocks
Scotland2013 2014 2015 2016 2017 2018 2019
$9601368 $9664056 $9719772 $9784684 $9850944 $9909100 $9982492
Finally we consider CO2 emissions Whilst the farmgate emissions from aquaculture are low relative to agriculture (one estimate for the UK is 324748 tonnes of CO2relative to over 9 million tonnes respectively or about 35) these estimates underestimate the true carbon cost of aquaculture once airfreight and feedstuffs are considered As demonstrated for Scotland salmon is not a truly local product but supports a vast global value chain198 If we assume a similar carbon footprint to Norwegian salmon based on Life Cycle Analysis (745 kg per kg) we find a cumulative cost $288 million over the seven year period (Table 34)
Table 34 Estimates of CO2 emissions from Scottish salmon farms
Scotland2013 2014 2015 2016 2017 2018 2019
$37725689 $41350373 $31568216 $40728203 $49427534 $41089631 $46143572
In conclusion we can see that there are substantial private and external costs from salmon farming that are not usually quantified and or monetised
Conclusion
A summary of the costs included in this study is provided in Table 35 As we can see this analysis gives us a total cost in the seven years to 2019 of almost USD$46 billion
Table 35 Summary of costs (MUSD)
Scotland
Mortalities 922
Lice 463
FMFO 859
Total economic cost 2233Salmon stocks 68
Pelagic fish stocks 680
Local pollution 288
Climate change 425
Total environmental cost 1461Fish welfare 902
Total social cost 902Total $4596
197 Household data taken from httpswwwnrscotlandgovukstatistics-and-datastatisticsstatistics-by-themehouseholdshousehold-estimates2019
198 Newton R W amp Little D C (2018) Mapping the impacts of farmed Scottish salmon from a life cycle perspective The International Journal of Life Cycle Assessment 23(5) 1018-1029
57 - Appendices
Appendix 3 ndash CanadaCanada has 25 of the entire worldrsquos coastline199 This along with its cold waters and access to the US market mean that its salmon farming industry is considered to have significant potential for growth200 Fisheries and Oceans Canada also report that aquaculture (of which Atlantic salmon is about 75) generates substantial growth and employment opportunities in rural areas201 However it has also come under increasingly intense public scrutiny over its environmental impact First Nations territorial rights and impacts on wild salmon202 An independent Auditorrsquos Report in 2018 found that Fisheries and Oceans Canada had made insufficient progress on a range of indicators such as risk assessment for disease auditing of fish health impact assessment of the use of drugs or pesticides on wild fish and measures to minimise escapes203 These concerns may partly explain why Canada has not seen the growth experienced by competitors with 2019 seeing a 2 fall in production204 In response to criticisms the Canadian Government has been researching and investing in new technologies such as land based RAS and hybrid systems IMTA systems205 and specifically identifies systems that offer the best combination of environmental social and economic performance206 Indeed the Liberal partyrsquos last manifesto included a pledge to shift all production to land-based systems as well as introduce the countryrsquos first aquaculture act207
Economic costs
Production figures have been accessed through Statistics Canada However these were not available for 2019 and have been calculated based on an FAO study that reported that production fell by 2 in Canada in 2019208 Unfortunately Canada does not publish annual mortalities data Although monthly mortalities data are available production data are published annually which makes it impossible to ascertain absolute mortalities In this study we have taken the average for Norway and Scotland and applied it to Canada This may well overestimate Canadarsquos mortalities but in the absence of official data this is the most plausible assumption If this is inaccurate we would encourage the Ministry of Oceans and Fisheries to publish these data Table 36 displays the calculations based on these data As we can see there is a total cost to Canadian farmers of USD$768 million
Table 36 Opportunity costs of mortalities in Canada 2013-2019
2013 2014 2015 2016 2017 2018 2019
$53 $59 $81 $143 $147 $130 $152
There have been a few attempts to estimate the cost of sea lice to salmon farms in Canada209 Based on 2000 prices Mustafa et al estimate that the total cost to salmon farmers was $056kg of salmon when the full costs such as reduced growth and feed conversation ratio Costello (2006) builds on these to develop global estimates for
199 Flaherty Mark et al ldquoPublic attitudes towards marine aquaculture in Canada insights from the Pacific and Atlantic coastsrdquo Aquaculture International 271 (2019) 9-32
200 httpswwwoag-bvggccainternetEnglishparl_cesd_201804_01_e_42992html
201 httpswwwdfo-mpogccaaquaculturesector-secteursocioindex-enghtm
202 Britten L (2019) BC First Nation sues feds over Atlantic salmon farming in Pacific waters httpswwwcbccanewscanadabritish-columbiabc-salmon-farming-lawsuit-14976042
203 httpswwwoag-bvggccainternetEnglishparl_cesd_201804_01_e_42992html
204 FAO (2020) Salmonrsquos upward growth trajectory grinds to a halt over COVID-19 httpwwwfaoorgin-actionglobefishmarket-reportsresource-detailfrc1296665
205 In IMTA species from different trophic levels are raised in proximity to one another with the organic and inorganic wastes of one cultured species serving as nutritional inputs for others IMTA has been shown to reduce benthic ecological impacts in proximity to Atlantic salmon farms improve social perceptions of aquaculture and provide potential financial benefits for aquaculture producers via product diversification faster production cycles and price premiums for IMTA products
206 httpswwwdfo-mpogccaaquaculturepublicationsssat-ets-enghtmltoc-6
207 The Fish Site (2019) Canadian farmers lambast ldquoirresponsiblerdquo Liberal call for land-based salmon farming httpsthefishsitecomarticlescanadian-farmers-lambast-irresponsible-liberal-call-for-land-based-salmon-farming
208 FAO (2020) Salmonrsquos upward growth trajectory grinds to a halt over COVID-19 httpwwwfaoorgin-actionglobefishmarket-reportsresource-detailfrc1296665
209 Pike A W amp Wadsworth S L (1999) Sea lice on salmonids their biology and control In Advances in parasitology (Vol 44 pp 233-337) Academic Press and Mustafa A Rankaduwa W amp Campbell P (2001) Estimating the cost of sea lice to salmon aquaculture in eastern Canada The Canadian veterinary journal 42(1) 54
58 - Appendices
Canada210 To avoid double counting with mortalities we have used treatment costs alone estimated at euro010 per kg for Canada This figure has been uprated to 2019 prices using average inflation in Canada since 2006211 and converted to USD Table 37 displays the results As we can see the cumulative costs are USD$111 million
Table 37 Costs of sea lice treatment in Canada 2013-2019 (MUSD)
Year Cost per kg Canada Total cost Canada
2013 0112 $12
2014 0114 $11
2015 0116 $16
2016 0117 $17
2017 0119 $17
2018 0122 $17
2019 0125 $17
Canada has historically relied less on cleaner fish to tackle sea lice A lumpfish hatchery is currently seeking approval to produce up to 3 million lumpfish212 However it has been stalled in 2020 by environmental reviews Nonetheless cleaner fish are increasingly seen a solution to Canadarsquos sea lice problem
Canada has historically used a lower proportion of marine ingredients in its aquafeed than competitors213 In 2013 Sarkar et al214 report these as 15-18 for fish meal and 12-13 for fish oil in 2013 This is down from 20ndash25 and 15ndash20 in 2005 Averages of the 2013 figures 165 and 125 have been used to estimate the cost of feed ingredients of marine origin to salmon farmers in Canada (Table 38) Cost of total feed estimates were drawn from Statistics Canada and the FAO The cumulative cost of the use of fish feed is USD$454
Table 38 Cost of FMFO in Canada 2013-2019 (MUSD)
2013 2014 2015 2016 2017 2018 2019
Canada FM cost $23 $30 $36 $35 $37 $41 $40
Canada FO cost $19 $26 $30 $29 $32 $35 $34
210 Costello M (2009) The global economic cost of sea lice to the salmonid farming industry Journal of fish diseases 32(1) 115
211 httpswwwinflationeueninflation-ratescanadahistoric-inflationcpi-inflation-canadaaspx
212 Khan I (2019) Lumpfish to be grown in Canadian hatchery httpswwwfishfarmingexpertcomarticlelumpfish-to-be-grown-in-canadian-hatchery~text=An20application20to20develop20Canadarsquoshas20been20put20into20motionamptext=The20hatchery20will20produce20threesea20lice20off20farmed20salmon
213 Sarker P K Bureau D P Hua K Drew M D Forster I Were K amp Vandenberg G W (2013) Sustainability issues related to feeding salmonids a Canadian perspective Reviews in Aquaculture 5(4) 199-219
214 Ibid
59 - Appendices
Social costs
As discussed negative public attitudes especially on the Pacific coast of Canada have been a brake on the growth of aquaculture215 One study of 68 countries found that Canada had the highest proportion of negative sentiment towards all kinds of aquaculture as well as the most polarized split between positive and negative opinions216 The strongest negative perceptions are held for salmon farming on both coasts217 As part of this fish welfare is an emerging animal welfare concern in Canada For the purposes of this study it was not possible to uncover any studies that looked at fish welfare as a discreet sub-section of ethicalsustainable production Instead we have used the EU estimate used elsewhere (14) This is plausible given that animal welfare standards are somewhat similar and (as discussed) there is plenty of evidence that Canadians care about animal welfare 85 of Canadian salmon exported to the US where animal welfare legislation is less stringent We have therefore limited our analysis to the 15 of salmon that is consumed domestically This is multiplied by the fish welfare premium of 14 The results are shown in Table 39 As we can see there is a total cost of USD$97 million
Table 39 Estimate of WTP for poor salmon welfare (MUSD)
Canada2013 2014 2015 2016 2017 2018 2019
$9 $9 $10 $16 $16 $17 $17
The second social cost considered in the other analyses is the impacts on fishing communities in developing countries Canada has a domestic FMFO industry and imports only small amounts from West Africa (160 tonnes) since 2013218 However using the job loss estimates applied to Mauritania we can see a loss to Senegal of $12 million Canada also imports FMFO from Peru where similar issues may arise but are out of scope for this study
Environmental costs
To estimate the environmental costs we have used data from studies that compare the use of IMTA technology with conventional salmon farming IMTA consists of farming in proximity aquaculture species from different trophic levels and with complementary ecosystem functions This strategy makes it possible for one speciesrsquo uneaten feed and wastes nutrients and by-products to be recaptured and turned into fertilizer feed and energy for the other crops219 The findings from this study suggest that the introduction of the IMTA salmon would increase the average household of those that do not consume salmon of between $255 per year and around $51 per year for five years Even in the most conservative estimate (eg where donrsquot knows were treated as no) the estimates are between $342 and $522 per year Using an average of these two most conservative estimates $432 and multiplying it by the number of households in Canada (based on the latest census data for that year)220 gives us an aggregate welfare increase of USD$307 million (Table 40) An average of the less conservative estimate gives a value of $627 million Separate calculations using Pollution Abatement Cost approach have been used in the main body of the report
215 Flaherty Mark et al ldquoPublic attitudes towards marine aquaculture in Canada insights from the Pacific and Atlantic coastsrdquo Aquaculture International 271 (2019) 9-32
216 Froehlich H E Gentry R R Rust M B Grimm D amp Halpern B S (2017) Public perceptions of aquaculture evaluating spatiotemporal patterns of sentiment around the world PloS one 12(1) e0169281
217 Flaherty Mark et al ldquoPublic attitudes towards marine aquaculture in Canada insights from the Pacific and Atlantic coastsrdquo Aquaculture International 271 (2019) 9-32
218 Greenpeace (2019) A Waste of Fish httpswwwgreenpeaceorginternationalpublication22489waste-of-fish-report-west-africa
219 Martinez-Espintildeeira R Chopin T Robinson S Noce A Knowler D amp Yip W (2016) A contingent valuation of the biomitigation benefits of integrated multi-trophic aquaculture in Canada Aquaculture economics amp management 20(1) 1-23
220 httpswww150statcangccan1daily-quotidien170913t001a-enghtm
60 - Appendices
Table 40 WTP for use of IMTA production system in Canada (MUSD)
Canada2013 2014 2015 2016 2017 2018 2019
$40 $40 $40 $46 $46 $46 $46
The indirect economic value of forage fish has been estimated at 113 billion globally or $219 per tonne (based on global landings of 515 million tonnes) Data are not available on the FIFO ratio for Canada Several authors have estimated FIFO ratios for forage fish to farmed salmon and estimated it to be around 51221 These data have been the subject of controversy however and have been rebutted by other studies222 Both found lower estimates of FIFO (21 and 0781 respectively) Canada has historically used fewer marine ingredients in its aquafeed than other countries and we have chosen therefore to use the most conversative FIFO ratio of 0781 Table 41 shows the tonnes of forage fish required to produce salmon in Canada and the associated annual cost Cumulatively the indirect cost of forage fish is $135 million
Table 41 Estimate of indirect cost of use of forage fish in salmon farming 2013-2019 (MUSD)
Canada2013 2014 2015 2016 2017 2018 2019
$16 $14 $20 $21 $20 $21 $20
Canadian government data show that almost 40000 salmon have escaped from salmon farms in Canada since records began223 Canada is home to seven different species of Pacific salmon as well as the Atlantic salmon on its eastern seaboard Both types of salmon have been experiencing a decades-long decline in returning stocks with 2019 being a particularly bad year for the Pacific salmon224 Findings on the impact of salmon farms on the wild population vary One study that compared the survival of wild salmon that travel near farms to those that donrsquot finding that upward of 50 per cent of the salmon that pass by farms donrsquot survive225 Other studies have found limited impact According to Nasco the Atlantic salmon has seen a 41 decline since the 1980s In total 436000 salmon returned to Canadian rivers in 2019226 a decline of 627415 If we assume 20 of this is because of salmon farming impacts (see Norway assumptions) this gives us a loss attributable to salmon farming of 188244 salmon over the period Using data from a Canadian study suggesting a USD$10 WTP per household we can estimate that the conservation value over the seven-year period is $187 million (see Table 42)
Table 42 Welfare loss from depletion of salmon stocks attributable to aquaculture
Canada2013 2014 2015 2016 2017 2018 2019
$24874940 $24874940 $24874940 $28144160 $28144160 $28144160 $28144160
221 Tacon AGL Metien M 2008 Global overview on the use of fish meal and fish oil in industrially compounded aquafeeds trends and future prospects Aquaculture 285 146ndash158 Welch A Hoenig R Stieglitz J Benetti D Tacon A Sims N amp OrsquoHanlon B (2010) From fishing to the sustainable farming of carnivorous marine finfish Reviews in Fisheries Science 18(3) 235-247
222 Byelashov Oleksandr A and Mark E Griffin ldquoFish in fish out Perception of sustainability and contribution to public healthrdquo Fisheries 3911 (2014) 531-535
223 httpsopencanadacadataendataset691dd994-4911-433d-b3b6-00349ba9f24e
224 httpswwwpacdfo-mpogccapacific-smon-pacifiquescienceresearch-recherche2019-summ-somm-enghtml
225 Ford J S amp Myers R A (2008) A global assessment of salmon aquaculture impacts on wild salmonids PLoS Biol 6(2) e33
226 Atlantic Salmon Federation (2020) 2020 STATE OF WILD ATLANTIC SALMON REPORT httpswwwasfcaassetsfilesasf-2020-state-of-population-v2pdf
61 - Appendices
As discussed elsewhere life cycle analysis of carbon emissions shows that Norway has the lowest impacts per unit production whereas impacts are consistently highest in the UK227 Several studies show that feed provision is the single most important contributor to resource use and emissions228 Carbon emissions have been estimated for Canadian salmon farms at 2300 kg of CO2 per tonne of salmon However as discussed in the main body of the report these are farmgate emissions which do not include emissions embedded in feedstuffs etc Using the Norwegian LCA data and the UKrsquos Department for Climate Change estimate of USD$72 per tonne gives us an estimate for Canada of USD$425 million (see Table 43)
Table 43 Climate change costs in Canadian salmon farming 2013-2019 (MUSD)
Canada2013 2014 2015 2016 2017 2018 2019
$52 $46 $65 $66 $64 $66 $64
Conclusion
A summary of the costs included in this study is provided in Table 44 As we can see this analysis gives us a total cost since 2013 of almost USD$23 billion
Table 44 Summary of costs for Canadian salmon farming 2013-2019 (MUSD)
Canada
Mortalities $768
Lice $111
FMFO $454
Total economic cost $1333Salmon stocks $187
Pelagic fish stocks $135
Local pollution $189
Climate change $425
Total environmental cost $936Fish welfare $97
Total social cost $97Total $2366
227 Pelletier N Tyedmers P Sonesson U Scholz A Ziegler F Flysjo A amp Silverman H (2009) Not all salmon are created equal life cycle assessment (LCA) of global salmon farming systems
228 Ibid
62 - Appendices
Appendix 4 ndash Chile
Although salmon is not a native species to Chile the climate in the southern part of the country offers suitable conditions for salmon farming which now represents the countryrsquos second largest export As with other regions the industry is seen as an important provider of jobs for people living in some of Chilersquos most remote communities The Chilean aquaculture industry has grown significantly since the late 1980s mainly farming salmon (Atlantic and coho) and trout229 According to Sernapesca total harvest for these species was the highest on record in 2019 with total salmon production reaching 907370 tonnes worth $73 billion230 Chile is the second largest producer of salmon with a share of about 25 globally231
In general regulations in Chile are weaker than in the other three countries For example there are no regulations based on carrying capacity estimates to limit maximum fish biomass per area or water body232 The level of antibiotics used in Chilersquos salmon farming industry is higher than in any other country in the world and is considered to have impacts on both animal welfare and the environment233 Profitability and growth have also been damaged by a series of crises relating to pollution escapes and mortalities In 2016 the industry experienced a crisis when heaps of dead fish washed ashore in Chiloeacute which according to Greenpeace was caused by salmon companies throwing 9000 tons of dead fish into the sea which were consumed by other wildlife234 In 2018 nearly 700000 were reported to have escaped into the wild and in 2020 the Marine Farm company notified SERNAPESCSA of an event that led to the death of ten thousand fish (43 tonnes) of fish because of an algal bloom235 In 2018 to boost production rules were relaxed (salmon farmers are now able to increase stocking by up to 9 per cycle up from 3)236 Although related to baseline fish health performance this creates risks for further health and welfare problems
Data on Chile are also far more limited and the impact of unintended outcomes is largely unquantified237 Production data have been accessed through Sernapesca As with Canada Chile does not publish annual mortalities data Although monthly mortalities data are available production data are published annually which makes it impossible to ascertain absolute mortalities In this study we have taken the average for Norway and Scotland and applied it to Chile We have no sense of how accurate this is for Chile but in the absence of official data this is the most plausible assumption
The costs of FMFO were estimated through by taking the total amount of feed used in salmon production as reported in the 2019 salmon industry handbook The data published are 2015-2018 and the missing years were extrapolated from those based on production statistics There are two sources of data on FMFO in meal in Chile The first is from the FAO238 for 2010 (20-25 FM and 12 FO) and second is from the salmon industry
229 Quinones R A Fuentes M Montes R M Soto D amp Leoacuten-Muntildeoz J (2019) Environmental issues in Chilean salmon farming a review Reviews in Aquaculture 11(2) 375-402
230 Fish Farming Expert (2019) Chile harvested nearly 1m tonnes of salmonids in 2019 httpswwwfishfarmingexpertcomarticlechilean-salmonid-production-close-to-1-million-tonnes-in-2019
231 Iversen A Asche F Hermansen Oslash amp Nystoslashyl R (2020) Production cost and competitiveness in major salmon farming countries 2003ndash2018 Aquaculture 522 735089
232 Quinones R A Fuentes M Montes R M Soto D amp Leoacuten-Muntildeoz J (2019) Environmental issues in Chilean salmon farming a review Reviews in Aquaculture 11(2) 375-402
233 Claudio Miranda Felix Godoy and Matthew Lee rdquoCurrent Status of the Use of Antibiotics and the Antimicrobial Resistance in the Chilean Salmon Farmsrdquo Frontiers in Microbiology June 18 2018 httpswwwfrontiersinorgarticles103389fmicb201801284ful
234 Haggebrink E (2020) Chilean Aquaculture Expansion into Troubled Waters httpswwwsustainalyticscomesg-blogchilean-aquaculture-expansion-into-troubled-waters_edn3
235 Mercopress (2020) Massive mortality of Atlantic salmon species in south Chilean farms httpsenmercopresscom20200416massive-mortality-of-atlantic-salmon-species-in-south-chilean-farms
236 Evans O (2018) New rules allow Chilean salmon farms to expand production by up to 9 httpssalmonbusinesscomnew-rules-allow-chilean-salmon-farms-to-expand-production-by-up-to-9
237 Poblete E G Drakeford B M Ferreira F H Barraza M G amp Failler P (2019) The impact of trade and markets on Chilean Atlantic salmon farming Aquaculture International 27(5) 1465-1483
238 Tacon A G Hasan M R amp Metian M (2011) Demand and supply of feed ingredients for farmed fish and crustaceans trends and prospects FAO Fisheries and Aquaculture technical paper (564) I
63 - Appendices
handbook for 2017 (9 FM and 7 FO)239 The intervening years have been estimated based on a linear decline These data suggest that Chilean salmon farming has greatly reduced its reliance on wild fish since 2013 The results of these calculations are set out in Table 45 Using the same commodity prices used elsewhere in the report we find a total cost to Chilean farmers since 2013 of just over USD$2 billion
Table 45 FMFO calculations Chile (2013-2019)
2013 2014 2015 2016 2017 2018 2019 Total
Atlantic salmon (t) 492329 644459 608546 532225 61418046 66113839 701984 4254862Feed (t) 997210 1312118888 1239000 1038000 1196000 1289000 1368635
FM 17 15 13 11 9 9 9
FO 10 9 8 8 7 7 7
FM (t) 166677 147445 128213 108981 89749 89749 89749 820562FO (t) 98296 91174 84051 76928 69805 69805 69805 559862Cost of FM (MUSD) 219 190 162 136 110 109 108 1037Cost of FO (MUSD) 205 176 151 130 102 139 101 1007
For the remaining calculations averages were generally used from other countries included in this analysis and the details of these calculations have been set out in the main body of the report
239 Mowi (2019) Salmon farming handbook 2019 httpsmlglobenewswirecomResourceDownload1766f220-c83b-499a-a46e-3941577e038b
64 - Appendices
justeconomicscouk
- _Hlk517025023
- _Hlk57026626
- _Hlk55901908
- _Hlk55901836
- _Hlk55905862
- _Hlk55901759
- _Hlk55896551
- _Hlk55896592
- _Hlk55577993
- _Hlk55578010
- _Hlk55578221
- _Hlk55578919
- _Hlk55898342
- _Hlk55898411
- _Hlk55901505
- _Hlk59182749
- _Hlk59183061
- Figure 1 Main causes of mortalities
- Abbreviations
- Executive summary
- 1 Introduction
- 2 Methodology
-
- 21 Overall approach
- 22 Limitations and caveats
-
- 3 Findings
-
- 31 Economic issues
- 32 Environmental issues
- 33 Social issues
-
- 4 Conclusions and recommendations
-
- 41 Conclusions
- 42 Recommendations
- Appendix 1 ndash Norway
- Appendix 2 ndash Scotland
- Appendix 3 ndash Canada
- Appendix 4 ndash Chile
-
- Table 1 Variables included and not included in country level analysis
- Table 2 Estimated mortalities and associated losses by producer (2010-2019)
- Table 3 Summary of costs for each variable by country (MUSD)
- Table 4 Variables included and not included in country level analysis
- Table 5 Mortality opportunity costs in Scotland Norway Canada and Chile
- Table 6 Costs of lice control measures across four countries (MUSD)
- Table 7 FMFO costs in four countries (MUSD)
- Table 8 Top ten salmon producing companies by revenue (2018) (MUSD)
- Table 9 Estimates of losses and associated costs (2010-2019)
- Table 10 Estimates for cost of sea lice for top ten producers 2013-2019 (MUSD)
- Table 11 Estimate of welfare loss to households from destruction of wild salmon stocks attributable to aquaculture (2013-2019)
- Table 12 Estimate of indirect cost of use of forage fish in salmon farming 2013-2019
- Table 13 Pollution Abatement Costs for four countries (MUSD)
- Table 14 Cumulative costs of CO2 emissions in salmon farming (MUSD)
- Table 15 Salmon welfare premium (MUSD)
- Table 16 Summary of costs (in MUSD)
- Table 17 Examples of positive benefits from salmon farming
- Table 18 Opportunity costs of mortalities in Norway
- Table 19 Cost of FMFO 2013-2019 (MUSD)
- Table 20 WTP calculation for higher fish welfare (MUSD)
- Table 21 Assumptions in social calculations for Mauritania
- Table 22 Estimate of annual pollution abatement cost
- Table 23 Loss of value as a result of forage fish being used in FMFO in Norway 2013-2019
- Table 24 Emissions costs
- Table 25 Summary of costs (MUSD)
- Table 26 Opportunity costs of Scottish mortalities 2013-2019thinsp
- Table 27 Estimate of cost of lice treatment in Scotland 2013-2019 (USD)
- Table 28 Cost estimates FMFO in Scottish salmon farming (MUSD)
- Table 29 Ownership of Scottish salmon farms
- Table 30 Fish welfare premium for Scottish and EU consumers (MUSD)
- Table 31 Willingness to pay for higher environmental standards 2013-2019 (MUSD)
- Table 32 Ecosystem value of forage fish used in Scottish salmon production (MUSD)
- Table 33 WTP estimates for restoration of salmon stocks
- Table 34 Estimates of CO2 emissions from Scottish salmon farms
- Table 35 Summary of costs (MUSD)
- Table 36 Opportunity costs of mortalities in Canada 2013-2019
- Table 37 Costs of sea lice treatment in Canada 2013-2019 (MUSD)
- Table 38 Cost of FMFO in Canada 2013-2019 (MUSD)
- Table 39 Estimate of WTP for poor salmon welfare (MUSD)
- Table 40 WTP for use of IMTA production system in Canada (MUSD)
- Table 41 Estimate of indirect cost of use of forage fish in salmon farming 2013-2019 (MUSD)
- Table 42 Welfare loss from depletion of salmon stocks attributable to aquaculture
- Table 43 Climate change costs in Canadian salmon farming 2013-2019 (MUSD)
- Table 44 Summary of costs for Canadian salmon farming 2013-2019 (MUSD)
- Table 45 FMFO calculations Chile (2013-2019)
-

3
ContentsAbbreviations 6
Executive summary 7
1 Introduction 17
2 Methodology 20
21 Overall approach 21
22 Limitations and caveats 22
3 Findings 24
31 Economic issues 25
32 Environmental issues 31
33 Social issues 37
4 Conclusions and recommendations 41
41 Conclusions 42
42 Recommendations 43
Appendix 1 ndash Norway 46
Appendix 2 ndash Scotland 52
Appendix 3 ndash Canada 57
Appendix 4 ndash Chile 62
4
Table of TablesTable 1 Variables included and not included in country level analysis 9
Table 2 Estimated mortalities and associated losses by producer (2010-2019) 10
Table 3 Summary of costs for each variable by country (MUSD) 13
Table 4 Variables included and not included in country level analysis 21
Table 5 Mortality opportunity costs in Scotland Norway Canada and Chile 25
Table 6 Costs of lice control measures across four countries (MUSD) 27
Table 7 FMFO costs in four countries (MUSD) 28
Table 8 Top ten salmon producing companies by revenue (2018) (MUSD) 29
Table 9 Estimates of losses and associated costs (2010-2019) 30
Table 10 Estimates for cost of sea lice for top ten producers 2013-2019 (MUSD) 31
Table 11 Estimate of welfare loss to households from destruction of wild salmon stocks attributable to aquaculture (2013-2019) 33
Table 12 Estimate of indirect cost of use of forage fish in salmon farming 2013-2019 34
Table 13 Pollution Abatement Costs for four countries (MUSD) 36
Table 14 Cumulative costs of CO2 emissions in salmon farming (MUSD) 37
Table 15 Salmon welfare premium (MUSD) 38
Table 16 Summary of costs (in MUSD) 42
Table 17 Examples of positive benefits from salmon farming 42
Table 18 Opportunity costs of mortalities in Norway 46
Table 19 Cost of FMFO 2013-2019 (MUSD) 47
Table 20 WTP calculation for higher fish welfare (MUSD) 48
Table 21 Assumptions in social calculations for Mauritania 48
Table 22 Estimate of annual pollution abatement cost 49
Table 23 Loss of value as a result of forage fish being used in FMFO in Norway 2013-2019 50
Table 24 Emissions costs (MUSD) 51
Table 25 Summary of costs (MUSD) 51
5
Table 26 Opportunity costs of Scottish mortalities 2013-2019 52
Table 27 Estimate of cost of lice treatment in Scotland 2013-2019 (USD) 53
Table 28 Cost estimates FMFO in Scottish salmon farming (MUSD) 53
Table 29 Ownership of Scottish salmon farms 54
Table 30 Fish welfare premium for Scottish and EU consumers (MUSD) 54
Table 31 Willingness to pay for higher environmental standards 2013-2019 (MUSD) 55
Table 32 Ecosystem value of forage fish used in Scottish salmon production (MUSD) 55
Table 33 WTP estimates for restoration of salmon stocks 56
Table 34 Estimates of CO2 emissions from Scottish salmon farms 56
Table 35 Summary of costs (MUSD) 56
Table 36 Opportunity costs of mortalities in Canada 2013-2019 57
Table 37 Costs of sea lice treatment in Canada 2013-2019 (MUSD) 58
Table 38 Cost of FMFO in Canada 2013-2019 (MUSD) 58
Table 39 Estimate of WTP for poor salmon welfare (MUSD) 59
Table 40 WTP for use of IMTA production system in Canada (MUSD) 60
Table 41 Estimate of indirect cost of use of forage fish in salmon farming 2013-2019 (MUSD) 60
Table 42 Welfare loss from depletion of salmon stocks attributable to aquaculture 60
Table 43 Climate change costs in Canadian salmon farming 2013-2019 (MUSD) 61
Table 44 Summary of costs for Canadian salmon farming 2013-2019 (MUSD) 61
Table 45 FMFO calculations Chile (2013-2019) 63
Table of figuresFigure 1 Main causes of mortalities 30
6
AbbreviationsCO2 ndash carbon dioxide
CV ndash contingent valuation
DHC ndash direct human consumption
EU ndash European Union
FAO ndash Food and Agriculture Organisation of the United Nations
FIFO ndash Fish In Fish Out
FM ndash fish meal
FO ndash fish oil
GDP ndash Gross Domestic Product
GVP ndash Gross Value Added
IMTA ndash Integrated Multi Trophic Aquaculture
ISSF ndash Inside Scottish Salmon Feedlots
LCA ndash life cycle analysis
mt ndash million tonnes
MUSD ndash million United States Dollars
NASCO ndash North Atlantic Salmon Conversation Organisation
NOK ndash Norwegian kroner
PAC ndash pollution abatement costs
RAS ndash Recirculating Aquaculture Systems
SEPA ndash Scottish Environmental Protection Agency
t ndash Tonnes
UK ndash United Kingdom
USD ndash United States Dollars
WTP ndash willingness to pay
7 - Executive Summary
Executive summarySalmon aquaculture is worth close to USD$20 billion annually but is dominated by a small number of multinational producers operating in just four farming regions ndash Chile Norway Canada and Scotland Not only is it already the fastest growing food production sector in the world but a continued global growth in demand is expected However it also generates considerable controversy which has seen demand growth slow in developed countries not least due to negative consumer perceptions of farmed salmon
8 - Executive Summary
Although the big four producing countries all have ambitious plans for growth these are endangered by economic environmental and regulatory pressures Governments in these countries are largely uncritical of their salmon farming industries and official literature tends to promote a positive image A typical narrative is that of a clean and healthy source of protein that is helping to revive coastal communities Beneath the marketing discourse however transparency and accountability are extremely weak by comparison with land-based farming Data are often absent on important phenomena such as mortalities escapes and environmental impacts The sector lacks robust regulation and proper social environmental and economic accounting which makes it difficult to assess its impacts holistically
The report has two aims therefore
bull To highlight the unnecessary costs borne by the salmon industry because of poor fish husbandry and welfare and to estimate potential savings from improved farming practices and
bull To estimate the social and environmental costs of the salmon industry and to estimate the value to consumers and wider society of reducing those costs by improving social and environmental performance
The study was commissioned by the Changing Markets Foundation as part of its Fishing the Feed campaign The research was carried out independently by Just Economics
Aquaculture is a diverse farming practice and we acknowledge that it can make a positive contribution to food security and livelihoods However as the research highlights there are significant problems with the highly industrialised intensive form that salmon farming currently takes The aim of this report is to draw attention to these issues by placing financial values on the costs they incur to highlight their scale and importance
The report focuses on the four big producing countries (which account for 96 of farmed salmon production) and the top ten producers globally (which account for 50 of production) In conducting the research we encountered significant data limitations Table 1 lists the variables that were included and excluded (although for the producer analysis data were only available on two variables salmon mortality and lice fighting technologies) Decisions to exclude variables were based on data availability rather than importance and future research should seek to address these data gaps
9 - Executive Summary
Table 1 Variables included and not included in country level analysis
Cost category Variables included Variables not included
Economic Salmon mortality
Use of marine ingredients in feed
Use of lice fighting technologies
Costs of pesticides and medicines
Loss of tourismeco-tourism income
Costs of cleaner fish
Social Salmon welfare
Economic impacts of fish use in aquafeed
Cleaner fish welfare
Healthsocial impacts of use of fish in aquafeed
Health impacts of antibiotic and pesticide use
Environmental
Depletion of wild salmon stocks
Partial biodiversity loss due to depletion of pelagic fish stocks
Impacts of local pollution
Climate change impacts
Full biodiversity impacts of krill pelagic fish and cleaner fish stock depletion
Loss of wild sea trout stocks
Environmental impacts of pesticides antibiotics and medicine use
Impacts of other feed ingredients such as soy
For each variable included we drew on existing research to estimate incidence for each countryproducer and cost These were modelled for the seven years to 2019 ie from the point at which the industry began to expand rapidly The findings for each variable are discussed in turn beginning with economic costs
Economic costsMortality rates on salmon farms are high with parasites (and their treatments) disease (and their treatments) pollution and escapes being the major contributing factors Although some mortalities are inevitable the rates have increased dramatically in recent years and far outstrip those found in other forms of intensive farming The factors that induce mortality are often directly related to the quality of fish husbandry and mortality could therefore be considered an indication (and cost) of poor farming practices Mortalities data are only available for Norway and Scotland The combined cost since 2013 of mortalities in these two countries is estimated at USD$98 billion (89 billion in Norway and almost 922 million in Scotland) If we apply the average mortalities for these two countries to Canada and Chile we get an estimate of USD$768 million and $49 billion respectively Using this methodology the total cost across the four countries is USD$155 billion representing a huge opportunity cost for farmers The analysis also shows that reducing mortalities to 55 - closer to mortality rates on egg-laying hen farms - in Norway would represent an annual saving of over $892 million USD (based on 2019 volumes and prices)
Even when parasites and disease do not result in deaths their treatment is costly and the presence of lice in particular is a barrier to sector expansion There are also clear consumer concerns about the use of medicines and chemicals to control them Lice and disease spread are hastened by high stocking densities which are designed to increase the productivity of farms However this is arguably a false economy Estimates of the cost of controlling lice alone is between 6 and 85 of the cost of production Using these data we estimate a cost to the sector from lice control of over $4 billion since 2013
10 - Executive Summary
Aquafeed is the single largest cost centre for salmon farmers with much of this being driven by the high cost of fish meal (FM) and fish oil (FO) which are derived from wild fish We estimate that the cumulative costs of using marine ingredients in salmon farming is over $8 billion in the four countries over the period (2013-2019)
We can also apply these estimates to the top ten producers which had combined total revenues of USD$12 billion dollars in 2018 By comparing the expected and actual harvest for these companies since 2010 (Table 2) we can see that between them they were responsible for the loss ndash through mortalities and escapes - of over half a million tonnes of salmon during this period (or about 100 million salmon) This equates to almost USD$37 billion In about 70 of cases the cause of mortality is either not known or not disclosed For the remaining 30 the leading cause is sea lice followed by disease and algal blooms (as a result of pollutants) Using a global estimate of 6 for the cost of combatting sea lice allows us to estimate a cost for these companies (UDS$35 billion since 2013)1 This gives a combined cost of mortalities and lice treatment of USD$71 billion or 12 of revenues over the period
Table 2 Estimated mortalities and associated losses by producer (2010-2019)
Company Volume of losses (tonnes) Cost (MUSD)
Seafood Mowi 252521 $1719
Leroy Seafood 66975 $456
Grieg Seafood 64992 $442
Australis 34042 $231
Blumar 32236 $219
Norway Royal Salmon 28342 $193
Bakkafrost 21058 $143
Salmar 15929 $108
Camanchaca 11550 $78
Seafood Invermar 9256 $63
Total 536901 $3656
Environmental costsSalmon farming is generating and running up against several environmental pressures which are inextricably linked to its commercial success and these are a major source of risk for the industry Atlantic salmon can only be farmed under certain conditions and as seas warm and available locations become exploited the industry is running out of viable sites for new farms This means that new sources of growth are dwindling creating pressure to locate farms in less suitable environments and to increase stocking densities which further exacerbate environmental pressures
1 In the previous section we report that the lice control estimates for the four countries is $4bn These were developed from lice treatment costs per kg whereas this figure derives from a percentage of revenue As discussed in the main body of the report the country-level analysis most likely underestimates the cost of lice
11 - Executive Summary
Aquaculture activities are an interconnected part of the ecosystem in which they exist and salmon farms make use of lsquofreersquo coastal ecosystem services such as clean water appropriate temperatures nutrient levels and so on They also contribute to their deterioration however due to local pollution impacts from uneaten feed and faeces which are directly discharged into the marine environment The Pollution Abatement Cost (PAC) measures the amount that would be required to preserve or restore a unit of an environmental good Unless the full PAC is accounted for salmon farms are lsquofree ridingrsquo on these environmental services A PAC has been calculated for Norwegian salmon farming Although one of the best environmental performers of the countries included here this still amounts to an economic cost of 35 of total production When this is applied across the four countries it gives us a total cost of over USD$4 billion since 2013
Salmon farming is also impacting negatively on wild fish stocks There are three ways in which this manifests damage to wild salmon stocks the use of pelagic fish in FMFO and the use of cleaner fish in parasite control
There have been serious concerns about the status of wild Atlantic salmon stocks for many years now and the numbers of returning salmon are at an all-time low Several studies have reviewed the social economic and cultural value of the Atlantic salmon which has an iconic status within communities along the Atlantic seaboard This value can be observed in contingent valuation studies that show high lsquoWillingness to Payrsquo (WTP) amongst households to protect and restore wild salmon stocks Although the reasons for declining salmon stocks are many and varied it is widely believed that salmon farming is a contributing factor Farms spread lice and disease to wild populations and pollute local areas through which returning salmon will sometimes pass Escaped farmed salmon also hybridise with wild populations and reduce their ability to survive in the wild Our economic analysis of the loss of salmon stocks attributable to salmon farms is focused on Canada Norway and Scotland where the contingent valuation studies have been carried out We find the value destroyed by salmon farming through loss of wild stocks to be USD$308 million
Pelagic fish are highly nutritious forage fish and are the main fish source used in the production of FMFO used in salmon feed Almost one-fifth of the worldrsquos annual wild fish catch is taken out of the ocean for this purpose the majority of which is used in seafood farming However (in addition to being a key source of protein for many coastal communities) forage fish also play a central role in the ecosystem as they are the primary food source for many marine mammals seabirds and larger fish and some species such as sardinella in West Africa are now heavily overfished Valuing their role in the ecosystem is extremely complex but just considering their contribution to the commercial catch of carnivorous species gives us an additional lsquohiddenrsquo value of $219 per tonne Applying this to FMFO use in our four countries gives us an indication of the ecosystem value of forage fish lost to fish farming (USD$178 billion over the seven years) Data suggest that the removal of wild fish from feed formulations has plateaued if this is the case we would expect to see these costs rise considerably in line with the expansion of production that is planned in all of the countries studied (a fivefold increase in Norway by 2050 and a doubling in Scotland by 2030 to give just two examples)
12 - Executive Summary
Compared with salmon there is limited research on cleaner fish and their biodiversity impacts and welfare are only discussed in a limited way in the literature More research is required therefore to fully account for the impacts of salmon farming on wild fish populations
Finally we consider climate change impacts Aquaculture is often positioned as a low carbon alternative to land-based farming and whilst the farmgate emissions are low relative to agriculture it is argued that these figures underestimate the true carbon cost once feed and airfreight are taken into consideration Life Cycle Analysis (LCA) provides a more complete estimate of carbon emissions because it includes impacts throughout the supply chain LCA of carbon emissions across producer countries shows that Norway has the lowest impacts whereas impacts are consistently highest in Scotland However due to data limitations we have applied the Norwegian LCA estimates to the four countries This analysis reveals that the minimum social cost of carbon from salmon farming in the four countries is almost USD$83 billion during the timeframe studied
Social issues
The main social issue included in this report is the impact on salmon welfare As we have seen farm profitability and salmon welfare are inextricably linked In the short-term there may be a financial incentive to take shortcuts with fish husbandry but over time these lead to disease lice stress and ultimately higher mortality rates which also result in financial losses It is therefore in the long-term interests of farms to keep densities at the optimum level for fish health and welfare and to adopt the highest farming standards Moreover there are strong and growing consumer preferences for high fish welfare especially in Europe A European study finds that the average European consumer would be willing to pay 14 more for salmon with higher welfare standards If we apply this to European and Canadian consumers of salmon (where attitudes are similar) we get a value of $46 billion2
The final cost considered is the impact of diverting forage fish away from direct human consumption (DHC) in low and middle-income countries for use in the FMFO industry in large part to feed European aquaculture Countries such as those along the West African seaboard have significant food security issues In addition the growth of the FMFO industry may lead to net economic losses because of the loss of jobs in traditional fishing and food preparation (especially for women) Finally as already discussed these waters are already heavily fished and further declines in the catch will disproportionately affect local fishing communities Data limitations mean it was difficult to value these financial losses However a case study for Norway which imported 84 thousand tonnes of fish oil from Mauritania in 2018 shows a loss to Mauritania in 2019 of USD$375 million
Conclusions and recommendationsThe demand for seafood is expected to increase in coming years and part of this will have to be met by increased aquaculture production Fish farming has the potential therefore to be a significant source of social economic and environmental value but farming practices matter greatly and determine whether the industry can be considered a net loss or net benefit to society Although we encountered significant data gaps this analysis has allowed us to place a value on some of the costs of salmon farming as currently practiced It suggests that salmon aquaculture has produced private and external costs of USD$47 billion since 2013 (see Table 3 for a summary of these) When we segment these into private and external costs we can see that around 60 fall to producers and 40 to wider society (USD$28 billion and USD$19 billion respectively)
2 Studies of welfare tend to be conducted amongst consumers rather than producer citizens and the calculations have been focused on these consumers where data are available and animal welfare issues are most salient
13 - Executive Summary
Table 3 Summary of costs for each variable by country (MUSD)
Canada Norway Chile Scotland Total
Mortalities 768 8908 4939 922 15539
Lice 111 2142 1647 463 4365
FMFO 454 4832 2045 859 8192
Total economic cost 1333 15969 8631 2233 28096
Salmon stocks 187 52 Insufficient data 68 308
Pelagic fish stocks 135 665 302 680 1784
Local pollution 189 2328 1268 288 4073
Climate change 425 5224 2282 425 8356
Total environmental cost 936 8269 3852 1461 14521
Fish welfare 97 3675 Insufficient data 902 4674
Total social cost 97 3675 Insufficient data 902 4674
Total 2366 27913 13304 4596 47291
Considering the full range of costs and benefits may well demonstrate positive benefits from aquaculture (and even salmon farming) Yet what this report shows is that there are substantial costs that are not currently included on the balance sheet and that the scope for improved environmental and social performance is considerable In addition a combination of growing environmental impacts consumer demand for ethical and environmentally friendly products and direct losses from poor fish husbandry are creating long run economic risks to the industry that can only be mitigated by investing in better farming practices and reduction of environmentally harmful aspects such as use of wild-caught fish
Our recommendations focus on the four most significant stakeholders in salmon farming governments investors farmers and consumers each of which has a role to play in transitioning to a more sustainable aquaculture and food system
For governments
Economic benefits of salmon farming need to be balanced against other coastal industries such as tourism angling and wider environmental impacts Governments should be prepared to support alternative technologies that improve social and environmental standards as these are likely to be net beneficial in the long run
Better oversight and more robust regulation of salmon farming should lead over time to competitive advantage as consumers increasingly seek out more ethical and environmentally friendly products Governments can lead the way on this by restricting licences to companies that meet higher social and environmental standards
The industry would benefit from guidelines for sustainable feed ingredients along with stricter due diligence and governance frameworks in aquafeed supply chains Governments should also support the phase-out of whole wild-caught fish for use in aquafeed Furthermore aquaculture that relies on wild-caught fish should not receive any subsidies or other public support measures Policy should support the development of alternative technologies (for feedstuffs and farming methods) and provide effective economic incentives
14 - Executive Summary
Governments should also require more transparent reporting in this industry and should resist industry pressure not to publish mortalities data that are in the public interest In addition consumers increasingly expect transparency in supply chains and companiessectors which fail to respond to that expectation will place themselves at a disadvantage in the market
More generally there is a need to improve the quality of social economic and environmental accounting in salmon farming This would have the dual benefit of supporting more holistic decision-making and incentivising better farming practices By revealing costs and benefits governments could create a race to the top amongst salmon farmers and a level playing field for small producers that may be operating to higher standards At a minimum governments (eg in Scotland) should refrain from making a priori economic arguments in favour of salmon farming given the narrowness of these arguments and their responsibilities to a wider group of stakeholders
For investors
As a result of growing environmental and regulatory pressures investment decisions are required that drive a rapid transition towards alternative feeds and better farming practices These already exist but require more investment to make them viable in the short-term
Although the risks of existing farming practices are often understood investors continue to support them due to short-term returns This creates a barrier to the adoption of new technologies and improved practices and investors need to take a long-term view This may involve accepting lower returns in the short term but as discussed in this paper issues with both supply and demand should create competitive advantage in the long run
For farmers
Mortalities lice treatments and disease are creating huge costs for farmers and damaging the reputation of farmed salmon Significant opportunities exist to dramatically improve the environmental and social performance of salmon production through a focus on the development of least-environmental cost (as opposed to least-economic-cost) feed formulations These technologies exist - and have been shown to work - and producers could appeal to the growing consumer demand for an ethical product by being early adopters of these formulations As the cost of marine ingredients is expected to increase these may also prove to be a lower cost alternative in the medium term
As demonstrated in this report poor fish husbandry is a false economy as it leads to significant direct and indirect costs We recommend therefore that farmers adopt better husbandry such as stocking densities commensurate with higher survival rates
For consumers
Salmon was once a high value food that was only available in season and consumed on special occasions In line with the need for investment from all stakeholders some consumers should also be prepared to pay more for salmon where their economic circumstances allow andor to consume it less frequently As part of this consumers could seek out alternatives to carnivorous fish such as molluscs that provide dietary and economic benefits at lower social economic and environmental costs
and 50 of production controlled by 10 multinational companies
annually with 96 of productionconcentrated in just four countries
Salmon aquaculture is worth close to
with the top 10 producers responsible for 100 million salmon deaths and escapes since 2013
Mortality rates on salmon farms are high with the major contributing factors being
Estimated cost of mortalities is
48
DISEASE
PARASITES
POLLUTION
ESCAPES
Aquafeed is the single largest cost centre for salmon farmers driven by the high cost of fishmeal and fish oil (FMFO) derived from wild fish We estimate over the period 2013-2019 that the cumulative costs of using marine ingredients in salmon farming is over
Lice and disease spread are a result of high stocking densities designed to increase productivity This is arguably a false economy since 2013 lice control alone has cost the sector over
The false economy of poor farming practices on salmon farms
Read the full report at justeconomicscoukdeadloss
CANADA CHILENORWAY SCOTLAND
billion
Yet there is a strong lsquowillingness to payrsquo amongst consumers in the four countries to preserve wild salmon As a result we estimate a loss to communities of since 2013
Salmon farming is also contributing to the decline of wild salmon through
LICE amp DISEASE SPREAD POLLUTION HYBRIDISATION
The false economy of poor farming practices on salmon farms continued
Read the full report at justeconomicscoukdeadloss
is the estimated cost of pollution for the four countries since 2013 Pollutants from salmon aquaculture include
uneaten feed and faeces which are directly discharged into the marine environment
Is the estimated social cost of carbon from salmon farming Although positioned as a low carbon alternative to meat life cycle analysis reveals a higher cost than reported
Since 2013 the unaccounted cost of salmon farming across the four countries is over
Consumers in Europe and Canada have shown a high willingness to pay for better fish welfare We estimate the cost of poor fish welfare at
A partial valuation of the ecosystem benefits of forage fish lost to fish farming due to the use of FMFOis around
18 6
8347
17 - Introduction
1 IntroductionSalmon farming is a highly concentrated industry Just four countries - Canada Chile Scotland and Norway ndash account for 96 of global production3 Moreover 50 of all farmed salmon globally is produced by just ten publicly traded farmed salmon companies with combined revenues of $12 billion in 20184
3 FAO (2019) The State of World Fisheries and Aquaculture httpwwwfaoorgstate-of-fisheries-aquaculture
4 Planet Tracker (2020) Loch-ed profits httpsplanet-trackerorgtracker-programmesoceansseafoodloch-ed
18 - Introduction
Historically salmon farming has been a highly profitable industry so much so that salmon has become the largest single fish by commodity value5 Between 2012 and 2016 salmon stock prices appreciated by 435 per year6 Consumer demand is also expected to grow in both developed and developing markets in the coming years7 More recently however the industry is encountering economic environmental and regulatory pressures that endanger future growth After years of remarkable financial performance productivity growth has slowed and market risks have increased These have been compounded in 2020 by the Covid-19 pandemic which has seen the price of salmon slump due to oversupply8
Aquaculture lacks proper social and environmental reporting which could improve decisions about where when and under what conditions salmon farming is desirable9 In its absence salmon farmers are incentivised to pursue short-run commercial ends10
which create long-run economic social and environmental risks11 Some of these are direct costs from poor fish welfare (eg mortalities resulting from poor fish husbandry or damaged consumer demand) whereas others are indirect such as pollution-induced mortalities of farmed fish These will ultimately increase the cost of doing business and most likely impact on consumer preferences for farmed salmon both of which will affect the future profitability of the sector
The aim of this report is to address the limitations in reporting by estimating the private and external costs of the industry The research is scoped to only consider salmon farming and associated costs We acknowledge that wider aquaculture has many positive impacts especially in low-income countries where research finds positive impacts on livelihoods and food security12 Salmon farming has also been found to generate public and private benefits These include consumer and producer surplus Consumer surplus refers to the benefits of being able to purchase cheaper salmon (which is an important - albeit not the only - source of omega 3 oils and animal proteins) and producer surplus to the profits made by producers There are also benefits to governments through tax transfers and local communities which receive some benefit from industry and employment
However there are large number of stakeholders affected by salmon farming and each groupentity bears different costs and benefits Economic analyses are often conducted from the perspective of a limited number of stakeholders (eg focusing on employment benefits13 but excluding costs borne by other coastal stakeholders)14 To counter this this study focuses largely on the costs that have often been excluded from economic analyses to date
5 Ibid
6 Misund B amp Nygaringrd R (2018) Big fish Valuation of the worldrsquos largest salmon farming companies Marine Resource Economics 33(3) 245-261
7 Gephart J A Golden C D Asche F Belton B Brugere C Froehlich H E amp Klinger D H (2020) Scenarios for global aquaculture and its role in human nutrition Reviews in Fisheries Science amp Aquaculture 1-17
8 Intrafish (2020) Larger sizes cause salmon prices to plunge again amid COVID-19 impacts httpswwwintrafishcomcoronaviruscovid-19-live-farmed-salmon-prices-plunge-again-alaska-pollock-gets-a-lift-beijing-issues-warning2-1-746616
9 Georgakopoulos G amp Thomson I (2005 March) Organic salmon farming risk perceptions decision heuristics and the absence of environmental accounting In Accounting Forum (Vol 29 No 1 pp 49-75) No longer published by Elsevier
10 Aanesen M amp Mikkelsen E (2020) Cost-benefit analysis of aquaculture expansion in Arctic Norway Aquaculture Economics amp Management 24(1) 20-42
11 Taranger G L Karlsen Oslash Bannister R J Glover K A Husa V Karlsbakk E amp Madhun A S (2015) Risk assessment of the environmental impact of Norwegian Atlantic salmon farming ICES Journal of Marine Science 72(3) 997-1021
12 Beacuteneacute C Arthur R Norbury H Allison E H Beveridge M Bush S amp Thilsted S H (2016) Contribution of fisheries and aquaculture to food security and poverty reduction assessing the current evidence World Development 79 177-196
13 Riddington G Radford A and Gibson H (2020) The Economic Contribution of Open Cage Salmon Aquaculture to Scotland A Review of the Available Economic Evidence httpswwwsalmon-troutorgwp-contentuploads202004Riddington-Radford-Gibson-Economic-Contribution-of-Salmon-Aquaculture-to-Scotlandpdf
14 Young N Brattland C Digiovanni C Hersoug B Johnsen J P Karlsen K Mhellip Thorarensen H (2019) Limitations to growth Social-ecological challenges to aquaculture development in five wealthy nations Marine Policy 104 216ndash224
19 - Introduction
The report has two aims therefore
bull To highlight to key stakeholders the unnecessary costs borne by the salmon industry because of poor fish husbandry and welfare and to estimate potential savings from improved farming practices and
bull To estimate the wider social and environmental costs of the salmon industry and to estimate the value to consumers and wider society of reducing those costs by improving social and environmental performance
The study was commissioned by the Changing Markets Foundation as part of its Fishing the Feed campaign The research was carried out independently by Just Economics
The report provides a focus on each of the four main producer countries We begin with a short summary of the issues in salmon farming before going on to describe the methodology We then discuss each country in turn and conclude with a set of recommendations for investors governments farmers and consumers
20 - Methodology
2 MethodologyThe analysis focuses on the four top salmon producing countries Norway Scotland Chile and Canada as well as the top ten producers In this section we describe the overall approach before going on to discuss the limitations and caveats
21 - Methodology
21 Overall approach
For the country analysis we have identified the most material economic social and environmental costs connected to salmon farming and researched an appropriate data source or plausible assumption to derive a value for that cost In many areas we encountered significant data limitations and it has not been possible to include all costs in every instance Table 4 sets out the variables that were included and not included in the country level analysis Even where it was possible to include a variable in the analysis we did not always have sufficient data on each country to develop a full estimate These are detailed below in the summary A full methodology for each country is available in the appendices
Table 4 Variables included and not included in country level analysis
Cost category Variables included Variables not included
Economic
Fish mortality
Use of marine ingredients in feed
Use of lice fighting technologies
Costs of pesticides and medicines
Loss of tourismeco-tourism income
Social
Salmon welfare
Economic impacts of fish use in aquafeed
Cleaner fish welfare
Healthsocial impacts of use of fish in aquafeed
Health impacts of antibiotic and pesticide use
Environmental
Welfare loss of depleted salmon and partial biodiversity loss of pelagic fish stocks
Impacts of local pollution
Climate change impacts
Full biodiversity impacts of krill pelagic fish and cleaner fish stock depletion
Loss of wild sea trout stocks
Environmental impacts of pesticides antibiotics and medicine use
Impacts of other feed ingredients such as soy
For the top ten producers data were even less readily available We focused this analysis therefore solely on two of the most material economic costs the opportunity cost of fish mortality and the cost of lice fighting technologies
We also sought throughout the analysis to adopt the most conservative assumptions This combined with limited data on key variables means that the estimates presented here most likely underestimate the full social economic and environmental costs of salmon farming For most of the variables we have estimated the impacts from 2013 when production began to expand more rapidly and mortality rates began to increase15 For example in Norway mortality increased steadily from 109 in 2013 to 145 in 201916 A key variable used in the analysis is the price of salmon Salmon prices will vary considerably by country producer brand and so on These price variations run the risk of masking variations in outcomes (fish husbandry pollution and so on) between countries To avoid this we have standardised the value of salmon across the four countries and
15 Planet Tracker (2020) Loch-ed profits httpsplanet-trackerorgtracker-programmesoceansseafoodloch-ed
16 Statistics Norway 07516 Fish farming Loss in fish for food production by fish species (C) 1993 ndash 2019 httpswwwssbnoenstatbanktable07516tableViewLayout1
22 - Methodology
the top producers by using the annual average IMF salmon export price17 This allows us to hold the price of salmon constant which enables more accurate comparisons between countries However it may over- or underestimate costs in certain areas
For each variable we have estimated the scale of the problem produced by the salmon industry and identified a method of valuing the cost of this impact For the economic costs this was relatively straightforward For example for mortalities we have taken annual mortalities since 2013 and multiplied them by the price salmon fetched in that same year For the environmental costs we have mainly relied on the findings from studies by environmental economists that have estimated life cycle costs or pollution abatement costs of salmon farms However for some variables where studies were not available we have also generated assumptions rooted largely in the academic literature These assumptions have been documented in the discussion below
Of the three categories of costs social costs are the most challenging to estimate In this section we have mainly relied on stated preference method (SPM) SPM refers to a family of tools and techniques used in cost benefit analysis to estimate the value of non-market-traded goods and services18 In general terms respondents are asked to rank rate or choose between different hypothetical scenarios that contain a mix of different attributes How people value those different attributes ndash their willingness to pay (WTP) - can then be inferred from the choices they make Stated preference methods are useful for estimating lsquonon-use valuersquo Whereas lsquouse valuersquo is derived from the consumption of a good or service non-use value quantifies the benefit we derive from goods or service that we cannot consume19 There are different forms of non-use value that are relevant here These include
bull Existence value - the benefit we derive from knowing that a phenomenon exists even if we may never directly encounter it (eg an endangered species)
bull Option value - captures the value we derive from preserving a particular resource base for future generations and
bull Bequest value - refers to the value we place on being able to bequeath it to future generations
This approach is especially apposite for valuing phenomena like fish welfare and wild fish stocks which we know are of significant value to consumers including those within the top producer countries of Norway Canada and Scotland20
22 Limitations and caveats
The study was limited substantially by data limitations especially for Chile In some instances assumptions had to be used (eg extrapolated from other countries) Whilst we always sought to do these in a plausible way this is always a second-best option A second limitation is that the analysis only takes account of costs The study has been scoped as such but it could be developed in the future into a more holistic cost benefit study A third caveat is that the study is limited only to salmon which is already a well-researched type of aquaculture Aquaculture is a diverse industry involving many kinds of seafood farmed in different ways by different types of farmers This ranges from artisanal family-owned producers in developing countries to industrial-scale farming usually operating transnationally Although salmon farming is largely dominated by
17 httpsdataimforgsk=471DDDF8-D8A7-499A-81BA-5B332C01F8B9
18 Carson Richard T and W Michael Hanemann ldquoContingent valuationrdquo Handbook of environmental economics 2 (2005) 821-936
19 Pearce D W amp Turner R K (1990) Economics of natural resources and the environment JHU press
20 Riepe C Meyerhoff J Fujitani M Aas Oslash Radinger J Kochalski S amp Arlinghaus R (2019) Managing river fish biodiversity generates substantial economic benefits in four European countries Environmental management 63(6) 759-776
23 - Methodology
the latter this is not the case for other species This study does not therefore draw any wider conclusions about aquaculture more generally Finally although the study draws on evidence from alternative technologies and alternative feeds it does not model the relative costs of using these approaches The study mostly considers mainstream practice as it has operated over the past seven years However the authors acknowledge that there are lots of innovations in the industry many of which have the potential to improve social and environmental outcomes These will be considered again in the conclusions and recommendations sections
24 - Findings
3 FindingsIn this section we summarise the findings for both the country-and producer-level analyses This synthesises the data from the individual studies to create estimates that are largely global given the dominance of these four countries in global production We present these according to the three cost categories beginning with economic issues We also include costs for the top ten producers with a full write up for each country available in the appendices
25 - Findings
31 Economic issues
There are three economic variables that we consider
bull Opportunity costs of mortalitiesbull Cost of marine ingredients in feedbull Cost of lice fighting technologies
Opportunity costs of mortalities
Mortality rates on salmon farms are high and represent a substantial opportunity cost to salmon farmers21 Major contributing factors are lice disease and their treatments as well as algal blooms and warming seas Salmon are also lost through escapes and many mortalities are unexplained22 Annual mortality statistics are only available for Norway and Scotland and both countries have seen increases in their rates since 2013 as the industry generates and runs up against increasing environmental pressures These stem from licedisease-induced mortalities and warming seas but also the fact that most of the available viable sites in both countries have already been exploited and there is a shortage of suitable coastline for open net cage farming23
To estimate the opportunity cost for the two countries we have taken the annual salmon losses and multiplied them by the salmon price for each year These results are displayed in Table 5 The combined cost since 2013 of these mortalities is USD$98 billion If we apply the average mortalities for these two countries to Canada and Chile we get an estimate of USD$768 million and $49 billion respectively Using this methodology the total cost across the four countries is USD$155 billion
Table 5 Mortality opportunity costs in Scotland Norway Canada and Chile
2013 2014 2015 2016 2017 2018 2019 Total
International salmon price (USD per kg)
$672 $660 $531 $714 $744 $752 $692
Norway
Total harvest (mt) 1168 1258 1303 2133 1236 1282 1357
Mortalities (t) 127347 145969 177255 309375 180508 164096 196809
Percentage losses 11 12 14 15 15 13 15
Value of losses (MUSD) 855 983 940 2208 1343 1234 1409 8908
Scotland
Total harvest (mt) 160 179 170 163 189 156 190
Mortalities (t) 10329 16046 18302 22245 25460 16573 25772
Percentage losses 640 900 1080 1360 1340 1060 1350
Value of losses (MUSD) 67 106 97 158 189 124 177 922
Canada
Total harvest (mt) 97 86 121 123 120 123 120
Value of losses (MUSD) 53 59 81 143 147 130 152 768
Chile
Total harvest (mt) 636 803 735 643 778 809 907
Value of losses (MUSD) 368 620 533 670 954 769 1022 4939
21 Soares S Green D M Turnbull J F Crumlish M amp Murray A G (2011) A baseline method for benchmarking mortality losses in Atlantic salmon (Salmo salar) production Aquaculture 314(1-4) 7-12
22 Planet Tracker (2020) Dashboard The Salmon Aquaculture Industry httpsplanet-trackerorgdata-dashboardsoceanssalmon
23 Terazono E (2017) Norway turns to radical salmon farming methods Financial Times httpswwwftcomcontenta801ef02-07ba-11e7-ac5a-903b21361b43
26 - Findings
Although the total figure relies on an estimate from Scotland and Norway we know that salmon farms everywhere are experiencing similar environmental pressures because of poor fish husbandry environmental practices and global warming Indeed in Chile we would expect higher mortalities due to less stringent environmental regulations and a high incidence of lice infestation in recent years24 Even if we restrict the analysis to Norway and Scotland the exercise reveals the scale of the economic cost this represents The mortality rate of juveniles is expected to be even higher but there is poor reporting of mortality in hatcheries25 It is not possible therefore to include estimates of juvenile losses in this study and the figures presented here are therefore likely to underrepresent the scale and cost of salmon mortality
Unfortunately it is also expected that high mortalities will continue to be a problem for the industry Whilst some mortalities are expected in any farming practice salmon mortalities are high by the standards of other commonly farmed species Studies of other aquaculture species have found survival rates of up to 99 once stocking densities are kept low26 27 In addition mortality rates on egg laying hen farms are between 5 and 628 It is interesting to note that reducing mortalities to 55 on salmon farms in Norway would represent an annual saving of $892 million USD (based on 2019 volumes and prices)
Lice fighting technologies
Parasite and disease fighting technologies also represent a major cost to the industry But they are also a function of poor fish husbandry and therefore a potentially avoidable cost There are also clear consumer concerns about the use of medicines and chemicals to control diseases and parasites29 When fish farms have high stocking densities ndash that is fish are crowded together in a small environment with poor water flow - the spread of infectious diseases is hastened30 It also increases fish stress and makes them more susceptible to disease Moreover lice are more likely to spread rapidly in these conditions and natural methods of removing lice such as going upriver are not available to the salmon
In this section we aggregate our estimates of the cost of using lice fighting technologies to slow the spread of parasites Due to data limitations we have not included the cost of disease control methods However as we will see addressing the lice threat represents a substantial cost on its own
There are two means by which sea lice create costs for farmers First lice have been shown to reduce fish growth and appetite31 and second damage control measures can be costly and some (such as delousing) can directly cause mortalities (as a result of stress from handling and secondary infections)32 Cleaner fish are endorsed by some as a more natural alternative to medication but (leaving aside the impacts on their welfare) they are an ongoing cost as they are euthanised at the end of each growing cycle at which point a new crop are required In addition questions have been raised over their efficacy at reducing lice on a national scale33
24 Mowi (2019) Annual Report httpscorpsiteazureedgenetcorpsitewp-contentuploads202003Mowi_Annual_Report_2019pdf
25 Dyrevern (2019) New report reveals unnaturally high mortality in aquaculture hatcheries httpsdyrevernnodyrevernnew-report-reveals-unnaturally-high-mortality-in-aquaculture-hatcheries
26 Hayat M A Nugroho R A amp Aryani R (2018) Influence of different stocking density on the growth feed efficiency and survival of Majalaya common carp (Cyprinus carpio Linnaeus 1758) F1000Research 7
27 Ronald N Gladys B amp Gasper E (2014) The effects of stocking density on the growth and survival of Nile tilapia (Oreochromis niloticus) fry at son fish farm Uganda Journal of Aquaculture Research and Development 5(2) 222
28 Anon (nd) Understanding Mortality Rates of Laying Hens in Cage-Free Egg Production Systems httpswwwhumanesocietyorgsitesdefaultfilesdocsmortality-cage-free-egg-production-systempdf
29 Zander K amp Feucht Y (2018) Consumersrsquo willingness to pay for sustainable seafood made in Europe Journal of international food amp agribusiness marketing 30(3) 251-275
30 Nicholson B (2006) Fish Diseases in Aquaculture The Fish Site httpsthefishsitecomarticlesfish-diseases-in-aquaculture
31 Abolofia J Asche F amp Wilen J E (2017) The cost of lice quantifying the impacts of parasitic sea lice on farmed salmon Marine Resource Economics 32(3) 329-349
32 httpsonlinelibrarywileycomdoi101111raq12299
33 httpswwwsciencedirectcomsciencearticleabspiiS0020751920300126
27 - Findings
To ensure that we are not double counting the cost of mortalities we have limited our analysis in this section to the cost of damage control measures albeit these are only a portion of the costs For Norway cost estimates have already been generated by Nofima which estimates that the annual cost is in the region of USD$475 million34 This includes an estimated Kr15 billion on cleaner fish (based on a cost of Kr12 per Kg of salmon produced)35
For the other three countries we drew on estimates developed by Costello36 This data (presented as cost per kg) was uprated from 2006 to todayrsquos prices We also used the Nofima estimate to derive a cost per kg for Norway (which is similar to the estimates developed by Costello) We expect that these costs are conservative as they have been estimated elsewhere for Norway at 9 of revenues37 These are multiplied by the kg produced each year to get an annual estimate As we can see from Table 6 the total for all four countries since 2013 is over USD$4 billion
Table 6 Costs of lice control measures across four countries (MUSD)
YearCost per kg Canada
Cost per kg Scotland
Cost per kg Chile
Cost per kg Norway
Total cost Canada (MUSD)
Total cost Scotland (MUSD)
Total cost Chile (MUSD)
Total cost Norway (MUSD)
Total (MUSD)
2013 $0112 $036 $028 $024 $12 $57 $176 $240 $487
2014 $0114 $037 $029 $023 $11 $66 $232 $265 $576
2015 $0116 $037 $030 $0224 $16 $62 $222 $280 $582
2016 $0117 $037 $031 $022 $17 $60 $199 $469 $746
2017 $0119 $040 $032 $022 $17 $75 $247 $271 $612
2018 $0122 $040 $033 $021 $17 $62 $263 $295 $639
2019 $0125 $041 $034 $024 $17 $78 $304 $319 $720
Total (MUSD) $111 $463 $1647 $2142 $4365
Use of marine ingredients
Aquafeed is the largest single cost centre for salmon farmers making up between 50 and 70 of costs38 Salmon farmers face rising costs of feed This is perhaps greatest for fish meal (FM) and fish oil (FO) which are derived from wild fish Due to the economic and environmental costs of using marine ingredients their use has declined dramatically since 1990 when 90 of the feed was of marine origin39 The amount of FMFO still varies today across the countries from 10-145 in Norway to 12-18 for Canada and 15-25 in Scotland (based on latest available data)40 41 42 A recent report for Chile reports that marine ingredients make up 7-943
In later sections we will explore the social and environmental implications of the use of FMFO in aquafeed Here we consider the economic costs To calculate these data we drew on various sources of feed composition from the grey and academic literature These are detailed for each country in the relevant appendix The tonnage of FMFO was then
34 Nofima (2017) High lice costs rising feed prices ndash and expensive land-based facilities httpsnofimanoenforskningnaringsnyttehigh-lice-costs-rising-feed-prices-and-expensive-land-based-facilities
35 Nofima estimate of Kr12 per kg of salmon (based on 13 billion kg in 2018) httpsthefishsitecomarticlescounting-the-true-cost-of-combatting-sea-lice
36 Costello Mark ldquoThe global economic cost of sea lice to the salmonid farming industryrdquo Journal of fish diseases 321 (2009) 115
37 Abolofia J Asche F amp Wilen J E (2017) The cost of lice quantifying the impacts of parasitic sea lice on farmed salmon Marine Resource Economics 32(3) 329-349
38 FAO (2018) The State of World Fisheries and Aquaculture 2018 httpwwwfaoorgdocumentscardencI9540EN
39 See Ytrestoslashyl T Aas T S amp Aringsgaringrd T (2015) Utilisation of feed resources in production of Atlantic salmon (Salmo salar) in Norway Aquaculture 448 365-374
40 Shepherd C J Monroig O amp Tocher D R (2017) Future availability of raw materials for salmon feeds and supply chain implications The case of Scottish farmed salmon Aquaculture 467 49-62
41 Aas TS et al 2019 Utilization of feed resources in the production of Atlantic salmon (Salmo salar) in Norway An update for 2016 Aquaculture Reports 2019 vol 15
42 Sarker P K Bureau D P Hua K Drew M D Forster I Were K amp Vandenberg G W (2013) Sustainability issues related to feeding salmonids a Canadian perspective Reviews in Aquaculture 5(4) 199-219
43 Mowi (2019) Salmon farming handbook 2019 httpsmlglobenewswirecomResourceDownload1766f220-c83b-499a-a46e-3941577e038b
28 - Findings
multiplied by the price of each commodity in the given year44 The results are displayed in Table 7 As we can see the cumulative costs are over USD$8 billion over the period
Table 7 also shows that the costs of FMFO has remained relatively stable over the period This is in spite of the fact that the Fish inFish out (FIFO) ratio has decreased (especially in Chile) As demand for salmon has continued to rise the total amount of wild fish required has remained high It demonstrates that unless marine ingredients are largely replaced as feed the pressures on wild fish stocks will continue to increase in line with demand for salmon
Table 7 FMFO costs in four countries (MUSD)
2013 2014 2015 2016 2017 2018 2019 Total
Norway FM cost $435 $428 $403 $346 $342 $350 $369 $2676
Norway FO cost $335 $335 $324 $288 $249 $352 $270 $2156
Scotland FM cost $64 $70 $66 $62 $71 $58 $70 $466
Scotland FO cost $61 $63 $56 $51 $51 $57 $50 $393
Canada FM cost $23 $30 $36 $35 $37 $41 $40 $246
Canada FO cost $19 $26 $30 $29 $32 $35 $34 $208
Chile FM cost $219 $190 $162 $136 $110 $109 $108 $1037
Chile FO cost $205 $176 $151 $130 $102 $139 $101 $1007
Total cost $1366 $1321 $1232 $1081 $998 $1144 $1047 $8192
The reduction in the use of FMFO is driven partly by concern over impacts on wild fish stocks but also by increasing costs45 Most observers agree that as wild fish stocks come under increased pressure and as the aquaculture industry expands the costs of FMFO are set to rise 46 47A variety of alternate proteins have been identified to partially replace fishmeal and fish oil These include insect feed algae and bacterial protein Analyses of the price differential between alternative and traditional feeds finds that the former are currently more expensive 48 However there are promising results from trials on the use of these feeds One producer estimates that they could produce bacterial protein as an alternative feed for $1000 per tonne49 which is substantially less than the 2019 fish meal price of $1418 In addition significant investment is going into the alternative feed industries to scale production of these alternatives The expectation is that over time they will be price competitive and eventually cheaper than FMFO Insect meal has an added benefit of being generated by breaking down food waste into fats and proteins It is estimated that food waste leads to pound500 billion in lost value annually and Black Soldier Fly larvae can reduce food waste volume by up to 95 over a rapid two-week growing cycle50
In the short term the environmental benefits of using this highly promising insect meal in fish feed do not align with the economic interests of the aquaculture industry However in principle this positive externality could be incorporated into any social and environmental accounting of the aquaculture industry were these feeds to replace FMFO thereby (as will be discussed below) improving the social return from this industry
44 Commodity prices were taken from the World Bank httpswwwindexmundicomcommoditiescommodity=fish-mealampmonths=120ampcurrency=eur EUFMA
45 Davidson J Barrows F T Kenney P B Good C Schroyer K amp Summerfelt S T (2016) Effects of feeding a fishmeal-free versus a fishmeal-based diet on post-smolt Atlantic salmon Salmo salar performance water quality and waste production in recirculation aquaculture systems Aquacultural Engineering 74 38-51
46 Holland J (2017) Algae becoming increasingly relevant due to soaring fishmeal and fish oil demand prices httpswwwseafoodsourcecomnewssupply-tradealgae-becoming-increasingly-relevant-due-to-soaring-fishmeal-and-fish-oil-demand-prices
47 FAO (2020) Early closure of the Peruvian fishing season pushes prices up httpwwwfaoorgin-actionglobefishmarket-reportsresource-detailenc1268631
48 Arru B Furesi R Gasco L Madau F A amp Pulina P (2019) The introduction of insect meal into fish diet the first economic analysis on European sea bass farming Sustainability 11(6) 1697
49 Filou E (2020) Move over fishmeal Insects and bacteria emerge as alternative animal feeds httpsnewsmongabaycom202004move-over-fishmeal-insects-and-bacteria-emerge-as-alternative-animal-feeds
50 Cordis (2017) Investigating the commercial feasibility of a novel biological enhancement technology for creating a sustainable high value insect-derived protein supplement for the EU aquaculture market httpscordiseuropaeuprojectid775922reportingit
29 - Findings
Costs for top ten producers
Table 8 lists the top ten salmon producers by revenues in 201851
Table 8 Top ten salmon producing companies by revenue (2018) (MUSD)
Company name HQ Total revenues in 2018 (MUSD)
Mowi Norway $4502
Leroy Seafood Norway $2783
Salmar Norway $1395
Grieg Seafood Norway $922
Norway Royal Salmon Norway $625
Bakkafrost Faroe Islands $504
Blumar Chile $503
Australis Chile $361
Camanchaca Chile $332
Invermar Chile $230
Source Planet Tracker
The total revenues for these companies in 2018 were USD$12157 billion dollars In this section we calculate the expected losses to these companies stemming from two highly material costs mortalities and lice fighting technologies As discussed elsewhere lice outbreaks and mortalities from disease escapes predators and parasites are an indicator of both poor fish husbandry and sub-optimal fish welfare These estimates will demonstrate that they also have a direct economic cost
Using data from Planet Trackerrsquos Salmon Dashboard Database it is possible to calculate the number of mortalities and escapes by comparing the expected and actual harvest since 201052 These data are drawn from the annual reports of the companies in question Table 9 shows the results of these calculations As we can see there has been a difference of over half a million tonnes of salmon between actual and expected harvest over this period This equates to almost USD$37 billion as set out in Table 2 (based on the average of the international salmon prices since 2010) Our estimate for the top four producing countries is USD$155 billion (see earlier discussion) Given that these countries make up 96 of global production we might expect the cost to be closer to USD$775 billion There are two potential explanations First there were gaps for several years in the dashboard and due to the lack of transparencyagreed methodologies for reporting on mortalities there may well be other inconsistencies The second is that salmon farmers assume a minimum amount of mortalities per number of smolts released into pens and most likely incorporate this into their harvest calculations In this scenario the difference between expected and actual harvests is therefore a measure of excess deaths rather than total deaths As a result of both of these scenarios the volumes and costs reported here may well underestimate the total losses from mortalities
51 Planet Tracker (2020) Loch-ed profits httpsplanet-trackerorgtracker-programmesoceansseafoodloch-ed
52 Planet Tracker (2020) Dashboard The Salmon Aquaculture Industry httpsplanet-trackerorgdata-dashboardsoceanssalmon
30 - Findings
Table 9 Estimates of losses and associated costs (2010-2019)
Company Volume of losses (tonnes) Cost (MUSD)
Seafood Mowi 252521 $1719
Leroy Seafood 66975 $456
Grieg Seafood 64992 $442
Australis 34042 $231
Blumar 32236 $219
Norway Royal Salmon 28342 $193
Bakkafrost 21058 $143
Salmar 15929 $108
Camanchaca 11550 $78
Seafood Invermar 9256 $63
Total 536901 $3656
These data also allow us to consider the main reasons for mortalities These are displayed in Figure 1 As we can see almost half are unexplained and in almost 20 no reason is given Unexplained mortalities are those for which the cause of death has not been established unlike those where no reason has been stated in the report It is unclear as to why this proportion is so high given that research shows it should be possible to provide reasons in the vast majority of cases53 The other 30 of causes are split between algal blooms (9) disease (11) and sea lice (15) In addition over 2000 tonnes of escapes were reported which equates to 400000 adult salmon (assuming they are harvested at about 5kg)54
Figure 1 Main causes of mortalities
Unexplained
No reason
Sea lice
Disease
Algal blooms
46
19
15
11
9
The biggest known contributor to mortalities for these companies is therefore sea lice Substantial amounts of money are spent to combat sea lice including cleaner fish delousing and freshwater bathing They are also a major contributor to mortalities (from the process of delousing as well as the parasites themselves) and a bottleneck to further expansion due to regulations designed to minimise lice infestations55
In our country-level analyses we used data from Costello (2009) (see above) to estimate the costs of treating sea lice This study arrived at a global estimate of 6 of total revenues Using this estimate we can also estimate the costs of parasite control to the top salmon producers Table 10 shows the revenues for each company since 2013 along with the parasite control estimates Revenues have been adjusted for companies that produce commodities other than salmon (eg Blumar) All revenue data are extracted
53 Aunsmo A Bruheim T Sandberg M Skjerve E Romstad S amp Larssen R B (2008) Methods for investigating patterns of mortality and quantifying cause-specific mortality in sea-farmed Atlantic salmon Salmo salar Diseases of aquatic organisms 81(2) 99-107
54 Anon (2017) Salmon Farming Industry Handbook httpwwwmowicomglobalassetsinvestorshandbook2018-salmon-industry-handbookpdf
55 Kragesteen T J Simonsen K Visser A W amp Andersen K H (2019) Optimal salmon lice treatment threshold and tragedy of the commons in salmon farm networks Aquaculture 512 734329
31 - Findings
from the companiesrsquo annual reports and converted into dollars at current exchange rates56 As we can see the total cost of combatting sea lice costs these companies almost USD$35 billion since 201357
Table 10 Estimates for cost of sea lice for top ten producers 2013-2019 (MUSD)
Company 2013 2014 2015 2016 2017 2018 2019 Total
AustralisRevenues $266 $272 $191 $347 $395 $360 $433 $2268
Cost of sea lice $15 $16 $11 $20 $23 $21 $26 $136
BakkafrostRevenues $391 $421 $447 $502 $591 $498 $708 $3561
Cost of sea lice $23 $25 $35 $30 $26 $30 $35 $206
CamanchacaRevenues $251 $278 $262 $352 $334 $324 $272 $2077
Cost of sea lice $15 $16 $15 $21 $20 $19 $16 $124
Norway Royal Salmon
Revenues $275 $31 $339 $447 $522 $537 $591 $2746
Cost of sea lice $16 $19 $20 $26 $31 $32 $35 $164
Grieg Seafood
Revenues $254 $282 $487 $692 $742 $793 $878 $4132
Cost of sea lice $15 $16 $29 $41 $44 $47 $52 $247
Salmar LeroyRevenues $1139 $1331 $1423 $1827 $1971 $2099 $2162 $11955
Cost of sea lice $68 $79 $85 $109 $118 $125 $129 $717
MowiRevenues $2972 $3694 $3766 $4247 $4415 $4612 $5004 $28711
Cost of sea lice $178 $221 $225 $254 $264 $276 $300 $1210
InvermarRevenues $99 $134 $67 $144 $219 $229 $173 $1069
Cost of sea lice $59 $8 $4 $86 $13 $13 $10 $64
BlumarRevenues $217 $270 $195 $230 $197 $302 $234 $1647
Cost of sea lice $13 $16 $117 $138 $11 $18 $14 $98
Together with the opportunity cost of mortalities set out above we can see that the combined cost to top 10 producers is over USD$71 billion This compares with total revenues of USD$58 billion since 2013 or 12 of total revenues over that period
32 Environmental issues
Salmon farming is running up against several environmental pressures which are inextricably linked to its commercial success and these are a major source of risk for the industry We have already seen how poor fish husbandry leads to increased outbreaks of disease parasites and ultimately mortality Poor environmental stewardship also contributes directly to mortalities There are also indirect environmental risks Atlantic salmon can only be farmed under certain conditions and as seas warm and available sites become exploited the industry is running out of viable sites This means that new sources of growth are dwindling This creates pressure to locate farms in less suitable environments and to increase stocking densities which further exacerbate environmental pressures In addition negative public perceptions of farmed salmon as an ethical product impact on consumer demand This section will summarise these indirect costs and demonstrate how improved environmental outcomes could improve welfare and reduce costs We consider four specific environmental impacts
bull Welfare loss of depleted salmonbull Biodiversity loss of pelagic fish stocksbull Impacts of local pollution andbull Climate change impacts
56 These vary compared to revenues in Table 8 vary due to different exchange rates at the time of writing
57 In the previous section we report that the lice control estimates for the four countries is $4bn These were developed from lice treatment costs per kg whereas this figure derives from a percentage of total revenue As discussed earlier the country-level analysis most likely underestimates the cost of lice
32 - Findings
Welfare loss of depleted salmon
Salmon farming impacts on fish stocks in three ways Two of these have already been touched on the use of pelagic fish in FMFO and the use of cleaner fish in parasite control The third is the impact on wild salmon and trout stocks58 A recent study found that the presence of a salmon farm can lead to an average of 12-29 fewer adult wild salmon in the local area59 Salmon farms create risks to wild fish in several ways
bull Hybridisation - This is where escaped farmed salmon breed with the wild populations reducing their ability to survive in the wild Research suggests that these effects are likely to be passed on to future generations60
bull Inducing mortality by spreading lice and diseasebull Local pollution
There has been serious concern about the status of wild Atlantic salmon stocks for many years now The numbers of returning salmon have been plummeting61 and reports from 2020 show that they are now at an historic low62 Whilst progress has been made in managing the interactions between farmed and wild salmon serious risks remain and large-scale escapes are still regularly reported from salmon farms with Chile and Norway accounting for 60 of the largest escapes63 In this section we seek to value the loss of wild salmon stocks and estimate the damage that is attributable to salmon farms
In a review of the literature on the social economic and cultural value of Atlantic salmon Myrvold et al argue that this iconic fish provides humans with a range of values benefits and gifts64 The review identified 41 studies of the different values of wild Atlantic salmon published between 2009 and 2019 Although these are dominated by economic studies relative (for example) to studies of cultural value it is nonetheless clear that the salmon has played - and continues to play - a role in the social environmental and cultural life of communities along the Atlantic seaboard The loss of habitat experienced by wild salmon - and driven in part by the expansion of aquaculture - is therefore something we would expect the public to be concerned about This is confirmed by several contingent valuation studies on willingness to pay for salmon conservation In a survey of the Canadian public Pinfold65 demonstrated over 80 support for investments in salmon restoration in the range of $450 to $1250 per tax-paying household translating into a total economic value of $57 million In a US study of the non-market benefits of the Pacific Coho salmon the authors66 found that a programme aimed at increasing numbers of returning salmon can generate sizable benefits of up to $518 million per year for an extra 100000 returning fish even if the species is not officially declared recovered It also found that the public attaches additional benefits to achieving conservation goals quickly Studies such as these have prompted NASCO67 to claim that non-use values such as existence and bequest values may now substantially exceed values associated with recreational angling which themselves exceed the commercial value of salmon as food
58 It has been noted that mortality of sea trout is likely to be higher than in wild salmon because they usually remain in coastal waters where fish farms are situated (see Thorstad E B amp Finstad B (2018) Impacts of salmon lice emanating from salmon farms on wild Atlantic salmon and sea trout)
59 Thorstad E B amp Finstad B (2018) Impacts of salmon lice emanating from salmon farms on wild Atlantic salmon and sea trout
60 Hindar K Fleming I A McGinnity P amp Diserud O (2006) Genetic and ecological effects of salmon farming on wild salmon modelling from experimental results ICES Journal of Marine Science 63(7) 1234-1247
61 Nasco (2020) State of North Atlantic Salmon httpsnascointwp-contentuploads202005SoS-final-onlinepdf
62 Atlantic Salmon Federation (2020) 2020 State of Wild Atlantic Salmon Report httpswwwasfcaassetsfilesasf-2020-state-of-population-v2pdf
63 Navarro L (2019) Here are the largest recorded farmed salmon escapes in history Intrafish httpswwwintrafishcomaquaculturehere-are-the-largest-recorded-farmed-atlantic-salmon-escapes-in-history2-1-388082
64 Myrvold K M Mawle G W Andersen O amp Aas Oslash (2019) The Social Economic and Cultural values of wild Atlantic salmon A review of the literature for the period 2009-2019 and an assessment of changes in values
65 Pinfold G (2011) Economic Value of Wild Atlantic Salmon Prepared by Gardner Pinfold Accessed online httpswwwasfcaassetsfilesgardner-pinfold-value-wild-salmonpdf
66 Lewis D J Dundas S J Kling D M Lew D K amp Hacker S D (2019) The non-market benefits of early and partial gains in managing threatened salmon PloS one 14(8) e0220260
67 Nasco (2020) The value of salmon Accessed online httpwwwnascointvalue_changeshtml
33 - Findings
Using these studies it has been possible to place a value on the welfare costs to communities of the destruction of wild salmon stocks The full methodology for each country is set out in the appendices In summary one study has found that lice from salmon farms kill 50000 wild salmon in Norway per year68 If we assume that a similar number are killed due to infectious diseases this gives us a total of 100000 salmon at risk from salmon farms We have excluded the impacts of escaped salmon as the impacts are still not well understood We also know that there are half a million fewer salmon returning to Norwegian rivers each year than there were in the 1980s69 Using these data we can estimate that 20 of the losses are as a result of salmon farming This is also close to the midpoint of estimates for the Thorstad and Finstad study (2018) As we know the reductions in returning salmon in Scotland and Canada we can apply these estimates to those countries also to work out the number of salmon potentially affected Neither Atlantic nor Coho salmon are native to Chile and as a result we have not included Chile in this calculation There are however significant concerns about the environmental impacts of farming non-native species in Patagonia which is one of the worldrsquos most pristine ecosystems70
To estimate the welfare loss we have taken an average WTP of three studies from households in Canada the UK and Ireland ($10 $20 and $18 respectively)71 These represent the amount households would be willing to pay to restore salmon stocks We then estimate a WTP to restore wild salmon stocks at the household level A fifth of this cost gives us an annual cost to the three societies cumulatively (see Table 11)72 The total welfare loss based on this calculation is USD$308 million This is higher for Canada than Norway and Scotland due to the larger number of households included in the calculation
Table 11 Estimate of welfare loss to households from destruction of wild salmon stocks attributable to aquaculture (2013-2019)
2013 2014 2015 2016 2017 2018 2019
Norway $7228141 $7316624 $7413270 $7544038 $7674806 $7805574 $7805574Scotland $9601368 $9664056 $9719772 $9784684 $9850944 $9909100 $9982492Canada $24874940 $24874940 $24874940 $28144160 $28144160 $28144160 $28144160
Biodiversity loss of pelagic and cleaner fish stocks
Pelagic fish are forage fish that are highly nutritious and are the main fish source used in the production of fishmeal and fish oil Almost one-fifth of the worldrsquos annual marine wild-fish catch is taken out of the ocean for this purpose73 and in 2016 69 of fishmeal and 75 percent of fish oil were used for seafood farming74 Of this the vast majority is used in salmonid aquaculture75 However forage fish also play a central role in the ecosystem as they are the primary food source for many marine mammals seabirds and larger fish76 with one study finding that three-quarters of ecosystems studied had
68 Castle S (2017) As Wild Salmon Decline Norway Pressures Its Giant Fish Farms New York Times httpswwwnytimescom20171106worldeuropesalmon-norway-fish-farmshtml
69 Norwegian Scientific Advisory Committee for Atlantic Salmon (29019) Status of wild Atlantic salmon in Norway 2019 Accessed online httpswwwvitenskapsradetnoPortalsvitenskapsradetPdfStatus20of20wild20Atlantic20salmon20in20Norwaypdf
70 Bridson P (2014) Monteray Bay Aquarium Seafood Watch Accessed online httpsseafoodoceanorgwp-contentuploads201610Salmon-Atlantic-Coho-Salmon-Chilepdf
71 Myrvold K M Mawle G W Andersen O amp Aas Oslash (2019) The Social Economic and Cultural values of wild Atlantic salmon A review of the literature for the period 2009-2019 and an assessment of changes in values Lillehammer Norwegian Institute for Nature Research
72 Household data taken from httpswwwnrscotlandgovukstatistics-and-datastatisticsstatistics-by-themehouseholdshousehold-estimates2019
73 Changing Markets Foundation (2019) Fish for Catastrophe httpchangingmarketsorgwp-contentuploads201910CM-EX-SUMMARY-FINAL-WEB-FISHING-THE-CATASTROPHE-2019-pdf
74 FAO (2020) How fish is used Accessed online httpwwwfaoorgstate-of-fisheries-aquaculture~text=How20is20fish20used3Ffood20purposes20(Figure202)
75 Sarker P K Kapuscinski A R Vandenberg G W Proulx E Sitek A J amp Thomsen L (2020) Towards sustainable and ocean-friendly aquafeeds Evaluating a fish-free feed for rainbow trout (Oncorhynchus mykiss) using three marine microalgae species Elementa Science of the Anthropocene 8
76 Freacuteon P Cury P Shannon L amp Roy C (2005) Sustainable exploitation of small pelagic fish stocks challenged by environmental and ecosystem changes a review Bulletin of marine science 76(2) 385-462
34 - Findings
at least one highly andor extremely dependent predator77 Although these fish may have historically been undervalued this low commercial price has failed to take account of their wider economic and environmental value Forage fish comprise 35-30 of global fish landings78 (FAO 2015 data from 2011 to 2013) with an annual catch value of $56 billion USD79 (compared with the catch value of $877 billion USD for all marine fisheries80
Forage fish provide a range of ecosystem services that are external to the market value of the fish therefore Measuring and valuing these benefits holistically is challenging given the interconnected and complex nature of the marine ecosystem One proxy that we can consider is the estimate for the indirect value of forage fish (ie its contribution to the value of the commercial catch of predators which is estimated to be worth $113 billion) If we assume that this is based on global landings of about 515 million tonnes81
this gives us a figure of $219 per tonne It is possible therefore to place a proxy value on the ecosystem loss of the total use of forage fish in each of the countries included in this analysis These calculations are set out in Table 12 As we can see the total indirect cost of the use of forage fish in salmon farming is almost USD$18 billion
Table 12 Estimate of indirect cost of use of forage fish in salmon farming 2013-2019
2013 2014 2015 2016 2017 2018 2019
Canada $16676986 $14749795 $20827399 $21100028 $20592863 $21042291 $20621445
Scotland $90328324 $100740000 $95674860 $91735307 $106765828 $87809824 $107211560
Norway $97333014 $100206774 $98997243 $89165197 $89362881 $92662362 $98105070
Chile euro58139715 euro52357001 euro46574288 euro40791574 euro35008861 euro35008861 euro35008861
These figures only considered ex-vessel prices of predator fish dependent on forage fish However this is very likely an underestimate of the full economic benefits of predator fish (eg downstream benefits such as the supply chains of processors distributors and end consumers)82 It also most likely underestimates wider ecosystem benefits to nonmarket predators such as seabirds seals and so on As well as the existence value of these species discussed elsewhere there can be additional economic benefits such as ecotourism revenue (whale watching bird watching etc)83 As pointed out by Koehn et al focusing on the costs for fisheries is only part of the cost benefit analysis84 Froehlich et al assess whether FMFO use can circumvent forage fish limits (eg through greater consistent inclusion of fish byproducts) They find that this is possible by the middle of the 21st century However global shifts towards more pescatarian diets will make this impossible and increase the requirement for long-term nutrient equivalent feed sources85
The final wild fish impact is on cleaner fish These are fish with a specialist feeding strategy which involves removing lice from infested salmon There are two main species used lumpfish and wrasse These fish had limited commercial value until their function as cleaner fish in captivity was discovered and their use has increased dramatically in the last decade as a result of salmonrsquos evolving resistance to pharmaceutical
77 Pikitch E Boersma PD Boyd IL Conover DO Cury P Essington T Heppell SS Houde ED Mangel M Pauly D Plagaacutenyi Eacute Sainsbury K and Steneck RS 2012 Little Fish Big Impact Managing a Crucial Link in Ocean Food Webs Lenfest Ocean Program Washington DC 108 pp
78 FAO (Food and Agriculture Organization of the United Nations) (2015) The state of world fisheries and aquaculture Opportunities and challenges
79 Pikitch E K Rountos K J Essington T E Santora C Pauly D Watson R amp Cury P (2014) The global contribution of forage fish to marine fisheries and ecosystems Fish and Fisheries 15(1) 43-64
80 Sumaila U R Cheung W Dyck A Gueye K Huang L Lam V amp Zeller D (2012) Benefits of rebuilding global marine fisheries outweigh costs PloS one 7(7) e40542
81 Ibid
82 Christensen V Steenbeek J amp Failler P (2011) A combined ecosystem and value chain modelling approach for evaluating societal cost and benefit of fishing Ecological Modelling 222(3) 857ndash864
83 Koehn L E Essington T E Marshall K N Sydeman W J Szoboszlai A I amp Thayer J A (2017) Trade-offs between forage fish fisheries and their predators in the California Current ICES Journal of Marine Science 74(9) 2448-2458
84 Ibid
85 Froehlich H E Jacobsen N S Essington T E Clavelle T amp Halpern B S (2018) Avoiding the ecological limits of forage fish for fed aquaculture Nature Sustainability 1(6) 298-303
35 - Findings
treatments86 In order to prevent disease transmission cleaner fish are culled at the end of the production cycle meaning that new fish are needed when the next production cycle begins87 The capture of wild fish has led to stock depletion88 and farming of cleaner fish is now underway However as with salmon there is evidence of farmed cleaner fish escaping and hybridising with local populations89 Compared with salmon there is limited research on cleaner fish their biodiversity impacts and welfare are mentioned in passing but not widely studied The main economic value of lumpfish has been for their roe but this is a niche and limited market Several wrasse species are commonly used as display fish due to their vibrant colours It is also interesting to note as Erkinharju et al point out90 that a species of wrasse has recently been reported as the first fish to seemingly pass the mirror mark test a behavioural technique used to measure and determine whether an animal possesses self-awareness Although the study has received criticism such findings may have implications for fish welfare and subsequently the use of cleaner fish in aquaculture Despite this due to the uncertainty around potential impacts it has not been possible to quantify any cleaner fish costs in this study However more research is required on the implications of use of both wild and farmed cleaner fish especially in light of survey findings showing that fish farmers question whether cleaner fish are an effective delousing method that actually results in fewer delousing operations91
Impacts of local pollution
Aquaculture activities are an interconnected part of the ecosystem in which they exist and salmon farms make use of lsquofreersquo coastal ecosystem services such as fresh clean water appropriate temperatures nutrient levels and so on92 They also contribute to their deterioration however as a result of local pollution impacts Pollutants from salmon aquaculture consist of uneaten feed and faeces which are directly discharged into the marine environment These result in eutrophication from the accumulation of nutrients like phosphorous and nitrogen or what are known as algal blooms These can lead to large mortality events and the economic costs of these has been at least partly included above
For the environmental impacts there are two available methods to estimate their costs the pollution abatement cost (PAC) consumer WTP for higher environmental standards Data exist on the former for Norway and the latter for Canada and Scotland However to increase consistency between the countries we have used the PAC and applied the Norwegian figure to the other three countries
The pollution abatement cost (PAC) measures the amount that would be required to preserve or restore a unit of the environmental good in question 93 Unless the full PAC is accounted for salmon farms are lsquofree ridingrsquo on free environmental services Liu et al have found the PAC for Norway to be 35 of total salmon production94 Although a little out of date we know that algal blooms are a continuing - and perhaps worsening - problem for Norwegian aquaculture (in 2019 8 million salmon were killed in an algal
86 Faust E Halvorsen K T Andersen P Knutsen H amp Andreacute C (2018) Cleaner fish escape salmon farms and hybridize with local wrasse populations Royal Society Open Science 5(3) 171752
87 Erkinharju T Dalmo R A Hansen M amp Seternes T (2020) Cleaner fish in aquaculture review on diseases and vaccination Reviews in Aquaculture
88 Kennedy J Durif C M Florin A B Freacutechet A Gauthier J Huumlssy K amp Hedeholm R B (2019) A brief history of lumpfishing assessment and management across the North Atlantic ICES Journal of Marine Science 76(1) 181-191
89 Faust E Halvorsen K T Andersen P Knutsen H amp Andreacute C (2018) Cleaner fish escape salmon farms and hybridize with local wrasse populations Royal Society Open Science 5(3) 171752
90 Erkinharju T Dalmo R A Hansen M amp Seternes T (2020) Cleaner fish in aquaculture review on diseases and vaccination Reviews in Aquaculture
91 The Norwegian Institute of Marine Research is also concerned about the methodrsquos lack of documented effectiveness httpsnorwegianscitechnewscom202004cleaner-fish-being-sacrificed-in-the-fight-against-salmon-lice
92 Custoacutedio M Villasante S Calado R amp Lilleboslash A I (2020) Valuation of Ecosystem Services to promote sustainable aquaculture practices Reviews in Aquaculture 12(1) 392-405
93 Nikitina E (2019) Opportunity cost of environmental conservation in the presence of externalities Application to the farmed and wild salmon trade-off in Norway Environmental and resource economics 73(2) 679-696
94 Liu Y amp Sumaila U R (2010) Estimating pollution abatement costs of salmon aquaculture a joint production approach Land Economics 86(3) 569-584
36 - Findings
bloom in just a few days)95 Due to the lack of comparable data for the other countries we have also applied this estimate As with Norway the evidence would suggest that algal blooms continue to be a problem for the other three countries In addition environmental standards are at least as high (and in many cases higher) in Norway than the other countries Separate calculations on WTP for higher environmental standards have been calculated for Scotland and Canada and are provided in the appendices Table 13 provides details of the PACs for each country
Table 13 Pollution Abatement Costs for four countries (MUSD)
2013 2014 2015 2016 2017 2018 2019 Total
Norway $274 $290 $242 $533 $322 $337 $328 $2328
Scotland $37 $41 $31 $40 $49 $41 $46 $288
Canada $22 $19 $22 $30 $31 $32 $29 $189
Chile $149 $185 $136 $160 $202 $213 $219 $1268
As we can see from Table 13 the estimate for cumulative local pollution costs across the four countries is over USD$4 billion
Climate change impacts
Although aquaculture is often positioned as a sustainable alternative to other forms of farming there are substantial CO2 emissions from air freight and aquafeed which are not usually accounted for in environmental reports Whilst the farmgate emissions from aquaculture are low relative to agriculture it is argued that these estimates underestimate the true carbon cost96 Life cycle analysis provides a more complete estimate of carbon emissions because it includes impacts throughout the supply chain Life cycle analysis of carbon emissions across producer countries shows that Norway has the lowest impacts per unit production whereas impacts are consistently highest in the UK due to the embedded carbon in the feedstuffs used97 Several studies also show that feed provision is the single most important contributor to resource use and emissions98
Sintef have estimated the full CO2 emissions for Norway including previously uncounted impacts These include the impacts of the use of soy in fish feed and its impact on deforestation in Brazil (all of Norwayrsquos soy is sourced in Brazil) It also takes account of air freight in the distribution of salmon which is increasing due to the increased importance of China as a consumer of Norwegian salmon The total carbon emissions produced by the sector are 9685 million tonnes (or about 8 kg of carbon per kg of salmon) There are various methods for costing carbon emissions and a wide literature on the appropriate valuations to use If we conservatively use the carbon tax applied by Norway to fishing to this figure ($27 USD per tonne) we get an annual value of $255 million per year99 However this value is substantially higher when a social cost of carbon is applied Table 14 shows the emissions costs associated with each of the four countries based on the Norwegian LCA data and using the UKrsquos Department for Climate Change estimate of USD$72 per tonne100 This gives a total cumulative emissions cost of USD$83 billion An important caveat here is that these estimates are certainly lower than emissions from alternative protein sources such as land-based animals However the purpose of the
95 Magra I (2019) Millions of Salmon in Norway Killed by Algae Bloom New York Times Accessed online httpswwwnytimescom20190523worldeuropesalmon-norway-algae-bloomhtml
96 Newton R W amp Little D C (2018) Mapping the impacts of farmed Scottish salmon from a life cycle perspective The International Journal of Life Cycle Assessment 23(5) 1018-1029
97 Pelletier N Tyedmers P Sonesson U Scholz A Ziegler F Flysjo A amp Silverman H (2009) Not all salmon are created equal life cycle assessment (LCA) of global salmon farming systems
98 Ibid
99 Bruvoll A and Dalen H (2009) Pricing of CO2 emissions in Norway Accessed online httpswwwssbnoaenglishpublikasjonerpdfdoc_200916_endoc_200916_enpdf
100 Defra (2006) The social cost of carbon (SCC) review httpsassetspublishingservicegovukgovernmentuploadssystemuploadsattachment_datafile243816aeat-scc-reportpdf
37 - Findings
section is to highlight that emissions from this industry are higher than the industry tends to claim
Table 14 Cumulative costs of CO2 emissions in salmon farming (MUSD)
2013 2014 2015 2016 2017 2018 2019
Norway $626 $674 $699 $1144 $663 $687 $728
Scotland $86 $96 $91 $87 $101 $83 $102
Canada $52 $46 $65 $66 $64 $66 $64
Chile $264 $345 $326 $285 $329 $354 $376
33 Social issues
In this section we consider two of the main social concerns relating to salmon farming
bull Salmon welfare and bull Impacts of diverting pelagic fish away from direct human consumption for use
in FMFO
Salmon welfare
Salmon welfare is a result among other things of the fishrsquos health environment farming methods and routines and is a direct function of factors such as stocking density prevalence of parasites and disease and water quality101 Given that these factors also determine profitability fish welfare is arguably negatively correlated with profitability in the short-term However there is also a long run economic argument to be made There is plenty of evidence that poor fish husbandry increases mortality and the need for costly disease and lice fighting technologies102 Moreover there are strong and growing consumer preferences for ethically produced seafood especially in Europe103 In Norway for example surveys have found that animal welfare is more important to consumers than other ethical consideration such as organic local production and environmental standards104 Although it may not be as high on the agenda as land-based animal welfare a Eurobarometer survey from 2016105 found that two-thirds of adults across nine European markets agree that fish are sentient and that fish feel negative emotions In addition animal husbandry issues are gaining weight in consumersrsquo food choices including preferences for higher fish welfare106 although this tends to be higher for consumers who understand sustainability issues consume seafood regularly and have higher incomes
These consumer preferences can be incorporated into an economic analysis using contingent valuation studies The calculation applied to Norway Scotland and Canada was based on an estimate that the average European consumer was willing to pay a price premium of 14 for salmon with higher welfare standards 107 In Table 4 we apply this to EuropeanNorwegianUK consumers of Norwegian and Scottish salmon and to domestic consumers of Canadian salmon (15) This is plausible as there is plenty of
101 Stien L H Toslashrud B Gismervik K Lien M E Medaas C Osmundsen T amp Stoslashrkersen K V (2020) Governing the welfare of Norwegian farmed salmon Three conflict cases Marine Policy 117 103969
102 Norwegian Veterinary Institute (2018) Fish Health Report 2018 httpswwwvetinstnorapporter-og-publikasjonerrapporter2019fish-health-report-2018
103 Zander K amp Feucht Y (2018) Consumersrsquo willingness to pay for sustainable seafood made in Europe Journal of international food amp agribusiness marketing 30(3) 251-275
104 Salmon Group (2020) Fish welfare in fish farming httpssalmongroupnowp-contentuploads202009SG_Fiskevelferd_ENG_Digitalpdf
105 Savanta ComRes Eurogroup for Animals CIWF Fish Welfare Survey Accessed online httpscomresglobalcompollseurogroup-for-animals-ciwf-fish-welfare-survey
106 Inter alia Kalshoven K amp Meijboom F L (2013) Sustainability at the crossroads of fish consumption and production ethical dilemmas of fish buyers at retail organizations in The Netherlands Journal of agricultural and environmental ethics 26(1) 101-117 Kupsala S Jokinen P amp Vinnari M (2013) Who cares about farmed fish Citizen perceptions of the welfare and the mental abilities of fish Journal of Agricultural and Environmental Ethics 26(1) 119-135 Pieniak Z Vanhonacker F amp Verbeke W (2013) Consumer knowledge and use of information about fish and aquaculture Food policy 40 25-30
107 Zander K amp Feucht Y (2018) Consumersrsquo willingness to pay for sustainable seafood made in Europe Journal of international food amp agribusiness marketing 30(3) 251-275
38 - Findings
evidence that Canadians care about animal welfare and animal welfare standards are somewhat similar in Canada and the EU We have excluded salmon consumed outside of the EUNorwayUKCanada These results are displayed in Table 15 The total cost across the four countries from poor fish welfare is USD$467 billion
Table 15 Salmon welfare premium (MUSD)
2013 2014 2015 2016 2017 2018 2019
Norway $271 $374 $434 $629 $603 $649 $713
Scotland $117 $130 $107 $114 $149 $136 $145
Canada $9 $9 $10 $16 $16 $17 $17
This proxy value demonstrates that fish welfare is material to consumers Although the valuation approach could potentially be criticised as being anthropomorphic valuation is intrinsically a human endeavour meaning that value can only be ascribed to humans hence the emphasis on human perception of welfare in this instance
There are also concerns over the welfare of wild wrasse on fish farms Wrasse require shelters for protection when at rest and from tides and currents supplementary feeding when lice numbers are low and care during farm operations such as grading and moving salmon and net cleaning108 However mortality rates are very high For example 23 million wild wrasse were caught in Norway in 2018 and 40 of these died in the same year Due to a lack of data on welfare impacts it was not possible to include a valuation of cleaner fish welfare in the model
Impacts of diverting pelagic fish away from direct human consumption (DHC)
This section considers the impacts of diverting forage fish away from DHC in low and middle-income countries for use in the FMFO industry in large part to feed European aquaculture In this context the two most important regions for pelagic fish are West Africa and the Pacific coast of South America most notably Peru
Peru is the top exporter of fishmeal and fish oil worldwide and landings of anchoveta are used nearly exclusively for FMFO production despite a proactive national food policy aimed at favouring their direct human consumption in an effort to tackle Perursquos substantial undernutrition problem109 There has also been a long-term decline in anchoveta stocks110 As with sardine these support a wide variety of species This includes other fish that are then used for DHC Research quoted by the Changing Markets Foundation shows that the decline of fish stocks now leads to Peruvians eating more frozen imported fish111 Unfortunately there are limited data quantitative data available on Peru to incorporate into this analysis112
108 Treasurer J amp Feledi T (2014) The Physical Condition and Welfare of Five Species of Wild-caught Wrasse Stocked under Aquaculture Conditions and when Stocked in Atlantic Salmon Salmo salar Production Cages Journal of the World Aquaculture Society 45(2) 213-219
109 Freacuteon P Sueiro J C Iriarte F Evar O F M Landa Y Mittaine J F amp Bouchon M (2014) Harvesting for food versus feed a review of Peruvian fisheries in a global context Reviews in Fish Biology and Fisheries 24(1) 381-398
110 Tegel S (2013) Peru Where have all the anchovies gone Accessed online httpswwwpriorgstories2013-04-14peru-where-have-all-anchovies-gone
111 Changing Markets Foundation (2019) Until the Seas run Dry httpchangingmarketsorgwp-contentuploads201904REPORT-WEB-UNTILL-THE-SEAS-DRYpdf
112 For more information on anchoveta and FMFO in Peru see Changing Marketrsquos Foundation What Lies Beneath report httpchangingmarketsorgwp-contentuploads202011What_Lies_Beneath_full_reportpdf
39 - Findings
Another growing exporter of FMFO are the countries along the West African coast Senegal Mauritania and the Gambia 15 percent of Africarsquos catches are reported as destined for non-food uses such as FMFO and most of this comes from West Africa113 where it has been identified as a future growth area The biodiversity losses from use of fish in aquafeed have been discussed above Here we consider the socio-economic cost for local fishing communities The main pelagic species fished in West Africa is sardinella and Cashion et al argue that 90 of this food is food-grade or prime food-grade fish114 This is important in three ways First West African countries have significant food security issues (almost 30 of under-5s experience stunting as a result of under-nutrition)115 Fish are an important provider of nutrients and animal protein and it is argued that current and potentially increasing use for non-DHC may represent a challenge to global food security116
Second the growth of the FMFO industry may lead to net economic losses The companies are largely foreign-owned and funded by foreign investment117 Production has a shorter local supply chain than the direct selling of fish locallyregionally and other forms of processing such as canning or freezing 118 This means that a smaller proportion of the value added from the fish is being captured by local people This decreases the stocks available for local fishermen and the subsequent jobs that are created from the building of boats through to the preparing of meals using the fish such as smoking at local markets Many of these roles employ women who may have few employment opportunities In a review of the contribution of fisheries to livelihoods and nutrition Beneacute et al conclude that the evidence convincingly shows that womenrsquos roles in capture fisheries and their contribution either go unrecorded or are undervalued and remain largely invisible in national statistics
Finally demand for small pelagics increases the pressure on fish stocks in the region These areas are already heavily overfished largely through the access that European and Chinese trawlers have to the waters119 The current rates of extraction are found to be driving several species towards extinction120 This is further placing the livelihoods of those that depend on fishing at risk leading to increasing poverty and forced migration121 122 The most threatened species include forage fish such as sardinella and the UN estimates that declining availability could seriously undermine food security across the region123
113 Wijkstroumlm U N (2009) The use of wild fish as aquaculture feed and its effects on income and food for the poor and the undernourished In Fish as feed inputs for aquaculture practices sustainability and implications (Vol 518 pp 371-407) FAO Rome
114 Cashion T Le Manach F Zeller D amp Pauly D (2017) Most fish destined for fishmeal production are food-grade fish Fish and Fisheries 18(5) 837-844
115 Global Nutritional Report (2020) Western Africa Nutrition Profile httpsglobalnutritionreportorgresources nutrition-profilesafricawestern-africa~text=The20Western20Africa20subregion20experiencesthe20global20average20of2021925
116 Beacuteneacute C Arthur R Norbury H Allison E H Beveridge M Bush S amp Thilsted S H (2016) Contribution of fisheries and aquaculture to food security and poverty reduction assessing the current evidence World Development 79 177-196
117 Greenpeace (2019) A Waste of Fish httpswwwgreenpeaceorginternationalpublication22489waste-of-fish-report-west-africa
118 Wijkstroumlm U N (2009) The use of wild fish as aquaculture feed and its effects on income and food for the poor and the undernourished In Fish as feed inputs for aquaculture practices sustainability and implications (Vol 518 pp 371-407) FAO Rome
119 Munshi N (2020) The Fight for West Africarsquos Fish httpswwwftcomcontent0eb523ca-5d41-11ea-8033-fa40a0d65a98
120 httpswwwodiorgsitesodiorgukfilesresource-documents10665pdf
121 Joumlnsson J H amp Kamali M (2012) Fishing for development A question for social work International Social Work 55(4) 504-521
122 Alder J amp Sumaila U R (2004) Western Africa a fish basket of Europe past and present The Journal of Environment amp Development 13(2) 156-178
123 httpswwwiucnorgnewssecretariat201701overfishing-threatens-food-security-africaE28099s-western-and-central-coast-many-fish-species-region-face-extinction-E28093-iucn-report
40 - Findings
The main country in our study to import FMFO from West Africa is Norway which is the second largest importer of FMFO from Mauritania Most marine ingredients used in Canada Chile and Scotland come from Peru Due to limited quantitative evidence on the impacts in relation to Peru we have excluded these from the analysis Estimates have been produced for Norway and are described in Box 1
Box 1 Estimate of cost to Mauritania of exported FMFO to Norway
In 2019 Norway imported almost 85 thousand tonnes of fish oil from Mauritania for use in the salmon farming industry Data are not currently available for Mauritania but an estimate by Wijkstroumlm for Asia suggests that if bycatch were not being used for fish farming in Asia it would hypothetically create between 81 and 102 million jobs in post-harvest activities and processing This equates to a minimum of 5 jobs per tonne of fish or 44255 jobs lost in the supply chain for the amount of fish oil sold to Norway If we multiply this by the GDP per head for Mauritania ($1188) it gives us a total value of $555 million Even when we subtract the value of the fish oil exports ($168 million) we are left with a loss of $375 million in 2019 There was insufficient data to carry out a retrospective analysis
41 - Conclusions and recommendations
4 Conclusions and recommendations
The demand for seafood is expected to increase in coming years and organisations like the World Bank and the FAO argue that this will have to be met by increased aquaculture production Although a highly profitable sector it has also generated considerable controversy and growth has stagnated in industrialised countries not least due to negative public perceptions of the aquaculture industry especially in Europe124 This along with the many non-economic costs (eg pollution fish welfare) present risks to the industry and are likely to result in economic costs over time
124 Bacher K (2015) Perceptions and misconceptions of aquaculture a global overview GLOBEFISH Research Programme 120 I
42 - Conclusions and recommendations
41 Conclusions
In this paper we have sought to fill gaps in understandings of the economic social and environmental costs of salmon farming in the top producing countries The estimates presented in this analysis are summarised in Table 16 We have used a conservative approach throughout and although we encountered significant data gaps we have been able to provide values for most of the variables The analysis suggests that salmon aquaculture has produced private and external costs of almost USD$50 billion over the 7-year period being studied
Table 16 Summary of costs (in MUSD)
Variable Canada Norway Chile Scotland Total
Mortalities 768 8908 4939 922 15539
Lice 111 2142 1647 463 4365
FMFO 454 4832 2045 859 8192
Total economic cost 1333 15969 8631 2233 28096
Salmon stocks 187 52 Insufficient data 68 308
Pelagic fish stocks 135 665 302 680 1784
Local pollution 189 2328 1268 288 4073
Climate change 425 5224 2282 425 8356
Total environmental cost 936 8269 3852 1461 14521
Fish welfare 97 3675 Insufficient data 902 4674
Total social cost 97 3675 Insufficient data 902 4674
Total 3587 27913 13304 4596 47291
This report has focused on the negative externalities from salmon farming On the benefit side we might want to consider factors such as consumer and producer surplus of increased aquaculture as well as employment in coastal communities where there may be limited industry Table 17 lists some of the economic benefits that have been found elsewhere
Table 17 Examples of positive benefits from salmon farming
Location Benefit
NorwayFisheries value chain is estimated to contribute USD$11 billion to GDP per annum125
British ColombiaSalmon farming supports 7000 jobs in coastal communities and contributes about $15 billion to the provincial economy annually
ChileEstimated to have created a total of 60000 jobs since it began to grow in the 1990s126
ScotlandEstimated to have contributed $2 billion to the Scottish economy annually
However it is not uncommon for economic studies to be commissioned by the industry itself or governments keen to support expansion (see Box 2 for a discussion of the use of cost benefit analysis in Scotland) Whilst this study has excluded positive impacts it has also been unable to assess some negative impacts such as the effects on coastal tourism For example a study in Norway that compares consumerproducer surplus to
125 Johansen U Bull-Berg H Vik L H Stokka A M Richardsen R amp Winther U (2019) The Norwegian seafood industryndashImportance for the national economy Marine Policy 110 103561
126 Naru A amp Shoaib F (2019) International Trade of Chilean and Tasmanian Salmon and the Governmental Human Resource Policy enabling its Expansion Latin American Journal of Trade Policy 2(3) 5-14
43 - Conclusions and recommendations
opportunity costs for landsea use finds that parts of the producer surplus have to be reinvested in the regional economy to create a positive return for a region127
Considering the full range of costs and benefits may well demonstrate positive benefits from aquaculture (and even salmon farming) Yet what this report shows is that there are substantial costs that are not included on the balance sheet and that the scope for improved environmental and social performance is considerable In addition a combination of growing environmental risks consumer demand for ethical products and limits to poor fish husbandry are creating long run economic risks to the industry that can only be mitigated by investing in more sustainable farming practices
Box 2 Cost benefit analysis and Scottish salmon farming
There have been several recent attempts to demonstrate the positive contribution of salmon farming to the Scottish economy and local rural communities128 These have been commissioned by both the Scottish Government and the Scottish salmon industry For example the Scottish Salmon Producerrsquos Organisation has calculated that the industry is worth over pound2 billion to the economy annually Reports by Imani and Westbrook (2017) and Marsh (2019) also found net positive benefits The latter reports have been critiqued by Riddington et al129 for Salmon and Trout Conservation Scotland who found that estimates for Gross Value Added (GVA) and employment were overestimated by 124 and 251 respectively The report concluded the evidence did not support industry expansion when the impacts to the whole of society are considered This report was peer reviewed by Bridge Economics130 who firmly endorsed the critiques and concluded that addressing quantitative oversights to bring the analysis in line with the Treasuryrsquos guidance on cost benefit analysis would have led to a less charitable assessment of the underlying economic arguments These critiques are not arguing that salmon farming is net negative to Scotland rather that the economic analyses contain positive biases and are partial because they do not consider costs and benefits to a wide enough range of stakeholders and exclude non-economic impacts
42 Recommendations Our recommendations focus on the four most significant stakeholders in salmon farming governments investors farmers and consumers The industry requires increased investment in technologies to address environmental economic and social risks described in this report Each of these groups has the potential to benefit andor bear costs from salmon farming and each should as a result be prepared to contribute proportionately towards the transformation that is required Bespoke recommendations for each group are therefore provided
127 Aanesen M amp Mikkelsen E (2020) Cost-benefit analysis of aquaculture expansion in Arctic Norway Aquaculture Economics amp Management 24(1) 20-42
128 SSPO (2020) Estimation of the Wider Economic Impacts of the Aquaculture Sector in Scotland httpswwwscottishsalmoncoukreportswider-economic-impacts-of-the-scottish-aquaculture-sector Imani Developments and Steve Westbrook httpimanidevelopmentcomwpcontentuploads201708Value-of-Scottish-Aquaculture-2017-Reportpdf Richard MarshFour Consulting (2019) Key Figures for Scottish Salmon httpsd178ivhysawughcloudfrontnet1556530716salmon-impactpdf
129 Riddington G Radford A and Gibson H (2020) The Economic Contribution of Open Cage Salmon Aquaculture to Scotland A Review of the Available Economic Evidence httpswwwsalmon-troutorgwp-contentuploads202004Riddington-Radford-Gibson-Economic-Contribution-of-Salmon-Aquaculture-to-Scotlandpdf
130 Bridge Economics (2020) Peer Review of the Economic Contribution of Salmon Aquaculture to Scotland httpswwwsalmon-troutorgwp-contentuploads202004Peer-Review-of-the-Economic-Contribution-of-Salmon-Aquaculture-to-Scotland-exec-summarypdf
44 - Conclusions and recommendations
For governments
Economic benefits of salmon farming need to be balanced against other coastal industries such as tourism angling and wider environmental impacts Better oversight and more robust regulation of salmon farming should lead over time to competitive advantage as consumers increasingly seek out more ethical and environmentally friendly products Governments can lead the way on this by restricting licences to companies that meet higher social and environmental standards
The industry would benefit from guidelines for sustainable feed ingredients along with stricter due diligence and governance frameworks in aquafeed supply chains Governments should also support the phase-out of whole wild-caught fish for use in aquafeed Furthermore aquaculture that relies on wild-caught fish should not receive any subsidies or other public support measures
Policy should support the development of alternative technologies (for feedstuffs and better farming methods) and provide economic incentives for a transition to more sustainable ingredients and farming practices
Governments should require more transparent reporting in this industry as is required in agriculture and should resist industry pressure not to publish mortalities data that are in the public interest Countries such as Canada that do not publish these data may be placing themselves at a disadvantage if mortalities data are more positive than those reported here In addition consumers increasingly expect transparency in supply chains and companiessectors which fail to respond to that expectation will place themselves at a disadvantage in the market
More generally there is a need to improve the quality of social economic and environmental accounting in salmon farming This would have the dual benefit of supporting more holistic decision-making and incentivising better farming practices By revealing costs and benefits governments could create a race to the top amongst salmon farmers and a level playing field for small producers that may be operating to higher standards At a minimum governments (eg in Scotland) should refrain from using economic analysis to make a priori economic arguments in favour of salmon farming given their responsibilities to a wider group of stakeholders
For investors
As a result of growing environmental and regulatory pressures investment decisions are required that drive a rapid transition towards alternative feeds and farming practices These technologies already exist but require more investment to make them viable in the short-term
Although the risks of existing farming practices are often understood investors continue to support them perhaps to the continued short-run profitability of the sector This creates a barrier to the adoption of new technologies and improved practices and investors need to take a long-term view This may involve accepting lower returns in the short term but as discussed in this paper issues with both supply and demand should create competitive advantage in the long run
45 - Conclusions and recommendations
For farmers
Mortalities lice treatments and disease are creating huge costs for the farmers and damaging the reputation of farmed salmon Significant opportunities exist to dramatically improve the environmental and social performance of salmon production through a focus on the development of least-environmental cost (as opposed to least-economic-cost) feed formulations These technologies exist and have been shown to work and producers should in particular work with the aquafeed industry to remove wild caught fish entirely from the formulations This would also appeal to the growing consumer demand for an ethical product In addition the cost of marine ingredients is expected to increase these may also prove to be a lower cost alternative in the medium term
As demonstrated in this report poor fish husbandry is a false economy as it leads to significant direct and indirect costs We recommend therefore that farmers adopt better practices such as stocking densities commensurate with higher survival rates Finally the industry should also prioritise cultivating non-carnivorous species or those that require less or no feed
For consumers
Salmon was once a high value food that was only available in season and consumed on special occasions In line with the need for investment from all stakeholders some consumers should also be prepared to pay more for salmon where their economic circumstances allow andor to consume it more infrequently As part of this consumers could seek out alternatives to carnivorous fish such as molluscs that provide dietary and economic benefits at lower social economic and environmental costs However many consumers will always choose low-cost products especially those in constrained economic circumstances and the onus should be largely on the industry - and the governments that give it licence to operate - to improve its performance
46 - Appendices
Appendix 1 ndash Norway
Norway is the worldrsquos largest producer of Atlantic salmon producing 13 million tonnes in 2018 or 52 of the global production131 According to governmental plans the production of farmed Atlantic salmon is set to grow five-fold by 2050132 to meet expected increases in global demand133
Economic costs
Historically Norway has had ideal conditions for salmon farming but in recent years the industry has been plagued by high mortality rates as the industry generates -and runs up against - increasing environmental pressures In 2018 it is estimated that over 52 million salmon were lost (13 of production) for varying reasons including diseasessea lice and associated treatments pollution and escapes134
Taking annual salmon losses and multiplying them by the salmon price for each year reveals the scale of the economic cost this represents Table 18 shows the percentage lost each year and the relevant price135 As we can see these mortalities result in a direct economic loss over the seven years of over USD$8 billion
Table 18 Opportunity costs of mortalities in Norway
2013 2014 2015 2016 2017 2018 2019
Total harvest (mt) 1168 1258 1303 2133 1236 1282 1357
Mortalities (t) 127347 145969 177255 309375 180508 164096 196809
Percentage losses 11 12 14 15 15 13 15
Value of losses (MUSD) 855 983 940 2208 1343 1234 1409
It is interesting to note that reducing mortalities to 55 on salmon farms in Norway would represent an annual saving of over $892 million USD (based on 2019 volumes and prices)
Substantial amounts are also spent in efforts to minimise mortalities by combatting disease and parasite infestations According to Nofima treating sea lice cost Kr45 billion in 2017 or 475 million dollars136 This includes an estimated NOK15 billion on cleaner fish (based on a cost of NOK12 per Kg of salmon produced)137 As the Norwegian Veterinary institute points out disease costs the aquaculture industry enormous sums of money results in poor fish-welfare reflects poorly on the aquaculture industry and is environmentally unfriendly Whilst more effective disease control will be costly in the long run it will be more profitable and will lead the industry in a more sustainable direction138
The final economic cost considered here is that of fishmeal and fish oil (FMFO) In 2016 the Norwegian salmon industry utilised 162 million tonnes of feed ingredients139 Soy protein concentrate accounted for 19 of the feed ingredients marine protein sources accounted for 145 and marine oils 104 The remainder was made up of wheat and plant-based oils This the equivalent of 245050 tonnes of fishmeal and 175760 tonnes
131 FAO (2019) The State of World Fisheries and Aquaculture httpwwwfaoorgstate-of-fisheries-aquaculture
132 Bailey J L amp Eggereide S S (2020) Indicating sustainable salmon farming The case of the new Norwegian aquaculture management scheme Marine Policy 117 103925
133 Aanesen M amp Mikkelsen E (2020) Cost-benefit analysis of aquaculture expansion in Arctic Norway Aquaculture Economics amp Management 24(1) 20-42
134 Nofima (2017) High lice costs rising feed prices ndash and expensive land-based facilities httpsnofimanoenforskningnaringsnyttehigh-lice-costs-rising-feed-prices-and-expensive-land-based-facilities
135 Data from Statistics Norway httpswwwssbnoenfiskeoppdrett
136 Nofima (2017) High lice costs rising feed prices ndash and expensive land-based facilities httpsnofimanoenforskningnaringsnyttehigh-lice-costs-rising-feed-prices-and-expensive-land-based-facilities
137 Nofima estimate of Kr12 per kg of salmon (based on 13 billion kg in 2018) httpsthefishsitecomarticlescounting-the-true-cost-of-combatting-sea-lice
138 Norwegian Veterinary Institute (2018) Fish Health Report 2018 httpswwwvetinstnorapporter-og-publikasjonerrapporter2019fish-health-report-2018
139 Aas TS et al 2019 Utilization of feed resources in the production of Atlantic salmon (Salmo salar) in Norway An update for 2016 Aquaculture Reports 2019 vol 15
47 - Appendices
of fish oil In Table 19 we estimate the annual cost to Norwegian aquaculture of using marine fish sources
Table 19 Cost of FMFO 2013-2019 (MUSD)
2013 2014 2015 2016 2017 2018 2019
Cost of FM $435 $428 $403 $346 $342 $350 $369
Cost of FO $335 $335 $324 $288 $249 $352 $270
Source authorrsquo calculation drawing on data from Statistics Norway140 the World Bank141 EUMOFA142 Ytrestoslashyl et al 2015143 Aas et al 2019144 and the FAO145
The use of marine ingredients has declined dramatically since 1990 when 90 of the feed was of marine origin146 This had decreased to 30 in 2013 down to about 25 today The latest analysis that is available is for 2016 but it is expected that reductions have plateaued in the absence of new technologies as has happened with fish oil since 2013 As demand for seafood has increased reductions in use have been offset leading to no overall net decrease If this continues then we would expect to see the use of marine ingredients increase five-fold by 2050 in line with expansion plans Taking these costs together we can see that mortalities and their treatment147 as well as the use of FMFO in feed cost the industry over $4 billion USD in 2019
The Norwegian Veterinary Institute (2018) have pointed to the paradox that while only a very few fish die due to salmon-lice infection delousing (eg stress from handling) is an important cause of direct and indirect mortality both for farmed salmon and cleaner-fish and has significant welfare implications Mortalities are (at least in part) a direct function of fish welfare we can conclude therefore that poor fish welfare has a direct economic risk for farmers and investors as well as being a wider social problem an issue that we will discuss in the next section
Social costs
In this section we consider two sources of social costs fish welfare and community impacts on coastal communities in West Africa from which FMFO is sourced
Fish welfare is increasingly taking on importance as an issue for consumers including evidence of its importance to Norwegian consumers148 149 To estimate the social cost of fish welfare we have based our calculations on a study of European consumers of their willingness to pay for higher welfare salmon150 European consumers were selected as Europe is a major consumer of salmon exports from Norway This research found that all things considered the average European consumer was willing to pay a price premium of 14 for salmon with higher welfare standards In Table 20 we apply this to all European consumers of Norwegian salmon since 2013 As we can see consumers were on average willing to pay a cumulative premium of $36 billion USD
140 Statistics Norway 07516 Fish farming Loss in fish for food production by fish species (C) 1993 ndash 2019 httpswwwssbnoenstatbanktable07516tableViewLayout1 httpsdataimforgsk=471DDDF8-D8A7-499A-81BA-5B332C01F8B9 httpsdataimforgsk=471DDDF8-D8A7-499A-81BA-5B332C01F8B9
141 httpswwwindexmundicomcommoditiescommodity=fish-mealampmonths=120ampcurrency=eur
142 httpswwweumofaeudocuments20178148316MH+4+2019+EN_finalpdf
143 Ytrestoslashyl T Aas T S amp Aringsgaringrd T (2015) Utilisation of feed resources in production of Atlantic salmon (Salmo salar) in Norway Aquaculture 448 365-374
144 Aas T S Ytrestoslashyl T amp Aringsgaringrd T (2019) Utilization of feed resources in the production of Atlantic salmon (Salmo salar) in Norway An update for 2016 Aquaculture Reports 15 100216
145 FAO (2016) COMMODITY STATISTICS UPDATE Fishmeal and Fish oil httpwwwfaoorg3a-bl391epdf
146 Aas T S Ytrestoslashyl T amp Aringsgaringrd T (2019) Utilization of feed resources in the production of Atlantic salmon (Salmo salar) in Norway An update for 2016 Aquaculture Reports 15 100216
147 Values uprated to 2019 prices using average Norwegian rate of inflation 125
148 Sandoslashe C G P Who cares about fish welfare -A Norwegian study Kristian Ellingsen Kristine Grimsrud Hanne Marie Nielsen Cecilie Mejdell Ingrid Olesen Pirjo Honkanen Staringle Navrud
149 Grimsrud K M Nielsen H M Navrud S amp Olesen I (2013) Householdsrsquo willingness-to-pay for improved fish welfare in breeding programs for farmed Atlantic salmon Aquaculture 372 19-27
150 Zander K amp Feucht Y (2018) Consumersrsquo willingness to pay for sustainable seafood made in Europe Journal of international food amp agribusiness marketing 30(3) 251-275
48 - Appendices
Table 20 WTP calculation for higher fish welfare (MUSD)
Norway2013 2014 2015 2016 2017 2018 2019
$271 $374 $434 $629 $603 $649 $713
Source authorrsquos own based on data from comtrade151
This proxy value demonstrates that fish welfare is material to consumers Although the valuation approach could potentially be criticised as being anthropomorphic valuation is intrinsically a human endeavour meaning that value can only be ascribed to humans hence the emphasis on human perception of welfare in this instance
In 2016 169000 tonnes of feed were used in Norwegian salmon farming Of this 145 was fishmeal and 104 was fish oil (Nofima) Of this 6 and 4 were sourced from West Africa Mauritania was the main West African supplier of marine ingredients to Norway in 2019
Mauritania has recently developed a fishmeal industry based on these small pelagics and it has shown strong growth since 2010 as a result of higher prices for marine ingredients152 It is argued that this is already impacting on regional stocks and that these are likely to increase as the fishmeal industry expands153 There is limited research especially of a quantitative nature on the potential impacts of the expansion of this industry
In 2018 Norway imported almost 84 thousand tonnes of fish oil from Mauritania for use in the salmon farming industry To estimate the potential loss of value added we compare the value added from canning (based on Moroccan data) with producing FMFO (29 and 10 respectively)154 (see Table 21 for a list of the assumptions used) The total annual cost of diverting the 90 of this fish that is suitable for DHC to fish oil is over $1 million per year
Table 21 Assumptions in social calculations for Mauritania
Assumptions Values
Value added of fishing 903000000
fleet pelagics 722400000
Fish produced 1500000
Value added of canning 29
Tonnes of pelagics canned 139000
Value added canning 209496000
Total FMFO production 172000
Value added of FMFO 10
Value added FMFO 72240000
Difference 137256000
Difference per tonne in USD 1268
151 httpscomtradeunorg
152 Corten A Braham C B amp Sadegh A S (2017) The development of a fishmeal industry in Mauritania and its impact on the regional stocks of sardinella and other small pelagics in Northwest Africa Fisheries research 186 328-336
153 Ibid
154 Data are drawn from Greenpeace A Waste of Fish CEIC httpswwwceicdatacomenmoroccofish-production-consumption-and-processingfish-processing-volume-fish-meal-and-fish-oil ITC trade map and Government of Mauritania httpwwwpechesgovmrIMGpdfrapport_finalcadre_d_investissementpdf
49 - Appendices
An alternative way of estimating the loss of value added is to estimate the direct and indirect loss of employment Data are not currently available for Mauritania but an estimate by Wijkstroumlm for Asia suggests that if bycatch were not being used for fish farming in Asia it would hypothetically create between 81 and 102 million jobs in post-harvest activities and processing This equates to a minimum of 5 jobs per tonne of fish or 44255 jobs lost in the supply chain for fish oil sold to Norway If we multiply this by the GDP per head for Mauritania ($1188) it gives us a total value of $555 million Even when we subtract the value of the fish oil exports ($168 million) we are left with a loss of $375 million
There are also concerns over the welfare of wild wrasse (cleaner fish) on fish farms Wrasse require shelters for protection when at rest and from tides and currents supplementary feeding when lice numbers are low and care during farm operations such as grading and moving salmon and net cleaning155 However mortality rates are very high 23 million wild wrasse were caught in Norway in 2018 and 40 of these died in the same year Due to a lack of data it was not possible to include a valuation of wrasse welfare in the model
Environmental costs
Finally we consider environmental costs The most notable of these are
bull Impacts on wild salmonid stocksbull Impacts on wild cleaner fish stocksbull Impacts on pelagic fish stocksbull Impacts of local pollutionbull Carbon emissions
Local pollution
Liu et al have estimated the PAC for Norwegian salmon farming and found it to be 35 of total salmon production156 These are based on 2010 and may be therefore a little out of date On the other hand algal blooms are a continuing (and perhaps worsening) problem for Norwegian aquaculture In 2019 8 million salmon were killed in an algal bloom in just a few days157 This prompted the Norwegian government to invest almost one million Euros in aquaculture research Although the loss to farmers of about NOK4 million was widely reported the environmental cost has received less attention Table 22 details the annual pollution abatement cost This equates to a total PAC of USD$14 billion since 2013
Table 22 Estimate of annual pollution abatement cost
Norway2013 2014 2015 2016 2017 2018 2019
$140489766 $154941911 $164633692 $222735005 $228342307 $238998213 $252350165
Impacts on fish stocks
There are three means by which salmon farming impacts on fish stocks Two of these have already been discussed the use of pelagic fish and cleaner fish in fish feed and lice treatment respectively The third is the impacts on wild salmon stocks A report by Thorstad and Finstad (2018) found that it can lead to an average of 12-29 fewer adult wild salmon Table 23 estimates the indirect value of forage fish use in FMFO in Norway
155 Treasurer J amp Feledi T (2014) The Physical Condition and Welfare of Five Species of Wild-caught Wrasse Stocked under Aquaculture Conditions and when Stocked in Atlantic Salmon Salmo salar Production Cages Journal of the World Aquaculture Society 45(2) 213-219
156 Liu Y amp Sumaila U R (2010) Estimating pollution abatement costs of salmon aquaculture a joint production approach Land Economics 86(3) 569-584
157 Magra I (2019) Millions of Salmon in Norway Killed by Algae Bloom New York Times Accessed online httpswwwnytimescom20190523worldeuropesalmon-norway-algae-bloomhtml
50 - Appendices
Table 23 Loss of value as a result of forage fish being used in FMFO in Norway 2013-2019
Norway2013 2014 2015 2016 2017 2018 2019
$16676986 $14749795 $20827399 $21100028 $20592863 $21042291 $20621445
These figures only considered ex-vessel prices of predator fish dependent on forage fish However this is very likely an underestimation of the full economic benefits of predator fish (eg downstream benefits or supply chains through processors distributors and consumers It also most likely underestimates wider ecosystem benefits to nonmarket predators such as seabirds seals and so on As well as the existence value of these species discussed elsewhere there can be additional economic benefits such as ecotourism revenue (whale watching bird watching etc)158 Froehlich et al assess whether FMFO use can circumvent forage fish limits (eg through greater consistent inclusion of fish byproducts) They find that this is possible by the middle of the 21st century However global shifts towards more pescatarian diets will make this impossible and increase the requirement for long-term nutrient equivalent feed sources159
As discussed above salmon farms cause damage to wild salmon stocks through local pollution and the spreading of lice and disease In addition escaped salmon breed with local populations and their offspring are genetically less likely to survive and research suggests that these effects are likely to last down the generations160 Rates of returning salmon in Norway are less than half what they were in the 1980s161 According to the Norwegian Scientific Committee on the Atlantic Salmon the largest declines are seen in western and middle Norway and negative impacts of salmon farming have contributed to this Escaped farmed salmon are the primary threat to wild salmon followed by salmon lice and infections They also argue that the present level of mitigation measures is too low to stabilize and reduce the threat Impacts on escaped salmon are difficult to model but it is estimated that lice from salmon farms kill 50000 wild salmon per year162 We know that returning salmon are about half a million fewer than in the 1980s163 If we conservatively assume about 150000 of these are as a result of salmon farming (we know 50000 are due to lice infestations and assume 75000 are due to hybridisation and 25000 due to infectious diseases) This is about 30 of the lost wild salmon population No studies were identified on Norwegian valuations of salmon conservation but we have taken an average of three figures per household from Canada the UK and Ireland ($10 $20 and $18 respectively)164 These represent the amount households would be willing to pay to restore salmon stocks Applying the average of these to the lost salmon stocks gives us an annual figure of $11 million USD We would suggest that this is a reasonable proxy for the value destroyed in Norwegian society by farmed fish impacts on wild populations
158 Koehn L E Essington T E Marshall K N Sydeman W J Szoboszlai A I amp Thayer J A (2017) Trade-offs between forage fish fisheries and their predators in the California Current ICES Journal of Marine Science 74(9) 2448-2458
159 Froehlich H E Jacobsen N S Essington T E Clavelle T amp Halpern B S (2018) Avoiding the ecological limits of forage fish for fed aquaculture Nature Sustainability 1(6) 298-303
160 Hindar K Fleming I A McGinnity P amp Diserud O (2006) Genetic and ecological effects of salmon farming on wild salmon modelling from experimental results ICES Journal of Marine Science 63(7) 1234-1247
161 Norwegian Scientific Advisory Committee for Atlantic Salmon (29019) Status of wild Atlantic salmon in Norway 2019 Accessed online httpswwwvitenskapsradetnoPortalsvitenskapsradetPdfStatus20of20wild20Atlantic20salmon20in20Norwaypdf
162 Castle S (2017) As Wild Salmon Decline Norway Pressures Its Giant Fish Farms New York Times httpswwwnytimescom20171106worldeuropesalmon-norway-fish-farmshtml
163 Norwegian Scientific Advisory Committee for Atlantic Salmon (29019) Status of wild Atlantic salmon in Norway 2019 Accessed online httpswwwvitenskapsradetnoPortalsvitenskapsradetPdfStatus20of20wild20Atlantic20salmon20in20Norwaypdf
164 Myrvold K M Mawle G W Andersen O amp Aas Oslash (2019) The Social Economic and Cultural values of wild Atlantic salmon A review of the literature for the period 2009-2019 and an assessment of changes in values Lillehammer Norwegian Institute for Nature Research
51 - Appendices
The final wild fish impact is on wrasse stocks However these impacts are much ignored in the literature and could not be incorporated into this analysis This is concerning especially considering that surveys done by NTNU Social Research reveal that fish farmers question whether cleaner fish are an effective delousing method that actually results in fewer delousing operations165
The aquaculture industry is often positioned as a sustainable alternative to land-based animal farming However as critics have pointed out this is often based on flawed analysis that does not take into account the full CO2 costs of salmon farming Sintef have estimated the full CO2 emissions for Norway taking account of previously uncounted impacts These include the impacts of the use of soy in fish feed and its impact on deforestation in Brazil (all of the Norwayrsquos soy is sourced in Brazil) It also takes account of air freight in the distribution of salmon which is increasing due to the increased importance of China as a consumer of Norwegian salmon The total carbon emissions produced by the sector are 9685 million tonnes There are various methods for costing carbon emissions and a wide literature on the appropriate valuations to use If we conservatively use the carbon tax applied by Norway to fishing to this figure ($27 USD per tonne) we get an annual value of $255 million per year166 However this value is substantially higher when a social cost of carbon is applied Table 24 shows the emissions costs based on the Norwegian LCA data and using the UKrsquos Department for Climate Change estimate of USD$72 per tonne ($52 billion)
Table 24 Emissions costs (MUSD)
Norway2013 2014 2015 2016 2017 2018 2019
$626 $ 674 $699 $1144 $663 $687 $728
Conclusion
A summary of the costs included in this study is provided in Table 25 As we can see this analysis gives us a total cost since 2013 of almost USD$28 billion
Table 25 Summary of costs (MUSD)
Norway
Mortalities 8908
Lice 2142
FMFO 4832
Total economic cost 15969Salmon stocks 52
Pelagic fish stocks 665
Local pollution 2328
Climate change 5224
Total environmental cost 8269Fish welfare 3675
Total social cost 3675Total 27913
165 The Norwegian Institute of Marine Research is also concerned about the methodrsquos lack of documented effectiveness httpsnorwegianscitechnewscom202004cleaner-fish-being-sacrificed-in-the-fight-against-salmon-lice
166 Bruvoll A and Dalen H (2009) Pricing of CO2 emissions in Norway Accessed online httpswwwssbnoaenglishpublikasjonerpdfdoc_200916_endoc_200916_enpdf
52 - Appendices
Appendix 2 ndash Scotland
Although Scotlandrsquos share of total salmon production is small relative to Norway and Chile (76) it is an extremely important industry to the economies of both Scotland and the UK It is currently the UKrsquos biggest food export (in 2019 94300 tonnes was exported to 54 countries an increase of 26 per cent on 2018 figures)167 and it is also valued by UK consumers (60 of production is consumed domestically)
The industry has grown by 91 since 1997 and is dominated by six large companies controlling 99 of the market168 In addition the industry has widely publicised plans to grow further with a target of increasing growth by another 100-165 from a 2018 baseline by 2030169
Economic losses
Salmon deaths are reported by fish farming companies and published online by the Scottish Environment Protection Agency In 2013 the Scottish government stopped publishing aggregate figures on mortalities allegedly as a result of industry pressure170 Analysis of deaths reported to the SEPA by Inside Scottish Salmon Feedlots (ISSF) suggest a large increase in mortalities since 2002 (an increase from 31 to 135) The main causes of deaths reported are infections algal blooms and delousing treatments
To estimate the economic losses of these mortalities we have taken the proportion of mortalities as a share of total farmed salmon production for Scotland in each year studied (base on FAO data)171 Production has increased by 16 since 2013 However losses have also increased by 60 over that period as has the value of those losses Cumulatively this equates to 134727 tonnes of salmon with a value of $922 million Had mortalities been maintained at 64 since 2013 this would have represented a cumulative saving to the industry of almost $400 million However if survival rates similar to 2002 could be regained (about 97) this will represent a cumulative saving of $668 million over the period
Table 26 Opportunity costs of Scottish mortalities 2013-2019 172
2013 2014 2015 2016 2017 2018 2019
Total harvest (mt) 160 179 170 163 189 156 190
Mortalities (t) 10329 16046 18302 22245 25460 16573 25772
Percentage losses 640 900 1080 1360 1340 1060 1350
Value of losses (MUSD) $67 $106 $97 $158 $189 $124 $177
To estimate the damage control cost of lice we take an estimate derived by Costello (2009) for Scotland173 This was euro025 per kg of salmon produced based on 2006 production and prices We have uprated this based on the UK inflation rate and convert to dollars (see Table 27) These costs are multiplied by the total amount of salmon produced in each of the years giving a cumulative cost of $463million or 67 of total sales which is comparable with Costellorsquos estimate for the global cost of sea lice (6)
167 Scottish Salmon (2020) Scottish salmon exports explained httpswwwscottishsalmoncoukfactsbusinessscottish-salmon-exports-explained~text=Scottish20salmon20is20both20Scotlandrsquosper20cent20on20201820figures
168 Marine Scotland Science (2018) Scottish fish farm production survey 2018 httpswwwgovscotpublicationsscottish-fish-farm-production-survey-2018
169 Feedback (2019) Fishy business Accessed Online httpsfeedbackglobalorgwp-contentuploads201906Fishy-business-the-Scottish-salmon-industrys-hidden-appetite-for-wild-fish-and-landpdf
170 Edwards R (2020) Farmed salmon deaths from disease reach record high httpstheferretscotfarmed-salmon-deaths-disease-reach-record-high~text=E2809CMass20mortalities20are20a20functioncommercially20damaging20for20salmon20farmers
171 httpwwwfaoorgfisherystatisticsglobal-aquaculture-productionqueryen
172 Data not available for 2019 calculation based on tonnage of mortalities multiplied by the global salmon price for 2019 httpswwwimforgenResearchcommodity-prices
173 Costello M (2009) The global economic cost of sea lice to the salmonid farming industry Journal of fish diseases 32(1) 115
53 - Appendices
Table 27 Estimate of cost of lice treatment in Scotland 2013-2019 (USD)
Year Cost per kg Scotland Total cost Scotland
2013 $036 $57
2014 $037 $66
2015 $037 $62
2016 $037 $60
2017 $040 $75
2018 $040 $62
2019 $041 $78
It is not clear if the Costello estimates included include the costs of over 15 million farmed cleaner fish174 and about 30000 wild caught wrasse175 used in Scottish salmon farming annually The financial costs of cleaner fish have been increasing and are likely to be significantly higher than when Costellorsquos estimates were derived176
Scottish salmon contains a higher quantity of marine ingredient in its feed and indeed is marketed on this basis177 Data on FMFO content in feed is available for 2014178 and these have been utilised to create estimates for 2013 and the intervening years We know in that year that 25 of the 220000 tonnes of feed utilised was fish meal and 15 was fish oil Given that Scotland continues to have a higher proportion of marine content in its feed (some of its labels are as high as 51)179 we believe that this is unlikely to have decreased significantly in the intervening years Estimates are based therefore on the ratio of FMFO to production in 2014 and the cost of feedstuffs and result in a cumulative figure of USD$859 million (Table 3)180
Table 28 Cost estimates FMFO in Scottish salmon farming (MUSD)
2013 2014 2015 2016 2017 2018 2019
Scotland FM cost $64 $70 $66 $62 $71 $58 $70
Scotland FO cost $61 $63 $56 $51 $51 $57 $50
Social costs
Although Scottish salmon is promoted in the UK as a local product and a good employer of local people a closer look at the numbers tells a different story First fewer than 25 of feedstuffs originate in the UK181 with most of the marine ingredients coming from Peru Peru is the top exporter of fishmeal and fish oil (FMFO) worldwide and landings of anchoveta are used nearly exclusively for FMFO production despite a proactive national food policy aimed at favouring their direct human consumption in an effort to tackle Perursquos substantial undernutrition problem182
Second only about 2000 people are directly employed by salmon farms Even if we consider the 10000 employed through the supply chain this falls far short of the proportion employed in the tourism sector183 Scottish government data suggest that
174 Open Seas (2017) Cleaning up the lsquocleaner fishrsquo Accessed online httpswwwopenseasorguknewscleaning-up-the-cleaner-fish
175 Scottish Salmon Search for wild wrasse Accessed online httpswwwscottishsalmoncouksearchpageskeys=wild20wrasse
176 Open Seas (2017) Cleaning up the lsquocleaner fishrsquo Accessed online httpswwwopenseasorguknewscleaning-up-the-cleaner-fish
177 Feedback (2019) Fishy business Accessed Online httpsfeedbackglobalorgwp-contentuploads201906Fishy-business-the-Scottish-salmon-industrys-hidden-appetite-for-wild-fish-and-landpdf
178 Shepherd J Monroig O amp Tocher DR (2017) Future availability of raw materials for salmon feeds and supply chain implications the case of Scottish farmed salmon Aquaculture 467 pp 49-62
179 Ibid
180 World Bank FAO and EUFMA
181 Newton R W amp Little D C (2018) Mapping the impacts of farmed Scottish salmon from a life cycle perspective The International Journal of Life Cycle Assessment 23(5) 1018-1029
182 Freacuteon P Sueiro J C Iriarte F Evar O F M Landa Y Mittaine J F amp Bouchon M (2014) Harvesting for food versus feed a review of Peruvian fisheries in a global context Reviews in Fish Biology and Fisheries 24(1) 381-398
183 Schweisforth L (2018) The tragic demise of Scotlandrsquos salmon httpssustainablefoodtrustorgarticlesthe-tragic-demise-of-scotlands-salmon
54 - Appendices
this industry supports 218000 jobs (the best estimate for the salmon industry is less than 5 of this)184 Moreover Scottish salmon farming reflects the concentration we see in the wider industry with most production being controlled by non-domiciled companies (see Table 29)
Table 29 Ownership of Scottish salmon farms
Company Majority ownership
Cooke Aquaculture Canadian
Grieg Norwegian
Mowi Norwegian
Loch Duart USA
Scottish Sea Farms Norwegian
Scottish Salmon Company Ukraine
The UK alongside some of the Nordic countries has some of the strongest animal welfare legislation in the world185 reflecting perhaps the importance placed by UK consumers on animal welfare Research has found that these concerns are top of the list for consumers when assessing how ethical they regard food and drink companies to be186 However as discussed elsewhere fish welfare is a shared value across the European Union (EU) 52 of Scottish salmon is consumed domestically and of the 38 that is exported 56 of that goes to the EU187 We can expect high fish welfare standards to appeal to these consumers On average research has found a WTP of 14 amongst European consumers When we apply this to the 79 of salmon consumed in the UKEU we find that the total value for higher fish welfare is $902 million over the seven years (Table 30)
Table 30 Fish welfare premium for Scottish and EU consumers (MUSD)
Scotland2013 2014 2015 2016 2017 2018 2019
$117 $130 $107 $114 $149 $136 $145
Environmental impacts
To value the environmental cost of local pollution in Scotland we can also use data gathered via the contingent valuation method A study by Whitmarsh et al found that 76 of respondents in Scotland were in principle willing to pay a price premium (22) for salmon produced using a method that caused only half the amount of nutrient discharge188 Public support for environmentally sustainable salmon has been found in several other studies However research also suggests that findings vary depending on factors like area deprivation and proximity to areas where salmon farming is providing jobs189 Nonetheless there is growing evidence that on average increased concern over the environmental performance of the salmon farming industry is associated with a lower propensity to purchase salmon and is therefore potentially damaging to the long-term profitability of the industry190 There is also evidence of support in the UK for alternative feeds such as the use of insect meal especially when consumers
184 httpswwwsdicoukkey-sectorstourism~text=across20the20globe-The20tourism20sector20in20Scotland20supports20the20jobs20of202182C000that20number20is20growing20quickly
185 Evidence Group (2018) FARM ANIMAL WELFARE GLOBAL REVIEW SUMMARY REPORT httpswwwnfuonlinecomnfu-onlinesectorsanimal-healthfarm-animal-welfare-global-review-summary-report
186 Farmers Weekly (2015) Animal welfare tops list of consumersrsquo ethical concerns httpswwwfwicouklivestockhealth-welfareanimal-welfare-tops-list-consumers-ethical-concerns
187 httpswwwbbccomnewsuk-scotland-scotland-business-51460893
188 Whitmarsh D amp Palmieri M G (2009) Social acceptability of marine aquaculture The use of survey-based methods for eliciting public and stakeholder preferences Marine Policy 33(3) 452-457
189 Whitmarsh D amp Palmieri M G (2009) Social acceptability of marine aquaculture The use of survey-based methods for eliciting public and stakeholder preferences Marine Policy 33(3) 452-457
190 Maesano G Carra G amp Vindigni G (2019) Sustainable dimensions of seafood consumer purchasing behaviour A review Calitatea 20(S2) 358-364
55 - Appendices
are educated on the benefits 191 Using data from the Whitmarsh study enables us to estimate the willingness of consumers to pay for salmon reared to higher environmental standards To be conservative we have limited this calculation to UK consumers as the data used is drawn from a Scottish survey (see Table 31) This results in a $655 million cost over the seven years Separate calculations using Pollution Abatement Cost approach have been used in the main body of the report
Table 31 Willingness to pay for higher environmental standards 2013-2019 (MUSD)
Scotland2013 2014 2015 2016 2017 2018 2019
$85 $95 $78 $83 $109 $99 $105
As discussed above forage fish provide a range of ecosystem services that are external to the market value of the fish themselves Measuring these benefits holistically is challenging given the interconnected and complex nature of the marine ecosystem One proxy that we can consider is the economic value of predators that depend on forage fish for their survival The economic value of this is estimated at 113 billion globally or $219 per tonne (based on global landings of 515 million tonnes) In Scotland 460000 tonnes of forage fish are required to produce around 179000 tonnes of salmon192 This is a ratio of about 261 If we apply this ratio to Scottish landings since 2013 we can estimate the volume of forage fish consumed by the industry each year and apply our wild to farmed fish ratio The results are displayed in Table 32 The cumulative ecosystem loss is estimated to be in the region of $680 million However as discussed elsewhere this potentially grossly underestimates the full ecosystemexistence value as it does not include non-market prey such as seals and seabirds not to mention the economic value of marine tourism193
Table 32 Ecosystem value of forage fish used in Scottish salmon production (MUSD)
Scotland2013 2014 2015 2016 2017 2018 2019
$90 $100 $95 $91 $106 $87 $107
Worryingly if traditional feed formulations have plateaued in terms of reducing FMFO then we would expect the absolute number of wild caught fish to increase dramatically in line with plans to expand production In the case of Scotland this would mean doubling the volume of wild caught fish by 2020
Scottish government data show that over 35 million salmon have escaped from salmon farms since 1990 when records began Of these fewer than 100000 have been recovered suggesting an annual net figure of about 289000 per year In August of this year Mowi Scotland confirmed 48834 escapes from just one facility There are concerns about the impacts of escaped salmon on the wild population through infectious diseases lice and interbreeding194 In response to this event Fisheries Management Scotland has launched a research project on wild salmon genetics to gauge the impact of any interbreeding between wild and farm-raised salmon We also know that salmon stocks have seen dramatic declines The total rod catch for 2018 was the lowest on record and under 50 of the average for the period 2000-09195 Research by Scottish Enterprise has documented the negative economic effects of declining salmon stocks on rural businesses in Scotland196 Rod catches are only part of the story and there is
191 Popoff M MacLeod M amp Leschen W (2017) Attitudes towards the use of insect-derived materials in Scottish salmon feeds Journal of Insects as Food and Feed 3(2) 131-138
192 Feedback (2019) Fishy business Accessed Online httpsfeedbackglobalorgwp-contentuploads201906Fishy-business-the-Scottish-salmon-industrys-hidden-appetite-for-wild-fish-and-landpdf
193 Koehn L E Essington T E Marshall K N Sydeman W J Szoboszlai A I amp Thayer J A (2017) Trade-offs between forage fish fisheries and their predators in the California Current ICES Journal of Marine Science 74(9) 2448-2458
194 Ford J S amp Myers R A (2008) A global assessment of salmon aquaculture impacts on wild salmonids PLoS Biol 6(2) e33
195 Scottish Enterprise (2019) INVESTIGATION INTO THE IMPACT OF DECLINE IN SALMON NUMBERS ON RURAL BUSINESSES httpfmsscotwp-contentuploads201911Fraser-Associates-Impact-of-Decline-in-Salmon-Numbers-on-Rural-Businesses-Final-Draft-11-09-19-1pdf
196 Ibid
56 - Appendices
a similar finding for returning salmon the stocks of which have more than halved in the 20 years to 2016 to just over a quarter of a million As with our Norway estimates if we assume that 20 of these are due to salmon farming impacts we arrive at an estimate of 71000 wild salmon being lost to fish farming each year Using the same methodology as for Norway we estimate a WTP to restore wild salmon stocks in Scotland of $48 million at the household level A fifth of this cost gives us an annual cost to Scottish society of $15 million or $68 million cumulatively (see Table 30)197
Table 33 WTP estimates for restoration of salmon stocks
Scotland2013 2014 2015 2016 2017 2018 2019
$9601368 $9664056 $9719772 $9784684 $9850944 $9909100 $9982492
Finally we consider CO2 emissions Whilst the farmgate emissions from aquaculture are low relative to agriculture (one estimate for the UK is 324748 tonnes of CO2relative to over 9 million tonnes respectively or about 35) these estimates underestimate the true carbon cost of aquaculture once airfreight and feedstuffs are considered As demonstrated for Scotland salmon is not a truly local product but supports a vast global value chain198 If we assume a similar carbon footprint to Norwegian salmon based on Life Cycle Analysis (745 kg per kg) we find a cumulative cost $288 million over the seven year period (Table 34)
Table 34 Estimates of CO2 emissions from Scottish salmon farms
Scotland2013 2014 2015 2016 2017 2018 2019
$37725689 $41350373 $31568216 $40728203 $49427534 $41089631 $46143572
In conclusion we can see that there are substantial private and external costs from salmon farming that are not usually quantified and or monetised
Conclusion
A summary of the costs included in this study is provided in Table 35 As we can see this analysis gives us a total cost in the seven years to 2019 of almost USD$46 billion
Table 35 Summary of costs (MUSD)
Scotland
Mortalities 922
Lice 463
FMFO 859
Total economic cost 2233Salmon stocks 68
Pelagic fish stocks 680
Local pollution 288
Climate change 425
Total environmental cost 1461Fish welfare 902
Total social cost 902Total $4596
197 Household data taken from httpswwwnrscotlandgovukstatistics-and-datastatisticsstatistics-by-themehouseholdshousehold-estimates2019
198 Newton R W amp Little D C (2018) Mapping the impacts of farmed Scottish salmon from a life cycle perspective The International Journal of Life Cycle Assessment 23(5) 1018-1029
57 - Appendices
Appendix 3 ndash CanadaCanada has 25 of the entire worldrsquos coastline199 This along with its cold waters and access to the US market mean that its salmon farming industry is considered to have significant potential for growth200 Fisheries and Oceans Canada also report that aquaculture (of which Atlantic salmon is about 75) generates substantial growth and employment opportunities in rural areas201 However it has also come under increasingly intense public scrutiny over its environmental impact First Nations territorial rights and impacts on wild salmon202 An independent Auditorrsquos Report in 2018 found that Fisheries and Oceans Canada had made insufficient progress on a range of indicators such as risk assessment for disease auditing of fish health impact assessment of the use of drugs or pesticides on wild fish and measures to minimise escapes203 These concerns may partly explain why Canada has not seen the growth experienced by competitors with 2019 seeing a 2 fall in production204 In response to criticisms the Canadian Government has been researching and investing in new technologies such as land based RAS and hybrid systems IMTA systems205 and specifically identifies systems that offer the best combination of environmental social and economic performance206 Indeed the Liberal partyrsquos last manifesto included a pledge to shift all production to land-based systems as well as introduce the countryrsquos first aquaculture act207
Economic costs
Production figures have been accessed through Statistics Canada However these were not available for 2019 and have been calculated based on an FAO study that reported that production fell by 2 in Canada in 2019208 Unfortunately Canada does not publish annual mortalities data Although monthly mortalities data are available production data are published annually which makes it impossible to ascertain absolute mortalities In this study we have taken the average for Norway and Scotland and applied it to Canada This may well overestimate Canadarsquos mortalities but in the absence of official data this is the most plausible assumption If this is inaccurate we would encourage the Ministry of Oceans and Fisheries to publish these data Table 36 displays the calculations based on these data As we can see there is a total cost to Canadian farmers of USD$768 million
Table 36 Opportunity costs of mortalities in Canada 2013-2019
2013 2014 2015 2016 2017 2018 2019
$53 $59 $81 $143 $147 $130 $152
There have been a few attempts to estimate the cost of sea lice to salmon farms in Canada209 Based on 2000 prices Mustafa et al estimate that the total cost to salmon farmers was $056kg of salmon when the full costs such as reduced growth and feed conversation ratio Costello (2006) builds on these to develop global estimates for
199 Flaherty Mark et al ldquoPublic attitudes towards marine aquaculture in Canada insights from the Pacific and Atlantic coastsrdquo Aquaculture International 271 (2019) 9-32
200 httpswwwoag-bvggccainternetEnglishparl_cesd_201804_01_e_42992html
201 httpswwwdfo-mpogccaaquaculturesector-secteursocioindex-enghtm
202 Britten L (2019) BC First Nation sues feds over Atlantic salmon farming in Pacific waters httpswwwcbccanewscanadabritish-columbiabc-salmon-farming-lawsuit-14976042
203 httpswwwoag-bvggccainternetEnglishparl_cesd_201804_01_e_42992html
204 FAO (2020) Salmonrsquos upward growth trajectory grinds to a halt over COVID-19 httpwwwfaoorgin-actionglobefishmarket-reportsresource-detailfrc1296665
205 In IMTA species from different trophic levels are raised in proximity to one another with the organic and inorganic wastes of one cultured species serving as nutritional inputs for others IMTA has been shown to reduce benthic ecological impacts in proximity to Atlantic salmon farms improve social perceptions of aquaculture and provide potential financial benefits for aquaculture producers via product diversification faster production cycles and price premiums for IMTA products
206 httpswwwdfo-mpogccaaquaculturepublicationsssat-ets-enghtmltoc-6
207 The Fish Site (2019) Canadian farmers lambast ldquoirresponsiblerdquo Liberal call for land-based salmon farming httpsthefishsitecomarticlescanadian-farmers-lambast-irresponsible-liberal-call-for-land-based-salmon-farming
208 FAO (2020) Salmonrsquos upward growth trajectory grinds to a halt over COVID-19 httpwwwfaoorgin-actionglobefishmarket-reportsresource-detailfrc1296665
209 Pike A W amp Wadsworth S L (1999) Sea lice on salmonids their biology and control In Advances in parasitology (Vol 44 pp 233-337) Academic Press and Mustafa A Rankaduwa W amp Campbell P (2001) Estimating the cost of sea lice to salmon aquaculture in eastern Canada The Canadian veterinary journal 42(1) 54
58 - Appendices
Canada210 To avoid double counting with mortalities we have used treatment costs alone estimated at euro010 per kg for Canada This figure has been uprated to 2019 prices using average inflation in Canada since 2006211 and converted to USD Table 37 displays the results As we can see the cumulative costs are USD$111 million
Table 37 Costs of sea lice treatment in Canada 2013-2019 (MUSD)
Year Cost per kg Canada Total cost Canada
2013 0112 $12
2014 0114 $11
2015 0116 $16
2016 0117 $17
2017 0119 $17
2018 0122 $17
2019 0125 $17
Canada has historically relied less on cleaner fish to tackle sea lice A lumpfish hatchery is currently seeking approval to produce up to 3 million lumpfish212 However it has been stalled in 2020 by environmental reviews Nonetheless cleaner fish are increasingly seen a solution to Canadarsquos sea lice problem
Canada has historically used a lower proportion of marine ingredients in its aquafeed than competitors213 In 2013 Sarkar et al214 report these as 15-18 for fish meal and 12-13 for fish oil in 2013 This is down from 20ndash25 and 15ndash20 in 2005 Averages of the 2013 figures 165 and 125 have been used to estimate the cost of feed ingredients of marine origin to salmon farmers in Canada (Table 38) Cost of total feed estimates were drawn from Statistics Canada and the FAO The cumulative cost of the use of fish feed is USD$454
Table 38 Cost of FMFO in Canada 2013-2019 (MUSD)
2013 2014 2015 2016 2017 2018 2019
Canada FM cost $23 $30 $36 $35 $37 $41 $40
Canada FO cost $19 $26 $30 $29 $32 $35 $34
210 Costello M (2009) The global economic cost of sea lice to the salmonid farming industry Journal of fish diseases 32(1) 115
211 httpswwwinflationeueninflation-ratescanadahistoric-inflationcpi-inflation-canadaaspx
212 Khan I (2019) Lumpfish to be grown in Canadian hatchery httpswwwfishfarmingexpertcomarticlelumpfish-to-be-grown-in-canadian-hatchery~text=An20application20to20develop20Canadarsquoshas20been20put20into20motionamptext=The20hatchery20will20produce20threesea20lice20off20farmed20salmon
213 Sarker P K Bureau D P Hua K Drew M D Forster I Were K amp Vandenberg G W (2013) Sustainability issues related to feeding salmonids a Canadian perspective Reviews in Aquaculture 5(4) 199-219
214 Ibid
59 - Appendices
Social costs
As discussed negative public attitudes especially on the Pacific coast of Canada have been a brake on the growth of aquaculture215 One study of 68 countries found that Canada had the highest proportion of negative sentiment towards all kinds of aquaculture as well as the most polarized split between positive and negative opinions216 The strongest negative perceptions are held for salmon farming on both coasts217 As part of this fish welfare is an emerging animal welfare concern in Canada For the purposes of this study it was not possible to uncover any studies that looked at fish welfare as a discreet sub-section of ethicalsustainable production Instead we have used the EU estimate used elsewhere (14) This is plausible given that animal welfare standards are somewhat similar and (as discussed) there is plenty of evidence that Canadians care about animal welfare 85 of Canadian salmon exported to the US where animal welfare legislation is less stringent We have therefore limited our analysis to the 15 of salmon that is consumed domestically This is multiplied by the fish welfare premium of 14 The results are shown in Table 39 As we can see there is a total cost of USD$97 million
Table 39 Estimate of WTP for poor salmon welfare (MUSD)
Canada2013 2014 2015 2016 2017 2018 2019
$9 $9 $10 $16 $16 $17 $17
The second social cost considered in the other analyses is the impacts on fishing communities in developing countries Canada has a domestic FMFO industry and imports only small amounts from West Africa (160 tonnes) since 2013218 However using the job loss estimates applied to Mauritania we can see a loss to Senegal of $12 million Canada also imports FMFO from Peru where similar issues may arise but are out of scope for this study
Environmental costs
To estimate the environmental costs we have used data from studies that compare the use of IMTA technology with conventional salmon farming IMTA consists of farming in proximity aquaculture species from different trophic levels and with complementary ecosystem functions This strategy makes it possible for one speciesrsquo uneaten feed and wastes nutrients and by-products to be recaptured and turned into fertilizer feed and energy for the other crops219 The findings from this study suggest that the introduction of the IMTA salmon would increase the average household of those that do not consume salmon of between $255 per year and around $51 per year for five years Even in the most conservative estimate (eg where donrsquot knows were treated as no) the estimates are between $342 and $522 per year Using an average of these two most conservative estimates $432 and multiplying it by the number of households in Canada (based on the latest census data for that year)220 gives us an aggregate welfare increase of USD$307 million (Table 40) An average of the less conservative estimate gives a value of $627 million Separate calculations using Pollution Abatement Cost approach have been used in the main body of the report
215 Flaherty Mark et al ldquoPublic attitudes towards marine aquaculture in Canada insights from the Pacific and Atlantic coastsrdquo Aquaculture International 271 (2019) 9-32
216 Froehlich H E Gentry R R Rust M B Grimm D amp Halpern B S (2017) Public perceptions of aquaculture evaluating spatiotemporal patterns of sentiment around the world PloS one 12(1) e0169281
217 Flaherty Mark et al ldquoPublic attitudes towards marine aquaculture in Canada insights from the Pacific and Atlantic coastsrdquo Aquaculture International 271 (2019) 9-32
218 Greenpeace (2019) A Waste of Fish httpswwwgreenpeaceorginternationalpublication22489waste-of-fish-report-west-africa
219 Martinez-Espintildeeira R Chopin T Robinson S Noce A Knowler D amp Yip W (2016) A contingent valuation of the biomitigation benefits of integrated multi-trophic aquaculture in Canada Aquaculture economics amp management 20(1) 1-23
220 httpswww150statcangccan1daily-quotidien170913t001a-enghtm
60 - Appendices
Table 40 WTP for use of IMTA production system in Canada (MUSD)
Canada2013 2014 2015 2016 2017 2018 2019
$40 $40 $40 $46 $46 $46 $46
The indirect economic value of forage fish has been estimated at 113 billion globally or $219 per tonne (based on global landings of 515 million tonnes) Data are not available on the FIFO ratio for Canada Several authors have estimated FIFO ratios for forage fish to farmed salmon and estimated it to be around 51221 These data have been the subject of controversy however and have been rebutted by other studies222 Both found lower estimates of FIFO (21 and 0781 respectively) Canada has historically used fewer marine ingredients in its aquafeed than other countries and we have chosen therefore to use the most conversative FIFO ratio of 0781 Table 41 shows the tonnes of forage fish required to produce salmon in Canada and the associated annual cost Cumulatively the indirect cost of forage fish is $135 million
Table 41 Estimate of indirect cost of use of forage fish in salmon farming 2013-2019 (MUSD)
Canada2013 2014 2015 2016 2017 2018 2019
$16 $14 $20 $21 $20 $21 $20
Canadian government data show that almost 40000 salmon have escaped from salmon farms in Canada since records began223 Canada is home to seven different species of Pacific salmon as well as the Atlantic salmon on its eastern seaboard Both types of salmon have been experiencing a decades-long decline in returning stocks with 2019 being a particularly bad year for the Pacific salmon224 Findings on the impact of salmon farms on the wild population vary One study that compared the survival of wild salmon that travel near farms to those that donrsquot finding that upward of 50 per cent of the salmon that pass by farms donrsquot survive225 Other studies have found limited impact According to Nasco the Atlantic salmon has seen a 41 decline since the 1980s In total 436000 salmon returned to Canadian rivers in 2019226 a decline of 627415 If we assume 20 of this is because of salmon farming impacts (see Norway assumptions) this gives us a loss attributable to salmon farming of 188244 salmon over the period Using data from a Canadian study suggesting a USD$10 WTP per household we can estimate that the conservation value over the seven-year period is $187 million (see Table 42)
Table 42 Welfare loss from depletion of salmon stocks attributable to aquaculture
Canada2013 2014 2015 2016 2017 2018 2019
$24874940 $24874940 $24874940 $28144160 $28144160 $28144160 $28144160
221 Tacon AGL Metien M 2008 Global overview on the use of fish meal and fish oil in industrially compounded aquafeeds trends and future prospects Aquaculture 285 146ndash158 Welch A Hoenig R Stieglitz J Benetti D Tacon A Sims N amp OrsquoHanlon B (2010) From fishing to the sustainable farming of carnivorous marine finfish Reviews in Fisheries Science 18(3) 235-247
222 Byelashov Oleksandr A and Mark E Griffin ldquoFish in fish out Perception of sustainability and contribution to public healthrdquo Fisheries 3911 (2014) 531-535
223 httpsopencanadacadataendataset691dd994-4911-433d-b3b6-00349ba9f24e
224 httpswwwpacdfo-mpogccapacific-smon-pacifiquescienceresearch-recherche2019-summ-somm-enghtml
225 Ford J S amp Myers R A (2008) A global assessment of salmon aquaculture impacts on wild salmonids PLoS Biol 6(2) e33
226 Atlantic Salmon Federation (2020) 2020 STATE OF WILD ATLANTIC SALMON REPORT httpswwwasfcaassetsfilesasf-2020-state-of-population-v2pdf
61 - Appendices
As discussed elsewhere life cycle analysis of carbon emissions shows that Norway has the lowest impacts per unit production whereas impacts are consistently highest in the UK227 Several studies show that feed provision is the single most important contributor to resource use and emissions228 Carbon emissions have been estimated for Canadian salmon farms at 2300 kg of CO2 per tonne of salmon However as discussed in the main body of the report these are farmgate emissions which do not include emissions embedded in feedstuffs etc Using the Norwegian LCA data and the UKrsquos Department for Climate Change estimate of USD$72 per tonne gives us an estimate for Canada of USD$425 million (see Table 43)
Table 43 Climate change costs in Canadian salmon farming 2013-2019 (MUSD)
Canada2013 2014 2015 2016 2017 2018 2019
$52 $46 $65 $66 $64 $66 $64
Conclusion
A summary of the costs included in this study is provided in Table 44 As we can see this analysis gives us a total cost since 2013 of almost USD$23 billion
Table 44 Summary of costs for Canadian salmon farming 2013-2019 (MUSD)
Canada
Mortalities $768
Lice $111
FMFO $454
Total economic cost $1333Salmon stocks $187
Pelagic fish stocks $135
Local pollution $189
Climate change $425
Total environmental cost $936Fish welfare $97
Total social cost $97Total $2366
227 Pelletier N Tyedmers P Sonesson U Scholz A Ziegler F Flysjo A amp Silverman H (2009) Not all salmon are created equal life cycle assessment (LCA) of global salmon farming systems
228 Ibid
62 - Appendices
Appendix 4 ndash Chile
Although salmon is not a native species to Chile the climate in the southern part of the country offers suitable conditions for salmon farming which now represents the countryrsquos second largest export As with other regions the industry is seen as an important provider of jobs for people living in some of Chilersquos most remote communities The Chilean aquaculture industry has grown significantly since the late 1980s mainly farming salmon (Atlantic and coho) and trout229 According to Sernapesca total harvest for these species was the highest on record in 2019 with total salmon production reaching 907370 tonnes worth $73 billion230 Chile is the second largest producer of salmon with a share of about 25 globally231
In general regulations in Chile are weaker than in the other three countries For example there are no regulations based on carrying capacity estimates to limit maximum fish biomass per area or water body232 The level of antibiotics used in Chilersquos salmon farming industry is higher than in any other country in the world and is considered to have impacts on both animal welfare and the environment233 Profitability and growth have also been damaged by a series of crises relating to pollution escapes and mortalities In 2016 the industry experienced a crisis when heaps of dead fish washed ashore in Chiloeacute which according to Greenpeace was caused by salmon companies throwing 9000 tons of dead fish into the sea which were consumed by other wildlife234 In 2018 nearly 700000 were reported to have escaped into the wild and in 2020 the Marine Farm company notified SERNAPESCSA of an event that led to the death of ten thousand fish (43 tonnes) of fish because of an algal bloom235 In 2018 to boost production rules were relaxed (salmon farmers are now able to increase stocking by up to 9 per cycle up from 3)236 Although related to baseline fish health performance this creates risks for further health and welfare problems
Data on Chile are also far more limited and the impact of unintended outcomes is largely unquantified237 Production data have been accessed through Sernapesca As with Canada Chile does not publish annual mortalities data Although monthly mortalities data are available production data are published annually which makes it impossible to ascertain absolute mortalities In this study we have taken the average for Norway and Scotland and applied it to Chile We have no sense of how accurate this is for Chile but in the absence of official data this is the most plausible assumption
The costs of FMFO were estimated through by taking the total amount of feed used in salmon production as reported in the 2019 salmon industry handbook The data published are 2015-2018 and the missing years were extrapolated from those based on production statistics There are two sources of data on FMFO in meal in Chile The first is from the FAO238 for 2010 (20-25 FM and 12 FO) and second is from the salmon industry
229 Quinones R A Fuentes M Montes R M Soto D amp Leoacuten-Muntildeoz J (2019) Environmental issues in Chilean salmon farming a review Reviews in Aquaculture 11(2) 375-402
230 Fish Farming Expert (2019) Chile harvested nearly 1m tonnes of salmonids in 2019 httpswwwfishfarmingexpertcomarticlechilean-salmonid-production-close-to-1-million-tonnes-in-2019
231 Iversen A Asche F Hermansen Oslash amp Nystoslashyl R (2020) Production cost and competitiveness in major salmon farming countries 2003ndash2018 Aquaculture 522 735089
232 Quinones R A Fuentes M Montes R M Soto D amp Leoacuten-Muntildeoz J (2019) Environmental issues in Chilean salmon farming a review Reviews in Aquaculture 11(2) 375-402
233 Claudio Miranda Felix Godoy and Matthew Lee rdquoCurrent Status of the Use of Antibiotics and the Antimicrobial Resistance in the Chilean Salmon Farmsrdquo Frontiers in Microbiology June 18 2018 httpswwwfrontiersinorgarticles103389fmicb201801284ful
234 Haggebrink E (2020) Chilean Aquaculture Expansion into Troubled Waters httpswwwsustainalyticscomesg-blogchilean-aquaculture-expansion-into-troubled-waters_edn3
235 Mercopress (2020) Massive mortality of Atlantic salmon species in south Chilean farms httpsenmercopresscom20200416massive-mortality-of-atlantic-salmon-species-in-south-chilean-farms
236 Evans O (2018) New rules allow Chilean salmon farms to expand production by up to 9 httpssalmonbusinesscomnew-rules-allow-chilean-salmon-farms-to-expand-production-by-up-to-9
237 Poblete E G Drakeford B M Ferreira F H Barraza M G amp Failler P (2019) The impact of trade and markets on Chilean Atlantic salmon farming Aquaculture International 27(5) 1465-1483
238 Tacon A G Hasan M R amp Metian M (2011) Demand and supply of feed ingredients for farmed fish and crustaceans trends and prospects FAO Fisheries and Aquaculture technical paper (564) I
63 - Appendices
handbook for 2017 (9 FM and 7 FO)239 The intervening years have been estimated based on a linear decline These data suggest that Chilean salmon farming has greatly reduced its reliance on wild fish since 2013 The results of these calculations are set out in Table 45 Using the same commodity prices used elsewhere in the report we find a total cost to Chilean farmers since 2013 of just over USD$2 billion
Table 45 FMFO calculations Chile (2013-2019)
2013 2014 2015 2016 2017 2018 2019 Total
Atlantic salmon (t) 492329 644459 608546 532225 61418046 66113839 701984 4254862Feed (t) 997210 1312118888 1239000 1038000 1196000 1289000 1368635
FM 17 15 13 11 9 9 9
FO 10 9 8 8 7 7 7
FM (t) 166677 147445 128213 108981 89749 89749 89749 820562FO (t) 98296 91174 84051 76928 69805 69805 69805 559862Cost of FM (MUSD) 219 190 162 136 110 109 108 1037Cost of FO (MUSD) 205 176 151 130 102 139 101 1007
For the remaining calculations averages were generally used from other countries included in this analysis and the details of these calculations have been set out in the main body of the report
239 Mowi (2019) Salmon farming handbook 2019 httpsmlglobenewswirecomResourceDownload1766f220-c83b-499a-a46e-3941577e038b
64 - Appendices
justeconomicscouk
- _Hlk517025023
- _Hlk57026626
- _Hlk55901908
- _Hlk55901836
- _Hlk55905862
- _Hlk55901759
- _Hlk55896551
- _Hlk55896592
- _Hlk55577993
- _Hlk55578010
- _Hlk55578221
- _Hlk55578919
- _Hlk55898342
- _Hlk55898411
- _Hlk55901505
- _Hlk59182749
- _Hlk59183061
- Figure 1 Main causes of mortalities
- Abbreviations
- Executive summary
- 1 Introduction
- 2 Methodology
-
- 21 Overall approach
- 22 Limitations and caveats
-
- 3 Findings
-
- 31 Economic issues
- 32 Environmental issues
- 33 Social issues
-
- 4 Conclusions and recommendations
-
- 41 Conclusions
- 42 Recommendations
- Appendix 1 ndash Norway
- Appendix 2 ndash Scotland
- Appendix 3 ndash Canada
- Appendix 4 ndash Chile
-
- Table 1 Variables included and not included in country level analysis
- Table 2 Estimated mortalities and associated losses by producer (2010-2019)
- Table 3 Summary of costs for each variable by country (MUSD)
- Table 4 Variables included and not included in country level analysis
- Table 5 Mortality opportunity costs in Scotland Norway Canada and Chile
- Table 6 Costs of lice control measures across four countries (MUSD)
- Table 7 FMFO costs in four countries (MUSD)
- Table 8 Top ten salmon producing companies by revenue (2018) (MUSD)
- Table 9 Estimates of losses and associated costs (2010-2019)
- Table 10 Estimates for cost of sea lice for top ten producers 2013-2019 (MUSD)
- Table 11 Estimate of welfare loss to households from destruction of wild salmon stocks attributable to aquaculture (2013-2019)
- Table 12 Estimate of indirect cost of use of forage fish in salmon farming 2013-2019
- Table 13 Pollution Abatement Costs for four countries (MUSD)
- Table 14 Cumulative costs of CO2 emissions in salmon farming (MUSD)
- Table 15 Salmon welfare premium (MUSD)
- Table 16 Summary of costs (in MUSD)
- Table 17 Examples of positive benefits from salmon farming
- Table 18 Opportunity costs of mortalities in Norway
- Table 19 Cost of FMFO 2013-2019 (MUSD)
- Table 20 WTP calculation for higher fish welfare (MUSD)
- Table 21 Assumptions in social calculations for Mauritania
- Table 22 Estimate of annual pollution abatement cost
- Table 23 Loss of value as a result of forage fish being used in FMFO in Norway 2013-2019
- Table 24 Emissions costs
- Table 25 Summary of costs (MUSD)
- Table 26 Opportunity costs of Scottish mortalities 2013-2019thinsp
- Table 27 Estimate of cost of lice treatment in Scotland 2013-2019 (USD)
- Table 28 Cost estimates FMFO in Scottish salmon farming (MUSD)
- Table 29 Ownership of Scottish salmon farms
- Table 30 Fish welfare premium for Scottish and EU consumers (MUSD)
- Table 31 Willingness to pay for higher environmental standards 2013-2019 (MUSD)
- Table 32 Ecosystem value of forage fish used in Scottish salmon production (MUSD)
- Table 33 WTP estimates for restoration of salmon stocks
- Table 34 Estimates of CO2 emissions from Scottish salmon farms
- Table 35 Summary of costs (MUSD)
- Table 36 Opportunity costs of mortalities in Canada 2013-2019
- Table 37 Costs of sea lice treatment in Canada 2013-2019 (MUSD)
- Table 38 Cost of FMFO in Canada 2013-2019 (MUSD)
- Table 39 Estimate of WTP for poor salmon welfare (MUSD)
- Table 40 WTP for use of IMTA production system in Canada (MUSD)
- Table 41 Estimate of indirect cost of use of forage fish in salmon farming 2013-2019 (MUSD)
- Table 42 Welfare loss from depletion of salmon stocks attributable to aquaculture
- Table 43 Climate change costs in Canadian salmon farming 2013-2019 (MUSD)
- Table 44 Summary of costs for Canadian salmon farming 2013-2019 (MUSD)
- Table 45 FMFO calculations Chile (2013-2019)
-
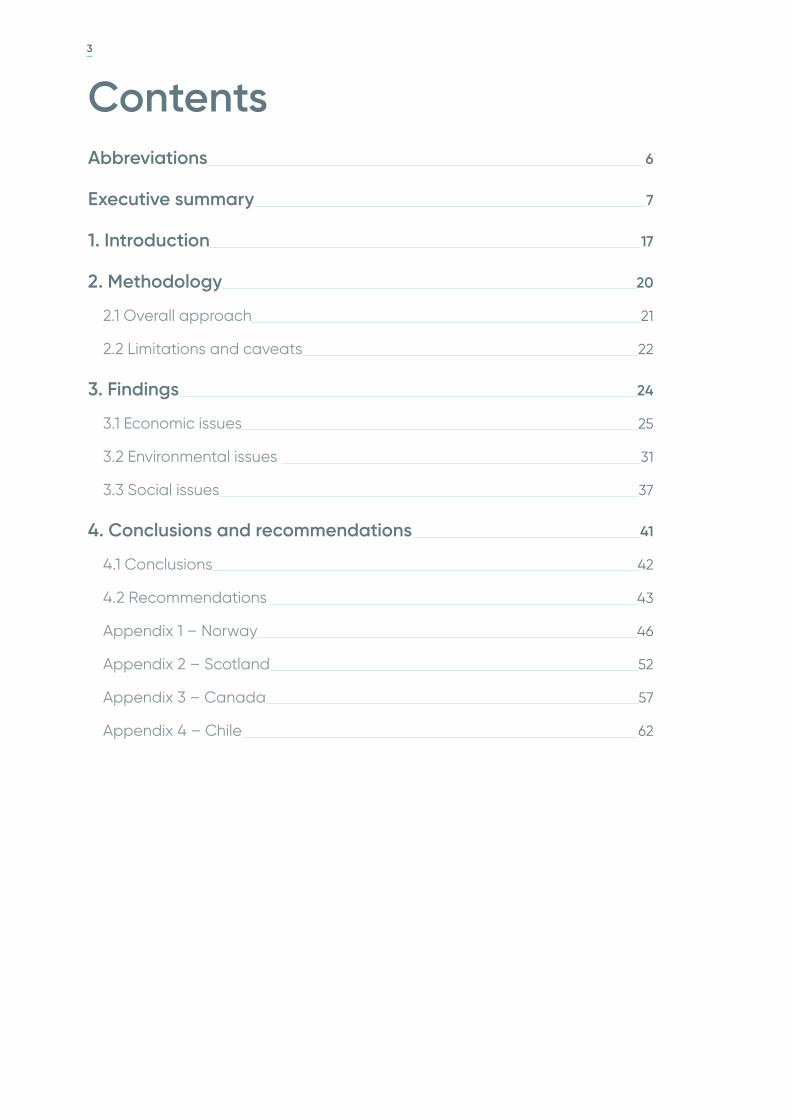
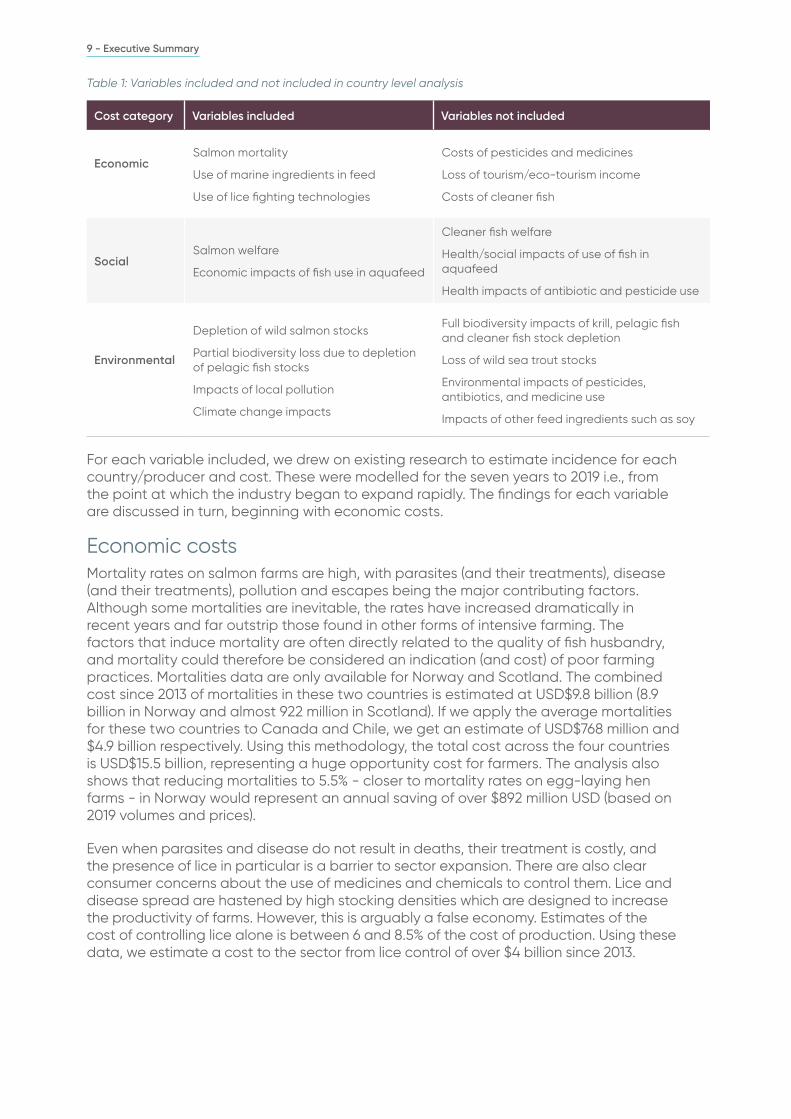