dead reckoning and magnetic declination: unveiling the ... the mystery of portolan charts keywords :...
TRANSCRIPT
e-Perimetron, Vol. 3, No. 4, 2008 [191-203] www.e-perimetron.org | ISSN 1790-3769
[191]
Joaquim Alves Gaspar*
Dead reckoning and magnetic declination:
unveiling the mystery of portolan charts
Keywords: medieval charts; cartometric analysis; history of cartography; map projections of old charts; portolan charts
Summary
For more than two centuries much has been written about the origin and method of construction of the Mediterranean portolan charts; still these matters continue to be the object of some controversy as no one explanation was able to gather unanimous agreement among researchers. If some theory seems to prevail, that is certainly the one asserting the medieval origin of the portolan chart, which would have followed the introduction of the marine compass in the Mediterranean, when the pilots start to plot the magnetic directions and estimated distances between ports observed at sea. In the research here presented a numerical model which simulates the construction of the old portolan charts is tested. This model was developed in the light of the navigational methods available at the time, taking into account the spatial distribution of the magnetic declination in the Mediterranean, as estimated by a geomagnetic model based on paleomagnetic data. The results are then compared with two extant charts using cartometric analysis techniques. It is concluded that this type of methodology might contribute to a better understanding of the geometry and methods of construction of the portolan charts. Also, the good agreement between the geometry of the analysed charts and the model’s results clearly supports the a-priori assumptions on their method of construction.
Introduction
The medieval portolan chart has been considered as a unique achievement in the history of maps and marine navigation, and its appearance one of the most representative turning points in the development of nautical cartography. It took place in a time when the cartographic representation of the known world, in general, and terrestrial cartography, in particular, were still in its pre-scientific era. The oldest known portolan chart, the Carta Pisana (Pisan chart), was made around 1285 and its accuracy and detail are so striking, when compared with the symbolic representations of the known world made at the time, that we are tempted to believe that the techniques used in its construction were already known for at least some decades before. For more than two centuries, much has been written about the origin and method of construction of the portolan chart; still these matters continue to be the object of some controversy as no one theory was able to gather
unanimous agreement1. If some consensus exists today, that is certainly on the medieval origin of the portolan chart and on the close connection between its development and the appearance of the
marine compass in the Mediterranean2. Also the possibility that some map projection (especially * Professor of Cartographic Sciences, New University of Lisbon. [[email protected]] 1 An overview of the most relevant theories on the origin and construction of the portolan charts, including a discussion on the underlying map projection and the role of magnetic declination, is given by Campbell, 1987, p. 380-390. 2 Campbell, 1987, p. 384-5

e-Perimetron, Vol. 3, No. 4, 2008 [191-203] www.e-perimetron.org | ISSN 1790-3769
[192]
the plate carré or Mercator projection) was deliberately used in its drawing has lost most of its credibility, being generally accepted that the underlying projection of portolan charts must have been the accidental result of the method of construction. That is indeed the conclusion reached in the pioneering works of Lanman (1987) and Loomer (1987), though the authors don’t agree on the
charting techniques used 3. It is the objective of the present paper to contribute to a better under-standing on how the Mediterranean portolan chart was constructed, through the use of cartometric techniques and numerical modelling applied to two extant charts. It will be shown that its geome-try can be replicated by plotting directly on a plane, with a constant scale, the magnetic directions and estimated distances between places observed by the pilots at sea, as if the Earth were flat. For that purpose a numerical model which simulates the construction of those charts, using a general-ized concept of multidimensional scaling (mds), will be presented and tested. The spatial distribu-tion of the magnetic declination in the Mediterranean area will be given by a geomagnetic model proposed by Korte and Constable (2005).
Figure 1. Equidistant azimuthal projection centred at Genoa
Empirical map projections
Suppose that a map is to be drawn at about 1250 A.D. so that all distances and directions, as measured along great circles from the city of Genoa, were conserved. Assuming it was possible, at the time, to make all those measurements, the result would be an old map projection known as the
3 While Lanman (1987) defends that portolan charts were drawn by plotting on a plane, with a constant scale, the bearings and distances observed at sea, Loomer (1987) considers that the charts were constructed using a trian-gulation scheme.
e-Perimetron, Vol. 3, No. 4, 2008 [191-203] www.e-perimetron.org | ISSN 1790-3769
[193]
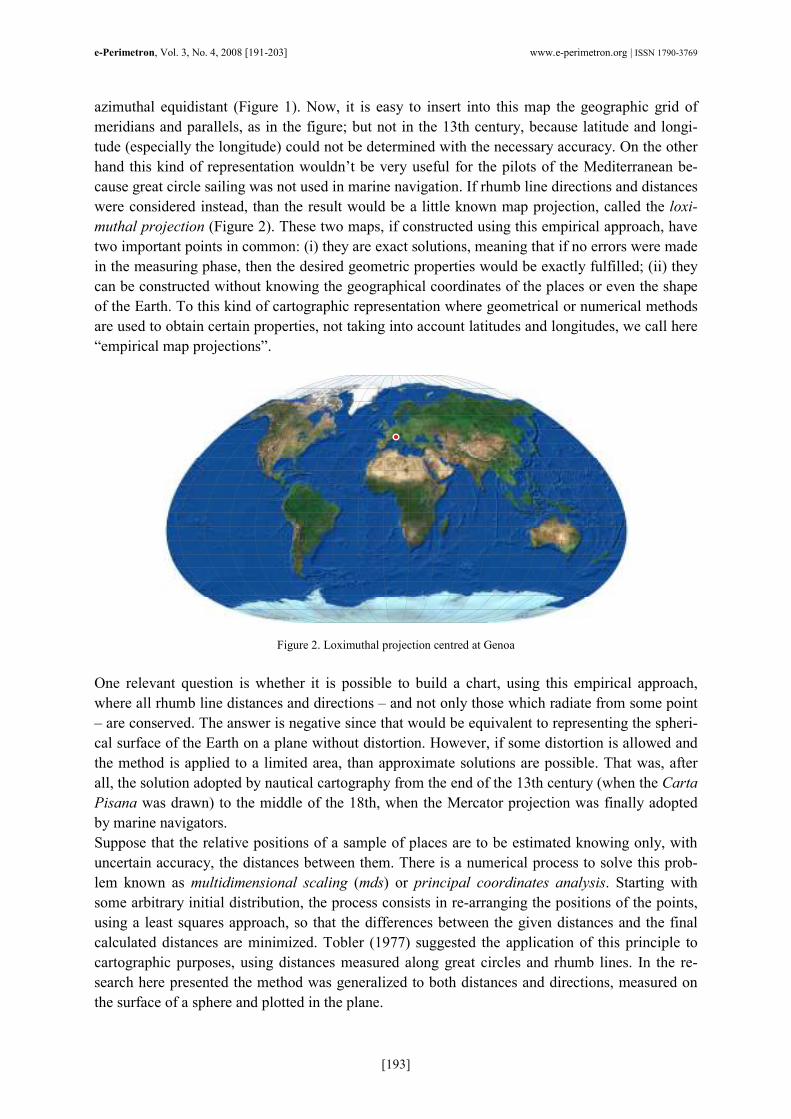
azimuthal equidistant (Figure 1). Now, it is easy to insert into this map the geographic grid of meridians and parallels, as in the figure; but not in the 13th century, because latitude and longi-tude (especially the longitude) could not be determined with the necessary accuracy. On the other hand this kind of representation wouldn’t be very useful for the pilots of the Mediterranean be-cause great circle sailing was not used in marine navigation. If rhumb line directions and distances were considered instead, than the result would be a little known map projection, called the loxi-muthal projection (Figure 2). These two maps, if constructed using this empirical approach, have two important points in common: (i) they are exact solutions, meaning that if no errors were made in the measuring phase, then the desired geometric properties would be exactly fulfilled; (ii) they can be constructed without knowing the geographical coordinates of the places or even the shape of the Earth. To this kind of cartographic representation where geometrical or numerical methods are used to obtain certain properties, not taking into account latitudes and longitudes, we call here “empirical map projections”.
Figure 2. Loximuthal projection centred at Genoa
One relevant question is whether it is possible to build a chart, using this empirical approach, where all rhumb line distances and directions – and not only those which radiate from some point – are conserved. The answer is negative since that would be equivalent to representing the spheri-cal surface of the Earth on a plane without distortion. However, if some distortion is allowed and the method is applied to a limited area, than approximate solutions are possible. That was, after all, the solution adopted by nautical cartography from the end of the 13th century (when the Carta Pisana was drawn) to the middle of the 18th, when the Mercator projection was finally adopted by marine navigators. Suppose that the relative positions of a sample of places are to be estimated knowing only, with uncertain accuracy, the distances between them. There is a numerical process to solve this prob-lem known as multidimensional scaling (mds) or principal coordinates analysis. Starting with some arbitrary initial distribution, the process consists in re-arranging the positions of the points, using a least squares approach, so that the differences between the given distances and the final calculated distances are minimized. Tobler (1977) suggested the application of this principle to cartographic purposes, using distances measured along great circles and rhumb lines. In the re-search here presented the method was generalized to both distances and directions, measured on the surface of a sphere and plotted in the plane.

e-Perimetron, Vol. 3, No. 4, 2008 [191-203] www.e-perimetron.org | ISSN 1790-3769
[194]
Figure 3. Interface of the application “Empirical Map Projection”
Figure 3 shows the interface of a computer application developed with MapLab®, which applies the generalized mds procedure to the simulation of old cartographic representations. The input of the model (“Domain”, in the figure) is a sample of points in a certain area, defined either by the nodes of a chosen geographic grid (“Geographic grid”, in the picture) or by the positions defined by some given maritime tracks hypothetically used to construct the chart to be simulated (“Use tracks…”, in the figure). The output is a cartographic representation of the points in a plane, so that the sums of the squares of the differences between the distances and directions measured in the Earth and in the plane are minimized. Two types of lines can be chosen (“Method”, in the figure): arcs of great circle (orthodromes), which represent the shortest distance between places; and rhumb lines (loxodromes), which make constant angles with the meridians and are normally used in marine navigation. For the rhumb-line case, two types of charting methods (plus a mixed one) are considered: the portolan method, in which positions are plotted in the plane according to
the course (bearing) and distance between the two points4; and the latitude method, in which the
observed latitude is also used5. A weighting factor, w, is defined so that the relative importance of distances and directions in the numerical optimization process can be continuously adjusted from a minimum value of 0 (only distances considered) to a maximum value of 1 (only directions con-sidered). Also the model allows the application of some constraints to the domain (“Restrictions”, in the picture), especially on the maximum distance allowed between points (“Distances less then…”, in the figure). Finally, it is possible to affect all directions between points by the mag-
4 The expression “point of fantasy”, in the figure, refers to the name given by the Portuguese pilots to the corre-sponding navigational technique, in which the distance sailed by the ship since the last known position was esti-mated according to the “fantasy” of the pilot. 5 The latitude method will not be used here to simulate the construction of the portolan chart, as astronomical methods were introduced only in the second half of the 15th century, for the navigation in the Atlantic. The ship’s position so determined was called ponto de esquadria (here translated as “set point”) by the 16th century Portu-guese pilots.

e-Perimetron, Vol. 3, No. 4, 2008 [191-203] www.e-perimetron.org | ISSN 1790-3769
[195]
netic declination at a given time, given by the geomagnetic model CALS7K2 of Korte and Con-stable (2005) (“Magnetic declination”, in the figure). Figure 4 shows some test outputs of the model for the area of the Mediterranean and Black Sea. If a value of 0 is assigned to the weighting parameter, w, then only distances are considered and the result will be identical to the one obtained by Tobler (1977), for the same region. If a value of 1 is assigned to the weighting parameter, then only directions are considered, and an exact solution is obtained where rhumb-lines are represented by straight segments making true angles with all me-ridians, i.e., the Mercator projection. Finally, if a value of 0.5 is assigned to the weighting parame-ter, so that distances and directions have the same relative importance in the optimization process, then the result will be a pseudocylindrical map projection, with straight parallels and curved me-ridians. Finally, if the magnetic declination for 1300 is included a twisted Mediterranean basin resembling the extant portolan charts will be obtained.
w = 1
w = 0 w = 0.5
w = 0.5; declination 1300(Mercator projection)
(Tobler, 1977)
Figure 4. Test model outputs: w = 0 (only distances: Tobler, 1977); w = 1 (only directions: Mercator projection); w = 0.5
(distances and directions: pseudocylindrical projection); w = 0.5 with magnetic declination as of 1300.
In the test examples the nodes of the geographic grid were used as the model input and no restric-tions were imposed on the domain, so that the distances between all possible pairs of points were considered. However, and because most maritime tracks between ports in the Mediterranean are relatively short, it makes little sense to use very large distances as an input. For that reason a con-straint in the maximum distance allowed, dmax, will be used as a tuning parameter in the follow-ing simulations.
Cartometric analysis
Two portolan charts will be simulated: the Angelino Dulcert’s chart, of 1339 6, and Jorge de
Aguiar’s chart, of 1492 7. The former is of Genoese origin, most certainly by the same author of
6 Angelino Dulcert’s chart of 1339 is kept in the French National Library, in Paris.

e-Perimetron, Vol. 3, No. 4, 2008 [191-203] www.e-perimetron.org | ISSN 1790-3769
[196]
an older one, signed Angelino Dalorto (c. 1330)8. It is among the oldest known portolan charts and it has a great historical importance, being the first to represent the Atlantic archipelagos of Madeira and Canary.
Figure 5. Geographic grid of meridians and parallels implicit in Angelino Dulcert’s chart
The second is of Portuguese origin, the oldest dated and signed Portuguese nautical chart, and was drawn in a period when the portolan model was been replaced by the latitude model, the so-called plane chart. However it is clear that this chart is still based on the older portolan model. In Fig-ures 5 and 6 the grids of meridians and parallels implicit to both representations, as estimated and
drawn with MapAnalist9, on the basis of about 100 hundred control points, are shown. The visual inspection of these grids suggests the following comments: - Both grids are tilted counter clockwise. The rotation angle is about 10º in Dulcert’s chart and
8º in Aguiar’s chart; - Meridians and parallels are roughly straight and normal to each other, but the grid of Aguiar’s
chart is more regular; - There is a slight convergence of the meridians in both cases, which can be assessed by com-
paring the lengths of the upper and lower parallels; - An irregularity in the orientation of the parallels occur, in both charts, in the area 38º - 42ºN,
20º - 28ºE. This is common to many other portolan charts and it is probably due to a local magnetic anomaly, affecting the behaviour of the compasses;
- There is an east-west scale variation in Dulcert’s chart, summing up to about 15%, which can be assessed by comparing the lengths of the parallel and meridian segments in the western and eastern limits of the grid. As asserted by various authors and referred by Campbell (1987, pp.
7 Jorge de Aguiar’s chart is kept in the Beinecke Library - Yale University, USA. 8 Pujades (2007, p. 255) has recently confirmed that Angelino Dulcert/Dalorto was a Geonoese cartographer named Angelino Dulceto. 9 MapAnalist is a freeware computer application by Bernhard Jenny and Adrian Weber, Institute of Cartography, ETH Zurich (http://mapanalyst.cartography.ch/)
e-Perimetron, Vol. 3, No. 4, 2008 [191-203] www.e-perimetron.org | ISSN 1790-3769
[197]
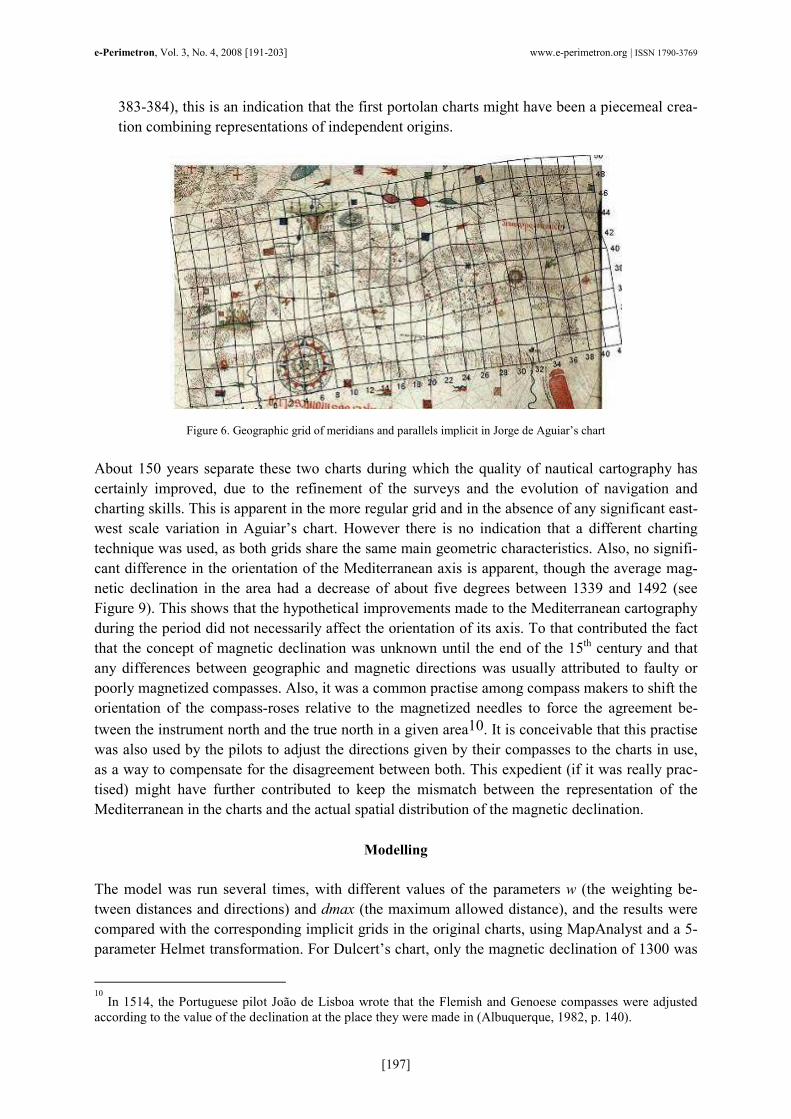
383-384), this is an indication that the first portolan charts might have been a piecemeal crea-tion combining representations of independent origins.
Figure 6. Geographic grid of meridians and parallels implicit in Jorge de Aguiar’s chart
About 150 years separate these two charts during which the quality of nautical cartography has certainly improved, due to the refinement of the surveys and the evolution of navigation and charting skills. This is apparent in the more regular grid and in the absence of any significant east-west scale variation in Aguiar’s chart. However there is no indication that a different charting technique was used, as both grids share the same main geometric characteristics. Also, no signifi-cant difference in the orientation of the Mediterranean axis is apparent, though the average mag-netic declination in the area had a decrease of about five degrees between 1339 and 1492 (see Figure 9). This shows that the hypothetical improvements made to the Mediterranean cartography during the period did not necessarily affect the orientation of its axis. To that contributed the fact that the concept of magnetic declination was unknown until the end of the 15th century and that any differences between geographic and magnetic directions was usually attributed to faulty or poorly magnetized compasses. Also, it was a common practise among compass makers to shift the orientation of the compass-roses relative to the magnetized needles to force the agreement be-
tween the instrument north and the true north in a given area10. It is conceivable that this practise was also used by the pilots to adjust the directions given by their compasses to the charts in use, as a way to compensate for the disagreement between both. This expedient (if it was really prac-tised) might have further contributed to keep the mismatch between the representation of the Mediterranean in the charts and the actual spatial distribution of the magnetic declination.
Modelling
The model was run several times, with different values of the parameters w (the weighting be-tween distances and directions) and dmax (the maximum allowed distance), and the results were compared with the corresponding implicit grids in the original charts, using MapAnalyst and a 5-parameter Helmet transformation. For Dulcert’s chart, only the magnetic declination of 1300 was
10 In 1514, the Portuguese pilot João de Lisboa wrote that the Flemish and Genoese compasses were adjusted
according to the value of the declination at the place they were made in (Albuquerque, 1982, p. 140).

e-Perimetron, Vol. 3, No. 4, 2008 [191-203] www.e-perimetron.org | ISSN 1790-3769
[198]
considered; for Aguiar’s chart the declinations of 1300, 1400 and 1500 were considered. Figures 7 and 8 show the model outputs for the cases where a better agreement was achieved.
5.0º
4.0º
4.0º
4.0º
5.0º
2.0º
1.0º
3.0º
3.0º6.0º
Figure 7. Model results for Dulcert’s chart (w = 0.8, dmax =15º, declination as of 1300). The vectors and circles represent
displacements from the original; the isolines represent clockwise rotation, in degrees, from the original
3.0
3.0
5.0
0.0
1.0
1.0
2.0
2.0
4.0
4.0
Figure 8. Model results for Aguiar’s chart (w = 0.8, dmax =15º, declination as of 1300). The vectors and circles represent displacements from the original; the isolines represent clockwise rotation, in degrees, from the original.
In Tables I and II the values of the following quality parameters are presented (distances are in arbitrary units close to the length of one degree of latitude):
− s : root-mean-square positional error, Nds i∑= 2 , where di is the distance between the
positions of point i in the original chart and in the model. A value of 0 means there is a perfect match between the original chart and the model output;
− µ : average positional error, Ndi∑=µ , where di is the distance between the positions of
point i in the original chart and in the model. A value of 0 means there is a perfect match be-tween the original chart and the model output;
− k : ratio 10 kkk = , where k0 and k1 are the ratios between the lengths of one degree of parallel
and one degree of meridian, respectively, in the original chart and in the model. Only the cen-
e-Perimetron, Vol. 3, No. 4, 2008 [191-203] www.e-perimetron.org | ISSN 1790-3769
[199]
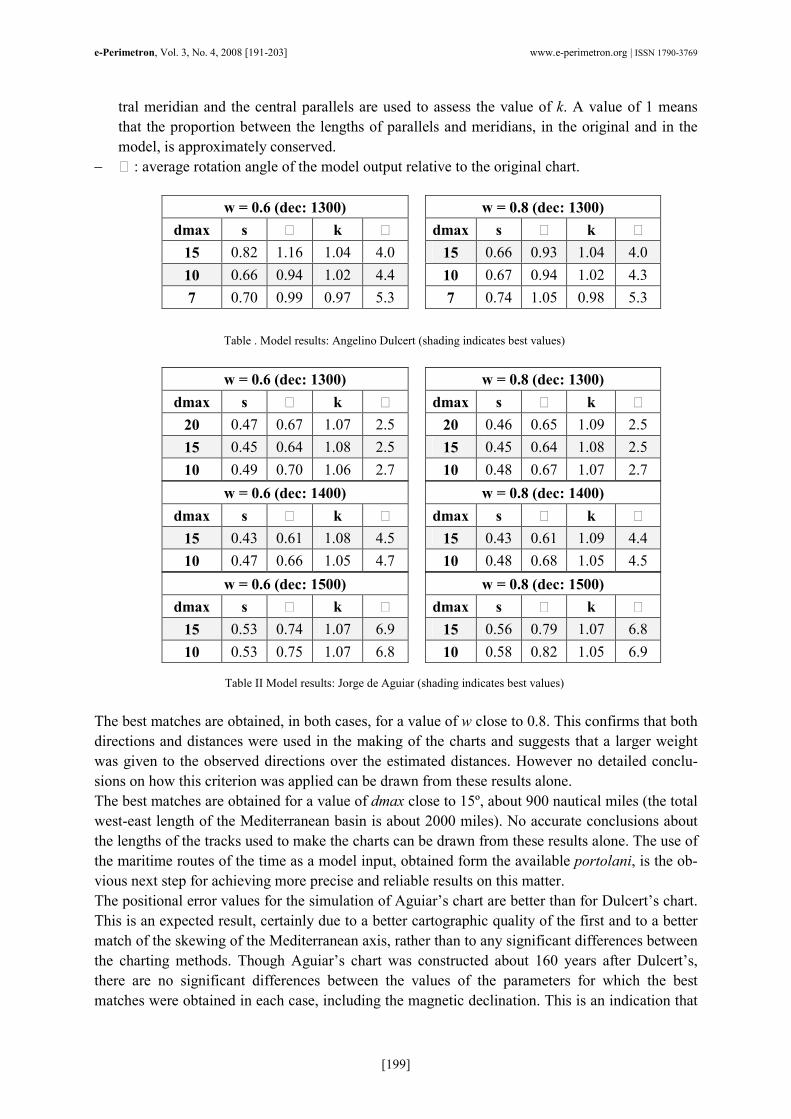
tral meridian and the central parallels are used to assess the value of k. A value of 1 means that the proportion between the lengths of parallels and meridians, in the original and in the model, is approximately conserved.
− : average rotation angle of the model output relative to the original chart.
Table . Model results: Angelino Dulcert (shading indicates best values)
Table II Model results: Jorge de Aguiar (shading indicates best values)
The best matches are obtained, in both cases, for a value of w close to 0.8. This confirms that both directions and distances were used in the making of the charts and suggests that a larger weight was given to the observed directions over the estimated distances. However no detailed conclu-sions on how this criterion was applied can be drawn from these results alone. The best matches are obtained for a value of dmax close to 15º, about 900 nautical miles (the total west-east length of the Mediterranean basin is about 2000 miles). No accurate conclusions about the lengths of the tracks used to make the charts can be drawn from these results alone. The use of the maritime routes of the time as a model input, obtained form the available portolani, is the ob-vious next step for achieving more precise and reliable results on this matter. The positional error values for the simulation of Aguiar’s chart are better than for Dulcert’s chart. This is an expected result, certainly due to a better cartographic quality of the first and to a better match of the skewing of the Mediterranean axis, rather than to any significant differences between the charting methods. Though Aguiar’s chart was constructed about 160 years after Dulcert’s, there are no significant differences between the values of the parameters for which the best matches were obtained in each case, including the magnetic declination. This is an indication that
w = 0.6 (dec: 1300) w = 0.8 (dec: 1300)
dmax s * k * dmax s * k *
15 0.82 1.16 1.04 4.0 15 0.66 0.93 1.04 4.0
10 0.66 0.94 1.02 4.4 10 0.67 0.94 1.02 4.3
7 0.70 0.99 0.97 5.3 7 0.74 1.05 0.98 5.3
w = 0.6 (dec: 1300) w = 0.8 (dec: 1300)
dmax s * k * dmax s * k *
20 0.47 0.67 1.07 2.5 20 0.46 0.65 1.09 2.5
15 0.45 0.64 1.08 2.5 15 0.45 0.64 1.08 2.5
10 0.49 0.70 1.06 2.7 10 0.48 0.67 1.07 2.7
w = 0.6 (dec: 1400) w = 0.8 (dec: 1400)
dmax s * k * dmax s * k *
15 0.43 0.61 1.08 4.5 15 0.43 0.61 1.09 4.4
10 0.47 0.66 1.05 4.7 10 0.48 0.68 1.05 4.5
w = 0.6 (dec: 1500) w = 0.8 (dec: 1500)
dmax s * k * dmax s * k *
15 0.53 0.74 1.07 6.9 15 0.56 0.79 1.07 6.8
10 0.53 0.75 1.07 6.8 10 0.58 0.82 1.05 6.9

e-Perimetron, Vol. 3, No. 4, 2008 [191-203] www.e-perimetron.org | ISSN 1790-3769
[200]
the construction methods did not vary significantly with time and that the orientation of the Medi-terranean basin in Aguiar’s chart was probably copied from some older prototype. The relation between the skewing of the Mediterranean and the evolution of the magnetic declination with time will be discussed with more detail in the next section.
Magnetic declination and the Mediterranean skewing
Figure 9 shows the variation of the magnetic declination () at some locations in the Mediterra-nean and Black Sea, between 1200 and 1600, as estimated by the geomagnetic model CALS7K2 of Korte and Constable (2005). Regarding the average value of and its variation with time, the whole area can be divided in two zones: a western and central zone, where )is almost always positive (eastern), with an extreme value of about 10ºE, in 1200, and values less than 4º, in 1600; and an eastern zone, including the Black Sea, where varies from 5ºE, in 1200, to about 5ºW, in 1600. The only position where the time variation of doesn’t follow this general rule is the west-ern extreme of the basin (Gibraltar). Figure 9 also shows the average skew of the Mediterranean
axis in some portolan charts, as estimated by Lanman (1987, p. 25) 11. Two facts are apparent from these data: (i) there is no clear variation of the charts’ average angle of rotation with time, as noted by Lanman (1987, p. 27-31), although the average value of
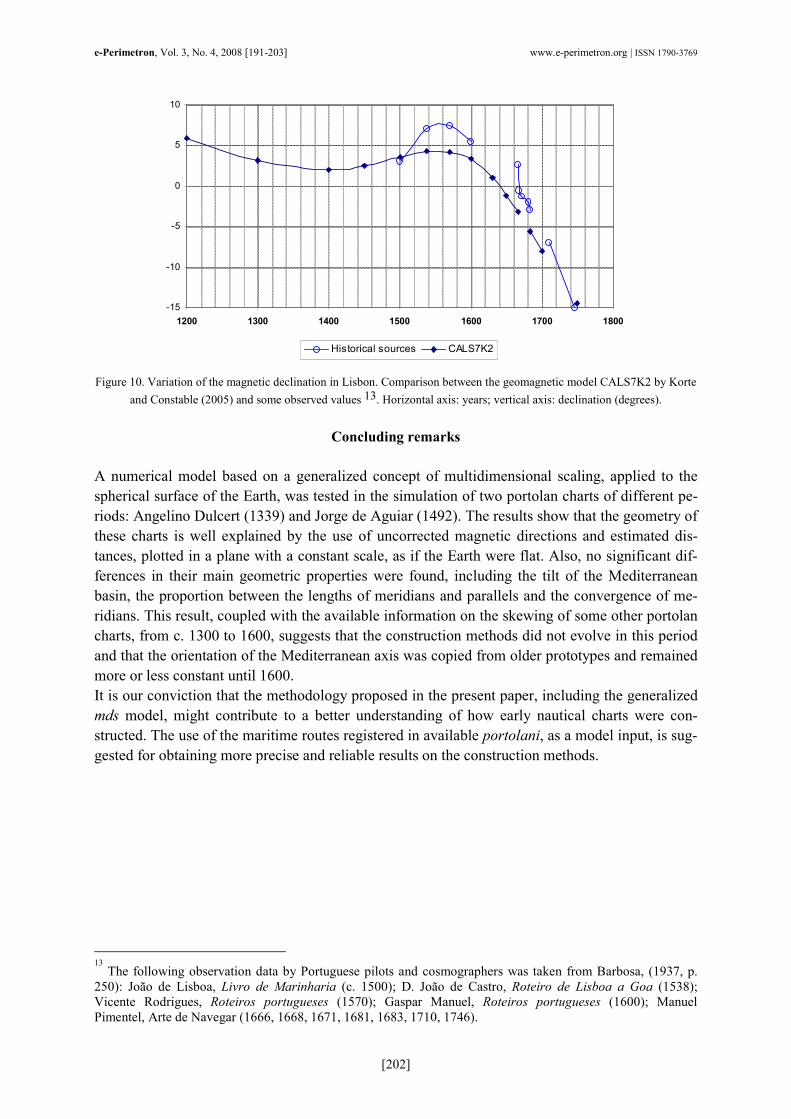
decreased about 10 degrees in this 300 year period12. As suggested earlier in this paper, this result strongly confirms that no significant adjustments were made to the orientation of the Medi-terranean axes in the charts, from 1300 to 1600; (ii) the angle of rotation of the charts is always larger (with the exception of the charts by Willem Barentszoon, 1595, and by Bartolomeo Cres-cenzio, 1596) than the maximum value of the magnetic declination in this period. Even if the Pisan chart were not considered, there would still be a difference of about 3º or 4º to be explained, between the average value of the magnetic declination in 1300 and the angle of rotation of the charts during the 14th century. There are two possible explanations for this mismatch: (i) an earlier origin of the first portolan charts; and (ii) an underestimate of the geomagnetic model used in this research. The first expla-nation is probably true as the first portolan charts might have been made, at least, some decades before the Pisan chart. Knowing that the variation of the magnetic declination between 1200 and 1300 was about 2º per century, an earlier origin might account for part of the difference. As for the second explanation, the graph in Figure 10 shows the variation of the magnetic declination in Lisbon, between 1200 and 1750, as estimated by the same model used above, together with some observed values made by Portuguese pilots. Although this comparison only strictly applies to the period of the observations, the systematic differences between the observed and the estimated values (of the order of 3º to 4º) suggest that the model might also underestimate the magnetic dec-lination in the area before 1500. As noted by Constable (2008), more recent paleomagnetic direc-tional information by Gómez-Paccard et al. (2006, p. 11, 18), applying to the Iberian Peninsula,
11 Lanman estimated the rotation of the Mediterranean as the inclination of the line joining Gibraltar and An-
tioch, whose latitudes are virtually identical. Two more charts were added to Lanmn’s sample, Aguiar and Cantino charts, to which the same estimation method was applied. 12 The explanation given by Lanman, that the magnetic declination didn’t have a significant variation in the
Mediterranean during this period, is not supported by the geomagnetic model of Korte and Constable (2005) used in the present research. However, there are strong indications (see below) that this model might underesti-mate the values of the magnetic declination between 1300 and 1600.

e-Perimetron, Vol. 3, No. 4, 2008 [191-203] www.e-perimetron.org | ISSN 1790-3769
[201]
really confirms an underestimate of the magnetic declination given by this model of about 2º in 1200, 0º in 1300, 1.5º in 1400 and 2.5º in 1500.
-6
-4
-2
0
2
4
6
8
10
12
1200 1250 1300 1350 1400 1450 1500 1550 1600
A (36N,6W)
B (40N, 5E)
C (37N,15E)
D (43N, 15E)
E (35N,20E)
F (33N,32E)
G (43N, 35E)
Eastern Mediterranean
and Black Sea
Western and central
Mediterranean
Gibraltar
Carta pisana
CarignanoVesconte Dulcert
SoleriValsecha
Viladestes
A. de Virga
Cantino
Anonymous
Prunes
Maggiolo
Sideri
Olives
D. Homem
Barentszoon
Crescentius
Anonymous
Aguiar
Figure 9. Variation of the magnetic declination in six locations of the Mediterranean, between 1200 and 1600. The red circles represent the angle of rotation of some extant portolan charts, as estimated by Lanman (1987). Horizontal axis: years; vertical
axis: declination (degrees).
There are two possible explanations for this mismatch: (i) an earlier origin of the first portolan charts; and (ii) an underestimate of the geomagnetic model used in this research. The first expla-nation is probably true as the first portolan charts might have been made, at least, some decades before the Pisan chart. Knowing that the variation of the magnetic declination between 1200 and 1300 was about 2º per century, an earlier origin might account for part of the difference. As for the second explanation, the graph in Figure 10 shows the variation of the magnetic declination in Lisbon, between 1200 and 1750, as estimated by the same model used above, together with some observed values made by Portuguese pilots. Although this comparison only strictly applies to the period of the observations, the systematic differences between the observed and the estimated values (of the order of 3º to 4º) suggest that the model might also underestimate the magnetic dec-lination in the area before 1500. As noted by Constable (2008), more recent paleomagnetic direc-tional information by Gómez-Paccard et al. (2006, p. 11, 18), applying to the Iberian Peninsula, really confirms an underestimate of the magnetic declination given by this model of about 2º in 1200, 0º in 1300, 1.5º in 1400 and 2.5º in 1500. Also these results seem to confirm that the small difference between the rotation of the Mediterra-nean axis in Aguiar’s and Dulcert’s charts is not exceptional and that its orientation was probably copied, in both cases, from older prototypes. Even taking into account the historical observations by Portuguese pilots and the newer results from Gómez-Paccard et al. (2006) to correct the output of the geomagnetic model used here, there is still a significant difference between the average rotation angle in the older charts (8º to 9ºE) and the average value of the magnetic declination in the Mediterranean, in 1300 (about 7ºE). The proposed explanation for this difference is an earlier origin of the portolan chart, probably during the first half of the 13th century, when the magnetic declination had larger eastern values in the area.
e-Perimetron, Vol. 3, No. 4, 2008 [191-203] www.e-perimetron.org | ISSN 1790-3769
[202]
-15
-10
-5
0
5
10
1200 1300 1400 1500 1600 1700 1800
Historical sources CALS7K2
Figure 10. Variation of the magnetic declination in Lisbon. Comparison between the geomagnetic model CALS7K2 by Korte
and Constable (2005) and some observed values 13. Horizontal axis: years; vertical axis: declination (degrees).
Concluding remarks
A numerical model based on a generalized concept of multidimensional scaling, applied to the spherical surface of the Earth, was tested in the simulation of two portolan charts of different pe-riods: Angelino Dulcert (1339) and Jorge de Aguiar (1492). The results show that the geometry of these charts is well explained by the use of uncorrected magnetic directions and estimated dis-tances, plotted in a plane with a constant scale, as if the Earth were flat. Also, no significant dif-ferences in their main geometric properties were found, including the tilt of the Mediterranean basin, the proportion between the lengths of meridians and parallels and the convergence of me-ridians. This result, coupled with the available information on the skewing of some other portolan charts, from c. 1300 to 1600, suggests that the construction methods did not evolve in this period and that the orientation of the Mediterranean axis was copied from older prototypes and remained more or less constant until 1600. It is our conviction that the methodology proposed in the present paper, including the generalized mds model, might contribute to a better understanding of how early nautical charts were con-structed. The use of the maritime routes registered in available portolani, as a model input, is sug-gested for obtaining more precise and reliable results on the construction methods.
13 The following observation data by Portuguese pilots and cosmographers was taken from Barbosa, (1937, p.
250): João de Lisboa, Livro de Marinharia (c. 1500); D. João de Castro, Roteiro de Lisboa a Goa (1538); Vicente Rodrigues, Roteiros portugueses (1570); Gaspar Manuel, Roteiros portugueses (1600); Manuel Pimentel, Arte de Navegar (1666, 1668, 1671, 1681, 1683, 1710, 1746).

e-Perimetron, Vol. 3, No. 4, 2008 [191-203] www.e-perimetron.org | ISSN 1790-3769
[203]
References and sources
Albuquerque, Luís de (1982). O “Tratado da Agulha de Marear” de João de Lisboa;
Reconstituição do seu texto, seguida de uma versão francesa com anotações. Centro de Estudos de Cartografia Antiga, Série Separatas CL. Junta de Investigações Científicas do Ultramar, Coimbra.
Barbosa, António (1937). Arte de navegar dos portugueses na época dos descobrimentos, in História da Expansão Portuguesa no Mundo, p. 231-267. Edições Ática, Lisboa.
Campbell, Tony (1987). Portolan Charts from the Late Thirteen Century to 1500, in J. B. Harley and D. Woodward (editors) – The History of Cartography, Volume one: Cartography in Prehis-toric, Ancient, and Medieval Europe and the Mediterranean. The University of Chicago Press, Chicago & London.
Constable C. G. (2008). Personal communication.
Costa, Fontoura da (1983). A Marinharia dos Descobrimentos, 4.ª Edição. Edições Culturais da Marinha, Lisboa.
Gomez-paccard, M., chauvin, A., lamos, P. et alia (2006). First archaeomagnetic secular variation curve for the Iberian Peninsula: Comparison with other data from western Europe and with global geomagnetic field models. Geochemistry, Geophysics, Geosystems, Volume 7, Number 2. AGU and the Geochemical Society.
Korte, M. and constable, C. G. (2005). Continuous geomagnetic field models for the past 7 mil-lennia: 2. CALS7K. Geochemistry, Geophysics, Geosystems, Volume 6, Number 1. AGU and the Geochemical Society.
Lanman, Jonathan (1987). On the Origin of Portolan Charts. Hermon Dunlap Smith Center for the History of Cartography. Occasional Publication No. 2. The Newberry Library, Chicago.
Loomer, Scott A. (1987). A Cartometric Analysis of Portolan Charts: a Search for Methodoloy. PhD dissertation, University of Wisconsis – Madison.
Pujades, Ramon J. (2007). Les cartes portolanes. La representaciò medieval d'una mar solcada. Institut Cartogràfic de Catalunya, Barcelona.
Tobler, Waldo (1977). Numerical Approaches to Map projections, in Studies in Theoretical Car-tography, E. Kretschmer ed., Deuticke, Vienna, p. 51-64.