deal team – at your service - icici direct
TRANSCRIPT

Yearly OutlookQuant Yearly OutlookQuant
Nifty likely to reach Mean+2*Sigma level of 9400 in 2017
Research Analysts Amit Gupta [email protected] Raj Deepak Singh [email protected] Ahmad [email protected]
Nandish Patel [email protected]
Gaurav Shah [email protected]
20172017
December 14, 2016

Deal Team – At Your ServiceIn this report …
Nifty Outlook for 2017 based on Mean reversion behaviour1
Increasing risk absorbing capability of the market – indicated by Volatility index2
3 Expected Nifty rebalancing in 2017
Stock Picks for 2017
Maximum Divergence of Nifty Vs S&P and S&P performance in rate hike cycles
4
5
Increasing DII flows : major support for the markets
INR Outlook for 2017
6
7 INR Outlook for 2017
Crude and Gold Outlook for 2017
7
8
2

Nifty likely to give 15% return within one year from current levels…
Mean+2*Sigma level=9400
Nifty target is placed at Mean + 2* Sigma level of 9400 with intermediate hurdle of 8600 which was the breakdown point of Mean +2*Sigma in 2015
Intermediate hurdle=8600
After breaching Mean+2*Sigma inAfter breaching Mean+2 Sigma in
2008, Nifty took couple of years toreach this level in October 2010.Similarly in 2015, Nifty breachedMean+2*Sigma, which is likely to betested after couple of years ofconsolidation in 2017
Mean+ 2*Sigma
3
Source : ICICIdirect.com Research, Bloomberg

Any extended fall in Nifty is likely to halt above Mean-2*Sigma level of 7400…
In case of any major weakness in Nifty, the fall is likely to halt above 7400. Since 2009, in all panic scenarios, Nifty has been finding support at Mean - 2* Sigma levels which is currently placed at 7400. We do not see Nifty even visiting these levels and it should recover much higher from
7400
Nifty even visiting these levels and it should recover much higher from these levels even incase of any extended fall
In the major corrections of 2008 and 2011 when
Nifty recovered from Mean–2*Sigma levels, itwitnessed significant pull backs and tested Mean-2*Sigma levels only after 3-4 years. Since Nifty hasrecovered from these levels in 2016 only. We
Mean – 2*Sigma
expect it to remain above Mean-2*Sigma foranother 2-3 years. Hence the current declines aregood buying opportunity
4
Source : ICICIdirect.com Research, Bloomberg

Panic situation is subsiding as indicated by lower top formation of IndiaVIX…
After 2009, the India Volatility Index (India VIX) made its top near 35-40 levels in all major panics seen in theNifty. In the last seven years, the volatility index has surged towards 35-40 levels every year. However thepanic situation is subsiding now since the last one and half years. Recently even after the surprising outcomesof Brexit, US Presidential elections and local demonetisation, IndiaVIX has not been able to move beyond 20-25 levels. This shows increasing risk absorbing capability of the market. Currently IndiaVIX is near 17 andeven if it moves higher, it should revert back from the resistance zone of 20-25, thus helping the Nifty torecover from intermediate corrections.
Despite surprising outcome from the events like Brexit, US election and Demonetizationand Demonetization, volatility failed to spike up and it remain below 25%. We believe that intermediate corrections should get over without any major surge in volatility.
5
Source : ICICIdirect.com Research, Bloomberg

In the last few years, Nifty PCR-OI has acted as a good buying indicator for equity markets at the oversold levels of 0.70 amid all major risk-off events…
• The ca tion in the b oade ma kets is eflected in indicato s like PCR OI hich had come close to o e sold• The caution in the broader markets is reflected in indicators like PCR-OI, which had come closer to oversoldlevel of 0.7 in the month of November, 2016 before the recent consolidation is seen in Nifty. The lowreading of this indicator suggests participants are sceptical of writing Put options and have been moreactive in writing Call options which drags the market down. However since 2009, this ratio always revertsfrom the low reading of 0 7 (Mean 2*Sigma) which results in closure of Call writers positions thusfrom the low reading of 0.7 (Mean-2 Sigma) which results in closure of Call writers positions thussupporting the pullback in Nifty.
• With a rising PCR-OI the volatility also takes a breather, which again builds the case for positiveconsolidation in Nifty. The same is experienced by Nifty in the December month as PCR-OI increased fromNovember lows of 0 70 to the current 1 05 and volatility declined from 19% to 16%
8,1008,4008,7009,000
1.601.701.80
November lows of 0.70 to the current 1.05 and volatility declined from 19% to 16%.
Nifty always tend to recover once Mean-2*Sigma level of PCR-OI is reached
5 7006,0006,3006,6006,9007,2007,5007,8008, 00
1.001.101.201.301.401.50
Nifty
Spo
t
PCR
OI
4,5004,8005,1005,4005,700
0.600.700.800.90
3-Ja
n-11
3-M
ar-1
1-M
ay-1
13-
Jul-1
13-
Sep-
113-
Nov-
113-
Jan-
123-
Mar
-12
-May
-12
3-Ju
l-12
3-Se
p-12
3-No
v-12
3-Ja
n-13
3-M
ar-1
3-M
ay-1
33-
Jul-1
33-
Sep-
133-
Nov-
133-
Jan-
143-
Mar
-14
-May
-14
3-Ju
l-14
3-Se
p-14
3-No
v-14
3-Ja
n-15
3-M
ar-1
5-M
ay-1
53-
Jul-1
53-
Sep-
153-
Nov-
153-
Jan-
163-
Mar
-16
-May
-16
3-Ju
l-16
3-Se
p-16
3-No
v-16
3 3 3- 3 3 3 3 3- 3 3 3 3 3- 3 3 3 3 3- 3 3 3 3 3- 3 3 3 3 3- 3 3
PCR OI Nifty SpotSource : ICICIdirect.com Research, Bloomberg

Expected Nifty Rebalancing in 2017…
• NSE arm IISL periodically rebalances Nifty in line with their pre specified criteria. Currently, Financial Servicesp y y p p y,and Technology space holds the highest weight in Nifty with cumulative weightage of 45% in the index.
• As per the NSE guideline, a maximum of 10% of the index size (number of stocks in the index) may be changedin a calendar year. Hence in the calendar year 2017, a maximum of 5 stocks can be replaced from the pool of 50.
• The first Nifty rebalancing of 2017 is expected to be effective from April 01, 2017. Hence first announcementThe first Nifty rebalancing of 2017 is expected to be effective from April 01, 2017. Hence first announcementregarding the same is likely to be made in the second or third week of February with a six week notice. Thesecond rebalancing is expected in September 2017. The expected inclusion of IOC in Nifty would increase theweightage of performing Oil & Gas space. Also United Phosphorus (UPL) would be the only Agrochemical stockto be included in Nifty.y
Sector wise weights of Nifty
Sectors WeightsFinancial Services 31.53%Technology 13.76%
No. Stocks Sectors CMP Free Float MCAP (| Crore)
1 Idea Telecom 76 9680
Stocks likely to be excluded from Nifty in 2017
Energy 12.28%Automobile 11.78%Consumer Goods 9.96%Pharma 6.50%Construction 3.67%
2 Bhel Industrial Manufacturing 126 11687
Stocks likely to be included in Nifty in 2017Cement & Cement Products 3.13%Metals 2.99%Telecom 2.38%Media & Entertainment 0.83%Services 0.80%
No. Stocks Sectors CMP Free Float MCAP (| Crore)
1 Indian Oil Corporation Energy 302 30857
2 UPL Ltd Agrochemcial 665 25384
Stocks likely to be included in Nifty in 2017
7
Industrial Manufacturing 0.38%Source : ICICIdirect.com Research, Bloomberg

Mean + 2 Sigma level is breached at 8600Mean + 2 Sigma level is breached at 8600 which would remain the crucial intermediate resistance for Nifty
Stock Picks for 2017….

Stock Picks for 2017 - Based on Mean Reversion Indicators…
Sectors Stocks Initiation Range Target Stoploss Automobile M&M 1170 1190 1428 1064Automobile M&M 1170-1190 1428 1064Textiles Arvind 325-340 434 283Oil & Gas GAIL 410-425 527 356Banking Bank of Baroda 152-159 207 128Telecom Bharti Airtel 314-327 413 272Power NTPC 160-165 215 136
9

Mahindra & Mahindra: Near strong support of Mean-2*sigma
1600M&M is into a time correction since the last couple of years. In this consolidation, it
Initiation range : 1170-1190 Target : 1428 Stop loss : 1064
1200
1400
1105
p y ,has come closer to the major support of Mean-2*Sigma
800
1000
Price
400
600
0
200
Feb‐09
May‐09
Aug‐09
Nov
‐09
Feb‐10
May‐10
Aug‐10
Nov
‐10
Feb‐11
May‐11
Aug‐11
Nov
‐11
Feb‐12
May‐12
Aug‐12
Nov
‐12
Feb‐13
May‐13
Aug‐13
Nov
‐13
Feb‐14
May‐14
Aug‐14
Nov
‐14
Feb‐15
May‐15
Aug‐15
Nov
‐15
Feb‐16
May‐16
Aug‐16
Nov
‐16
Price Mean‐2*Sigma
10
M A M A M A M A M A M A M A M A
Source : ICICIdirect.com Research, Bloomberg
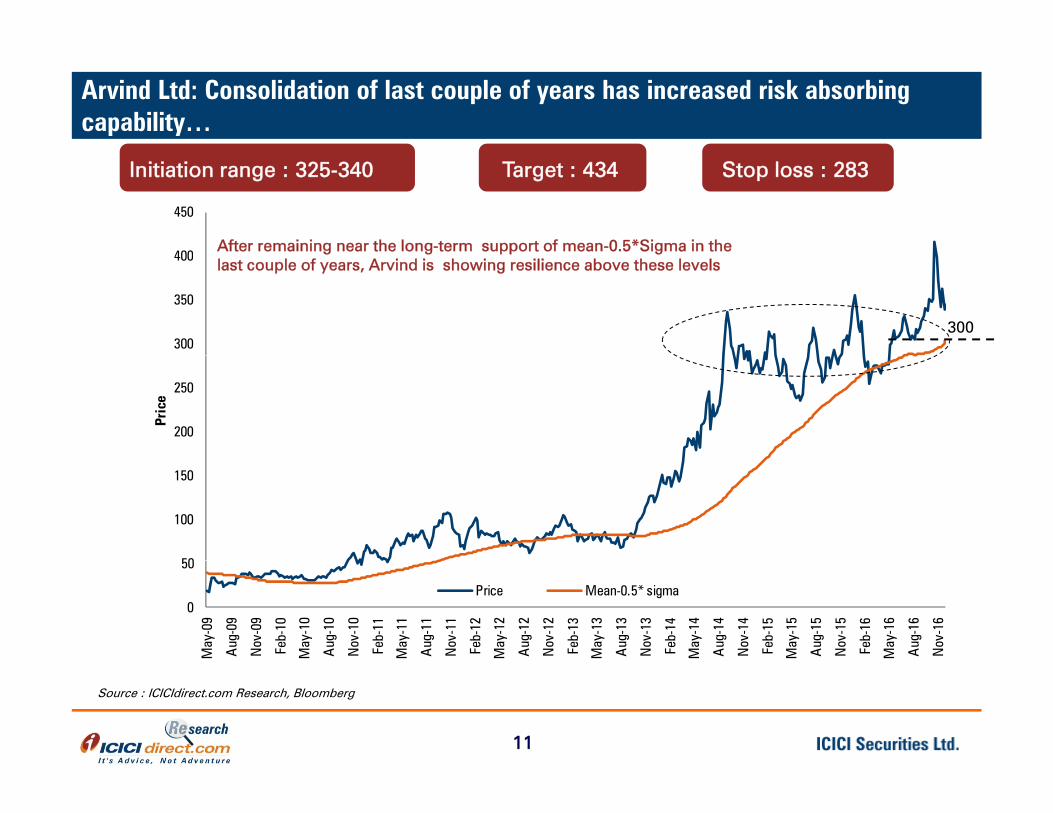
Arvind Ltd: Consolidation of last couple of years has increased risk absorbing capability…
400
450
After remaining near the long-term support of mean-0.5*Sigma in the
Initiation range : 325-340 Target : 434 Stop loss : 283
300
350
400
300
g g pp glast couple of years, Arvind is showing resilience above these levels
200
250
Pric
e
50
100
150
0
50
May
-09
Aug
-09
Nov
-09
Feb-
10
May
-10
Aug
-10
Nov
-10
Feb-
11
May
-11
Aug
-11
Nov
-11
Feb-
12
May
-12
Aug
-12
Nov
-12
Feb-
13
May
-13
Aug
-13
Nov
-13
Feb-
14
May
-14
Aug
-14
Nov
-14
Feb-
15
May
-15
Aug
-15
Nov
-15
Feb-
16
May
-16
Aug
-16
Nov
-16
Price Mean-0.5* sigma
11
Source : ICICIdirect.com Research, Bloomberg

GAIL Ltd – Reversal above Mean has remained trend decider
600Whenever GAIL moves above the long-term Mean, the reversals have been to the extent of 60-114%. In the recent move from the Mean of 380 has only of 12% so far…..This means there is lot of room to
Initiation range : 410-425 Target : 527 Stop loss : 356
400
500
ride the reversal upmove in GAIL
114% surge from Mean60% surge from Mean
300
400
Price
380
100
200
0
Jun‐07
Oct‐0
7
Feb‐08
Jun‐08
Oct‐0
8
Feb‐09
Jun‐09
Oct‐0
9
Feb‐10
Jun‐10
Oct‐1
0
Feb‐11
Jun‐11
Oct‐1
1
Feb‐12
Jun‐12
Oct‐1
2
Feb‐13
Jun‐13
Oct‐1
3
Feb‐14
Jun‐14
Oct‐1
4
Feb‐15
Jun‐15
Oct‐1
5
Feb‐16
Jun‐16
Oct‐1
6
Price Mean
12
Source : ICICIdirect.com Research, Bloomberg

Bank of Baroda: The only PSU banking stock which has shown secular tendency of respecting long-term support of Mean+0.5*Sigma
220 Bank of Baroda has shown tendency of reverting from its Mean+0.5*Sigma since 2008. The current consolidation is seen above this price of 142
Initiation range : 152-159 Target : 207 Stop loss : 128
160
180
200
142
100
120
140
Pric
e
142
40
60
80
0
20
Nov
-05
Mar
-06
Jul-0
6
Nov
-06
Mar
-07
Jul-0
7
Nov
-07
Mar
-08
Jul-0
8
Nov
-08
Mar
-09
Jul-0
9
Nov
-09
Mar
-10
Jul-1
0
Nov
-10
Mar
-11
Jul-1
1
Nov
-11
Mar
-12
Jul-1
2
Nov
-12
Mar
-13
Jul-1
3
Nov
-13
Mar
-14
Jul-1
4
Nov
-14
Mar
-15
Jul-1
5
Nov
-15
Mar
-16
Jul-1
6
Nov
-16
Price Mean+0.5*Sigma
13
Source : ICICIdirect.com Research, Bloomberg

Bharti Airtel: Despite underperformance, Mean-1.5*Sigma has remained important support in last 7-years
600
Bharti seems to have absorbed lot of adverse news flows and the recent
Initiation range : 314-327 Target : 413 Stop loss : 272
400
500
Bharti seems to have absorbed lot of adverse news flows and the recent reversal from positional support of Mean-1.5*Sigma could see quite extended upmove
300
400
Price 301
100
200
0
Jun‐07
Oct‐07
Feb‐08
Jun‐08
Oct‐08
Feb‐09
Jun‐09
Oct‐09
Feb‐10
Jun‐10
Oct‐10
Feb‐11
Jun‐11
Oct‐11
Feb‐12
Jun‐12
Oct‐12
Feb‐13
Jun‐13
Oct‐13
Feb‐14
Jun‐14
Oct‐14
Feb‐15
Jun‐15
Oct‐15
Feb‐16
Jun‐16
Oct‐16
Price Mean‐1.5 Sigma
14
Source : ICICIdirect.com Research, Bloomberg

NTPC Ltd : After 6-years the stock has come above the important long-term mean…
250 Reversal above Mean is seen after 6–years which should keep the stock buoyant in 2017
Initiation range : 160-165 Target : 215 Stop loss : 136
190
210
230
y
Recent price action is the
highest period of sustainability above the long-term Mean seen
130
150
170
Price
142
in last 6 years
90
110
130
50
70
Feb‐09
May‐09
Aug‐09
Nov
‐09
Feb‐10
May‐10
Aug‐10
Nov
‐10
Feb‐11
May‐11
Aug‐11
Nov
‐11
Feb‐12
May‐12
Aug‐12
Nov
‐12
Feb‐13
May‐13
Aug‐13
Nov
‐13
Feb‐14
May‐14
Aug‐14
Nov
‐14
Feb‐15
May‐15
Aug‐15
Nov
‐15
Feb‐16
May‐16
Aug‐16
Nov
‐16
Price Mean
15
Source : ICICIdirect.com Research, Bloomberg

Mean + 2 Sigma level is breached at 8600S&P has hit Mean+2*Sigma levels post the start of
Mean + 2 Sigma level is breached at 8600 which would remain the crucial intermediate resistance for Nifty
US rate hike cycle. Also maximum divergence of Nifty Vs S&P has stopped near 3.4 in last 7 years

Rate hike cycles in US…
Source : ICICIdirect.com Research, Bloomberg

S&P made bottom near US first rate hike in last three rate cycles. Afterwards on recovery it has hit Mean + 2 Sigma, which is placed at 2375…
US rate hike cycle: 2004 US rate hike cycle: 1994
US rate hike cycle: 1986y
Source : ICICIdirect.com Research, Bloomberg

Nifty divergence with S&P500 has stopped at (Nifty/S&P) price ratio of 3.40 in last 8 years. Hence if S&P remains near 2200, Nifty fall should stop above 7400…
1700
2200
6000
7000
8000
9000 Nifty S&P
700
1200
3000
4000
5000
6000
2002000
Jan‐09
Jun‐09
Nov‐09
Apr‐10
Sep‐10
Feb‐11
Jul‐1
1
Dec‐11
May‐12
Oct‐12
Mar‐13
Aug‐13
Jan‐14
Jun‐14
Nov‐14
Apr‐15
Sep‐15
Feb‐16
Jul‐1
6
4.50
5.00
5.50 Ratio (Nifty/S&P) Since 2008 crisis, the maximum divergence
of Nifty Vs S&P was seen at the price ratio(Nifty/S&P) of 3.4. Hence if S&P continues toconsolidate near 2200, the worst casescenario with Nifty divergence extending to3 4 ill Nift l b 7400
3.00
3.50
4.00
9 9 9 0 0 1 1 2 2 2 3 3 4 4 4 5 5 6 6
3.4 will peg Nifty value above 7400
19
Feb‐09
Jul‐0
9
Dec‐09
May‐10
Oct‐10
Mar‐11
Aug‐11
Jan‐12
Jun‐12
Nov‐12
Apr‐13
Sep‐13
Feb‐14
Jul‐1
4
Dec‐14
May‐15
Oct‐15
Mar‐16
Aug‐16
Source : ICICIdirect.com Research, Bloomberg

Mean + 2 Sigma level is breached at 8600Mean + 2 Sigma level is breached at 8600 which would remain the crucial intermediate resistance for Nifty
Expected INR range for 2017: 66-71

Deal Team – At Your ServiceINR outperformance trend may come under pressure and may trade within 66-71
• Rupee has remained one of the best performer against INR performs relatively well…p p gUS$ amongst Emerging market currencies over last 3-years.
• Rupee weakened by less than 4% against US$ sinceinitial QE Taper talks by Fed FOMC (in August 2013).
INR performs relatively well…
0
10Since August 2013 2016-YTD Since US Election
This is least amongst stated Emerging marketcurrencies. Largest decline since then has been inRussia (92%) & Malaysia (35%) as the crude pricestumbled.
F ti l d th h i liti l
-11
-20
-4
-35
-12-6
-34
92
-12
-30
-20
-10
% ch
ange
• Focus on consumption-led growth, change in politicalleadership, measures taken by central bank (FCNRDeposits), normal monsoon were few reasons helpingRupee to remain resilient.
• While the other EM currencies continue to witness sharp INR likely to remain in the range of 66 71
-92
-50
-40
THB IDR INR MYR CNY KRW ZAR RUB PHP
While the other EM currencies continue to witness sharpdepreciation trend, Rupee has remained broadlyinsulated against US$ from mid 2014 as Fed startedending its multi –year QE program.
• Rupee could weaken further as FOMC is on the path of
INR likely to remain in the range of 66-71…
63
68
73
R Rupee likely toraising rates gradually (currently two rate hikes areexpected in 2017) which is likely to keep Dollar strong.
• We expect INR to trade broadly within 66-71 range in2017. INR has strong support at Mean+0.5*Sigma level
f d i M * Si l l f
43
48
53
58
Spot
US$
INR
Rupee weakened above 68 on initial QE taper talks
Rupee likely to trade in the range of 66-71
21
of 65.7 and resistance at Mean +3* Sigma level of 71.
Source: Bloomberg, ICICIdirect.com Research
38
Jun-
11
Sep-
11
Dec-1
1
Mar
-12
Jun-
12
Sep-
12
Dec-1
2
Mar
-13
Jun-
13
Sep-
13
Dec-1
3
Mar
-14
Jun-
14
Sep-
14
Dec-1
4
Mar
-15
Jun-
15
Sep-
15
Dec-1
5
Mar
-16
Jun-
16
Sep-
16
Source : ICICIdirect.com Research, Bloomberg

INR: Mean+0.5*sigma level has remained major support in last 5-years
70Since 2011, USDINR has been consistently finding support at Mean+0.5*Sigma level which is currently placed near 66
60
6566
50
55Price
45
50
Price Mean+0.5* sigma40
May‐09
Aug‐09
Nov
‐09
Feb‐10
May‐10
Aug‐10
Nov
‐10
Feb‐11
May‐11
Aug‐11
Nov
‐11
Feb‐12
May‐12
Aug‐12
Nov
‐12
Feb‐13
May‐13
Aug‐13
Nov
‐13
Feb‐14
May‐14
Aug‐14
Nov
‐14
Feb‐15
May‐15
Aug‐15
Nov
‐15
Feb‐16
May‐16
Aug‐16
Nov
‐16
Price Mean+0.5 sigma
22
Source : ICICIdirect.com Research, Bloomberg

INR: All extended moves in USDINR have seen reversal from Mean+3*sigma levels. This major resistance is placed at 71
70
71
All the extended upward moves in USDINR have seen reversal from Mean+3*Sigma levels which is placed at 71. Hence any extended INR weakness on persistent Dollar strength is likely to halt near 71.
60
65
50
55Price
45
50
Price Mean+3* sigma40
May‐09
Aug‐09
Nov
‐09
Feb‐10
May‐10
Aug‐10
Nov
‐10
Feb‐11
May‐11
Aug‐11
Nov
‐11
Feb‐12
May‐12
Aug‐12
Nov
‐12
Feb‐13
May‐13
Aug‐13
Nov
‐13
Feb‐14
May‐14
Aug‐14
Nov
‐14
Feb‐15
May‐15
Aug‐15
Nov
‐15
Feb‐16
May‐16
Aug‐16
Nov
‐16
g
23
Source : ICICIdirect.com Research, Bloomberg

Deal Team – At Your ServiceMF flows have increased in the recent market - compensating for FII outflows
FII redemptions in November, highest since June 2013…
30000
40000
50000
MF inflows in November, highest in last few years…
-30000
-20000
-10000
0
10000
20000
30000
In cr
ores
10000
0
10000
20000
R in Cr)
-50000
-40000
-30000
May
-13
Aug-1
3
Nov-1
3
Feb-1
4
May
-14
Aug-1
4
Nov-1
4
Feb-1
5
May
-15
Aug-1
5
Nov-1
5
Feb-1
6
May
-16
Aug-1
6
Nov-1
6
‐20000
‐10000
Apr/07
Oct/07
Apr/08
Oct/08
Apr/09
Oct/09
Apr/10
Oct/10
Apr/11
Oct/11
Apr/12
Oct/12
Apr/13
Oct/13
Apr/14
Oct/14
Apr/15
Oct/15
Apr/16
Oct/16
DII flows (INR
Likely range of 94-104
DIIs have poured in the highest monthlyFIIs outflows in November 2016 of |19624crore has been the second highest since June
flows of the last few years in November2016 of |18277 crore. DIIs flows wouldbe the major supporting force for themarket in the coming months
g2013. Post this outflow in June, FIIs outflowswere abated in 2013 and eventually in a periodof couple of months, fresh inflows had startedcoming in
24
Source: Bloomberg, ICICIdirect.com ResearchSource : ICICIdirect.com Research, Bloomberg

Mean + 2 Sigma level is breached at 8600Brent crude:Mean + 2 Sigma level is breached at 8600 which would remain the crucial intermediate resistance for Nifty
Brent crude:December 2017 options suggest $60-64 to remain
major resistance…

Brent Crude: December 2017 options suggest $60-64 to remain major hurdle in 2017
• Brent crude has staged a sharp pull back from its February lows near 27 and has almost doubled since then TheBrent crude has staged a sharp pull back from its February lows near 27 and has almost doubled since then. Themove above $50 was primarily due to agreement on production cut from OPEC countries. Despite strength inDollar, the upmove in the crude suggests improved scenario for Brent in 2017 Vs 2016. However as the supplyoverhand is still expected to remain the current recovery is likely to halted near $60-64 levels.
• As per options data of December 2017 Brent crude has substantially high Call base at 60 which has a premiumAs per options data of December 2017, Brent crude has substantially high Call base at 60 which has a premiumof $4. The open interest at 60 Call strike is significantly higher than any other strike. Hence, the recent upmove islikely to be arrested near $60-64. On the down side, we expect crude to consolidate above $40 levels in comingmonths. The highest Put base is placed only at 40 strike. No major activity is evident below the Put options baseof 40 strike. We believe that the intermediate declines in Brent are likely to be arrested near $40.y $
• As per CFTC data, despite the recent OPEC production cut announcement, the net long positions have remainedsubdued which signifies the fact of limited upsides beyond $60.
Writing is seen in 60 Call strike of December 2017… CFTC Data: Net long positions in Crude have not increased despite OPEC production cut
20000
25000
30000
35000
ntra
cts
Call OI Put OI
p p
300000
400000
500000
600000Low open interest base of long positions suggests lack of interest in crude at higher levels
0
5000
10000
15000
No.
of C
on
0
100000
200000
300000
2 3 3 3 3 4 4 4 4 5 5 5 5 6 6 6 6
Net Longs in Crude
26
40 41 42 43 44 45 46 47 48 49 50 51 52 53 54 55 56 57 58 59 60
Strike Price ($)Source : ICICIdirect.com Research, bloomberg
Nov‐12
Feb‐13
May‐13
Aug‐13
Nov‐13
Feb‐14
May‐14
Aug‐14
Nov‐14
Feb‐15
May‐15
Aug‐15
Nov‐15
Feb‐16
May‐16
Aug‐16
Nov‐16

Crude: Major upsides unlikely, Crude likely to face stiff hurdle at $60-$64 in 2017
160
Since its breakdown below Mean+1*Sigma level in the early 2012, Brent Crude has been facing stiff resistance near these levels. Currently this level is placed near $60
120
140
60
80
100
Price
60
20
40
60
0
Jun‐07
Oct‐07
Feb‐08
Jun‐08
Oct‐08
Feb‐09
Jun‐09
Oct‐09
Feb‐10
Jun‐10
Oct‐10
Feb‐11
Jun‐11
Oct‐11
Feb‐12
Jun‐12
Oct‐12
Feb‐13
Jun‐13
Oct‐13
Feb‐14
Jun‐14
Oct‐14
Feb‐15
Jun‐15
Oct‐15
Feb‐16
Jun‐16
Oct‐16
Price Mean+1 Sigma
27
Source : ICICIdirect.com Research, Bloomberg

Mean + 2 Sigma level is breached at 8600Mean + 2 Sigma level is breached at 8600 which would remain the crucial intermediate resistance for NiftyGold: Important support placed near $1100.
Buying can again emerge from these levels…

Gold : Highest Put base is at 1100 strike for December 2017 series
• Precious metal turned positive for 2016 after 3 continuous years of decline. However, it was one of the lowestyielding asset class of 2016 as it gained just over 10% during the year. Gold was primarily marred by dollarstrength and continued accommodative policies of global central banks.
• Gold showed some sign of recovery in the mid year and moved towards $1350 levels. However, sharp upside inthe Dollar amid US rate hike expectations pulled the Gold below $1200 levels. The net long positions in Goldhave declined substantially in the second half of the year. However, the net longs are still high compared to last3 years which suggest limited downsides for the precious metal. We believe that precious metal mayconsolidate above $1100 with positive bias and decline towards these levels should be considered as good
Gold prices (per Ounce) witnessed 10% upside YTD in dollar terms…
buying opportunity.
• In the options space as well, the highest Put base for December 2017 is at $1100 strike which makes it importantsupport. On the higher side, we expect a bounce towards $1250-1300 to be possible in 2017.
Gold prices (per Ounce) witnessed 10% upside YTD in dollar terms…
Country Currency Open Low High Current YTD ReturnUS Dollar 1061 1061 1375 1168 10.1%China Yuan 6885 6892 9208 8061 17.1%India Rupee 70301 70295 92734 79006 12 4%India Rupee 70301 70295 92734 79006 12.4%Europe Euro 976 977 1244 1100 12.7%South Africa Rand 16437 15794 20602 15973 -2.8%Russia Ruble 77403 74047 101000 74047 -4.3%Brazil Real 4204 3943 5028 3943 -6.2%
Commodity centric economies witnessed decline in Gold prices in local currency terms due to significant currency appreciation
Source : ICICIdirect.com Research, Bloomberg

Gold: Likely to find strong support near $1100 levels
2000
Gold has given the maximum divergence of last 4-years above its crucial level of Mean-1*Sigma. We believe decline towards these levels is strong buying opportunity in the precious metal.
1400
1600
1800
800
1000
1200
Price
1100
200
400
600
0
Jun‐07
Oct‐07
Feb‐08
Jun‐08
Oct‐08
Feb‐09
Jun‐09
Oct‐09
Feb‐10
Jun‐10
Oct‐10
Feb‐11
Jun‐11
Oct‐11
Feb‐12
Jun‐12
Oct‐12
Feb‐13
Jun‐13
Oct‐13
Feb‐14
Jun‐14
Oct‐14
Feb‐15
Jun‐15
Oct‐15
Feb‐16
Jun‐16
Oct‐16
Price Mean‐1 Sigma
30
Source : ICICIdirect.com Research, Bloomberg

Portfolio allocation in Derivatives Products…
It i d d t d t th t di i ti t b t th i d i ti• It is recommended to spread out the trading corpus in a proportionate manner between the various derivatives research products
• Please avoid allocating the entire trading corpus to a single stock or a single product segment• Within each product segment, it is advisable to allocate equal amount to each recommendation.• For example: The ‘Daily Derivatives’ product carries two intraday recommendations. It is advisable to allocate equal
amount to each recommendation • Quant Picks recommendations should be considered in cash segment and stoploss on closing basis. Time frame for
these recommendations is 3 month.
Product wise Max allocation Frontline Mid-cap
Allocation Return Objective
pallocation per stock Stocks stocks
Daily Derivatives 5% 2-3% 2 Stocks 1% 2-3% Intraday
Weekly Derivatives 10% 3-5% 2 Stocks 3-5% 5-7% 1 Week
Monthly Derivatives 15% 3-5% 4-7 Stocks 7-10% 10-15% 1 Month
Global Derivatives 5% 2 3% 4 5 stocks 1 Month
DurationProducts Number of Calls
Global Derivatives 5% 2-3% 4-5 stocks - - 1 Month
Quant Picks 15% 2-3% 6-8 stocks 7-10% 10-15% 3 Months
Alpha Trader 10% 2-3% 2-3 strategy 5% - 1-2 Month
Volatility Insights 10% 2-3% 3-4 Strategy 8-10% 10-15% 1-2 Month
Arbitrage Opportunity 5% 2-3% 2-3 Stocks > 2.5% >2.5% Event Based
Short term Futures 5% 2-3% 8-12 Stocks 1-3% 2-5% 1-2 days
Positional Index Strategy 5% 3-4% 2-4 Index calls - - 1-14 days
Stock option strategy 5% 3-4% 2-8 Stocks - 3-5% 1-2 days
Daily Currency Future 5% 3-4% 3-5 Calls - - 1-2 days
Monthly Currency Futures 5% 3-4% 2-3 Calls - - 1 Month
31
Monthly Currency Futures 5% 3 4% 2 3 Calls 1 Month

Pankaj Pandey Head – Research [email protected] Research Desk,ICICI Securities Limited,1st Floor, Akruti Trade Centre,Road no.7, MIDCAndheri (East)Mumbai – 400 093research@icicidirect [email protected]
32

DisclaimerANALYST CERTIFICATION
W /I A it G t B E MBA (Fi ) R j D k Si h BE MBA (Fi ) A Ah d MBA (Fi ) G Sh h MMS (Fi )We /I, Amit Gupta B.E, MBA (Finance), Raj Deepak Singh BE, MBA (Finance), Azeem Ahmad MBA (Fin), Gaurav Shah, MMS (Finance)Nandish Patel Research Analysts, authors and the names subscribed to this report, hereby certify that all of the views expressed in thisresearch report accurately reflect our views about the subject issuer(s) or securities. We also certify that no part of our compensation was,is, or will be directly or indirectly related to the specific recommendation(s) or view(s) in this report.
Terms & conditions and other disclosures:ICICI Securities Limited (ICICI Securities) is a Sebi registered Research Analyst having registration no. INH000000990. ICICI Securities Limited(ICICI Securities) is a full-service, integrated investment banking and is, inter alia, engaged in the business of stock brokering and distributionof financial products. ICICI Securities is a wholly-owned subsidiary of ICICI Bank which is India’s largest private sector bank and has itsof financial products. ICICI Securities is a wholly owned subsidiary of ICICI Bank which is India s largest private sector bank and has itsvarious subsidiaries engaged in businesses of housing finance, asset management, life insurance, general insurance, venture capital fundmanagement, etc. (“associates”), the details in respect of which are available on www.icicibank.com.ICICI Securities is one of the leading merchant bankers/ underwriters of securities and participate in virtually all securities trading markets inIndia. We and our associates might have investment banking and other business relationship with a significant percentage of companiescovered by our Investment Research Department. ICICI Securities generally prohibits its analysts, persons reporting to analysts and theirrelatives from maintaining a financial interest in the securities or derivatives of any companies that the analysts cover.The information and opinions in this report have been prepared by ICICI Securities and are subject to change without any notice. The report
d i f ti t i d h i i t i tl fid ti l d t l l f th l t d i i t d t b lt d iand information contained herein is strictly confidential and meant solely for the selected recipient and may not be altered in any way,transmitted to, copied or distributed, in part or in whole, to any other person or to the media or reproduced in any form, without priorwritten consent of ICICI Securities. While we would endeavour to update the information herein on a reasonable basis, ICICI Securitiesisunder no obligation to update or keep the information current. Also, there may be regulatory, compliance or other reasons that may preventICICI Securities from doing so. Non-rated securities indicate that rating on a particular security has been suspended temporarily and suchsuspension is in compliance with applicable regulations and/or ICICI Securities policies, in circumstances where ICICI Securities might beacting in an advisory capacity to this company, or in certain other circumstances.This report is based on information obtained from public sources and sources believed to be reliable, but no independent verification has
f f fbeen made nor is its accuracy or completeness guaranteed. This report and information herein is solely for informational purpose and shallnot be used or considered as an offer document or solicitation of offer to buy or sell or subscribe for securities or other financialinstruments. Though disseminated to all the customers simultaneously, not all customers may receive this report at the same time. ICICISecurities will not treat recipients as customers by virtue of their receiving this report. Nothing in this report constitutes investment, legal,accounting and tax advice or a representation that any investment or strategy is suitable or appropriate to your specific circumstances. Thesecurities discussed and opinions expressed in this report may not be suitable for all investors, who must make their own investmentdecisions, based on their own investment objectives, financial positions and needs of specific recipient. This may not be taken insubstitution for the exercise of independent judgment by any recipient. The recipient should independently evaluate the investment risks.Th l d i b f h i i f i h h ICICIThe value and return on investment may vary because of changes in interest rates, foreign exchange rates or any other reason. ICICISecurities accepts no liabilities whatsoever for any loss or damage of any kind arising out of the use of this report. Past performance is notnecessarily a guide to future performance. Investors are advised to see Risk Disclosure Document to understand the risks associated beforeinvesting in the securities markets. Actual results may differ materially from those set forth in projections. Forward-looking statements arenot predictions and may be subject to change without notice.ICICI Securities or its associates might have managed or co-managed public offering of securities for the subject company or might havebeen mandated by the subject company for any other assignment in the past twelve months.ICICI Securities or its associates might have received any compensation from the companies mentioned in the report during the period
33
ICICI Securities or its associates might have received any compensation from the companies mentioned in the report during the periodpreceding twelve months from the date of this report for services in respect of managing or co-managing public offerings, corporatefinance, investment banking or merchant banking, brokerage services or other advisory service in a merger or specific transaction.

ICICI Securities or its associates might have received any compensation for products or services other than investment banking or merchantbanking or brokerage services from the companies mentioned in the report in the past twelve months.ICICI Securities encourages independence in research report preparation and strives to minimize conflict in preparation of research report.ICICI Securities or its analysts did not receive any compensation or other benefits from the companies mentioned in the report or third partyin connection with preparation of the research report. Accordingly, neither ICICI Securities nor Research Analysts have any material conflictof interest at the time of publication of this report.It is confirmed that Amit Gupta B E MBA(Finance) Raj Deepak Singh BE MBA(Finance) Azeem Ahmad MBA (Fin) Research Analysts ofIt is confirmed that Amit Gupta B.E, MBA(Finance), Raj Deepak Singh BE, MBA(Finance), Azeem Ahmad MBA (Fin), Research Analysts ofthis report have not received any compensation from the companies mentioned in the report in the preceding twelve months.Compensation of our Research Analysts is not based on any specific merchant banking, investment banking or brokerage servicetransactions.ICICI Securities or its subsidiaries collectively or Research Analysts do not own 1% or more of the equity securities of the Companymentioned in the report as of the last day of the month preceding the publication of the research report.Since associates of ICICI Securities are engaged in various financial service businesses, they might have financial interests or beneficialownership in various companies including the subject company/companies mentioned in this report.ownership in various companies including the subject company/companies mentioned in this report.It is confirmed that Amit Gupta B.E, MBA(Finance), Raj Deepak Singh BE, MBA(Finance), Azeem Ahmad MBA (Fin), Research Analysts donot serve as an officer, director or employee of the companies mentioned in the report.ICICI Securities may have issued other reports that are inconsistent with and reach different conclusion from the inf,ormation presented inthis report.
Neither the Research Analysts nor ICICI Securities have been engaged in market making activity for the companies mentioned in the report.We submit that no material disciplinary action has been taken on ICICI Securities by any Regulatory Authority impacting Equity ResearchWe submit that no material disciplinary action has been taken on ICICI Securities by any Regulatory Authority impacting Equity ResearchAnalysis activities.This report is not directed or intended for distribution to, or use by, any person or entity who is a citizen or resident of or located in anylocality, state, country or other jurisdiction, where such distribution, publication, availability or use would be contrary to law, regulation orwhich would subject ICICI Securities and affiliates to any registration or licensing requirement within such jurisdiction. The securitiesdescribed herein may or may not be eligible for sale in all jurisdictions or to certain category of investors. Persons in whose possession thisdocument may come are required to inform themselves of and to observe such restriction.
34