dealer attitude survey - nfda-uk.co.uk · by 0.1 points from six months ago and by 0.4 from last...
TRANSCRIPT

Dealer Attitude Survey Winter 2018/2019

Dealer Attitude Survey Winter 2018/2019
2
Contents
• Introduction……………………………………………… 3
• Profit return……………………………………………… 4
• Return on investment…………………………………... 7
• Targets………………………………………………....... 9
• Self-registrations………………………………………... 11
• Incentives………………………………………………... 12
• Day-to-day working relationship………………………. 13
• Standards and performance measures………………. 15
• Used cars………………………………………………... 17
• Future directions………………………………………... 19
• Overall manufacturer scores…………………………... 21
Dealer Attitude

Dealer Attitude Survey Winter 2018/2019
3
Introduction
Dear Colleague,
Thirty years after the launch of the NFDA Dealer Attitude Survey in 1989, we are pleased to present the findings of the winter 2018/2019 survey. Although the questions have changed and the profile has grown exponentially, the purpose of the study remains the same. It is to monitor the health of the relationship between franchised dealers and their respective manufacturers.
The National Franchised Dealers Association (NFDA), which represents franchised car and commercial vehicle retailers in the UK, carries out the Dealer Attitude Survey twice a year. Over the past thirty years, we have been improving the survey, adding new questions and updating others. This continues to allow us to use the results as a reliable source of data reflecting the general state of the dealer/manufacturer relationship.
This survey was conducted in January 2019 and asked franchised dealers about their on-going relationship with their respective manufacturers. Dealers were asked a series of questions covering a range of business aspects and their impact on the relationship with the manufacturers. Responses are scored from 1 (extremely dissatisfied) to 10 (extremely satisfied). The NFDA surveyed 30 franchise networks and received 1,742 responses from dealers, equating to a 40% response rate.
When the survey was launched, dealers were asked 16 questions in total and returned an overall average of about 6.3 points out of 10. Today, the average across all questions is slightly lower at 5.9, and the survey runs to a total of 52 questions.
In 1989, dealers were mostly concerned about their manufacturers’ ability to take their views into account, the effectiveness of their dealer councils and the margin impact of their marketing strategy.
The latest Dealer Attitude Survey shows that in 2019 the areas of major concern for dealers are: current profit return, return on capital and the alternative fuel offering of their manufacturers, although this is gradually improving. On the other hand, dealers are mostly satisfied with margins on used car sales and their manufacturers’ used car programme.
This report is a summary of the results of the Dealer Attitude Survey Winter 2018/2019. It includes charts and analysis of the main questions giving an overview of the findings. A full version of the report is available on request.
The survey was analysed by the NFDA. For more information, contact Louise Woods, 01788 538332 or [email protected]
Sue Robinson Director, National Franchised Dealers Association

Dealer Attitude Survey Winter 2018/2019
4
Profit return
How satisfied are you with the current profit return from representing your business?
Top performer: Kia 8.5 points
Bottom performer: Citroen 2.3 points
Biggest improvement: Mercedes +3.5 points
Largest decline: BMW -1.4 points
Average score: 5.0 points
Previous average: 4.9 points
Summary
The average score of dealers’ satisfaction with their current profit return increased by 0.1
points compared to the previous survey. There were 13 responses above the 5.0 neutral
score, 17 dealer networks saw their levels of satisfaction increase, 12 experienced a decrease
and 1 did not change.
2.3
2.6
2.7
3.0
3.1
3.5
3.5
4.1
4.1
4.2
4.3
4.5
4.6
4.7
4.7
4.9
4.9
5.1
5.5
5.6
5.8
5.9
6.5
6.8
7.1
7.5
7.6
7.6
7.9
8.5
[2.6]
[4.0]
[2.4]
[2.1]
[3.4]
[4.4]
[3.8]
[2.6]
[5.2]
[4.9]
[5.1]
[4.9]
[5.0]
[5.2]
[3.1]
[5.1]
[4.8]
[4.6]
[4.6]
[5.0]
[5.1]
[5.2]
[4.8]
[6.3]
[5.9]
[7.4]
[4.1]
[6.4]
[7.9]
[8.0]
5.0
0
0.1
0.2
0.3
0.4
0.5
0.6
0.7
0.8
0.9
1
0 1 2 3 4 5 6 7 8 9 10
CITROEN
BMW
JEEP
ALFA ROMEO
FIAT
ABARTH
AUDI
JAGUAR
VOLKSWAGEN
NISSAN
RENAULT
FORD
HONDA
DACIA
VOLVO
MINI
MITSUBISHI
VAUXHALL
SKODA
SUBARU
HYUNDAI
PEUGEOT
LAND ROVER
MAZDA
SUZUKI
LEXUS
MERCEDES
SEAT
TOYOTA
KIA
Figures in white = Winter 2018/2019
Figures in black = Summer 2018

Dealer Attitude Survey Winter 2018/2019
5
Profit return
How satisfied are you with the future profit return from representing your business?
Top performer: Kia 8.7 points
Bottom performer: Fiat 2.9 points
Biggest improvement: Land Rover +1.4 points
Largest decline: BMW -2.5 points
Average score: 5.3 points
Previous average: 5.4 points
Summary
Once again, dealers showed more optimism about their future profit than their current one with
an average score of 5.3 points, down by 0.1 points from six months ago but up by 0.5 points
from the previous winter survey. Overall, 14 scores improved, 15 decreased and 1 remained
the same. There were 16 scores above 5.0.
2.9
3.0
3.2
3.2
3.2
3.5
3.9
4.2
4.4
4.5
4.5
4.6
4.8
4.9
5.1
5.3
5.3
5.4
5.7
5.8
6
6.2
6.4
6.7
7.0
7.3
7.3
8.3
8.5
8.7
[3.8]
[3.0]
[2.4]
[5.7]
[3.9]
[4.6]
[4.4]
[5.8]
[3.9]
[4.8]
[5.5]
[5.2]
[5.5]
[4.8]
[5.8]
[5.5]
[4.2]
[6.0]
[4.8]
[5.5]
[5.3]
[5.4]
[5.0]
[6.0]
[6.7]
[6.7]
[6.6]
[8.5]
[8.6]
[8.2]
5.3
0
0.1
0.2
0.3
0.4
0.5
0.6
0.7
0.8
0.9
1
0 1 2 3 4 5 6 7 8 9 10
FIAT
JEEP
ALFA ROMEO
BMW
CITROEN
ABARTH
VAUXHALL
RENAULT
JAGUAR
FORD
VOLKSWAGEN
AUDI
HONDA
NISSAN
MINI
DACIA
VOLVO
MITSUBISHI
SKODA
SUBARU
HYUNDAI
PEUGEOT
LAND ROVER
SUZUKI
MAZDA
MERCEDES
SEAT
TOYOTA
LEXUS
KIA

Dealer Attitude Survey Winter 2018/2019
6
Profit return
How satisfied are you with your total margin on new vehicles?
Top performer: Lexus and Kia 8.7 points
Bottom performer: Fiat 3.1 points
Biggest improvement: Mercedes +2.4 points
Largest decline: Abarth -1.6 points
Average score: 5.4 points
Previous average: 5.2 points
Summary
The average dealers’ satisfaction with total margin on new vehicles continued to increase: it
was up by 0.2 points from six months ago and up by 0.5 points from last winter. Almost two
thirds of respondents (18; 60%) saw their score improve and about the same number of
responses (17; 57%) were above the neutral mark of 5.0.
3.1
3.5
3.7
3.7
3.8
3.8
4.1
4.1
4.2
4.5
4.6
4.7
5.0
5.1
5.3
5.5
5.5
5.6
5.8
6.0
6.1
6.4
6.6
6.6
6.8
7.0
7.9
8.4
8.7
8.7
[4.2]
[5.1]
[4.0]
[4.1]
[4.1]
[3.6]
[3.1]
[4.1]
[3.5]
[5.0]
[4.1]
[4.5]
[3.6]
[5.3]
[5.2]
[5.1]
[6.1]
[3.9]
[6.2]
[4.6]
[5.3]
[5.9]
[6.0]
[5.9]
[6.8]
[6.3]
[8.1]
[6.0]
[8.3]
[8.2]
5.4
1
0
0.1
0.2
0.3
0.4
0.5
0.6
0.7
0.8
0.9
1
0 1 2 3 4 5 6 7 8 9 10
FIAT
ABARTH
BMW
CITROEN
FORD
JEEP
ALFA ROMEO
DACIA
VAUXHALL
MITSUBISHI
VOLVO
MINI
JAGUAR
NISSAN
HYUNDAI
RENAULT
VOLKSWAGEN
AUDI
HONDA
SKODA
PEUGEOT
SUBARU
LAND ROVER
SUZUKI
MAZDA
SEAT
TOYOTA
MERCEDES
KIA
LEXUS

Dealer Attitude Survey Winter 2018/2019
7
Return on investment
How satisfied are you with the required level of capital investment?
Top performer: Kia 9.0 points
Bottom performer: Jaguar 1.8 points
Biggest improvement: Mercedes and Dacia +2.4 points
Largest decline: BMW -2.1 points
Average score: 5.3 points
Previous average: 5.4 points
Summary
At 5.3 points, the average dealers’ satisfaction required level of capital investment saw a slight
decline of 0.1 points from the summer survey but was 0.3 points higher than 12 months ago.
18 scores improved, while 12 declined. More than half of the dealer networks surveyed (16;
53%) gave an answer above 5.0.
1.8
2.8
3.4
3.5
3.6
3.7
4.0
4.2
4.3
4.3
4.4
4.7
4.7
5.0
5.3
5.3
5.4
5.5
5.7
5.8
6.0
7.1
7.2
7.3
7.3
7.9
8.0
8.5
8.9
9.0
[2.7]
[2.6]
[3.0]
[2.5]
[5.7]
[4.0]
[2.8]
[2.6]
[4.4]
[4.6]
[5.3]
[5.7]
[4.4]
[5.5]
[5.6]
[5.7]
[5.1]
[6.5]
[5.2]
[5.3]
[5.4]
[4.7]
[6.5]
[6.7]
[7.2]
[7.1]
[8.3]
[8.1]
[6.5]
[8.7]
5.3
0
0.1
0.2
0.3
0.4
0.5
0.6
0.7
0.8
0.9
1
0 1 2 3 4 5 6 7 8 9 10
JAGUAR
CITROEN
JEEP
ALFA ROMEO
BMW
FIAT
VOLVO
LAND ROVER
ABARTH
AUDI
VOLKSWAGEN
RENAULT
VAUXHALL
MINI
FORD
HONDA
NISSAN
MITSUBISHI
HYUNDAI
SKODA
PEUGEOT
DACIA
SUBARU
MAZDA
SEAT
SUZUKI
TOYOTA
LEXUS
MERCEDES
KIA

Dealer Attitude Survey Winter 2018/2019
8
Return on investment
How satisfied are you with the return on capital for your dealership?
Top performer: Kia 8.6 points
Bottom performer: Citroen 2.3 points
Biggest improvement: Mercedes +3.3 points
Largest decline: BMW -1.8 points
Average score: 4.9 points
Previous average: 4.8 points
Summary
Although the average score remains low, dealers’ levels of satisfaction with the return on
capital for their dealerships also improved in this issue of the survey. The score of 4.9 was up
by 0.1 points from six months ago and by 0.4 from last year. Over the past six months, 17
dealer networks out of 30 saw their score increase. Less than half of the respondents (12;
40%) gave a score above the neutral mark of 5.0.
2.3
2.5
2.6
2.8
2.8
3.5
3.5
3.9
3.9
4.1
4.2
4.3
4.4
4.6
4.7
4.7
4.8
4.9
5.2
5.5
5.5
5.6
5.9
6.5
7.0
7.4
7.8
7.9
8.2
8.6
[2.5]
[2.2]
[4.4]
[2.0]
[3.2]
[3.7]
[4.1]
[2.4]
[5.2]
[5.2]
[4.6]
[3.1]
[5.1]
[3.5]
[5.1]
[5.3]
[5.2]
[4.1]
[4.9]
[4.3]
[5.0]
[5.2]
[6.2]
[6.2]
[6.2]
[4.5]
[8.1]
[7.8]
[8.0]
4.9
0
0.1
0.2
0.3
0.4
0.5
0.6
0.7
0.8
0.9
1
0 1 2 3 4 5 6 7 8 9 10
CITROEN
JEEP
BMW
ALFA ROMEO
FIAT
ABARTH
AUDI
JAGUAR
VOLKSWAGEN
NISSAN
RENAULT
VOLVO
MINI
LAND ROVER
FORD
HONDA
MITSUBISHI
VAUXHALL
HYUNDAI
PEUGEOT
SKODA
SUBARU
DACIA
MAZDA
SUZUKI
SEAT
MERCEDES
TOYOTA
LEXUS
KIA

Dealer Attitude Survey Winter 2018/2019
9
Targets
How satisfied are you that the volume target aspirations of your manufacturer are
realistic?
Summary
The average score indicating dealers’ satisfaction with their manufacturers’ target aspirations
rose from 4.5 to 5.2 over the last twelve months (six months ago the average was 4.8). The
vast majority of the dealer networks surveyed (21; 70%) saw their score grow, 7 decreased
and 2 remained unchanged. More than half of the manufacturers (17; 57%) had a score above
5.0.
3.1
3.1
3.3
3.3
3.5
3.8
3.9
3.9
4.1
4.4
4.4
4.4
4.7
5.2
5.3
5.4
5.4
5.5
5.9
6.1
6.1
6.2
6.2
6.3
7.2
7.3
7.6
8.1
8.4
8.5
[3.5]
[3.3]
[4.0]
[3.3]
[3.1]
[2.3]
[3.9]
[3.1]
[2.6]
[5.0]
[5.4]
[3.1]
[4.3]
[3.6]
[5.8]
[5.2]
[4.8]
[5.0]
[5.8]
[5.8]
[6.7]
[5.2]
[3.7]
[6.2]
[6.6]
[6.8]
[8.0]
[8.1]
[8.0]
5.20
0.1
0.2
0.3
0.4
0.5
0.6
0.7
0.8
0.9
1
0 1 2 3 4 5 6 7 8 9 10
AUDIDACIA
BMWCITROEN
JEEPRENAULT
ALFA ROMEOFORD
VAUXHALLFIAT
NISSANVOLKSWAGEN
VOLVOABARTHJAGUARHONDA
MITSUBISHIHYUNDAI
PEUGEOTLAND ROVER
MINISEAT
SKODAMERCEDES
SUBARUMAZDASUZUKI
TOYOTAKIA
LEXUS
Top performer: Lexus 8.5 points
Bottom performer: Audi and Dacia 3.1 points
Biggest improvement: Mercedes +2.6 points
Largest decline: Volkswagen -1.0 points
Average score: 5.2 points
Previous average: 4.8 points
Dealer Attitude Survey Winter 2018/2019
10
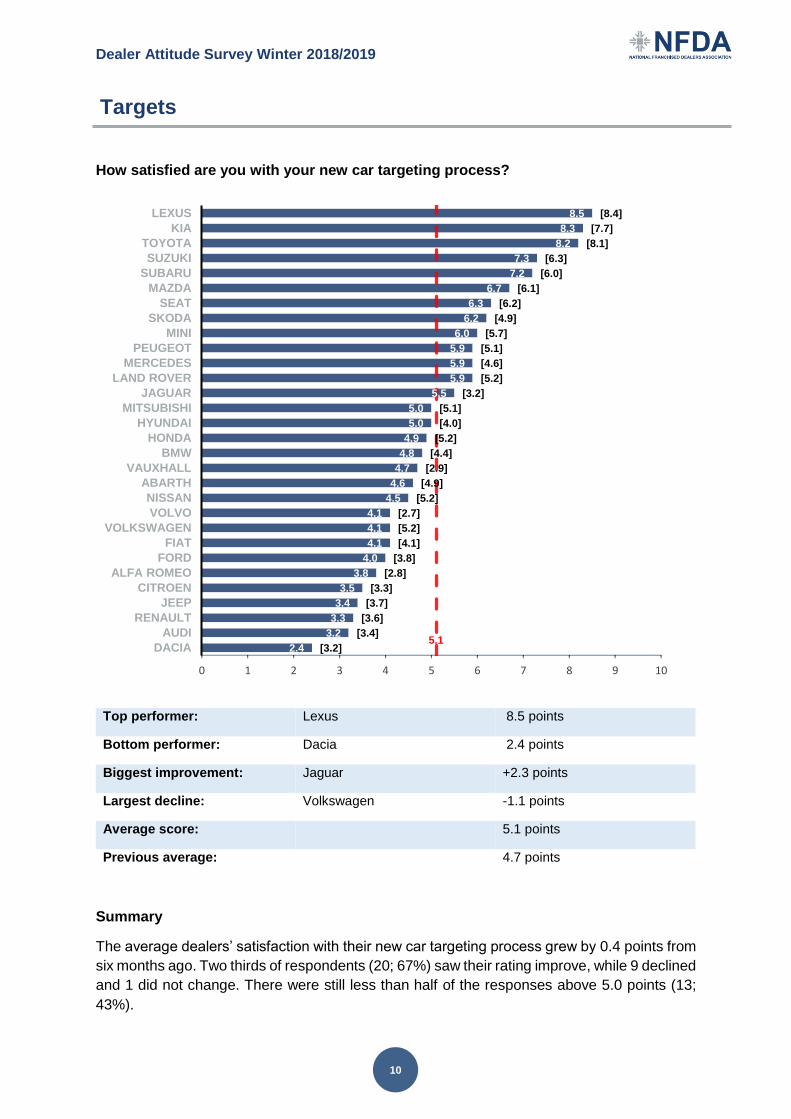
Targets
How satisfied are you with your new car targeting process?
Summary
The average dealers’ satisfaction with their new car targeting process grew by 0.4 points from
six months ago. Two thirds of respondents (20; 67%) saw their rating improve, while 9 declined
and 1 did not change. There were still less than half of the responses above 5.0 points (13;
43%).
2.4
3.2
3.3
3.4
3.5
3.8
4.0
4.1
4.1
4.1
4.5
4.6
4.7
4.8
4.9
5.0
5.0
5.5
5.9
5.9
5.9
6.0
6.2
6.3
6.7
7.2
7.3
8.2
8.3
8.5
[3.2]
[3.4]
[3.6]
[3.7]
[3.3]
[2.8]
[3.8]
[4.1]
[5.2]
[2.7]
[5.2]
[4.9]
[2.9]
[4.4]
[5.2]
[4.0]
[5.1]
[3.2]
[5.2]
[4.6]
[5.1]
[5.7]
[4.9]
[6.2]
[6.1]
[6.0]
[6.3]
[8.1]
[7.7]
[8.4]
5.1
0
0.1
0.2
0.3
0.4
0.5
0.6
0.7
0.8
0.9
1
0 1 2 3 4 5 6 7 8 9 10
DACIA
AUDI
RENAULT
JEEP
CITROEN
ALFA ROMEO
FORD
FIAT
VOLKSWAGEN
VOLVO
NISSAN
ABARTH
VAUXHALL
BMW
HONDA
HYUNDAI
MITSUBISHI
JAGUAR
LAND ROVER
MERCEDES
PEUGEOT
MINI
SKODA
SEAT
MAZDA
SUBARU
SUZUKI
TOYOTA
KIA
LEXUS
Top performer: Lexus 8.5 points
Bottom performer: Dacia 2.4 points
Biggest improvement: Jaguar +2.3 points
Largest decline: Volkswagen -1.1 points
Average score: 5.1 points
Previous average: 4.7 points
Dealer Attitude Survey Winter 2018/2019
11
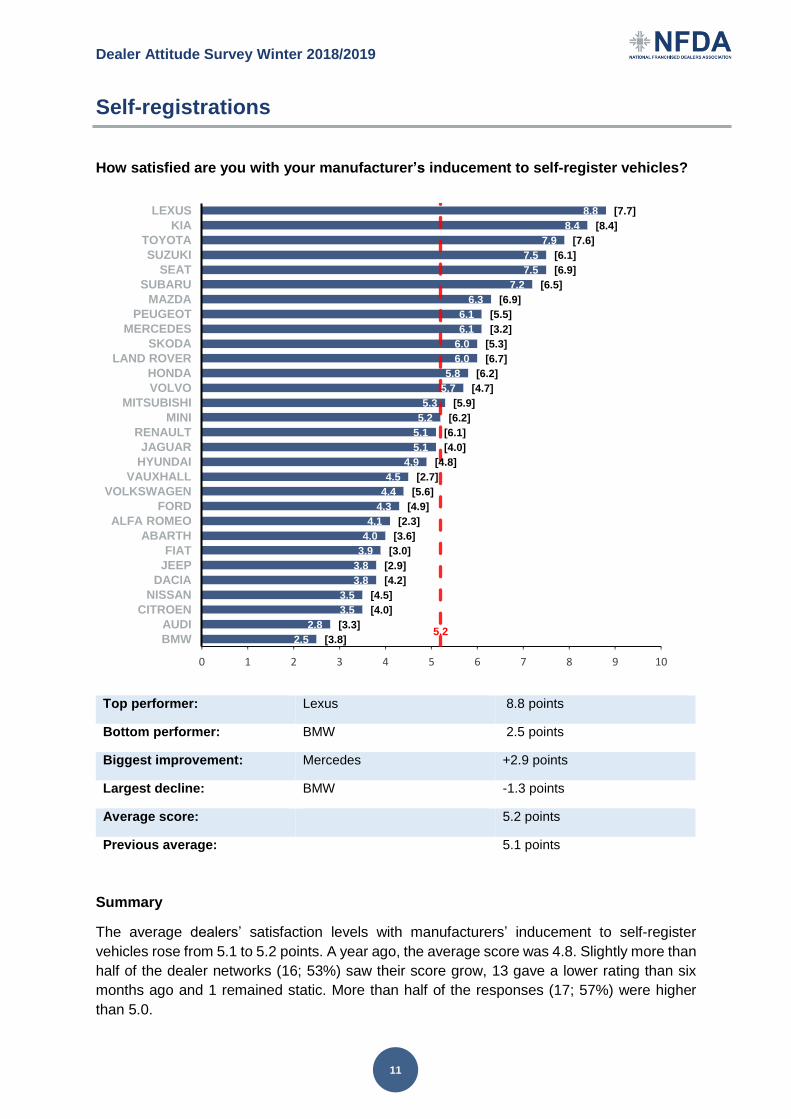
Self-registrations
How satisfied are you with your manufacturer’s inducement to self-register vehicles?
Summary
The average dealers’ satisfaction levels with manufacturers’ inducement to self-register
vehicles rose from 5.1 to 5.2 points. A year ago, the average score was 4.8. Slightly more than
half of the dealer networks (16; 53%) saw their score grow, 13 gave a lower rating than six
months ago and 1 remained static. More than half of the responses (17; 57%) were higher
than 5.0.
2.5
2.8
3.5
3.5
3.8
3.8
3.9
4.0
4.1
4.3
4.4
4.5
4.9
5.1
5.1
5.2
5.3
5.7
5.8
6.0
6.0
6.1
6.1
6.3
7.2
7.5
7.5
7.9
8.4
8.8
[3.8]
[3.3]
[4.0]
[4.5]
[4.2]
[2.9]
[3.0]
[3.6]
[2.3]
[4.9]
[5.6]
[2.7]
[4.8]
[4.0]
[6.1]
[6.2]
[5.9]
[4.7]
[6.2]
[6.7]
[5.3]
[3.2]
[5.5]
[6.9]
[6.5]
[6.9]
[6.1]
[7.6]
[8.4]
[7.7]
5.2
0
0.1
0.2
0.3
0.4
0.5
0.6
0.7
0.8
0.9
1
0 1 2 3 4 5 6 7 8 9 10
BMW
AUDI
CITROEN
NISSAN
DACIA
JEEP
FIAT
ABARTH
ALFA ROMEO
FORD
VOLKSWAGEN
VAUXHALL
HYUNDAI
JAGUAR
RENAULT
MINI
MITSUBISHI
VOLVO
HONDA
LAND ROVER
SKODA
MERCEDES
PEUGEOT
MAZDA
SUBARU
SEAT
SUZUKI
TOYOTA
KIA
LEXUS
Top performer: Lexus 8.8 points
Bottom performer: BMW 2.5 points
Biggest improvement: Mercedes +2.9 points
Largest decline: BMW -1.3 points
Average score: 5.2 points
Previous average: 5.1 points
Dealer Attitude Survey Winter 2018/2019
12
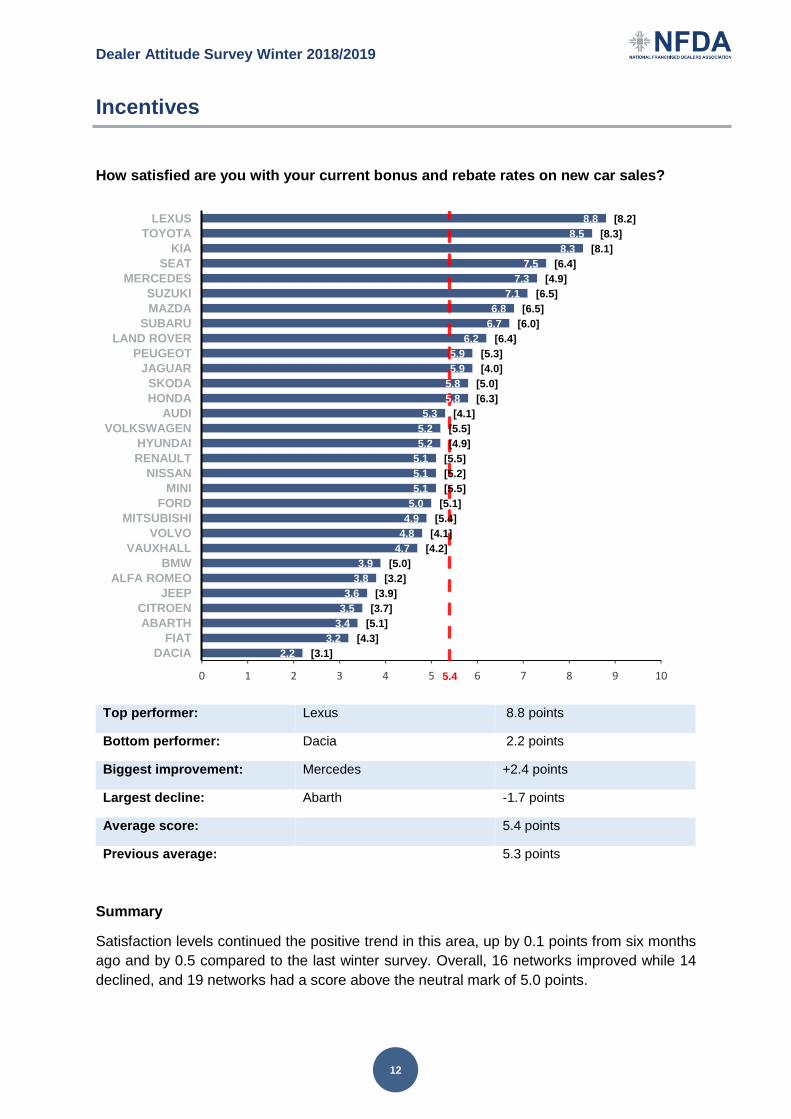
Incentives
How satisfied are you with your current bonus and rebate rates on new car sales?
Top performer: Lexus 8.8 points
Bottom performer: Dacia 2.2 points
Biggest improvement: Mercedes +2.4 points
Largest decline: Abarth -1.7 points
Average score: 5.4 points
Previous average: 5.3 points
Summary
Satisfaction levels continued the positive trend in this area, up by 0.1 points from six months
ago and by 0.5 compared to the last winter survey. Overall, 16 networks improved while 14
declined, and 19 networks had a score above the neutral mark of 5.0 points.
2.2
3.2
3.4
3.5
3.6
3.8
3.9
4.7
4.8
4.9
5.0
5.1
5.1
5.1
5.2
5.2
5.3
5.8
5.8
5.9
5.9
6.2
6.7
6.8
7.1
7.3
7.5
8.3
8.5
8.8
[3.1]
[4.3]
[5.1]
[3.7]
[3.9]
[3.2]
[5.0]
[4.2]
[4.1]
[5.4]
[5.1]
[5.5]
[5.2]
[5.5]
[4.9]
[5.5]
[4.1]
[6.3]
[5.0]
[4.0]
[5.3]
[6.4]
[6.0]
[6.5]
[6.5]
[4.9]
[6.4]
[8.1]
[8.3]
[8.2]
5.4
0
0.1
0.2
0.3
0.4
0.5
0.6
0.7
0.8
0.9
1
0 1 2 3 4 5 6 7 8 9 10
DACIA
FIAT
ABARTH
CITROEN
JEEP
ALFA ROMEO
BMW
VAUXHALL
VOLVO
MITSUBISHI
FORD
MINI
NISSAN
RENAULT
HYUNDAI
VOLKSWAGEN
AUDI
HONDA
SKODA
JAGUAR
PEUGEOT
LAND ROVER
SUBARU
MAZDA
SUZUKI
MERCEDES
SEAT
KIA
TOYOTA
LEXUS

Dealer Attitude Survey Winter 2018/2019
13
Day-to-day working relationship
How satisfied are you with your ability to do business with your manufacturer on a
day-to-day basis?
Top performer: Toyota 9.5 points
Bottom performer: Jeep, Fiat and Citroen 4.0 points
Biggest improvement: Mercedes +2.0 points
Largest decline: Renault -1.2 points
Average score: 6.2 points
Previous average: 6.2 points
Summary
The ability to do business on a day-to-day basis is a crucial aspect of the dealer/manufacturer
relationship. The average score remained unchanged from six months ago. More than half of
the respondents saw an improvement in score (17; 57%), while 11 went down and 2 did not
change. The majority of the ratings were above 5.0 points (24; 80%).
4.0
4.0
4.0
4.3
4.4
4.6
5.4
5.7
5.7
5.7
5.7
5.8
5.9
5.9
6.2
6.3
6.4
6.6
6.6
6.9
6.9
7.4
7.6
7.8
7.8
7.9
9.0
9.2
9.3
9.5
[3.7]
[3.9]
[4.0]
[3.2]
[4.4]
[5.6]
[6.0]
[5.9]
[4.4]
[6.2]
[4.7]
[6.2]
[5.4]
[7.1]
[5.9]
[5.7]
[4.8]
[7.0]
[5.5]
[6.8]
[7.0]
[8.2]
[7.1]
[6.9]
[7.3]
[8.1]
[7.0]
[9.3]
[9.1]
[9.0]
6.2
0
0.1
0.2
0.3
0.4
0.5
0.6
0.7
0.8
0.9
1
0 1 2 3 4 5 6 7 8 9 10
CITROEN
FIAT
JEEP
ALFA ROMEO
ABARTH
AUDI
VAUXHALL
FORD
JAGUAR
VOLKSWAGEN
VOLVO
NISSAN
DACIA
RENAULT
HYUNDAI
SKODA
LAND ROVER
BMW
PEUGEOT
HONDA
MITSUBISHI
MINI
SUZUKI
SEAT
SUBARU
MAZDA
MERCEDES
KIA
LEXUS
TOYOTA

Dealer Attitude Survey Winter 2018/2019
14
Day-to-day working relationship
How satisfied are you that the management of your manufacturer actually takes
dealers’ views and opinions into account?
Top performer: Kia 9.4 points
Bottom performer: Jeep, Fiat and Citroen 3.7 points
Biggest improvement: Mercedes +1.9 points
Largest decline: BMW -2.1 points
Average score: 5.5 points
Previous average: 5.7 points
Summary
The average score of 5.5 is 0.2 points lower than six months ago and 0.2 pints higher than a
year ago. Overall, half of the manufacturers had a higher score than six months ago, 12 ratings
were lower and 3 did not change. Slightly more than half of the responses (16; 53%) were
above the neutral mark of 5.0.
3.7
3.7
3.7
4.0
4.1
4.1
4.2
4.3
4.3
4.3
4.6
4.6
4.7
4.9
5.3
5.8
5.8
6.1
6.1
6.2
6.6
6.8
7.0
7.2
7.3
7.5
8.9
9.2
9.2
9.4
[3.5]
[3.5]
[3.6]
[4.6]
[4.2]
[3.2]
[5.1]
[6.4]
[4.4]
[5.9]
[5.3]
[6.1]
[5.7]
[3.2]
[4.0]
[5.0]
[5.2]
[5.0]
[6.7]
[5.3]
[6.6]
[6.8]
[6.4]
[7.5]
[6.7]
[7.6]
[7.0]
[9.2]
[9.0]
[9.2]
5.5
0
0.1
0.2
0.3
0.4
0.5
0.6
0.7
0.8
0.9
1
0 1 2 3 4 5 6 7 8 9 10
CITROENFIAT
JEEPVAUXHALL
ABARTHALFA ROMEO
FORDBMW
DACIAVOLKSWAGEN
AUDIRENAULT
NISSANVOLVO
JAGUARHYUNDAI
SKODALAND ROVER
MITSUBISHIPEUGEOT
HONDASUZUKI
SEATMINI
SUBARU
MAZDAMERCEDES
LEXUSTOYOTA
KIA
Dealer Attitude Survey Winter 2018/2019
15
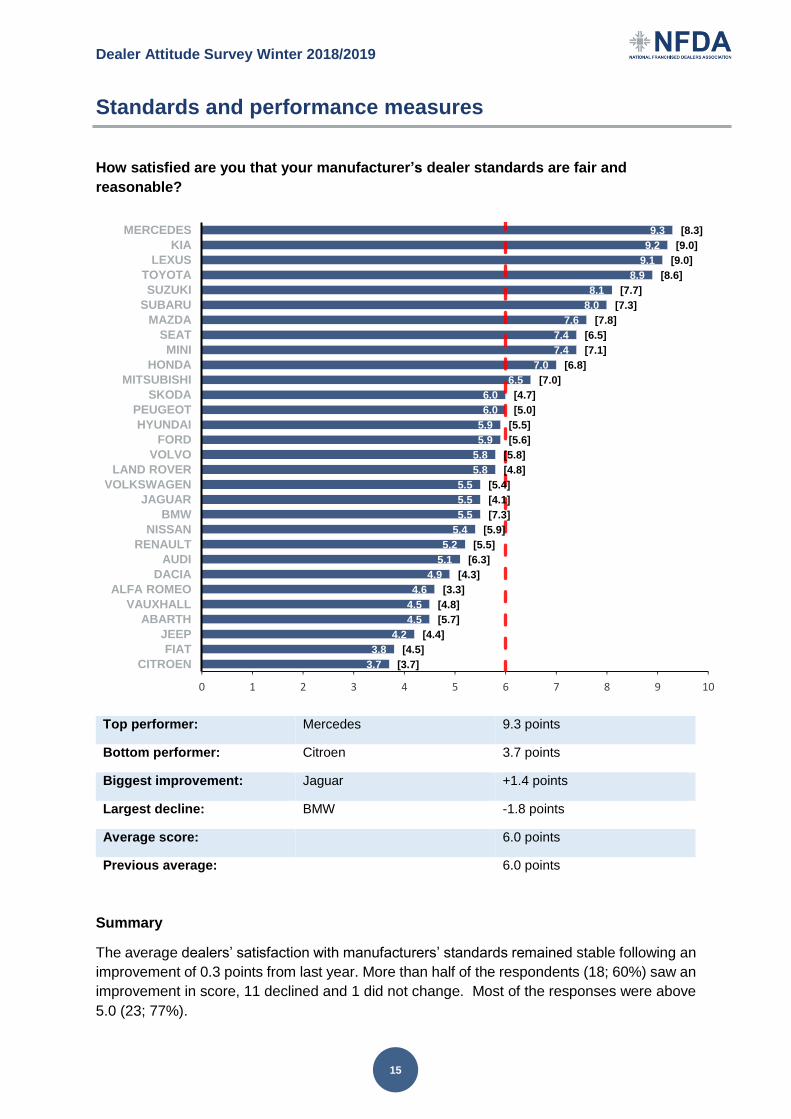
Standards and performance measures
How satisfied are you that your manufacturer’s dealer standards are fair and
reasonable?
Top performer: Mercedes 9.3 points
Bottom performer: Citroen 3.7 points
Biggest improvement: Jaguar +1.4 points
Largest decline: BMW -1.8 points
Average score: 6.0 points
Previous average: 6.0 points
Summary
The average dealers’ satisfaction with manufacturers’ standards remained stable following an
improvement of 0.3 points from last year. More than half of the respondents (18; 60%) saw an
improvement in score, 11 declined and 1 did not change. Most of the responses were above
5.0 (23; 77%).
3.7
3.8
4.2
4.5
4.5
4.6
4.9
5.1
5.2
5.4
5.5
5.5
5.5
5.8
5.8
5.9
5.9
6.0
6.0
6.5
7.0
7.4
7.4
7.6
8.0
8.1
8.9
9.1
9.2
9.3
[3.7]
[4.5]
[4.4]
[5.7]
[4.8]
[3.3]
[4.3]
[6.3]
[5.5]
[5.9]
[7.3]
[4.1]
[5.4]
[4.8]
[5.8]
[5.6]
[5.5]
[5.0]
[4.7]
[7.0]
[6.8]
[7.1]
[6.5]
[7.8]
[7.3]
[7.7]
[8.6]
[9.0]
[9.0]
[8.3]
0
0.1
0.2
0.3
0.4
0.5
0.6
0.7
0.8
0.9
1
0 1 2 3 4 5 6 7 8 9 10
CITROEN
FIAT
JEEP
ABARTH
VAUXHALL
ALFA ROMEO
DACIA
AUDI
RENAULT
NISSAN
BMW
JAGUAR
VOLKSWAGEN
LAND ROVER
VOLVO
FORD
HYUNDAI
PEUGEOT
SKODA
MITSUBISHI
HONDA
MINI
SEAT
MAZDA
SUBARU
SUZUKI
TOYOTA
LEXUS
KIA
MERCEDES

Dealer Attitude Survey Winter 2018/2019
16
Standards and performance measures
How satisfied are you that the performance measures used by your manufacturer on
your business are fair and reasonable?
Top performer: Mercedes and Kia 9.3 points
Bottom performer: Citroen 3.4 points
Biggest improvement: Alfa Romeo and Mercedes +1.2 points
Largest decline: BMW -2.2 points
Average score: 5.9 points
Previous average: 5.9 points
Summary
In this area, the average score remained the same following an increase of 0.2 points recorded
six months ago. The same number of networks saw their score improve and decline (14; 47%)
while 2 did not change. Two thirds of the responses (20; 67%) were higher than the neutral
mark of 5.0.
3.4
3.6
4.0
4.1
4.3
4.5
4.6
4.8
4.9
4.9
5.2
5.3
5.4
5.7
6.0
6.1
6.1
6.2
6.3
6.3
6.4
7.2
7.2
7.2
7.7
7.8
8.7
9.1
9.3
9.3
[3.6]
[4.3]
[4.2]
[4.6]
[5.1]
[3.3]
[6.2]
[5.8]
[7.1]
[4.9]
[5.9]
[4.5]
[5.5]
[5.0]
[5.7]
[5.4]
[5.5]
[5.2]
[6.4]
[5.4]
[6.7]
[7.4]
[7.3]
[6.9]
[7.6]
[7.5]
[8.6]
[9.1]
[9.0]
[8.1]
5.9
0
0.1
0.2
0.3
0.4
0.5
0.6
0.7
0.8
0.9
1
0 1 2 3 4 5 6 7 8 9 10
CITROEN
FIAT
JEEP
VAUXHALL
ABARTH
ALFA ROMEO
AUDI
RENAULT
BMW
DACIA
NISSAN
VOLVO
VOLKSWAGEN
JAGUAR
FORD
HYUNDAI
LAND ROVER
PEUGEOT
HONDA
SKODA
MITSUBISHI
MAZDA
MINI
SEAT
SUZUKI
SUBARU
TOYOTA
LEXUS
KIA
MERCEDES
Dealer Attitude Survey Winter 2018/2019
17
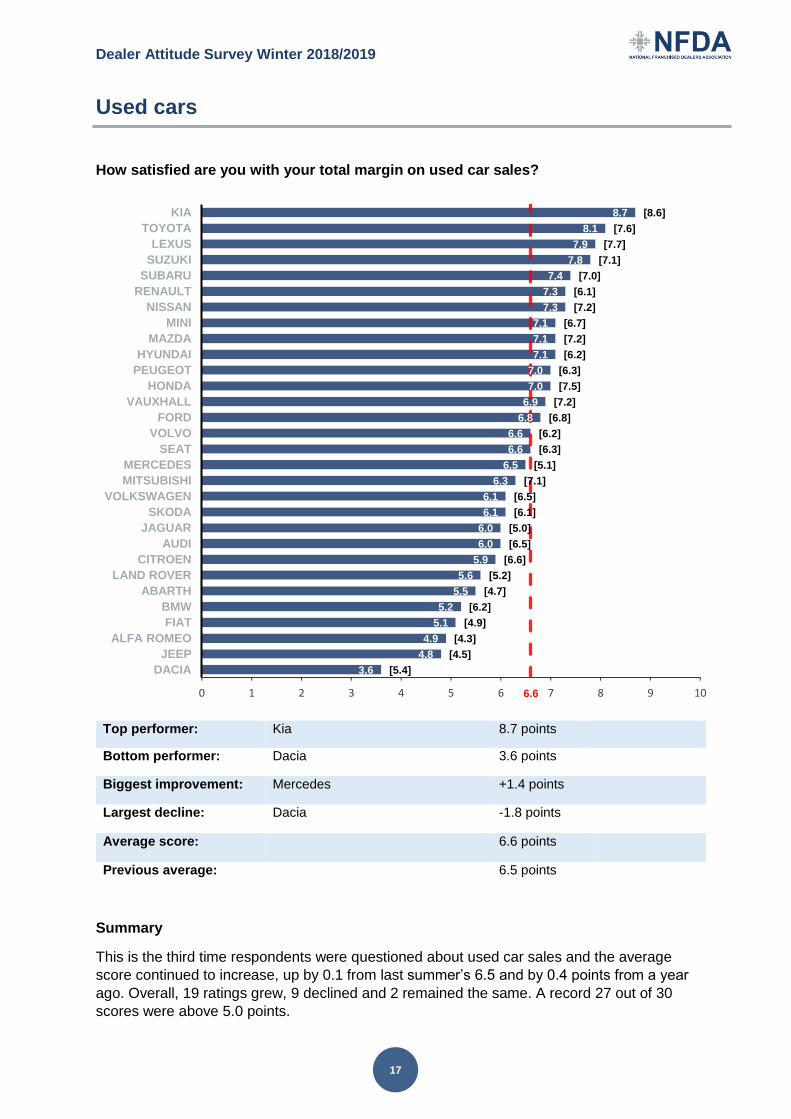
Used cars
How satisfied are you with your total margin on used car sales?
Top performer: Kia 8.7 points
Bottom performer: Dacia 3.6 points
Biggest improvement: Mercedes +1.4 points
Largest decline: Dacia -1.8 points
Average score: 6.6 points
Previous average: 6.5 points
Summary
This is the third time respondents were questioned about used car sales and the average
score continued to increase, up by 0.1 from last summer’s 6.5 and by 0.4 points from a year
ago. Overall, 19 ratings grew, 9 declined and 2 remained the same. A record 27 out of 30
scores were above 5.0 points.
3.6
4.8
4.9
5.1
5.2
5.5
5.6
5.9
6.0
6.0
6.1
6.1
6.3
6.5
6.6
6.6
6.8
6.9
7.0
7.0
7.1
7.1
7.1
7.3
7.3
7.4
7.8
7.9
8.1
8.7
[5.4]
[4.5]
[4.3]
[4.9]
[6.2]
[4.7]
[5.2]
[6.6]
[6.5]
[5.0]
[6.1]
[6.5]
[7.1]
[5.1]
[6.3]
[6.2]
[6.8]
[7.2]
[7.5]
[6.3]
[6.2]
[7.2]
[6.7]
[7.2]
[6.1]
[7.0]
[7.1]
[7.7]
[7.6]
[8.6]
6.6
0
0.1
0.2
0.3
0.4
0.5
0.6
0.7
0.8
0.9
1
0 1 2 3 4 5 6 7 8 9 10
DACIA
JEEP
ALFA ROMEO
FIAT
BMW
ABARTH
LAND ROVER
CITROEN
AUDI
JAGUAR
SKODA
VOLKSWAGEN
MITSUBISHI
MERCEDES
SEAT
VOLVO
FORD
VAUXHALL
HONDA
PEUGEOT
HYUNDAI
MAZDA
MINI
NISSAN
RENAULT
SUBARU
SUZUKI
LEXUS
TOYOTA
KIA

Dealer Attitude Survey Winter 2018/2019
18
Used cars
How satisfied are you with your manufacturer's used car programme?
Top performer: Kia 9.3 points
Bottom performer: Dacia 2.4 points
Biggest improvement: Mercedes +2.7 points
Largest decline: Ford -0.9 points
Average score: 6.4 points
Previous average: 6.1 points
Summary
Retailers showed higher levels of satisfaction with their manufacturers’ used car
programmes, up by 0.3 points from six months ago. More than half had an improvement in
score (17; 57%), while the rest declined. Looking at the neutral 5.0 mark, 25 responses were
above it.
2.4
4.1
4.2
4.2
4.6
5.4
5.4
5.6
5.9
6.1
6.2
6.2
6.3
6.4
6.5
6.5
6.6
6.8
6.9
6.9
6.9
7.0
7.0
7.2
7.2
7.6
7.6
8.1
8.6
9.3
[3.1]
[3.5]
[3.2]
[3.4]
[3.2]
[6.3]
[4.8]
[4.7]
[6.0]
[6.4]
[6.7]
[6.4]
[7.0]
[6.8]
[5.7]
[6.6]
[4.6]
[7.0]
[5.3]
[6.7]
[7.1]
[7.7]
[6.8]
[7.3]
[7.1]
[7.3]
[7.1]
[7.5]
[5.9]
[8.7]
6.4
0
0.1
0.2
0.3
0.4
0.5
0.6
0.7
0.8
0.9
1
0 1 2 3 4 5 6 7 8 9 10
DACIA
ABARTH
FIAT
JEEP
ALFA ROMEO
FORD
RENAULT
HYUNDAI
SKODA
MITSUBISHI
CITROEN
SUZUKI
AUDI
HONDA
PEUGEOT
SEAT
JAGUAR
MAZDA
LAND ROVER
LEXUS
VOLKSWAGEN
VAUXHALL
VOLVO
NISSAN
SUBARU
BMW
TOYOTA
MINI
MERCEDES
KIA

Dealer Attitude Survey Winter 2018/2019
19
Future directions
How satisfied are you with the alternative fuel vehicle offering?
Top performer: Toyota 9.7 points
Bottom performer: Abarth 1.4 points
Biggest improvement: Mercedes +3.5 points
Largest decline: Audi, Jaguar and Mazda -0.9 points
Average score: 5.0 points
Previous average: 4.8 points
Summary
The average dealers’ satisfaction with the alternative fuel vehicle offering continued its
steady growth, up by 0.2 points from six months ago and 0.3 points from twelve months ago.
Out of all the respondents, 16 saw an increase in score, 12 went down and 2 remained the
same. More than half of the participating networks (16; 53%) gave a response above 5.0.
1.4
1.5
1.5
1.8
2.0
2.4
2.5
2.6
2.6
2.6
3.0
3.9
4.1
4.3
5.1
5.1
5.3
5.9
5.9
6.5
6.7
7.0
7.4
7.5
7.5
7.7
8.1
8.8
9.3
9.7
[1.7]
[1.5]
[1.3]
[1.6]
[2.2]
[1.8]
[3.1]
[2.9]
[3.0]
[2.7]
[3.9]
[3.5]
[2.6]
[3.5]
[6.0]
[3.2]
[5.2]
[6.8]
[6.1]
[6.1]
[6.4]
[7.2]
[7.6]
[4.0]
[5.7]
[7.7]
[8.0]
[8.5]
[8.6]
[9.2]
5.0
0
0.1
0.2
0.3
0.4
0.5
0.6
0.7
0.8
0.9
1
0 1 2 3 4 5 6 7 8 9 10
ABARTH
ALFA ROMEO
FIAT
JEEP
VAUXHALL
CITROEN
FORD
DACIA
HONDA
SKODA
MAZDA
SEAT
SUBARU
SUZUKI
AUDI
PEUGEOT
VOLKSWAGEN
JAGUAR
LAND ROVER
BMW
VOLVO
RENAULT
MITSUBISHI
MERCEDES
MINI
HYUNDAI
NISSAN
LEXUS
KIA
TOYOTA

Dealer Attitude Survey Winter 2018/2019
20
Future directions
How satisfied are you with your manufacturer’s approach to future retailing
channels?
Top performer: Kia 9.0 points
Bottom performer: Alfa Romeo 3.3 points
Biggest improvement: Subaru +1.5 points
Largest decline: Audi -2.0 points
Average score: 5.9 points
Previous average: 5.7 points
Summary
The average score of 5.9 is an increase of 0.2 points from the previous survey and half a
point from last year’s winter survey. About two out of every three networks saw their score
increase (20; 67%), 9 went down and 1 did not change. Most responses were above 5.0 (22;
73%).
3.3
3.4
3.7
4.1
4.4
4.6
4.7
5.0
5.3
5.3
5.4
6.0
6.0
6.0
6.1
6.1
6.1
6.1
6.3
6.3
6.7
6.8
6.8
6.9
6.9
7.6
8.2
8.6
8.7
9.0
[3.0]
[3.2]
[3.6]
[4.3]
[4.5]
[5.4]
[4.2]
[7.0]
[4.0]
[4.0]
[5.1]
[6.5]
[5.9]
[5.4]
[6.8]
[6.4]
[6.1]
[5.1]
[5.8]
[4.8]
[6.0]
[7.3]
[5.7]
[6.6]
[6.5]
[7.3]
[8.4]
[7.4]
[8.6]
[8.4]
5.9
0 1 2 3 4 5 6 7 8 9 10
ALFA ROMEO
JEEP
FIAT
ABARTH
CITROEN
HONDA
VAUXHALL
AUDI
DACIA
SKODA
FORD
JAGUAR
LAND ROVER
PEUGEOT
MITSUBISHI
RENAULT
VOLKSWAGEN
VOLVO
SEAT
SUBARU
SUZUKI
BMW
HYUNDAI
MAZDA
NISSAN
MINI
LEXUS
MERCEDES
TOYOTA
KIA

Dealer Attitude Survey Winter 2018/2019
21
Overall manufacturer scores
How would you rate your manufacturer overall on scale of 1 to 10?
Top performer: Kia 9.3 points
Bottom performer: Citroen 3.3 points
Biggest improvement: Mercedes +2.5 points
Largest decline: BMW -1.6 points
Average score: 5.8 points
Previous average: 5.7 points
Summary
The average score given in response to the key question how would you rate your
manufacturer overall? rose by 0.1 points from the last survey and a significant 0.5 points from
twelve months ago. Half of the dealer networks saw their score increase, while 12 decreased
and 3 did not move. Slightly less than two thirds of the responses (19; 63%) were above 5.0.
3.3
3.4
3.5
3.7
4.3
4.4
4.4
4.5
4.9
5.0
5.0
5.5
5.6
5.7
5.7
5.8
6.0
6.1
6.2
6.4
6.4
6.6
6.6
7.4
7.5
8.0
8.8
9.0
9.0
9.3
[3.4]
[3.4]
[2.1]
[3.6]
[4.1]
[4.7]
[6.0]
[5.4]
[3.6]
[5.9]
[5.9]
[5.5]
[4.4]
[6.4]
[5.8]
[5.9]
[5.6]
[6.2]
[5.4]
[5.5]
[5.3]
[7.5]
[5.8]
[7.5]
[6.6]
[6.7]
[8.7]
[6.5]
[9.0]
[9.1]
5.8
0
0.1
0.2
0.3
0.4
0.5
0.6
0.7
0.8
0.9
1
0 1 2 3 4 5 6 7 8 9 10
CITROEN
JEEP
ALFA ROMEO
FIAT
VAUXHALL
ABARTH
BMW
AUDI
JAGUAR
RENAULT
VOLKSWAGEN
FORD
VOLVO
HONDA
NISSAN
DACIA
HYUNDAI
MITSUBISHI
LAND ROVER
PEUGEOT
SKODA
MINI
SUBARU
MAZDA
SUZUKI
SEAT
LEXUS
MERCEDES
TOYOTA
KIA
Dealer Attitude Survey Winter 2018/2019
22
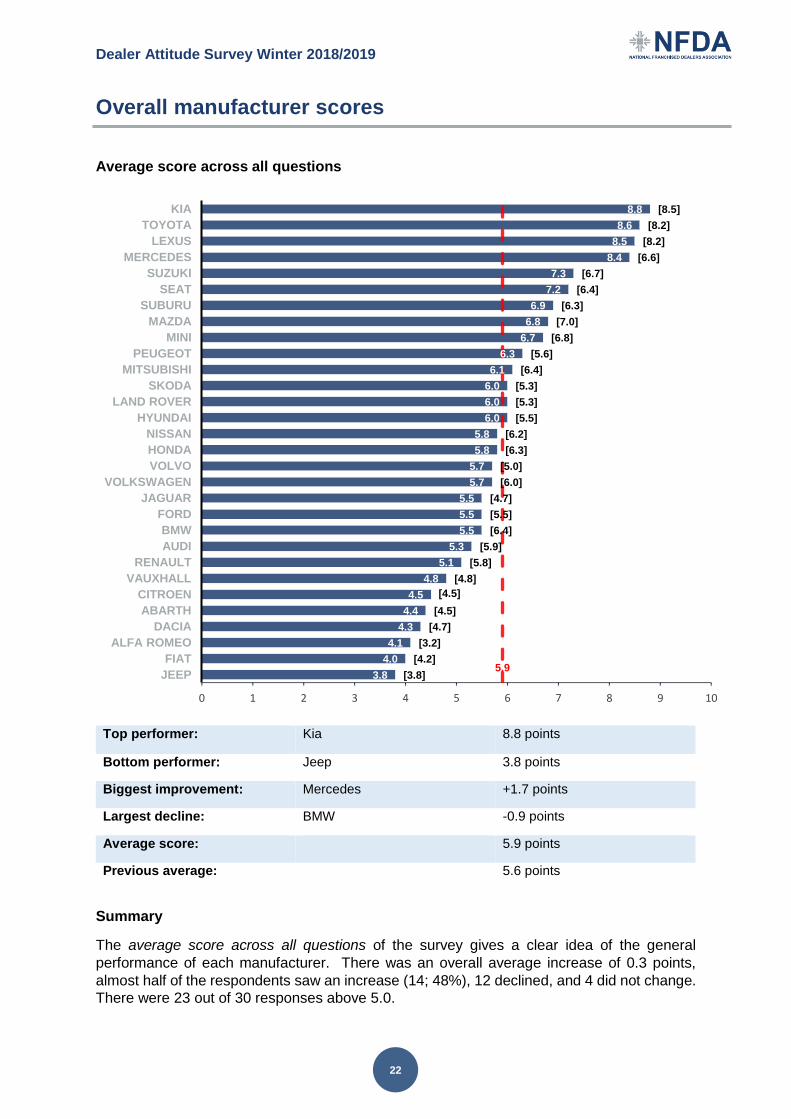
Overall manufacturer scores
Average score across all questions
Top performer: Kia 8.8 points
Bottom performer: Jeep 3.8 points
Biggest improvement: Mercedes +1.7 points
Largest decline: BMW -0.9 points
Average score: 5.9 points
Previous average: 5.6 points
Summary
The average score across all questions of the survey gives a clear idea of the general
performance of each manufacturer. There was an overall average increase of 0.3 points,
almost half of the respondents saw an increase (14; 48%), 12 declined, and 4 did not change.
There were 23 out of 30 responses above 5.0.
3.8
4.0
4.1
4.3
4.4
4.5
4.8
5.1
5.3
5.5
5.5
5.5
5.7
5.7
5.8
5.8
6.0
6.0
6.0
6.1
6.3
6.7
6.8
6.9
7.2
7.3
8.4
8.5
8.6
8.8
[3.8]
[4.2]
[3.2]
[4.7]
[4.5]
[4.5]
[4.8]
[5.8]
[5.9]
[6.4]
[5.5]
[4.7]
[6.0]
[5.0]
[6.3]
[6.2]
[5.5]
[5.3]
[5.3]
[6.4]
[5.6]
[6.8]
[7.0]
[6.3]
[6.4]
[6.7]
[6.6]
[8.2]
[8.2]
[8.5]
5.9
0
0.1
0.2
0.3
0.4
0.5
0.6
0.7
0.8
0.9
1
0 1 2 3 4 5 6 7 8 9 10
JEEP
FIAT
ALFA ROMEO
DACIA
ABARTH
CITROEN
VAUXHALL
RENAULT
AUDI
BMW
FORD
JAGUAR
VOLKSWAGEN
VOLVO
HONDA
NISSAN
HYUNDAI
LAND ROVER
SKODA
MITSUBISHI
PEUGEOT
MINI
MAZDA
SUBURU
SEAT
SUZUKI
MERCEDES
LEXUS
TOYOTA
KIA

Dealer Attitude Survey Winter 2018/2019
23
Overall manufacturer scores
Total movement across all questions
Biggest improvement: Mercedes +89.4 points
Largest decline: BMW -46.8 points
Average movement: +3.3 points
Previous average: +13.0 points
Summary
The movement in score across all the questions of the survey shows the overall improvements
and declines of each manufacturer. On average, ratings went up by 3.3 points from six months
ago and by 16.3 points from last year.
-46.8 [4.4]
-35.5 [57.8]
-29 [-36.6]
-26.5 [50.2]
-18.9 [14.2]
-18.3 [32.5]
-16.9 [60.7]
-9 [9]
-8.4 [2.9]
-6.8 [43.2]
-6.5 [57]
-4.5 [12]
-3.1 [11.5]
-2.8 [26.6]
-1.8 [-9.5]
0.6
12.9 [-4.2]
15.3 [-9]
17.6 [-10]
21.6 [45.7]
26.9 [-23.3]
31.3 [41]
33.7 [5.4]
33.7 [-6.1]
36.2 [5]
38.7 [0.3]
39.4 [-31.3]
43.6 [28.4]
45.5 [21.9]
89.4 [-85.4]
3.3
0
0.1
0.2
0.3
0.4
0.5
0.6
0.7
0.8
0.9
1
-60 -40 -20 0 20 40 60 80 100
BMW
RENAULT
AUDI
HONDA
VOLKSWAGEN
NISSAN
MITSUBISHI
MAZDA
CITROEN
FIAT
ABARTH
VAUXHALL
MINI
JEEP
FORD
DACIA
KIA
LEXUS
TOYOTA
HYUNDAI
SUZUKI
SUBURU
SKODA
VOLVO
PEUGEOT
LAND ROVER
SEAT
ALFA ROMEO
JAGUAR
MERCEDES