dean, simon m., mcneill, lisa c., henstock, … djajadihardja, yusuf s. and permana, haryadi (2010)....
TRANSCRIPT
1
Dean, Simon M., McNeill, Lisa C., Henstock, Timothy J., Bull, Jonathan 1 M., Gulick, Sean P.S., Austin, James A., Bangs, Nathan L.B., 2 Djajadihardja, Yusuf S. and Permana, Haryadi (2010). Contrasting 3 Decollement and Prism Properties over the Sumatra 2004-2005 4 Earthquake Rupture Boundary. Science, 329, (5988), 207-5 210.(doi:10.1126/science.1189373). 6
Contrasting Decollement and Prism Properties over the Sumatra 2004-
2005 Earthquake Rupture Boundary.
Simon M. Dean1, Lisa C. McNeill1, Timothy J. Henstock1, Jonathan M. Bull1, Sean P.S.
Gulick2, James A. Austin, Jr.2, Nathan L.B. Bangs2, Yusuf S. Djajadihardja3, Haryadi
Permana4
1 National Oceanography Centre, Southampton, University of Southampton, UK
2 Institute for Geophysics, Jackson School of Geosciences, University of Texas at Austin,
USA
3 Agency for the Assessment and Application of Technology (BPPT), Indonesia
4 Research Center for Geotechnology, Indonesia Institute for Sciences, Indonesia
2
Styles of subduction zone deformation and earthquake rupture dynamics are strongly 7
linked, impacting hazard potential. Seismic reflection profiles across the trench west of 8
Sumatra show differences across the boundary between the major 2004 and 2005 plate 9
interface earthquakes, which exhibited contrasting earthquake rupture and tsunami 10
generation. In the southern part of the 2004 rupture, we interpret a negative polarity 11
sedimentary reflector ~500m above the subducting oceanic basement as the seaward 12
extension of the plate interface. This pre-décollement reflector corresponds to unusual 13
prism structure, morphology and seismogenic behaviour in the southern 2004 rupture zone, 14
characteristics absent along the 2005 rupture zone. Although the 2004 rupture zone is 15
globally rare, our results show sediment properties influence earthquake rupture, tsunami 16
hazard and prism development at subducting plate boundaries. 17
18
The Mw=9.2 Sumatra earthquake of 26 December 2004, initiated close to Simeulue Island, 19
ruptured an area ~1300x150km and generated a regionally destructive tsunami (1). The 20
Mw=8.7 28 March 2005 earthquake, immediately to the south across an apparently 21
persistent rupture boundary, ruptured an area ~300x100km, causing only a local tsunami 22
(2). Rupture offshore N. Sumatra in 2004 initiated at 30-40km depth, then propagated 23
seaward beneath the prism and may have reached the seabed, rupturing faults within the 24
prism (3; 4; 5). In contrast, the 2005 rupture largely occurred beneath the forearc basin and 25
islands, with limited extent further seaward (1); other large subduction zone earthquakes 26
such as Chile 1960 and Alaska 1964 similarly lack clear evidence for rupture close to the 27
trench (e.g., 6, 7, 8). These different rupture patterns are likely controlled by rheology 28
(sediment properties), stress state and fault properties, and will generate different tsunami 29
3
by affecting both magnitude and water depth of the associated seafloor deformation. 30
Sediment properties within the trench input section and forearc may also affect the 31
morphology and deformation of the accretionary prism (e.g., 9, 6), in turn linked to the 32
dynamic earthquake process (10). On some subduction margins (e.g., Nankai (11), 33
Barbados (12)), a well-defined décollement (a low-angle detachment fault) into which 34
accretionary prism faults sole, is identified as the plate boundary thrust. However, beneath 35
the Sumatra forearc, the exact mechanism of rupture propagation and transfer of fault slip 36
to the seafloor is poorly understood. 37
38
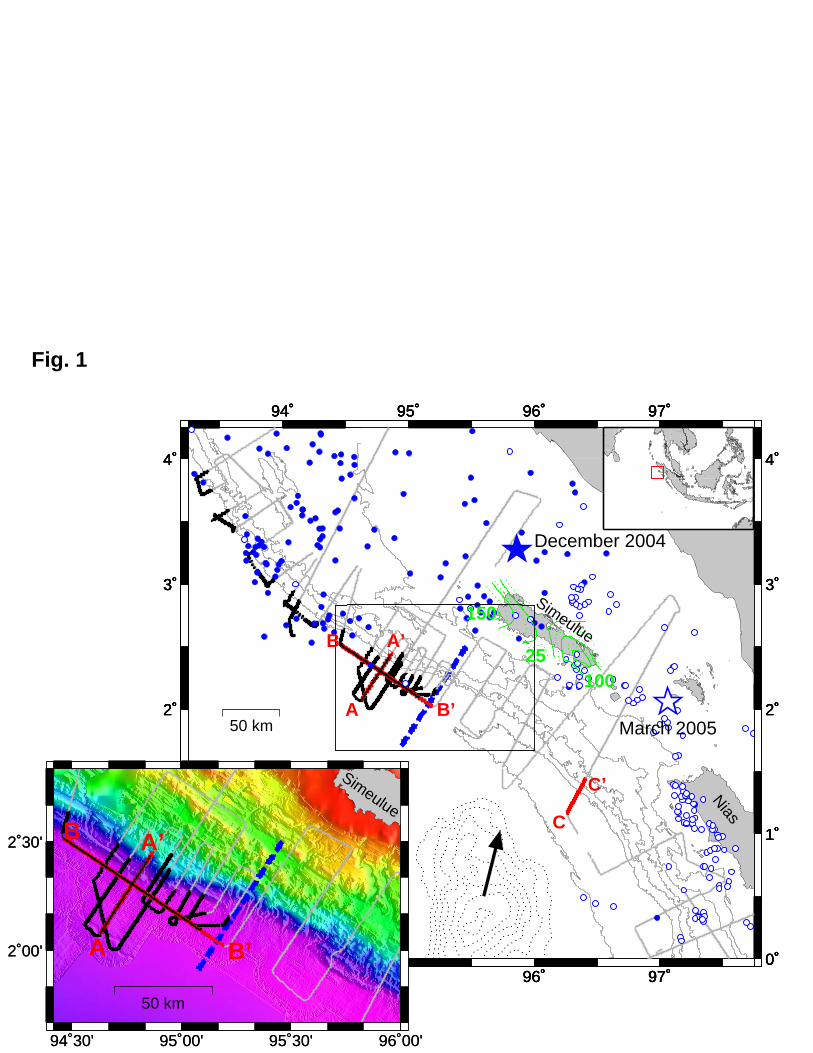
We collected 2500km of multichannel seismic reflection (MCS) profiles along the Sumatra 39
margin from northwest of Simeulue Island to Nias Island (Fig. 1; 13). Trench sediment 40
velocities above oceanic basement are high (~4km/s) north of the 2004-5 rupture boundary, 41
in contrast to equivalent sediments south of the rupture boundary (~3-3.5km/s; 13, Fig. S1). 42
North of the rupture boundary, a distinctive and regionally continuous high-amplitude 43
negative polarity (HA-NP) reflector lies near the base of this trench deep ocean sediment 44
section. We focus here on this reflector, which we believe represents the seaward extension 45
of the plate boundary décollement, and thus is a key control on plate boundary and prism 46
deformation along the Sumatran subduction zone. 47
48
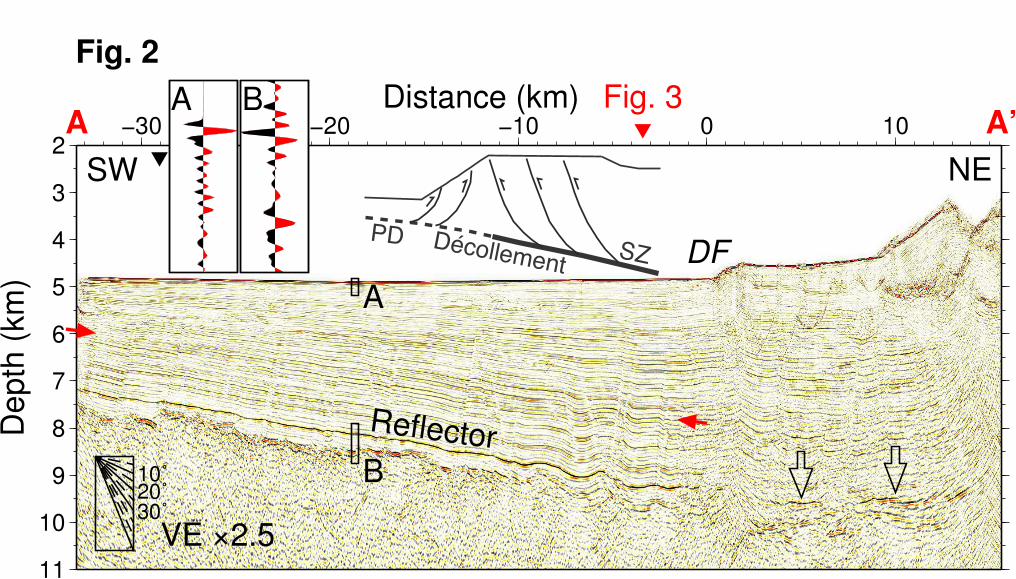
The reflector is identified in MCS profiles perpendicular (Fig. 2) and parallel (Fig. 3) to the 49
trench axis, typically ~0.5km above the top of the oceanic basement, within the ~4km/s 50
high velocity layer (13), and has consistent character in all profiles. Its amplitude is higher 51
than other sediment horizons more than 0.25km beneath the seabed, and is generally 52
4
stronger than the top oceanic basement reflector. The reflector’s waveform is similar to the 53
seabed and the seabed multiple (inset Fig. 2), and shows a clear negative polarity. The 54
reflector may represent either a discrete layer, thinner than the seismic wavelength 55
(<<100m) or a single interface between two units with contrasting seismic velocity and 56
density. Mean reflection coefficients of at least -0.1 for the reflector versus 0.32 for the 57
seabed (Table S1) indicate a major impedance decrease. We clearly image the reflector in 58
the trench to the seaward end of our profiles from 2°N to 4°N (Fig. 1), up to ~35km from 59
the deformation front. The reflector is less clearly imaged beneath the outer prism ~0.5km 60
above the top of oceanic basement (Fig. 2), up to ~20km landward from the deformation 61
front; the reflector has reduced amplitude and lateral continuity, possibly due to seismic 62
imaging compromised by steep bathymetry and overlying prism fault structure, but retains 63
negative polarity where observed. 64
65
The accretionary prism consists of fault-bounded blocks of relatively weakly deformed 66
sediment. The vertical thickness of these blocks suggests that almost the entire incoming 67
sediment section, to within ~500m of the top of the incoming plate, is accreted. We do not 68
image the precise contact between the reflector and major outer-prism thrust faults, but 69
these faults extend with ~45° dip from the seabed to at least 2km below the seafloor close 70
to the reflector (Fig. 2), and we expect them to intersect the HA-NP reflector (inset Fig. 2). 71
72
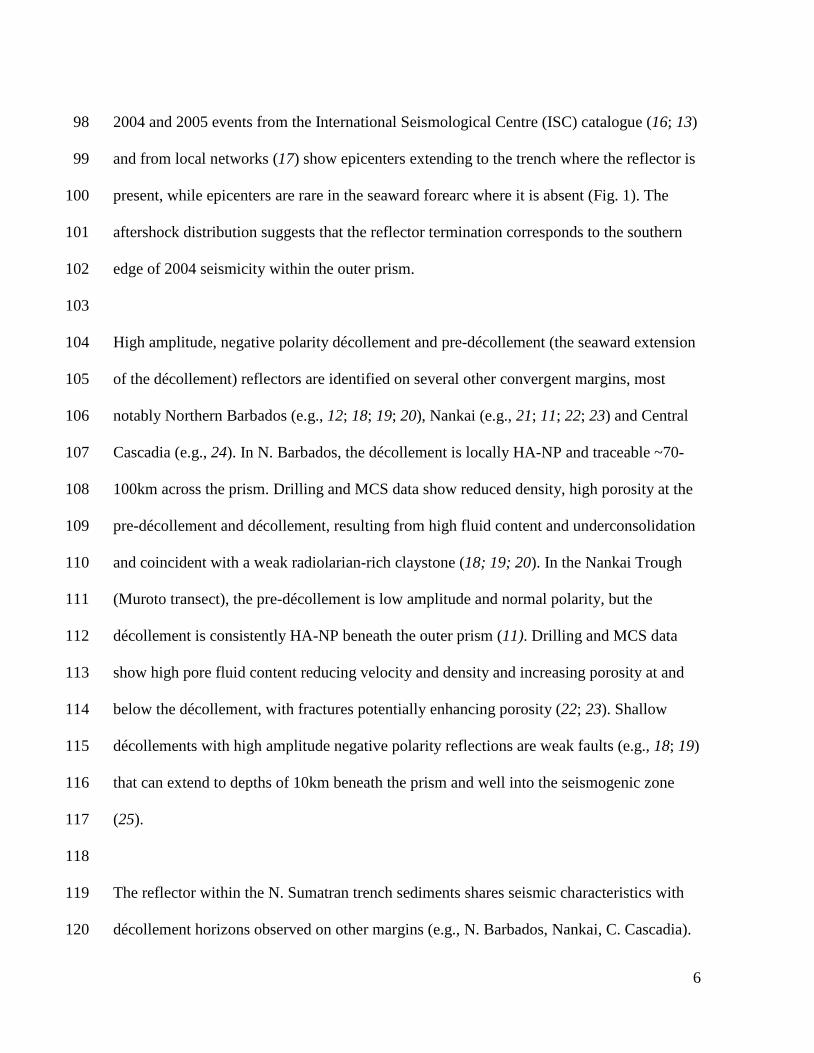
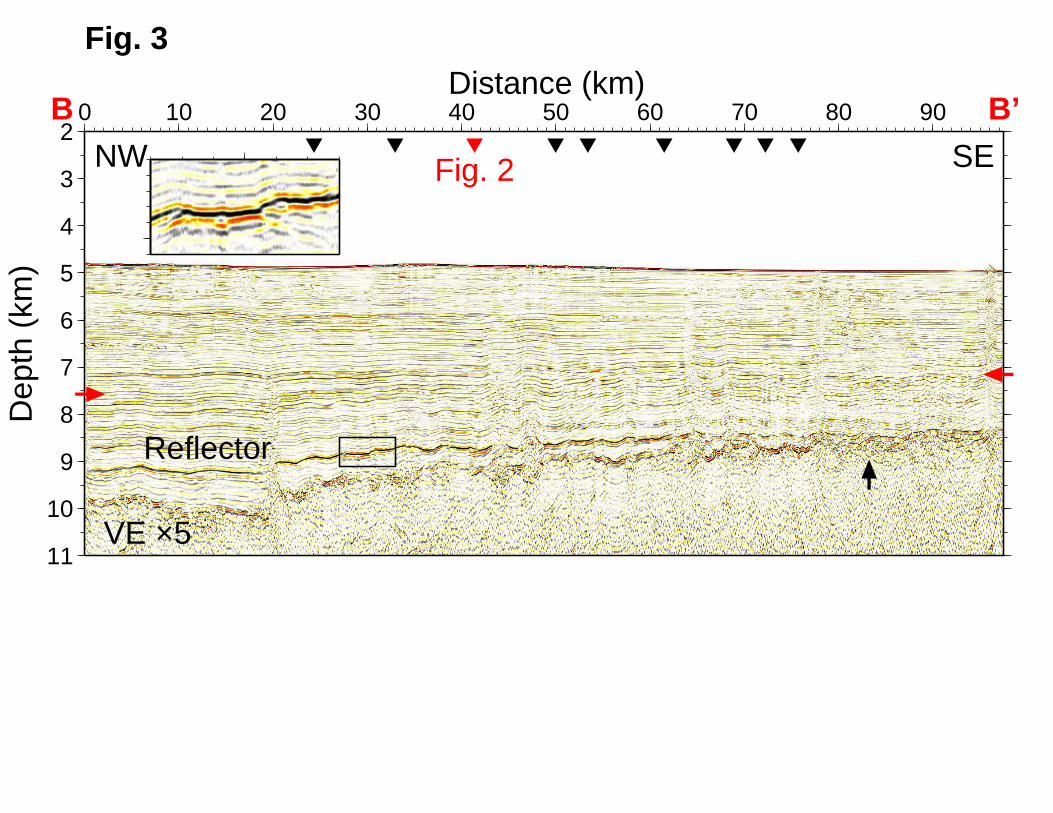
Offshore of Simeulue, the trench seabed deepens by ~0.1km over ~50km towards the 73
southeast, while the oceanic basement shallows by 1.75km (Fig. 3). The deep ocean 74
5
sediment layer thins and shallows over the rising basement with the basal ~0.75km of 75
sediments (including the reflector) terminating against basement. Southeast of ~1°30’N, at 76
the latitude of the 2005 rupture zone, the oceanic basement deepens again (e.g., Fig. 4) and 77
subduction angle beneath the trench increases (14). The incoming sediment thickness is 78
similar to the section just northwest of the basement high and stratigraphically we would 79
expect the base of the sediments to be close to the depth of the HA-NP reflector observed to 80
the northwest. However, no reflector with similar characteristics is observed and thus our 81
data tightly constrain the southward limit of the HA-NP reflector. Stratigraphy of the 82
deepest oceanic sediments seaward of Simeulue indicate that basement topography is pre-83
existing, probably related to an oceanic fracture zone (14). 84
85
The area where we observe the HA-NP reflector coincides with distinct accretionary prism 86
properties and seismogenic behavior implying links to both long- and short-term 87
deformation. The morphology and structure of the prism in this region are unusual: a steep 88
outer slope and broad plateau extend up to 150km from the trench to the outer edge of the 89
forearc basin (3). In contrast, the region to the southeast has a more uniform prism taper 90
and reduced prism width of 100km (15). The southeastern termination of the reflector, 91
close to the 2004-5 rupture boundary, also corresponds to a change in trend of the 92
deformation front. The outer prism northwest of this change has well-developed landward-93
vergent fold ridges up to 80km long (3) compared with 20-30km long mixed-vergence 94
folds to the southeast (15). Forearc islands are absent in the northwest even though free air 95
gravity values are as high at the outer prism as in locations to the southeast. Finally, the 96
aftershock distribution changes, consistent with the mainshock slip (1); aftershocks for the 97
6
2004 and 2005 events from the International Seismological Centre (ISC) catalogue (16; 13) 98
and from local networks (17) show epicenters extending to the trench where the reflector is 99
present, while epicenters are rare in the seaward forearc where it is absent (Fig. 1). The 100
aftershock distribution suggests that the reflector termination corresponds to the southern 101
edge of 2004 seismicity within the outer prism. 102
103
High amplitude, negative polarity décollement and pre-décollement (the seaward extension 104
of the décollement) reflectors are identified on several other convergent margins, most 105
notably Northern Barbados (e.g., 12; 18; 19; 20), Nankai (e.g., 21; 11; 22; 23) and Central 106
Cascadia (e.g., 24). In N. Barbados, the décollement is locally HA-NP and traceable ~70-107
100km across the prism. Drilling and MCS data show reduced density, high porosity at the 108
pre-décollement and décollement, resulting from high fluid content and underconsolidation 109
and coincident with a weak radiolarian-rich claystone (18; 19; 20). In the Nankai Trough 110
(Muroto transect), the pre-décollement is low amplitude and normal polarity, but the 111
décollement is consistently HA-NP beneath the outer prism (11). Drilling and MCS data 112
show high pore fluid content reducing velocity and density and increasing porosity at and 113
below the décollement, with fractures potentially enhancing porosity (22; 23). Shallow 114
décollements with high amplitude negative polarity reflections are weak faults (e.g., 18; 19) 115
that can extend to depths of 10km beneath the prism and well into the seismogenic zone 116
(25). 117
118
The reflector within the N. Sumatran trench sediments shares seismic characteristics with 119
décollement horizons observed on other margins (e.g., N. Barbados, Nankai, C. Cascadia). 120
7
We infer that the horizon offshore N. Sumatra is a zone of low density and elevated pore 121
pressure relative to overlying sediments. Such a layer, intrinsically weaker than 122
surrounding sediments, would therefore be the likely locus for initiating the décollement 123
fault, an interpretation consistent with the thickness of the frontally accreted sediment 124
package. We infer that the landward extension of this horizon ultimately influences prism 125
geometry and megathrust rupture. In N. Sumatra, the reflector has distinct properties up to 126
35km seaward of the deformation front, with a weaker negative polarity extension beneath 127
the prism, rather than a strong negative reflector beneath the prism, and a weaker, variable 128
polarity reflector seaward of the deformation front as observed on other margins. The 129
reflector properties seaward of the deformation front imply a lithological origin on the N. 130
Sumatra margin, rather than arising solely from structural or hydrogeological processes 131
within the prism. Three changes could explain contrasting observed reflector properties 132
southeast of the rupture boundary (Fig. 4): the stratigraphic section here post-dates the 133
particular horizon; an equivalent stratigraphic section is present but has different 134
lithologies; or the horizon properties differ due to combined differences in lithology and 135
forearc deformational and hydrogeological processes across the rupture boundary. The 136
deepest sediments in the northwest likely derive from the early Nicobar Fan (26) and the 137
observed contrast in properties may be a result of oceanic basement highs limiting 138
southward fan turbidite transport. 139
140
Multiple lines of evidence support interpretation of the distinct reflector as the pre-141
décollement/décollement on the N. Sumatran margin and we thus hypothesize that its 142
landward extension acts as the focus of plate boundary slip as the seismogenic décollement. 143
8
Given the coincident changes in structure, seismic velocity, and seismogenic behaviour, the 144
lithological and rheological properties of the lowermost sediments shown by the pre-145
décollement likely differ either side of the 2004-5 rupture boundary (Fig. 1) (2). 146
Similarities between the structure and dynamics of the 2005 rupture segment and many 147
other forearcs (e.g., 7) emphasize the atypical nature of the southern 2004 rupture segment. 148
Thus sediment properties may have a significant impact on earthquake rupture and 149
tsunamigenesis by influencing décollement behavior from the trench deep into the 150
seismogenic zone. 151
152
References and Notes 153
1. T. Lay et al., Science 308, 1127-1133 (2005). 154
2. R. W. Briggs et al., Science 311, 1897-1901 (2006). 155
3. T. J. Henstock, L. C. McNeill, D. R. Tappin, Geology 34, 485-488 (2006). 156
4. E. Araki et al., Earth Planets Space 58, 113-119 (2006). 157
5. J.-C. Sibuet et al., Earth Plan. Sci. Lett. 263, 88-103 (2007). 158
6. D.E. Byrne, D.M. Davis, L.R. Sykes, Tectonics, 7, 833-857 (1988). 159
7. R.E. Wells, R.J. Blakeley, Y. Sugiyama, D.W. Scholl, P.A. Dinterman, J. Geophys. 160
Res., 108, B10, 2507 (2003). 161
8. G. Plafker, J. Geophys. Res. 77, 901-925 (1972). 162
9. D. Davis, J. Suppe, F. A. Dahlen, J. Geophys. Res. 88, 1153-1172 (1983). 163
10. K. L. Wang, Y. Hu, J. Geophys. Res. 111, B06410 (2006). 164
11. N. L. Bangs et al., Geology 32, 273-276 (2004). 165
12. T. H. Shipley, G. F. Moore, N. L. Bangs, J. C. Moore, P. L. Stoffa, Geology 22, 166
411-414 (1994). 167
13. Materials and methods are available as supporting material on Science Online. 168
14. D. Franke et al., Earth Planet. Sci. Lett. 269, 118-130 (2008). 169
15. H. Kopp et al., Basin Res. 20, 519-529 (2008). 170
9
16. International Seismological Centre, On-line Bulletin, http://www.isc.ac.uk 171
(Internatl. Seis. Cent., Thatcham, United Kingdom, 2001). 172
17. F. Tilmann et al., Geophys. J. Int., doi :10.1111/j.1365-246X.2010.04597.x (2010). 173
18. N. L. Bangs, T. H. Shipley, J. C. Moore, G. F. Moore, J. Geophys. Res. 104, 20399-174
20414 (1999). 175
19. J. C. Moore et al., Geology 26, 811-814 (1998). 176
20. J. C. Moore et al., Proc. Ocean. Drill. Program Sci. Results 171A (2000). 177
21. G. F. Moore, T. H. Shipley, Proc. Ocean. Drill. Program Sci. Results 131, 73-82 178
(1993). 179
22. H. Mikada et al., Proc. Ocean. Drill. Program Init. Repts. 196 (2002). 180
23. G. F. Moore, H. Mikada, J. C. Moore, K. Becker, A. Taira, Proc. Ocean. Drill. 181
Program Sci. Results 190/196, 1-26 (2005). 182
24. G. R. Cochrane, J. C. Moore, M. E. MacKay, G. F. Moore, J. Geophys. Res. 99, 183
7033-7043 (1994). 184
25. N. L. Bangs et al., Earth Plan. Sci. Lett. 284, 44-49 (2009). 185
26. J. R. Curray, F. J. Emmel, D. G. Moore, Mar. Petrol. Geol. 19, 1191-1223 (2003). 186
27. D. T. Sandwell, W. H. F. Smith, J. Geophys. Res. 114, B01411 (2009). 187
28. C. Vigny, et al., Nature 436, 201-206 (2005). 188
29. D. Graindorge et al., Earth Planet. Sci. Lett. 275, 201-210 (2008). 189
30. We thank the Master and crew of the F/S Sonne and all those involved in SO198-2 190
for their assistance and our partners BPPT, Jakarta for their logistical assistance. This work 191
was funded by NERC (NE/D004381/1) and NSF (OCE-0623165). 192
193
Figure Legends 194
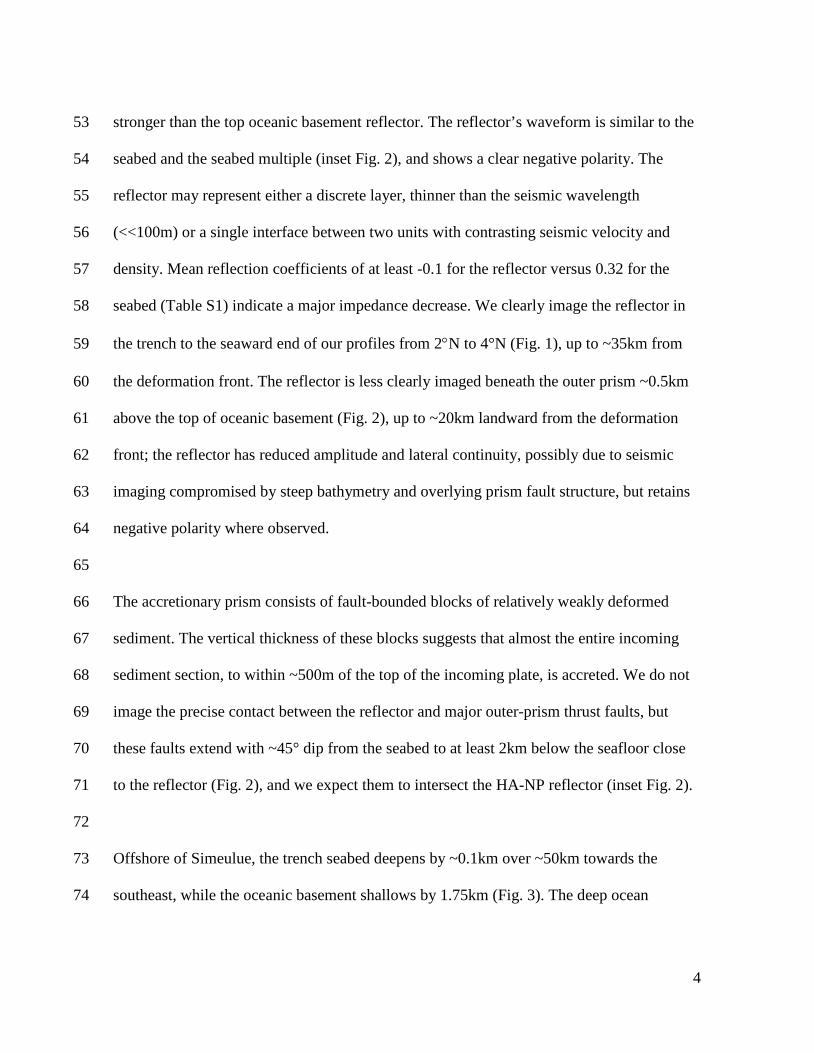
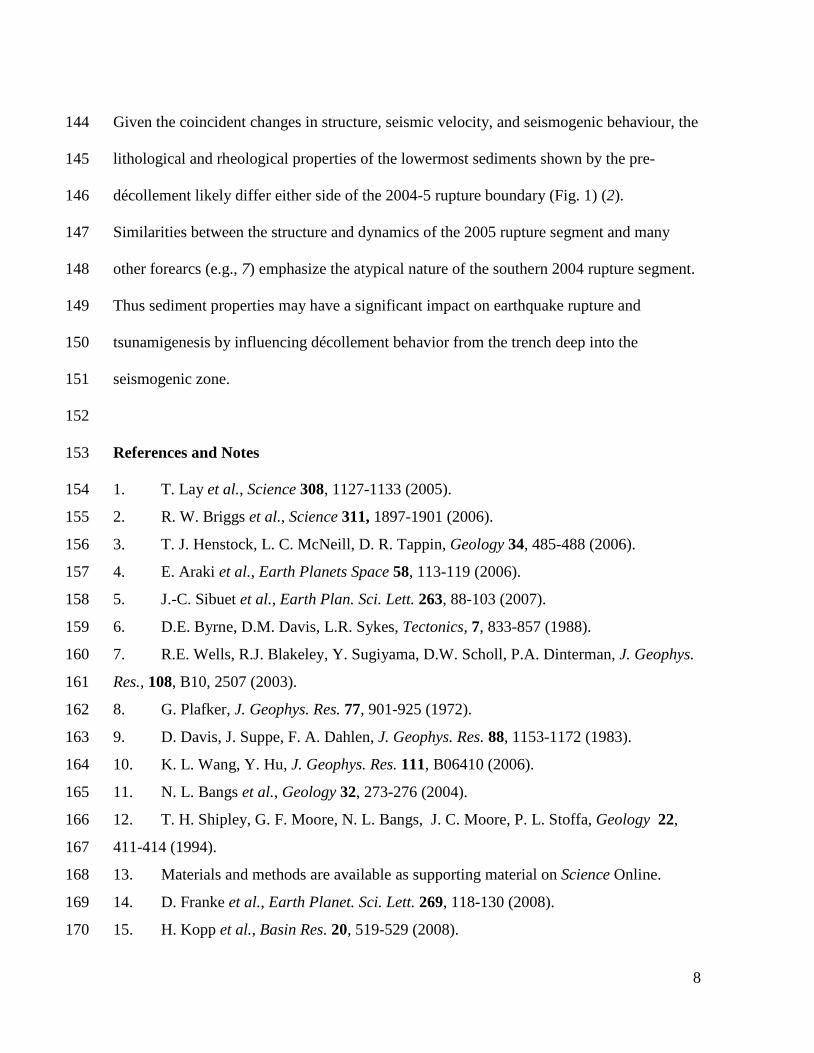
Fig. 1. Multichannel seismic profiles (grey lines) and study area. Blue circles: December 195
2004 (solid) and March 2005 (open) Sumatra ISC earthquakes (16) one month post 196
earthquake. Heavy black lines indicate seismic reflector observations; red lines locate Fig. 2 197
10
(A-A’), Fig. 3 (B-B’) and Fig. 4 (C-C’). Dashed blue line: change in aftershock distribution 198
and southeastern boundary of distinct reflector. Green contours: 2004-5 coseismic uplift 199
(cm) on Simeulue Island (2); thin black lines: 1000m bathymetry contours; dotted black 200
contours indicate oceanic fracture zone from satellite-derived gravity data (27); 201
convergence vector from (28). Inset: multibeam bathymetry data (3; 14; 29). 202
203
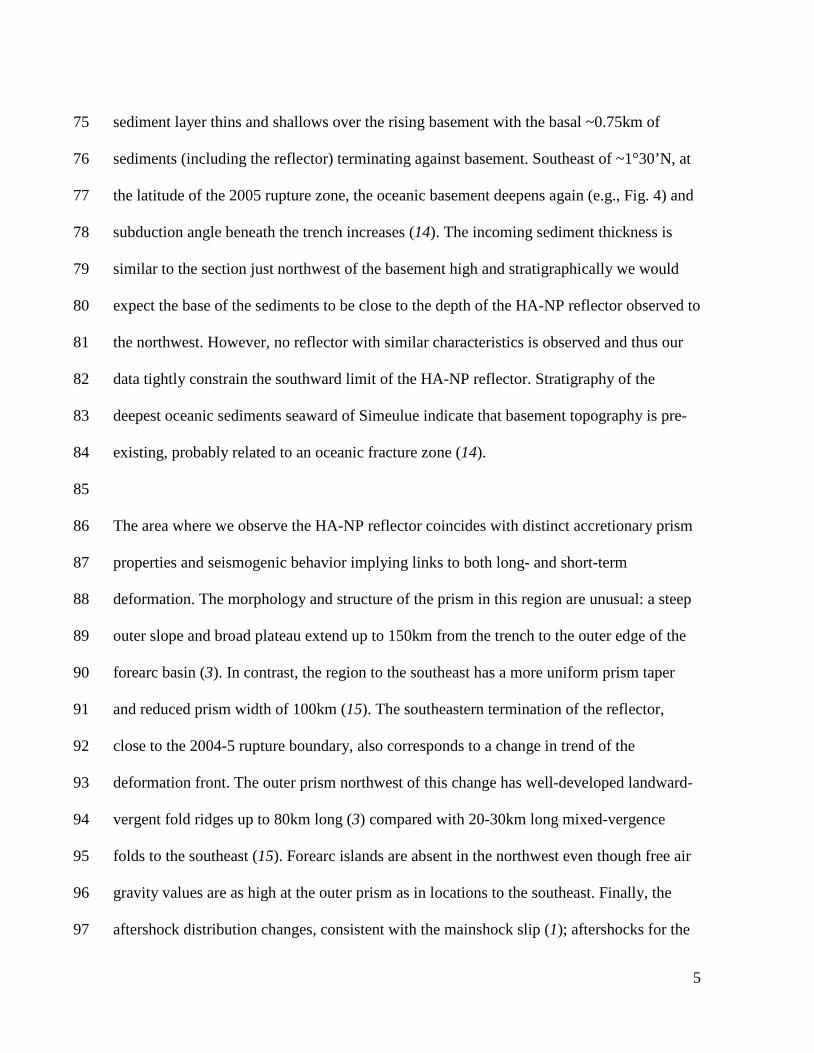
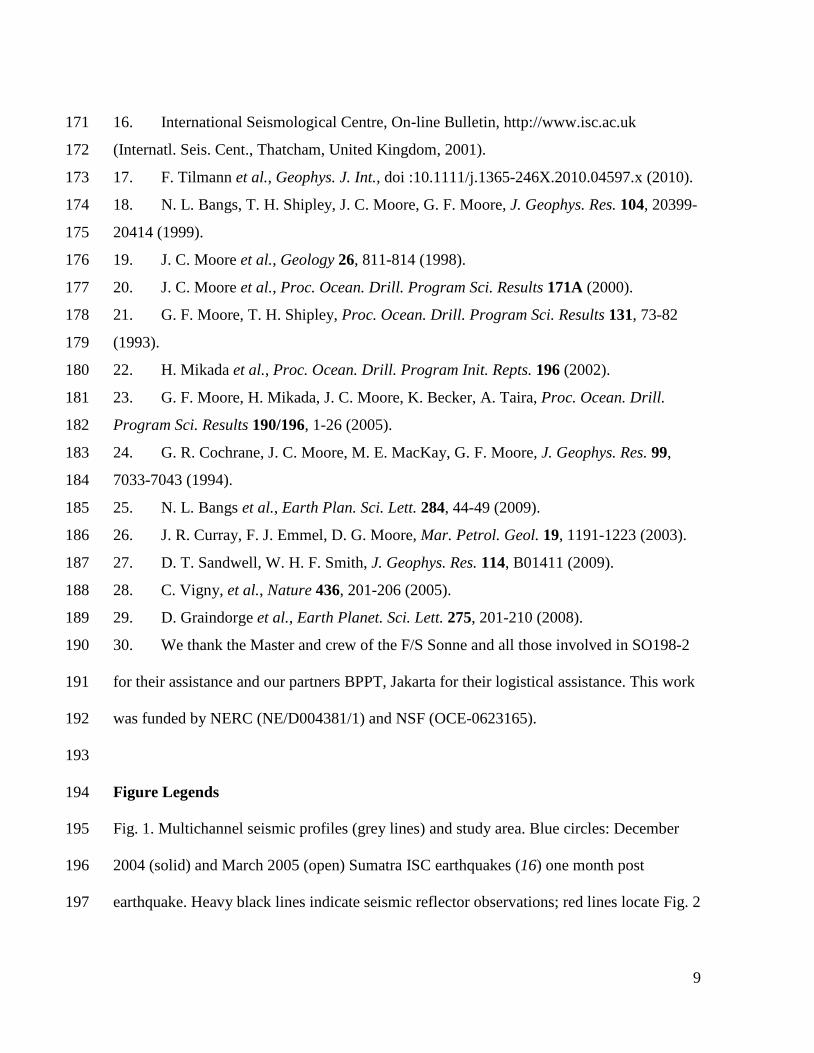
Fig. 2. Depth-migrated seismic profile A-A’ (distance from deformation front: DF). The 204
reflector continues from 7.25km depth in the southwest as a continuous negative polarity 205
event 0.2-0.5km above oceanic basement and discontinuously beneath outer prism (open 206
arrows). Red arrows: unconformity between trench fill and underlying deep ocean 207
sediment. Boxes show reflected waveforms: (A) seabed; (B) reflector (negative polarity); 208
top of oceanic basement near trace base (positive polarity); waveforms aligned at peak 209
amplitude. Inset shows schematic of prism structure and relationship to pre-décollement 210
(PD), décollement and seismogenic zone (SZ) northwest of 04-05 rupture boundary; 211
seismic sections shown represent outermost prism and oceanic plate. 212
213
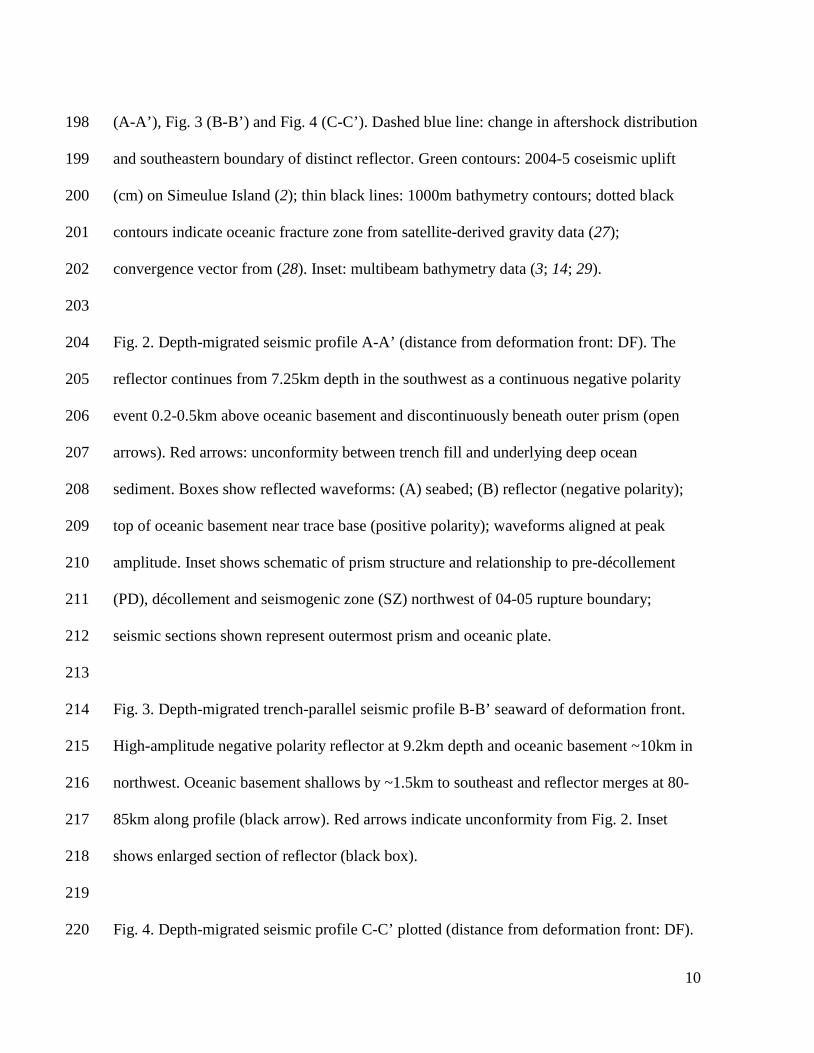
Fig. 3. Depth-migrated trench-parallel seismic profile B-B’ seaward of deformation front. 214
High-amplitude negative polarity reflector at 9.2km depth and oceanic basement ~10km in 215
northwest. Oceanic basement shallows by ~1.5km to southeast and reflector merges at 80-216
85km along profile (black arrow). Red arrows indicate unconformity from Fig. 2. Inset 217
shows enlarged section of reflector (black box). 218
219
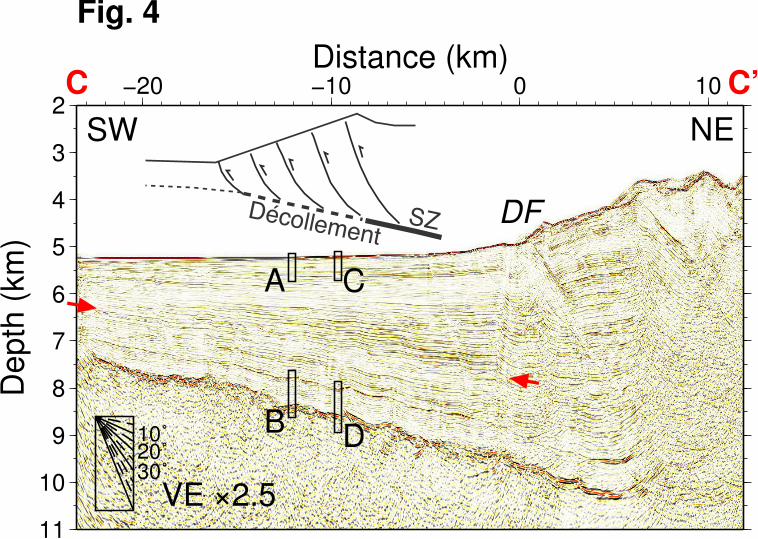
Fig. 4. Depth-migrated seismic profile C-C’ plotted (distance from deformation front: DF). 220
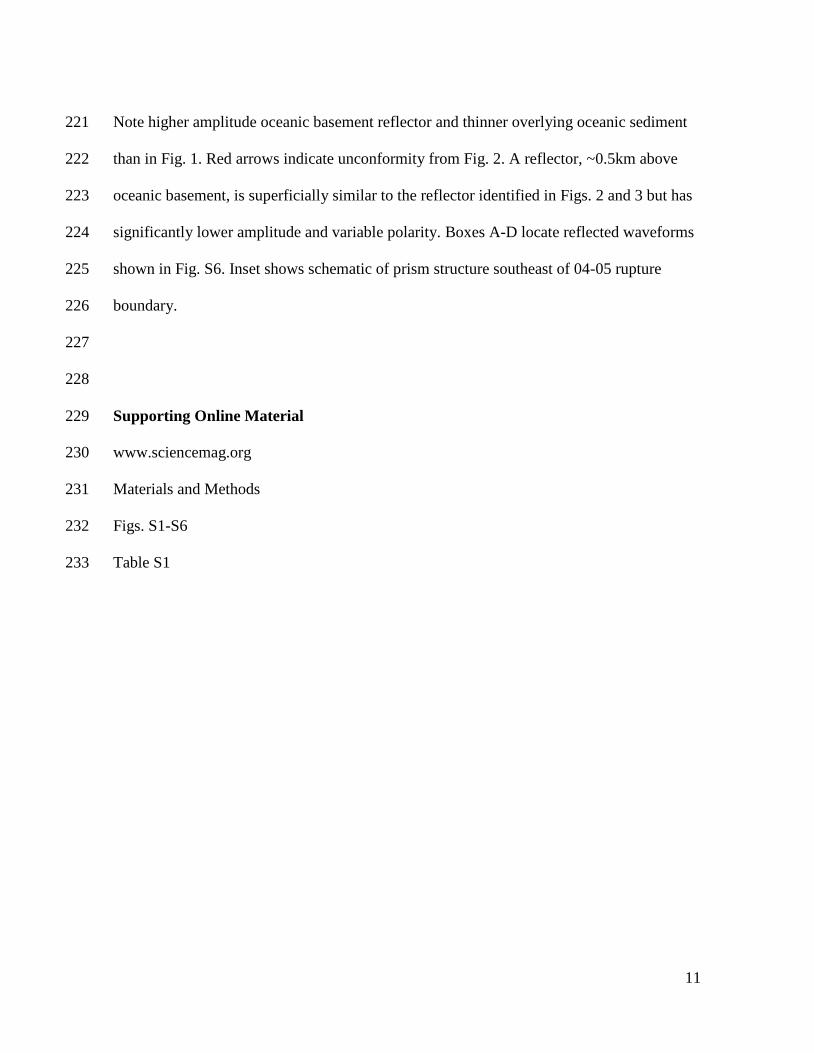
11
Note higher amplitude oceanic basement reflector and thinner overlying oceanic sediment 221
than in Fig. 1. Red arrows indicate unconformity from Fig. 2. A reflector, ~0.5km above 222
oceanic basement, is superficially similar to the reflector identified in Figs. 2 and 3 but has 223
significantly lower amplitude and variable polarity. Boxes A-D locate reflected waveforms 224
shown in Fig. S6. Inset shows schematic of prism structure southeast of 04-05 rupture 225
boundary. 226
227
228
Supporting Online Material 229
www.sciencemag.org 230
Materials and Methods 231
Figs. S1-S6 232
Table S1 233
94˚
94˚
95˚
95˚
96˚
96˚
97˚
97˚
0˚ 0˚
1˚ 1˚
2˚ 2˚
3˚ 3˚
4˚ 4˚
94˚
94˚
95˚
95˚
96˚
96˚
97˚
97˚
0˚ 0˚
1˚ 1˚
2˚ 2˚
3˚ 3˚
4˚ 4˚
94˚
94˚
95˚
95˚
96˚
96˚
97˚
97˚
0˚ 0˚
1˚ 1˚
2˚ 2˚
3˚ 3˚
4˚ 4˚
94˚
94˚
95˚
95˚
96˚
96˚
97˚
97˚
0˚ 0˚
1˚ 1˚
2˚ 2˚
3˚ 3˚
4˚ 4˚
50 kmA
A’B
B’
C
C’
25
150
100
December 2004
March 2005
Fig. 1
Simeulue
Nias
94˚30' 95˚00' 95˚30' 96˚00'
2˚00'
2˚30'
A
A’B
B’
94˚30' 95˚00' 95˚30' 96˚00'
2˚00'
2˚30'
50 km
Simeulue
B B’
Fig. 22
3
4
5
6
7
8
9
10
11
Dep
th (
km)
0 10 20 30 40 50 60 70 80 90
Fig. 3
NW SE
VE ×5
Reflector
Distance (km)