dear author, please, note that changes made to the … downloads/bikesharing.pdfmap showing the...
TRANSCRIPT

Dear Author, Please, note that changes made to the HTML content will be added to the article before publication, but are not reflected in this PDF. Note also that this file should not be used for submitting corrections.

Ridership and effectiveness of bikesharing: The effects of urbanfeatures and system characteristics on daily use and turnover rateof public bikes in China
Jinbao Zhao a,b,n, Wei Deng a, Yan Song bQ1
a School of Transportation, Southeast University, No. 2 Si-pai-lou, Nanjing 210096, Chinab Department of City and Regional Planning, University of North Carolina at Chapel Hill, Chapel Hill, NC 27599, United States
a r t i c l e i n f o
Keywords:BikesharingRidership analysisTurnover ratePersonal credit cardsUniversal cardsPartial least squares (PLS) regression
a b s t r a c t
As a pinnacle of green transportation with transit attributes, bikesharing has become particularly popularsince the mid-2000s. Two crucial questions for the success of bikesharing adoption are how many riderscan bikesharing attract, and what influences its effectiveness. To shed light on answers to these questions,this paper models the impacts of urban features and system characteristics on bikesharing daily use andturnover rate, using data constructed on 69 bikesharing systems in China. Prior to modeling, we provide anoverview of bikesharing adoption in China, describing why they have been adopted, how they havematured, and how they have expanded. Results from data regression and comparison indicate thatbikesharing ridership and turnover rate tend to increase with urban population, government expenditure,the number of bikesharing members and docking stations, whilst the number of public bikes showssignificant but adverse signs in impacting bikesharing ridership and turnover rate. Data comparison showsthat, to pursue an ideal bikesharing turnover rate in most Chinese cities, the bike-member (supply-demand) ratio should be better controlled within 0.2. Moreover, this study suggests that personal creditcards (allowing bikesharing members to pay “personal credit” rather than money if they do not returnpublic bikes within the free use hours) and universal cards (integrating bikesharing systems into otherurban transit systems through the use of a rechargeable smart card that can cover a range of payments andtrips) can significantly raise bikesharing daily use and turnover rate. We recommend that bikesharingoperators and transit agencies take the supply-demand thresholds and the adoption of personal creditcards and universal cards into consideration in the future bikesharing operation and development policy.
& 2014 Published by Elsevier Ltd.
1. Introduction
Serving as an alternative of urban transit systems, publicbikesharing has developed and spread into a new form of mobilityacross the globe since the mid-2000s (Parkes et al., 2013).Bikesharing is viewed as an economic, efficient, and healthy meansof navigating through dense urban environments (O’Brien et al.,2014), and it provides a variety of pickup and drop-off locations,enabling an on-demand, very low emission form of mobility(Parkes et al., 2013). Bikesharing users can access public bikes onan as-needed basis without the bearing costs of bike ownership(Shaheen et al., 2010). In addition, by integrating with publictransportation and other alternative modes, bikesharing provides
a low-carbon solution to the “last mile” challenge of urban transitsystems (Shaheen et al., 2010).
Whilst bikesharing is a relatively new form of transport inurban areas, adoption of this evolving transit model has becomeparticularly popular in recent years (Shaheen et al., 2010, 2013;O’Brien et al., 2014). There are more than 600 bikesharing systemscurrently operating worldwide (DeMaio and Meddin, 2014;Christensen and Shaheen, 2014; Hughes, 2014) and a growingnumber of cities are planning to launch bikesharing to increasebicycle use (García-Palomares et al., 2012). This growth is catchingincreasing attention in planning circles in its own right.
For bikesharing's early adoption and sustainable development,a crucial issue is the recognition of the factors affecting itsridership and effectiveness. A bikesharing system with few ridersand low turnover rate implies a poor investment economically,environmentally, and socially. A better understanding of factorsdriving its ridership and effectiveness can help inform futureadoption policy and improve the performance of existing systems.
123456789
101112131415161718192021222324252627282930313233343536373839404142434445464748495051525354555657585960616263646566
Contents lists available at ScienceDirect
journal homepage: www.elsevier.com/locate/tranpol
Transport Policy
http://dx.doi.org/10.1016/j.tranpol.2014.06.0080967-070X/& 2014 Published by Elsevier Ltd.
n Corresponding authorQ2 at: School of Transportation, Southeast University,No. 2 Si-pai-lou, Nanjing 210096, China.
E-mail address: [email protected] (J. Zhao).
Please cite this article as: Zhao, J., et al., Ridership and effectiveness of bikesharing: The effects of urban features and systemcharacteristics on daily use and.... Transport Policy (2014), http://dx.doi.org/10.1016/j.tranpol.2014.06.008i
Transport Policy ∎ (∎∎∎∎) ∎∎∎–∎∎∎

To shed light on this issue, in this study, we evaluate how urbanfeatures and system characteristics impact bikesharing ridership(daily use) and effectiveness (turnover rate), using data con-structed on 69 bikesharing systems in China. The remainder ofthis paper includes four additional sections. The following sectiongives an overview of recent research on bikesharing, in particular,the studies since the year of 2010. The bikesharing development inChina and the research design for this study are presented inSection 3. Section 4 describes the modeling results and findings.Finally, Section 5 concludes with policy implications of, anddevelopment revelations from, the ridership and effectivenessperspective.
2. Background
The first public-use bikesharing can be found in Amsterdam(the Netherlands) as far back as the late 1960s, with the introduc-tion of the famous “White Bicycles” system (Shaheen et al., 2010).It became widely recognized in the transportation communitywith the pioneering large-scale and third-generation bikesharingsystem – Velo’v – launched in Lyon in 2005 (DeMaio, 2009;Midgley, 2011). Since then, it is becoming increasingly popular intowns and cities around the world with the growing concernsabout global motorization and the externalities associated withdriving, such as traffic congestion and greenhouse gas emissions.
To date, the existing knowledge of bikesharing is relatively thinbut is growing rapidly with bikesharing's widespread expansion.Shaheen et al. (2010) analyzed the evolution of bikesharing aroundthe world. In that study, they discussed bikesharing businessmodels and lessons learned, highlighting the social and environ-mental benefits associated with bikesharing. They argued thatwhile bikesharing is growing worldwide and can help addressmany of the concerns about the global climate change, energysecurity, and unstable fuel prices, its future demand and long-termsustainability are still uncertain. More research is needed for abetter understanding of bikesharing's effects, operations, andbusiness models in light of its reported growth and benefits(Shaheen et al., 2010).
Interest in bikesharing research has become particularly popularsince the important Shaheen et al. (2010) study. Two years later,Shaheen et al. (2012) released a key report on bikesharing usagedata and user feedback from detailed interviews with governmentalagencies and bikesharing users in the United States and Canada.Based on the user survey (completed in Montreal, Toronto, Washing-ton DC and the twin cities) with a decent sample size (n¼10,661),Shaheen et al. (2012) found that the most common bikesharing trippurpose is work- or school-related (50–56% in the two Canadiancities and about 38% in the two American cities). Respondents in allcities indicated that they increased bicycling, whist most of themindicated that they drive less, as a result of bikesharing. Moreover, amajority of respondents reported getting more exercise sincebecoming a user of bikesharing. At the same time, there is evidencefrom Shaheen et al. (2012) that public bikesharing is improvingurban travel connectivity, reducing driving and thus loweringvehicle emissions.
Because of these benefits, in recent years many cities round theworld show enthusiasms in bikesharing adoption. To explore theadoption patterns of bikesharing systems, Parkes et al. (2013)provided an analysis on the diffusion of public bikesharingsystems in Europe and North America. They concluded that“Europe is still in a major adoption process with new systemsemerging and growth in some existing systems”, while “in NorthAmerica, the adoption process is at an earlier stage and is gainingmomentum”. They declared that the notable and successfulsystems in Paris, Lyon, Montreal, and Washington DC have sparked
great interest in bikesharing in Europe and North America, yet oneof the most potential markets for bikesharing – Asia – was missedin their study. Considering automobile in most Asian developingcountries, such as China, is still less popular but shows a rapidgrowth trend in comparison with most of European and NorthAmerican countries, it is useful to outline the adoption patterns ofbikesharing in a developing context (such as China in this paper)to complement the research of Parkes et al. (2013).
A recent study by O'Brien et al. (2014) took a global view ofbikesharing characteristics by analyzing data from 38 systemslocated in Europe, the Middle East, Asia, Australasia and theAmericas. Through the analysis of the variation of occupancy ratesover time and comparison across the system's extent, O'Brien et al.(2014) proposed a classification of bikesharing systems, based onthe geographical footprint and diurnal, day-of-week and spatialvariations in occupancy rates, which laid foundations for theanalysis of larger scale bikesharing systems.
Researchers also conducted bikesharing studies at the urbanlevel rather than global view. For example, Jensen et al. (2010)analyzed 11.6 million journeys of the Vélo'v in Lyon, constructing amap showing the likely flows of the bicycles across the city. Lathiaet al. (2012) assessed the impacts of the “open policy” (that allowscasual users to use shared bikes with a debit or credit card) of theLondon shared bicycle scheme, finding that open-access to thesystem correlating with greater usages. García-Palomares et al.(2012) proposed a GIS-based method to calculate the spatialdistribution of the potential demand for bikesharing trips inMadrid, locating stations using location–allocation models, whichis of great use for managing the redistribution of bicycles amongthe stations. Jäppinen et al. (2013) modeled the potential effectof shared bicycles on public transport travel times in GreaterHelsinki. They found that the adoption of bikesharing can reducepublic transportation travel times in the study area, on average bymore than 10%.
Recent bikesharing research is also found, for example, inKaltenbrunner et al. (2010), Lin and Yang (2011), and Chemlaet al. (2012). These studies addressed bikesharing's issues formdifferent concerns, such as prediction of available public bikes(Kaltenbrunner et al., 2010), bikesharing planning strategic (Linand Yang, 2011), and system rebalancing (Chemla et al., 2012;Raviv et al., 2013; Nair and Miller-Hooks, 2014). Regarding one ofthe most crucial issues as mentioned as the ridership and effec-tiveness analysis, related studies are quite few but can also befound. Particularly, a recent ITDP report by Gauthier et al. (2013)gave a global analysis that looks at scale and success factorsdriving bikesharing development. In their report, Gauthier et al.(2013) argued that turnover is critical to a successful bikesharingsystem, which is ideal to be four to eight daily uses per bike. Goodstation locations and sufficient station coverage are critical toensuring that the system will have high usage and turnover.Generally, a quality system needs 10–16 stations for every squarekilometer (approximately 300 m between stations). In addition,there should be 10–30 bikes available for every 1000 residentswithin the coverage area. A recent presentation by Hughes (2014)further confirmed these useful findings.
The increasing trend in bikesharing research in recent yearsindicates a bikesharing boom is taking place. As a continuation forand complement of these published materials, we make an effortto model and analyze the effects of urban population, governmentexpenditure, bikesharing demand (the number of bikesharingmembers) and supply (the number of docking stations and publicbikes), and operation policy (using personal credit cards or not,providing 24 h service or not, adopting universal cards or not) onbikesharing daily use and turnover rate. The empirical analysis isbased on available data from 69 bikesharing systems in China, oneof the fastest growing markets for bikesharing across the globe.
123456789
101112131415161718192021222324252627282930313233343536373839404142434445464748495051525354555657585960616263646566
J. Zhao et al. / Transport Policy ∎ (∎∎∎∎) ∎∎∎–∎∎∎2
Please cite this article as: Zhao, J., et al., Ridership and effectiveness of bikesharing: The effects of urban features and systemcharacteristics on daily use and.... Transport Policy (2014), http://dx.doi.org/10.1016/j.tranpol.2014.06.008i
3. Research context and design
3.1. Research context
China, once well-known as the “Kingdom of Bicycles” in the1970s, is now suffering the externalities associated with rapidmotorization, whereas in and Western Europe and North America,a shift towards bicycling is occurring. From 2000 to 2012,the private autos in China increased by more than 10 times from6.25–88.38 million (National Bureau of Statistics of China, 2013).The increasing trend will continue in the near foreseeable future.To address the challenges caused by the ongoing motorization andurbanization, such as traffic congestion and air pollution, China'surban planners and decision-makers have gradually shifted theiremphasis from providing additional road space for driving toexamining the need for more sustainable transportation strategies.In China, “Transit Priority” that allows public transportation tobe a more attractive and viable option for commuters has beenproposed as a national strategy to relieve people's increasingreliance on automobiles (State Council, 2012).
As an implementation of this strategy, local governments haveadopted various policies in supporting public transport. Particu-larly, in recent years interest in initiating, leading and fundingpublic bikes1 has spread across the country, from the capitalBeijing to a small countryside Yonglian located at Zhangjiagang.
In fact, as early as May 2008, the city of Hangzhou launched thefirst information technology-based public bikesharing program inChina, which was fully found by local governments and operatedby a government-owned company – the Hangzhou Public BicycleOperation Management Corporation. Upon its launch, users coulduse their citizen cards or transit smart cards to register intobikesharing system. After putting down a deposit (200 RBM2 atthat time) on their cards, they could rent a public bike from abikesharing station. The first hour of use is free; this is followed byincremental pricing where users pay an additional 1 RMB for thesecond hour, 2 RMB for the third hour, and 3 RMB after that. If thebike is not returned or lost, the user loses the deposit (HangzhouPublic Bicycle, 2013).
One of the bright spots of Hangzhou bikesharing is that itsbikesharing system is integrated into other public transportsystems through the use of citizen cards or transit smart cards(this policy will be referred as the adoption of “universal cards” inthe following discussion) that can cover a range of payments andtrips. However, most of Hangzhou's bikesharing stations do notprovide 24 h service except the 84 bikesharing stations (about2.8% of the 2962 docking stations as the end of 2012) that locatealong its two rail transit lines (Hangzhou Public Bicycle, 2014).After nearly 6 years' development, the Hangzhou Public BicycleSystem has surpassed Vélib' as one of the most famous bikeshar-ing programs in the world (Shaheen et al., 2011). As of December2012, the service operated 69,750 bicycles and 2962 fixed stations,with an average daily use of 25.76 ten thousand and a free chargerate of 96% (Hangzhou Public Bicycle, 2013).
Another pioneer in developing bikesharing in China is the cityof Wuhan. Only 6 months after Hangzhou, Wuhan launched itsfirst bikesharing program in November 2008, with 1000 publicbikes at that time. But different from Hangzhou's “government-
arranging” model, Wuhan adopted a “government-leading andprivate-participating” model. Wuhan governments also subsidizebikesharing but partially. They encourage private companies tooperate bikesharing and grant their right of advertising. In addi-tion, unlike the application approach for a bikesharing card inHangzhou, citizens in Wuhan could use their local ID (ResidentIdentity Cards, student cards, etc.) to apply for a “personal creditcard”3 to register into the system. Bikesharing members did notneed to put down a deposit on their personal credit cards at theearly adoption. This “zero-cost” policy evoked a member boom inWuhan, but also caused some challenges. For example, as of July2011, the number of personal credit card holders was about1 million, whilst the number of public bikes was less than 0.05million (Cui, 2011). Many members could not rent a bike, inparticular, during peak hours. To address this, Wuhan's bikeshar-ing operators adopted the Hangzhou model since July 2011. Whilstthis policy transformation relieved the tight supply of public bikes,yet lead to a long depression of bikesharing use in Wuhan.
However, some cities, including Shanghai, Chengdu, andSuzhou, still use personal credit cards yet improve this policyfrom several aspects: (1) members need to put down a deposit ontheir cards, (2) members should return public bikes within 1 h (incomparison with 4 h upon the launch of the bikesharing programin Wuhan) and if not, (3) users are penalized 5–10 personal creditpoints (in comparison with only 1 RMB for universal card holders).Personal credit cards play a role in encouraging residents to applya bikesharing card and use public bikes, this policy, however,needs stronger financial support from local governments.
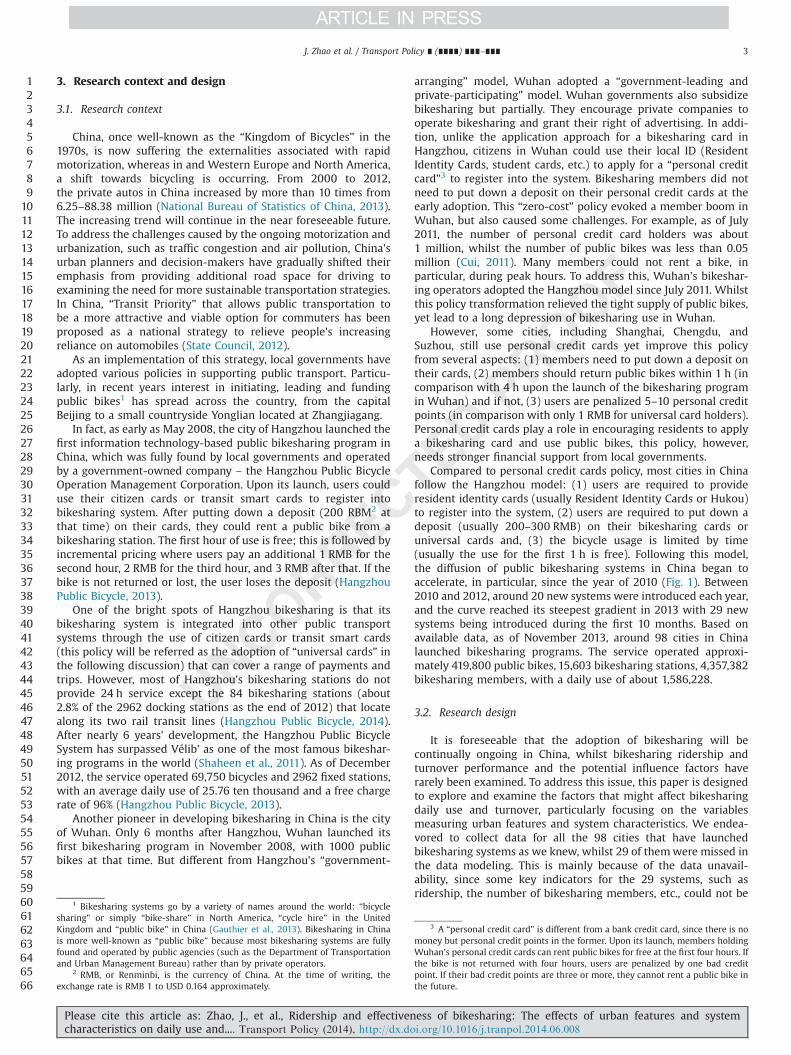
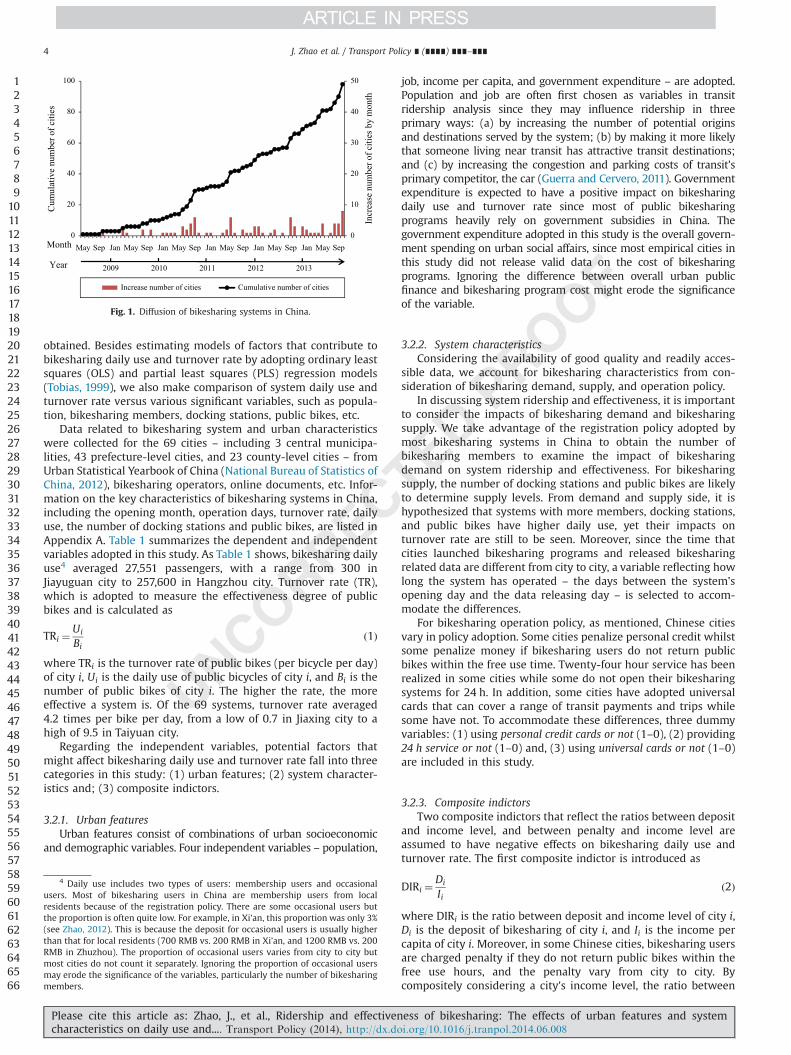
Compared to personal credit cards policy, most cities in Chinafollow the Hangzhou model: (1) users are required to provideresident identity cards (usually Resident Identity Cards or Hukou)to register into the system, (2) users are required to put down adeposit (usually 200–300 RMB) on their bikesharing cards oruniversal cards and, (3) the bicycle usage is limited by time(usually the use for the first 1 h is free). Following this model,the diffusion of public bikesharing systems in China began toaccelerate, in particular, since the year of 2010 (Fig. 1). Between2010 and 2012, around 20 new systems were introduced each year,and the curve reached its steepest gradient in 2013 with 29 newsystems being introduced during the first 10 months. Based onavailable data, as of November 2013, around 98 cities in Chinalaunched bikesharing programs. The service operated approxi-mately 419,800 public bikes, 15,603 bikesharing stations, 4,357,382bikesharing members, with a daily use of about 1,586,228.
3.2. Research design
It is foreseeable that the adoption of bikesharing will becontinually ongoing in China, whilst bikesharing ridership andturnover performance and the potential influence factors haverarely been examined. To address this issue, this paper is designedto explore and examine the factors that might affect bikesharingdaily use and turnover, particularly focusing on the variablesmeasuring urban features and system characteristics. We endea-vored to collect data for all the 98 cities that have launchedbikesharing systems as we knew, whilst 29 of themwere missed inthe data modeling. This is mainly because of the data unavail-ability, since some key indicators for the 29 systems, such asridership, the number of bikesharing members, etc., could not be
123456789
101112131415161718192021222324252627282930313233343536373839404142434445464748495051525354555657585960616263646566
1 Bikesharing systems go by a variety of names around the world: “bicyclesharing” or simply “bike-share” in North America, “cycle hire” in the UnitedKingdom and “public bike” in China (Gauthier et al., 2013). Bikesharing in Chinais more well-known as “public bike” because most bikesharing systems are fullyfound and operated by public agencies (such as the Department of Transportationand Urban Management Bureau) rather than by private operators.
2 RMB, or Renminbi, is the currency of China. At the time of writing, theexchange rate is RMB 1 to USD 0.164 approximately.
3 A “personal credit card” is different from a bank credit card, since there is nomoney but personal credit points in the former. Upon its launch, members holdingWuhan's personal credit cards can rent public bikes for free at the first four hours. Ifthe bike is not returned with four hours, users are penalized by one bad creditpoint. If their bad credit points are three or more, they cannot rent a public bike inthe future.
J. Zhao et al. / Transport Policy ∎ (∎∎∎∎) ∎∎∎–∎∎∎ 3
Please cite this article as: Zhao, J., et al., Ridership and effectiveness of bikesharing: The effects of urban features and systemcharacteristics on daily use and.... Transport Policy (2014), http://dx.doi.org/10.1016/j.tranpol.2014.06.008i
obtained. Besides estimating models of factors that contribute tobikesharing daily use and turnover rate by adopting ordinary leastsquares (OLS) and partial least squares (PLS) regression models(Tobias, 1999), we also make comparison of system daily use andturnover rate versus various significant variables, such as popula-tion, bikesharing members, docking stations, public bikes, etc.
Data related to bikesharing system and urban characteristicswere collected for the 69 cities – including 3 central municipa-lities, 43 prefecture-level cities, and 23 county-level cities – fromUrban Statistical Yearbook of China (National Bureau of Statistics ofChina, 2012), bikesharing operators, online documents, etc. Infor-mation on the key characteristics of bikesharing systems in China,including the opening month, operation days, turnover rate, dailyuse, the number of docking stations and public bikes, are listed inAppendix A. Table 1 summarizes the dependent and independentvariables adopted in this study. As Table 1 shows, bikesharing dailyuse4 averaged 27,551 passengers, with a range from 300 inJiayuguan city to 257,600 in Hangzhou city. Turnover rate (TR),which is adopted to measure the effectiveness degree of publicbikes and is calculated as
TRi ¼Ui
Bið1Þ
where TRi is the turnover rate of public bikes (per bicycle per day)of city i, Ui is the daily use of public bicycles of city i, and Bi is thenumber of public bikes of city i. The higher the rate, the moreeffective a system is. Of the 69 systems, turnover rate averaged4.2 times per bike per day, from a low of 0.7 in Jiaxing city to ahigh of 9.5 in Taiyuan city.
Regarding the independent variables, potential factors thatmight affect bikesharing daily use and turnover rate fall into threecategories in this study: (1) urban features; (2) system character-istics and; (3) composite indictors.
3.2.1. Urban featuresUrban features consist of combinations of urban socioeconomic
and demographic variables. Four independent variables – population,
job, income per capita, and government expenditure – are adopted.Population and job are often first chosen as variables in transitridership analysis since they may influence ridership in threeprimary ways: (a) by increasing the number of potential originsand destinations served by the system; (b) by making it more likelythat someone living near transit has attractive transit destinations;and (c) by increasing the congestion and parking costs of transit'sprimary competitor, the car (Guerra and Cervero, 2011). Governmentexpenditure is expected to have a positive impact on bikesharingdaily use and turnover rate since most of public bikesharingprograms heavily rely on government subsidies in China. Thegovernment expenditure adopted in this study is the overall govern-ment spending on urban social affairs, since most empirical cities inthis study did not release valid data on the cost of bikesharingprograms. Ignoring the difference between overall urban publicfinance and bikesharing program cost might erode the significanceof the variable.
3.2.2. System characteristicsConsidering the availability of good quality and readily acces-
sible data, we account for bikesharing characteristics from con-sideration of bikesharing demand, supply, and operation policy.
In discussing system ridership and effectiveness, it is importantto consider the impacts of bikesharing demand and bikesharingsupply. We take advantage of the registration policy adopted bymost bikesharing systems in China to obtain the number ofbikesharing members to examine the impact of bikesharingdemand on system ridership and effectiveness. For bikesharingsupply, the number of docking stations and public bikes are likelyto determine supply levels. From demand and supply side, it ishypothesized that systems with more members, docking stations,and public bikes have higher daily use, yet their impacts onturnover rate are still to be seen. Moreover, since the time thatcities launched bikesharing programs and released bikesharingrelated data are different from city to city, a variable reflecting howlong the system has operated – the days between the system'sopening day and the data releasing day – is selected to accom-modate the differences.
For bikesharing operation policy, as mentioned, Chinese citiesvary in policy adoption. Some cities penalize personal credit whilstsome penalize money if bikesharing users do not return publicbikes within the free use time. Twenty-four hour service has beenrealized in some cities while some do not open their bikesharingsystems for 24 h. In addition, some cities have adopted universalcards that can cover a range of transit payments and trips whilesome have not. To accommodate these differences, three dummyvariables: (1) using personal credit cards or not (1–0), (2) providing24 h service or not (1–0) and, (3) using universal cards or not (1–0)are included in this study.
3.2.3. Composite indictorsTwo composite indictors that reflect the ratios between deposit
and income level, and between penalty and income level areassumed to have negative effects on bikesharing daily use andturnover rate. The first composite indictor is introduced as
DIRi ¼Di
Iið2Þ
where DIRi is the ratio between deposit and income level of city i,Di is the deposit of bikesharing of city i, and Ii is the income percapita of city i. Moreover, in some Chinese cities, bikesharing usersare charged penalty if they do not return public bikes within thefree use hours, and the penalty vary from city to city. Bycompositely considering a city's income level, the ratio between
123456789
101112131415161718192021222324252627282930313233343536373839404142434445464748495051525354555657585960616263646566
0
10
20
30
40
50
0
20
40
60
80
100
May Sep Jan May Sep Jan May Sep Jan May Sep Jan May Sep Jan May Sep
Increase number of cities Cumulative number of cities
2009 2011 20132010 2012Year
Month
Cum
ulat
ive
num
ber o
f citi
es
Incr
ease
num
ber o
f citi
es b
y m
onth
Fig. 1. Diffusion of bikesharing systems in China.
4 Daily use includes two types of users: membership users and occasionalusers. Most of bikesharing users in China are membership users from localresidents because of the registration policy. There are some occasional users butthe proportion is often quite low. For example, in Xi’an, this proportion was only 3%(see Zhao, 2012). This is because the deposit for occasional users is usually higherthan that for local residents (700 RMB vs. 200 RMB in Xi’an, and 1200 RMB vs. 200RMB in Zhuzhou). The proportion of occasional users varies from city to city butmost cities do not count it separately. Ignoring the proportion of occasional usersmay erode the significance of the variables, particularly the number of bikesharingmembers.
J. Zhao et al. / Transport Policy ∎ (∎∎∎∎) ∎∎∎–∎∎∎4
Please cite this article as: Zhao, J., et al., Ridership and effectiveness of bikesharing: The effects of urban features and systemcharacteristics on daily use and.... Transport Policy (2014), http://dx.doi.org/10.1016/j.tranpol.2014.06.008i

penalty fare and income level is introduced as
PIRi ¼Pi
Iið3Þ
where PIRi is the penalty fare-income level ratio of city i, Pi is thepenalty of bikesharing of city i, and Ii is the income per capita of city i.
3.2.4. Possible missing variablesThe present study missed several variables that may affect
bikesharing ridership and effectiveness. Neighborhood environ-ments, personal characteristics, and service attributes (rebalan-cing, maintenance, etc.) might influence bikesharing daily use andturnover rate significantly. However, due to data limitations, weare unable to separate out the various ways in which the selectedvariables affect bikesharing ridership and effectiveness. Eventhough, some useful findings can be drawn from data regressionand comparison.
4. Result analysis
Bikesharing daily use may vary as a function of urban socio-economic and demographic, system scale, and operation policy.Cities with more population and sufficient expenditure tend todrive bikesharing development and thus the daily use. Systemswith more members, public bikes, and stations may have higherridership. We first probe this hypothesis by adopting ordinary leastsquares (OLS) regression models. Prior to modeling, what can bepredictable is that some independent variables adopted in thisstudy are likely to be highly collinear. For example, the more thedocking stations, often the more the public bikes, and usuallythe more bikesharing members are. OLS can distinguish multi-collinearity by computing variables' variance inflation factors (VIF)and a general rule is that the VIF should not exceed 10 (Kutner et al.,2004). Multi-collinearity can also be tested by generating Pearsoncorrelation coefficients for all pairwise combinations and thedanger level for independent variables' multi-collinearity is 0.7(Clark and Hosking, 1986). Anyway, some independent variables
have to be omitted even they may have significant influence onbikesharing daily use and turnover rate. In this case, partial leastsquares (PLS) regression models, which is a useful tool for con-structing predictive models when the factors are many and highlycollinear (Tobias, 1999), are adopted by the authors to contrast themodeling results of OLS. A statistic summarizing the contribution avariable makes to the PLS model is the variable importance forprojection (VIP) and a value less than 0.8 is considered to be “small”for the VIP (Wold, 1994).
4.1. Results from daily use analysis
We first provide the daily use modeling results by adopting OLSand PLS models in Table 2. The first OLS model is initially appliedto the entire set of independent variables. Among the variables inthe first OLS model, variables with a VIF smaller than 10 are thenapplied to the second OLS model. The third model is established byusing PLS and is applied to the entire set of independent variables.
Table 2 confirms many previous expectations. It is firstly worthnoting that four independent variables, including jobs, governmentexpenditure, and the number of bikesharing members and publicbikes are highly correlated with one or more of the others. Afterexcluding these four variables, the VIFs of all the other independentvariable are smaller than 4 in the second OLSmodel, and four variablesare turned out to be significantly associated with bikesharing daily usein this model. It is found that bikesharing daily use tends to increasesignificantly with urban population and the number of dockingstations. All else being equal, the results imply an increase of 31bikesharing passengers for every 10 thousand population, and anincrease of 121 passengers for each docking station. Moreover, boththe adoptions of personal credit cards and universal cards tend toincrease bikesharing daily use significantly.
Modeling results from the second OLS model generally makesense, yet it dismisses some variables that might impact ridershipsignificantly. Indeed, we feel that government expenditure is exogen-ous to bikesharing daily use in China since bikesharing adoption anddevelopment heavily rely on government investments. In addition,from the demand and supply considerations, the number of
123456789
101112131415161718192021222324252627282930313233343536373839404142434445464748495051525354555657585960616263646566
Table 1Summary of variables.
Variables Mean SD Min Median Max Expected sign
Dependent variablesDaily usea 27,551 52,185 300 6000 257,600Turnover rate 4.2 2.1 0.7 4.0 9.5
Independent variablesUrban featuresb
Population (10 thousand) 164.8 240.4 9.8 101.8 1350.6 þJobs (10 thousand) 54.8 101.9 2.3 21.1 614.9 þIncome per capita (RMB) 43,882 9846 25,946 42,600 77,146 ?Government expenditure (million RMB)c 28,297 62,110 1218 10,106 381,695 þ
System characteristicsa
Number of members 70,368 163,899 500 12,064 986,000 þNumber of docking stations 196 351 7 82 2435 þNumber of public bikes 5883 12,019 150 2000 75,000 ?Operation days since the system opened 427 348 93 367 1560 ?Using personal credit cards or not (1–0) 0.16 0.37 0 0 1 þProviding 24 h service or not (1–0) 0.57 0.50 0 1 1 þUsing universal cards or not (1–0) 0.20 0.41 0 0 1 þ
Composite indictorsDeposit-income per capita ratio (10�3) 4.79 3.30 0 4.92 18.26 –
Penalty (after the first free use hours)-income per capita ratio (10�4) 0.19 0.10 0 0.22 0.38 –
a Data from various sources, including local bikesharing agencies, online documents, and websites (such as, http://www.hzsggzxc.com/ (Hangzhou Public Bicycle), http://www.bjysj.gov.cn/bjggzxc/ (Beijing Public Bicycle), http://zxc.gzzc.com.cn/ (Guangzhou Public Bicycle), etc.) to name very a few here.
b Data from China City Statistical Yearbook 2012 (National Bureau of Statistics of China, 2012).c Government expenditure on urban public affairs.
J. Zhao et al. / Transport Policy ∎ (∎∎∎∎) ∎∎∎–∎∎∎ 5
Please cite this article as: Zhao, J., et al., Ridership and effectiveness of bikesharing: The effects of urban features and systemcharacteristics on daily use and.... Transport Policy (2014), http://dx.doi.org/10.1016/j.tranpol.2014.06.008i

bikesharing members and public bikes can be significant factorsdetermining bikesharing use. All the three factors, however, areexcluded in the second OLS model because of multi-collinearity. PLSregression, therefore, is developed to extract these latent factors,which can account for as much of the manifest factor variation aspossible while modelling the responses well (Tobias, 1999).
As PLS modeling results show, in addition to the four significantvariables in the second OLS model, another three independentvariables have a VIP larger than 1.0: government expenditure, thenumber of bikesharing members, and the number of public bikes.These variables erode the coefficients of the four significantvariables in the second OLS model yet turn out to be importantvariables in generating bikesharing ridership.
Fig. 2 shows the comparisons of bikesharing daily use versusfive variables that affect bikesharing daily use significantly inTable 2. Whilst there is clearly variation among cities of bikeshar-ing daily use, the figure confirms most of the results in Table 2.Generally, bikesharing daily use tends to increase with a city'spopulation, government expenditure, bikesharing members, dock-ing stations, and public bikes. It is further noted that bikesharingdaily use tends to increase systematically with the number ofpublic bikes in the comparison analysis, with a linear R2 value of0.849. The regression results from Table 2 and the comparisons ofFig. 2 provide bikesharing operators and transit agencies directformulas to estimate bikesharing daily use roughly.
4.2. Results from turnover rate analysis
To find suitable formulas to model the influence of indepen-dent variables on bikesharing turnover rate, we first plot a range ofcities based on cluster analysis and comparisons between turnover
rate and the selected independent variables. By taking variousregressions, including linear regression, logarithm regression, andindex regression, we find the logarithm regression fits the com-parisons superiorly in comparison with other regression methods(Fig. 3), reflected by its relatively higher R2 values.
Fig. 3 shows the linear regression lines (cluster analysis) andlogarithm regression lines (scatter analysis) of the turnover rateson the variables measuring bikesharing demand (bikesharingmembers) and supply (docking stations and public bikes). Regard-ing single factor analysis, it is found that bikesharing turnover ratetends to increase with bikesharing members and docking stations,as well as public bikes. Whilst the results make sense, single factorcomparison does not consider other factors' impacts. By takinglogarithm of variables measuring urban features and bikesharingdemand and supply, we estimate the impacts of selected inde-pendent variables on bikesharing turnover rate, using a OLS modelby deleting invariables with a Pearson correlation coefficientlarger than 0.7 and again, using a PLS model that is applied tothe entire set of independent variables. The modeling results areshown in Table 3.
It is first noted that the four independent variables deleted inTable 3 by adopting Pearson correlation coefficient test are thesame as by using VIF of 10 as the cut off value in Table 2. Inaddition, we find that the dummy variable indicating a systemproviding 24 h service or not is significant to be associated withbikesharing turnover rate, whilst this variable does not turn out tobe related to bikesharing daily use significantly in Table 2.
By adopting the PLS model, more independent variablesare found to be important in explaining bikesharing turnover rate.The results indicate that population, government expenditure, thenumber of bikesharing members and docking stations, and the
123456789
101112131415161718192021222324252627282930313233343536373839404142434445464748495051525354555657585960616263646566
Table 2OLS and PLS regressionQ5 models of bikesharing daily use.
Variable OLS model with all variables OLS model with variables whoseVIF is smaller than 10.
PLS model
Coeff. p-value VIFa Coeff. p-value VIFa Coeff. B'b VIPc
(Constant) �13613.295 0.9018 0 �23365 0.4638 0 �15573.287 0Urban featuresPopulation (10 thousand) 33.697nn 0.0239 9.713 30.739nn 0.0160 2.611 23.644†† 0.101 1.109Jobs (10 thousand) �185.816 0.2272 14.656 41.667 0.081 0.639Income per capita (RMB) �0.129 0.7725 4.233 �0.110 0.7227 3.668 �0.066† �0.073 0.806Government expenditure (million RBM) 0. 291nn 0.0346 15.192 0.392†† 0.078 1.032
System characteristicsNumber of members 0.056 0.2489 13.951 0.064†† 0.202 1.845Number of docking stations 55.193nnn 0.0034 8.864 121.497nnn o0.0001 1.688 29.9614†† 0.201 1.852Number of public bikes 1.633nn 0.0209 15.025 0.889†† 0.204 1.868Operation days since the system opened 3.3164 0.6889 1.816 6.860 0.4667 1.657 8.456† 0.123 0.882Using personal credit cards or not (1–0) 10120.978nn 0.0238 6.255 16394.267nn 0.0142 3.370 12474.332†† 0.041 1.022Providing 24 h service or not (1–0) 2025.963 0.6678 1.212 3697.595 0.4939 1.121 3336.613 0.031 0.587Using universal cards or not (1–0) 12128.592nn 0.0532 1.301 19598.569nn 0.0295 1.227 14838.563†† 0.065 1.182
Composite indictorsDeposit-income per capita ratio (10�3) �287.473 0.9816 4.373 251.603 0.9780 1.716 �236.896 �0.015 0.281Penalty (after the first free use hours)-income per capita ratio (10�4) �1387.231 0.5834 8.625 �2109 0.5698 3.551 �5097.215 �0.050 0.298
Summary statisticsN 69 69 N 69R2 0.9084 0.8610 Prob PRESS 40.1Adj. R2 0.8868 0.8398
*Significant at the 0.1 level,a VIF: variance inflation factor.b B': standardized coefficient.c VIP: variable importance for projection.nn significant at the 0.05 level,nnn significant at the 0.01 level.† Variable with a VIP larger than 0.8 is not considered to be “small” for projection (Wold, 1994),†† variable with a VIP larger than 1.0.
J. Zhao et al. / Transport Policy ∎ (∎∎∎∎) ∎∎∎–∎∎∎6
Please cite this article as: Zhao, J., et al., Ridership and effectiveness of bikesharing: The effects of urban features and systemcharacteristics on daily use and.... Transport Policy (2014), http://dx.doi.org/10.1016/j.tranpol.2014.06.008i

three dummy variables are very important (VIP41.0) variables inpromoting bikesharing turnover rate. Whilst Fig. 3 shows thatbikesharing turnover rate tends to increase with the number ofpublic bikes, the PLS modeling results indicate that, all else beingequal, increasing public bikes tends to significantly lower bike-sharing turnover rate. This seems a paradox yet can be explainedby at least two reasons: First, according to the definition forturnover rate (Formula 1), the magnitude of turnover rate variesinversely with the number of public bikes. Second, the relationshipof turnover rate with the number of public bikes in Fig. 3 does notaccount for other independent variables, in particular, the numberof bikesharing members that reflects bikesharing demand. Underthe condition of all else being equal, particularly the potentialdemand equal, bikesharing turnover could decline with thenumber of public bikes. Moreover, the number of docking stationscarries important and positive impact on bikesharing turnoverrate. Its positive impact might be due to the fact that bikesharingmembers can pick-up and drop-off public bikes more conveniently
if more docking stations are installed, thus improve bikesharingturnover rate.
The significant but adverse signs of the number of public bikesin explaining bikesharing ridership and turnover rate carry animportant message to bikesharing operators and planners. Model-ing results from Table 2 indicate that bikesharing ridership tendsto increase with the number of public bikes, but the sameindependent variable turns out to be negatively associated withturnover rate. To pursue an ideal turnover rate (higher than fourdaily uses per bike as Gauthier et al. (2013) expected), the numberof public bikes should be neither too many nor too few, reflectingthe relationship between bikesharing demand and bikesharingsupply. Fig. 4 plots a range of cities based on a comparisonbetween their bike-member (supply-demand) ratio and bikeshar-ing turnover rate. Generally, turnover rate declines obviouslywhen the bike-member ratio is larger than 0.2. In other words, asystem with an ideal turnover rate needs at least 5 potential users(bikesharing members in China) for each public bike.
123456789
101112131415161718192021222324252627282930313233343536373839404142434445464748495051525354555657585960616263646566
y = 102.23x + 10705R² = 0.2219
0
50000
100000
150000
200000
250000
300000
0 500 1000 1500Population (10 thousand)
y = 0.3029x + 18980R² = 0.13
0
50000
100000
150000
200000
250000
300000
0 100000 200000 300000 400000 500000Government expenditure (million RMB)
y = 0.2958x + 6737.5R² = 0.863
0
50000
100000
150000
200000
250000
300000
0 500000 1000000 1500000 Bikesharing members
Bik
esha
ring
daily
use
y = 134.82x + 1155.7R² = 0.8244
0
50000
100000
150000
200000
250000
300000
0 500 1000 1500 2000 2500 3000Docking stations
y = 3.9997x + 4021R² = 0.8486
0
50000
100000
150000
200000
250000
300000
0 20000 40000 60000 80000 Public bikes
Fig. 2. Comparisons of bikesharing daily use versus urban population, government expenditure, bikesharing members, docking stations, and public bikes.
J. Zhao et al. / Transport Policy ∎ (∎∎∎∎) ∎∎∎–∎∎∎ 7
Please cite this article as: Zhao, J., et al., Ridership and effectiveness of bikesharing: The effects of urban features and systemcharacteristics on daily use and.... Transport Policy (2014), http://dx.doi.org/10.1016/j.tranpol.2014.06.008i

4.3. Bikesharing ridership and effectiveness by type
Table 4 presents the average daily use and turnover rate ofbikesharing systems, classed by using personal credit cards or not,providing 24 h service or not, and using universal cards or not. Theaverage daily use and turnover rate of the 11 bikesharing systemsby adopting personal credit cards are respectively 2.44 and 1.46times the daily use and turnover rate of the 58 systems bycharging penalty on bikesharing users if they do not return bikeswithin the free use hours. Compared to the systems withoutproviding 24 h service, the systems providing 24 h service have afewer daily use but a higher turnover rate. The effectiveness of thelater is 1.23 times higher that of the former. Averagely, systemsusing universal cards have more ridership and higher turnoverrate, which are respectively 2.59 and 1.27 times the systemswithout adopting universal cards. Whilst encouraging as theseresults are, the percentages of adopting these three innovations
are quite low in China. For example, only 15.9% (11 out of 69) citiesusing personal credit cards and only 20.3% (14 out of 69) citiesadopting universal cards.
We also develop models of bikesharing ridership and turnoverrate by type, particularly for the systems using personal creditcards, providing 24 h service, and adopting universal cards. Topreserve the observations to be sufficient for modeling, we did notclassify these three different systems into sub-types. For example,the systems using personal credit cards can further be classifiedinto providing 24 h service or not and adopting universal cards ornot. By doing this, however, the number of factors may be greaterthan the number of observations, which is likely to get a modelthat fits the sampled data perfectly but that will fail to predict newdata well (Tobias, 1999). Moreover, the modeling results by typeare compared to the modeling results of overall systems.
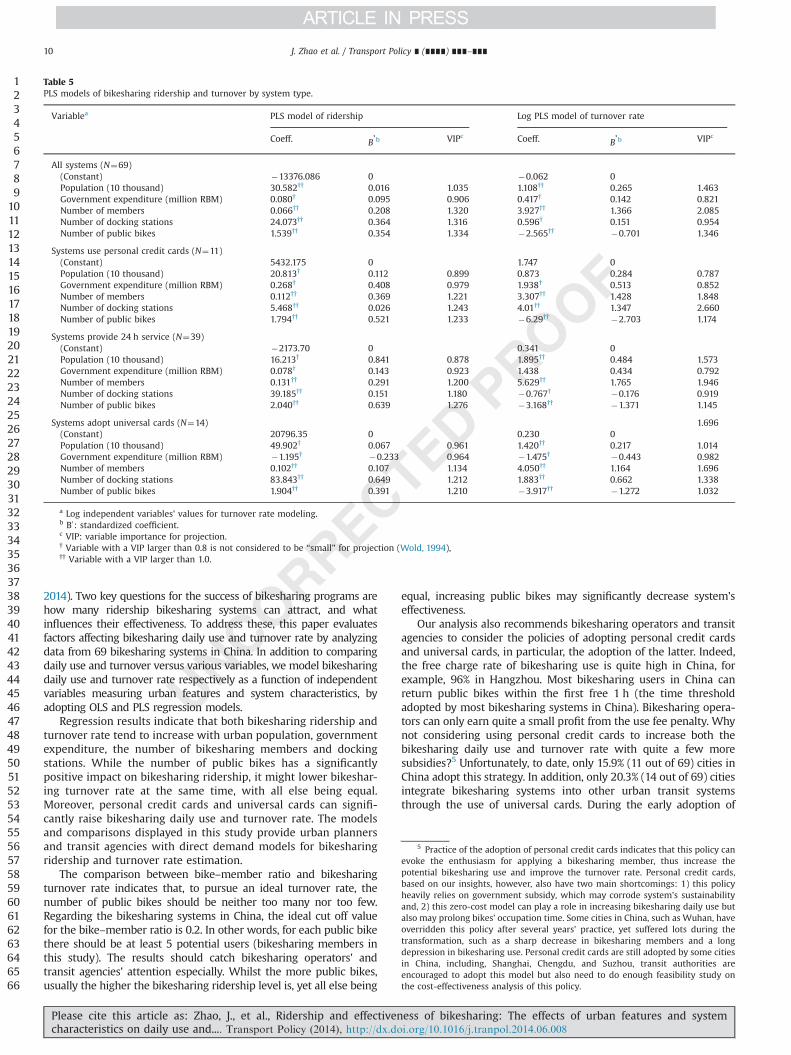
Table 5 presents the modeling results of the factor analysis.Whilst the coefficients vary obviously among different types of
123456789
101112131415161718192021222324252627282930313233343536373839404142434445464748495051525354555657585960616263646566
y = 0.8742x + 1.5309R² = 0.3007
0.00 1.00 2.00 3.00 4.00 5.00 6.00 7.00 8.00 9.00
10.00
0 1 2 3 4 5 6Number of memberships, grouped by
1 (<5000), 2(5000-10000), 3(10000-15), 4(20000>100000), 5 (>=100000)
y = 0.7114ln(x) - 2.7957R² = 0.2943
0.00 1.00 2.00 3.00 4.00 5.00 6.00 7.00 8.00 9.00
10.00
0 500000 1000000 1500000 Bikesharing members
y = 0.5242x + 2.847R² = 0.1157
0.00 1.00 2.00 3.00 4.00 5.00 6.00 7.00 8.00 9.00
10.00
0 1 2 3 4 5 6Number of docking stations, grouped by
1 (<50), 2(50-100), 3(100-200), 4(200-400), 5(>=400)
Tur
nove
r ra
te
y = 0.6091ln(x) + 1.4595R² = 0.1267
0.00 1.00 2.00 3.00 4.00 5.00 6.00 7.00 8.00 9.00
10.00
0 500 1000 1500 2000 2500 3000Docking stations
y = 0.4688x + 2.7716R² = 0.1114
0.00 1.00 2.00 3.00 4.00 5.00 6.00 7.00 8.00 9.00
10.00
0 1 2 3 4 5 6Public bikes, grouped by
1 (<750), 2(750-1500), 3(1500-3000), 4(3000-5000), 5 (>=5000)
y = 0.4852ln(x) + 0.4483R² = 0.0931
0.00 1.00 2.00 3.00 4.00 5.00 6.00 7.00 8.00 9.00
10.00
0 20000 40000 60000 80000 Public bikes
Fig. 3. Comparisons of bikesharing turnover rate versus bikesharing members, docking stations, and public bikes.
J. Zhao et al. / Transport Policy ∎ (∎∎∎∎) ∎∎∎–∎∎∎8
Please cite this article as: Zhao, J., et al., Ridership and effectiveness of bikesharing: The effects of urban features and systemcharacteristics on daily use and.... Transport Policy (2014), http://dx.doi.org/10.1016/j.tranpol.2014.06.008i

system, most of the independent variables have the same expectedsign as that in Tables 2 and 3. Generally, regarding differentsystems types, bikesharing ridership and turnover tend to increasewith population, government expenditure, the number of bike-sharing members and docking stations. The signs of the number ofpublic bikes, again, are found to be adverse in explaining bike-sharing ridership and turnover rate. In addition, we find that thecoefficients of the number of bikesharing members by type arelarger than that of overall systems, indicating that using personalcredit cards, providing 24 h service, and/or adopting universalcards may promote members to use bikesharing more frequently.
5. Conclusions
At a time when vehicle travel is increasing and the associatedproblems are aggravating, urban planners and decision-makershave gradually shifted their emphasis from providing additionalroad space for driving to examining the need for more sustainabletransportation strategies. Transit priority that allows public trans-portation to be a more attractive and viable option for commutershas been proposed as a promising strategy to help relieve people'sheavy reliance on automobiles. As a pinnacle of green transporta-tion with transit attributes, public bikesharing has become parti-cularly popular since the mid-2000s.
In recent years adoption of and studies on this widespread urbanpublic transportation “revolution” have spread across the globe(Shaheen et al., 2010; Midgley, 2011; Lin and Yang, 2011;García-Palomares et al., 2012; Parkes et al., 2013; O’Brien et al.,
123456789
101112131415161718192021222324252627282930313233343536373839404142434445464748495051525354555657585960616263646566
Table 3OLS and PLS regression models of bikesharing turnover rate.
Variable Log OLS model with variables whose Pearson correlation coefficientsare smaller than 0.7.
Log PLS model
Coeff. p-value VIFa Coeff. B'b VIPc
(Constant) �1.847 0.9261 0 �2.292 0Urban featuresLog(population (10 thousand)) 0.531nn 0.0214 1.996 2.385†† 0.571 1.243Log(jobs (10 thousand)) �1.625† �0.432 0.993Log(income per capita (RMB)) 0.2028 0.9616 2.948 �0.027† �0.001 0.958Log(government expenditure (million RBM)) 0.543†† 0.138 1.150System characteristicsLog(number of members) 3.446†† 1.141 2.019Log(number of docking stations) 0.966nn 0.0125 1.451 0.117†† �0.029 1.237Log(number of public bikes) �2.062†† �0.563 1.164Log(operation days since the system opened) 0.240 0.7623 2.345 �0.589† �0.099 0.879Using personal credit cards or not (1–0) 1.116n 0.0898 3.339 1.045†† 0.186 1.199Providing 24 h service or not (1–0) 0.888n 0.0749 1.126 0.682†† 0.164 1.080Using universal cards or not (1–0) 0.717nn 0.0315 1.086 0.609†† 0.121 1.321Composite indictorsDeposit-income per capita ratio (10-3) �0.009 0.9924 1.769 �0.006 �0.009 0.412Penalty (after the first free use hours)-income per capita ratio (10-4) �3.240 0.6023 3.840 �4.241† �0.213 0.938
Summary statisticsN 69 N 69R2 0.4694 Prob PRESS 40.1Adj. R2 0.3579
a VIF: variance inflation factor.b B': standardized coefficient.c VIP: variable importance for projection.n Significant at the 0.1 level,nn significant at the 0.05 level.† Variable with a VIP larger than 0.8 is not considered to be “small” for projection (Wold, 1994),†† variable with a VIP larger than 1.0.
0.00
1.00
2.00
3.00
4.00
5.00
6.00
7.00
8.00
9.00
10.00
0
Tur
nove
r ra
te
y = -2.566ln(x) - 1.2121R² = 0.5688
0.2 0.4 0.6Bike-membership ratio
Fig. 4. Comparison of turnover rates versus bike–member ratio.
Table 4Average daily use and turnover rate of bikesharing systems, classified by usingpersonal credit cards or not, providing 24 h service or not, and using universalcards or not.
Classes Daily use Turnover rate
Average SD Average SD
Using personal credit cards or notYes (n¼11) 54,694 73,731 5.71 1.48No (n¼58) 22,404 46,108 3.9 2.05
Providing 24 h service or notYes (n¼39) 21,023 35,653 4.56 1.94No (n¼30) 36,038 67,736 3.71 2.15
Using universal cards or not or notYes (n¼14) 53,951 83,634 5.04 2.53No (n¼55) 20,831 38,971 3.98 1.90
J. Zhao et al. / Transport Policy ∎ (∎∎∎∎) ∎∎∎–∎∎∎ 9
Please cite this article as: Zhao, J., et al., Ridership and effectiveness of bikesharing: The effects of urban features and systemcharacteristics on daily use and.... Transport Policy (2014), http://dx.doi.org/10.1016/j.tranpol.2014.06.008i
2014). Two key questions for the success of bikesharing programs arehow many ridership bikesharing systems can attract, and whatinfluences their effectiveness. To address these, this paper evaluatesfactors affecting bikesharing daily use and turnover rate by analyzingdata from 69 bikesharing systems in China. In addition to comparingdaily use and turnover versus various variables, we model bikesharingdaily use and turnover rate respectively as a function of independentvariables measuring urban features and system characteristics, byadopting OLS and PLS regression models.
Regression results indicate that both bikesharing ridership andturnover rate tend to increase with urban population, governmentexpenditure, the number of bikesharing members and dockingstations. While the number of public bikes has a significantlypositive impact on bikesharing ridership, it might lower bikeshar-ing turnover rate at the same time, with all else being equal.Moreover, personal credit cards and universal cards can signifi-cantly raise bikesharing daily use and turnover rate. The modelsand comparisons displayed in this study provide urban plannersand transit agencies with direct demand models for bikesharingridership and turnover rate estimation.
The comparison between bike–member ratio and bikesharingturnover rate indicates that, to pursue an ideal turnover rate, thenumber of public bikes should be neither too many nor too few.Regarding the bikesharing systems in China, the ideal cut off valuefor the bike–member ratio is 0.2. In other words, for each public bikethere should be at least 5 potential users (bikesharing members inthis study). The results should catch bikesharing operators' andtransit agencies' attention especially. Whilst the more public bikes,usually the higher the bikesharing ridership level is, yet all else being
equal, increasing public bikes may significantly decrease system'seffectiveness.
Our analysis also recommends bikesharing operators and transitagencies to consider the policies of adopting personal credit cardsand universal cards, in particular, the adoption of the latter. Indeed,the free charge rate of bikesharing use is quite high in China, forexample, 96% in Hangzhou. Most bikesharing users in China canreturn public bikes within the first free 1 h (the time thresholdadopted by most bikesharing systems in China). Bikesharing opera-tors can only earn quite a small profit from the use fee penalty. Whynot considering using personal credit cards to increase both thebikesharing daily use and turnover rate with quite a few moresubsidies?5 Unfortunately, to date, only 15.9% (11 out of 69) cities inChina adopt this strategy. In addition, only 20.3% (14 out of 69) citiesintegrate bikesharing systems into other urban transit systemsthrough the use of universal cards. During the early adoption of
123456789
101112131415161718192021222324252627282930313233343536373839404142434445464748495051525354555657585960616263646566
Table 5PLS models of bikesharing ridership and turnover by system type.
Variablea PLS model of ridership Log PLS model of turnover rate
Coeff. B'b VIPc Coeff. B'b VIPc
All systems (N¼69)(Constant) �13376.086 0 �0.062 0Population (10 thousand) 30.582†† 0.016 1.035 1.108†† 0.265 1.463Government expenditure (million RBM) 0.080† 0.095 0.906 0.417† 0.142 0.821Number of members 0.066†† 0.208 1.320 3.927†† 1.366 2.085Number of docking stations 24.073†† 0.364 1.316 0.596† 0.151 0.954Number of public bikes 1.539†† 0.354 1.334 �2.565†† �0.701 1.346
Systems use personal credit cards (N¼11)(Constant) 5432.175 0 1.747 0Population (10 thousand) 20.813† 0.112 0.899 0.873 0.284 0.787Government expenditure (million RBM) 0.268† 0.408 0.979 1.938† 0.513 0.852Number of members 0.112†† 0.369 1.221 3.307†† 1.428 1.848Number of docking stations 5.468†† 0.026 1.243 4.01†† 1.347 2.660Number of public bikes 1.794†† 0.521 1.233 �6.29†† �2.703 1.174
Systems provide 24 h service (N¼39)(Constant) �2173.70 0 0.341 0Population (10 thousand) 16.213† 0.841 0.878 1.895†† 0.484 1.573Government expenditure (million RBM) 0.078† 0.143 0.923 1.438 0.434 0.792Number of members 0.131†† 0.291 1.200 5.629†† 1.765 1.946Number of docking stations 39.185†† 0.151 1.180 �0.767† �0.176 0.919Number of public bikes 2.040†† 0.639 1.276 �3.168†† �1.371 1.145
Systems adopt universal cards (N¼14) 1.696(Constant) 20796.35 0 0.230 0Population (10 thousand) 49.902† 0.067 0.961 1.420†† 0.217 1.014Government expenditure (million RBM) �1.195† �0.233 0.964 �1.475† �0.443 0.982Number of members 0.102†† 0.107 1.134 4.050†† 1.164 1.696Number of docking stations 83.843†† 0.649 1.212 1.883†† 0.662 1.338Number of public bikes 1.904†† 0.391 1.210 �3.917†† �1.272 1.032
a Log independent variables' values for turnover rate modeling.b B0: standardized coefficient.c VIP: variable importance for projection.† Variable with a VIP larger than 0.8 is not considered to be “small” for projection (Wold, 1994),†† Variable with a VIP larger than 1.0.
5 Practice of the adoption of personal credit cards indicates that this policy canevoke the enthusiasm for applying a bikesharing member, thus increase thepotential bikesharing use and improve the turnover rate. Personal credit cards,based on our insights, however, also have two main shortcomings: 1) this policyheavily relies on government subsidy, which may corrode system's sustainabilityand, 2) this zero-cost model can play a role in increasing bikesharing daily use butalso may prolong bikes’ occupation time. Some cities in China, such as Wuhan, haveoverridden this policy after several years’ practice, yet suffered lots during thetransformation, such as a sharp decrease in bikesharing members and a longdepression in bikesharing use. Personal credit cards are still adopted by some citiesin China, including, Shanghai, Chengdu, and Suzhou, transit authorities areencouraged to adopt this model but also need to do enough feasibility study onthe cost-effectiveness analysis of this policy.
J. Zhao et al. / Transport Policy ∎ (∎∎∎∎) ∎∎∎–∎∎∎10
Please cite this article as: Zhao, J., et al., Ridership and effectiveness of bikesharing: The effects of urban features and systemcharacteristics on daily use and.... Transport Policy (2014), http://dx.doi.org/10.1016/j.tranpol.2014.06.008i

bikesharing, integrating bikesharing into other transit systems maymeet with various challenges from technology and investmentissues. These challenges, however, could be resolved gradually asbikesharing continues to catch people's attention, survive to policydevelopments, and integrate technological innovation.
At the conclusion of this study, a host of other questionsregarding bikesharing remain unanswered. What other factorsinfluence bikesharing ridership and effectiveness? In addition tothe variables measuring urban features and system characteristics,one would expect that good bikesharing neighborhoods (builtenvironment design) and high level of service (rebalancing, main-tenance, etc.) can also raise bikesharing ridership and effective-ness. Second, would personal credit cards be sustainable inbikesharing adoption? Bikesharing users would expect that thereis less cost in using public bikes, whereas local governments andbikesharing operators would hope the systems to be more cost-effective. How to look for a balance between cost and effective-ness? Third, universal cards turn out to be an effective policy inraising both bikesharing daily use and turnover rate, what are theother policies having the same positive impacts? Opening thesystem (for example, anyone in possession of a debit or credit cardcan access to bikesharing in London) is found to correlate withgreater daily use. However, registration policy required by mostcities in China is a major barrier to the adoption of “open policy”.Would it be possible to override the registration policy to create anopening bikesharing system in China? Whilst we did not shedlight on answers to these questions, it is believed that thesequestions can be addressed in the near future, as bikesharingcontinues to be more diversified in system design and policyadoption.
Acknowledgments
This research is supported by the Chinese Scholarship Council(No. 201306090063) and the Scientific Research Foundation ofGraduate School of Southeast University (No. YBPY1405). We wantto express our gratitude to Professor Greg Marsden and twoanonymous reviewers for their helpful comments and suggestions.
Appendix A
See Table A1.
References
Chemla, D., Meunier, F., Calvo, R.W., 2012. Bike Sharing System: Solving the StaticRebalancing Problem. Available from: ⟨http://hal-enpc.archives-ouvertes.fr/docs/00/72/66/17/PDF/SVOCPDP_HAL.pdf⟩ (accessed 20.02.14.).
Christensen, M., Shaheen, S.A., 2014. Can Bikeshare Systems Ever Stand on theirOwn Two Wheels? Available from: ⟨http://theconversation.com/can-bikeshare-systems-ever-stand-on-their-own-two-wheels-22981⟩ (accessed 18.02.14.).
123456789
101112131415161718192021222324252627282930313233343536373839404142434445464748495051525354555657585960616263646566
Table A.1Information on the key characteristics of bikesharing systems in China (ranked byturnover rate).
City Openingmontha
Operationdaysb
Turnoverratea
Dailyusea
Dockingstationsa
Publicbikesa
Jiaxing 12–2011 315 0.7 1000 50 1500Binzhou 8–2013 112 1.1 450 25 400Kaixian 1–2011 220 1.2 600 20 500Zhoushan 10–2009 190 1.4 700 15 500Qingzhou 9–2010 350 1.4 14,000 506 10,000Guangyuan 8–2010 120 1.5 1500 29 1000Hohhot 10–2013 100 1.6 4000 50 2500Ordos 8–2013 102 1.8 2189 44 1200Dujiangyan 4–2010 197 1.9 1500 80 800Yongchuan 6–2011 120 2.0 1000 25 500Jiayuguan 5–2013 100 2.0 300 7 150Ningbo 9–2013 93 2.0 4000 100 2000Ninghai 6–2011 358 2.1 4500 100 2200Qidong 3–2013 180 2.1 2500 60 1200Ninghai 6–2011 670 2.3 6876 151 3000
Table A.1 (continued )
City Openingmontha
Operationdaysb
Turnoverratea
Dailyusea
Dockingstationsa
Publicbikesa
Wujiang 12–2011 102 2.3 3568 100 1532Zhuhai 12–2012 227 2.4 12,000 195 5000Yiwu 10–2013 93 2.5 2500 50 1000Baoji 9–2013 307 2.6 5149 100 2000Shaoxing 6–2011 160 2.6 9000 82 3500Heihe 5–2012 98 2.8 6333 62 2300Yantai 8–2010 1110 2.8 3600 110 1300Huizhou 4–2012 191 2.8 5569 100 2000Wuxi 1–2010 960 3.0 4500 27 1500Nantong 6–2011 715 3.0 12,000 60 4000Wuhan 11–2008 1460 3.1 220,000 1218 70,000Nanjing 1–2011 101 3.2 18,000 307 5600Pinghu 7–2013 950 3.2 3210 30 1000Wuhu 9–2012 365 3.3 39,000 478 12,000Yinchuan 7–2010 1050 3.3 1060 7 320Zaozhuang 7–2012 210 3.3 1200 17 360Linhai 6–2011 720 3.6 4493 52 1250Foshan 8–2010 600 3.6 67,200 441 18,520Hangzhou 5–2008 1560 4.0 257,600 2435 65,000Jiangyin 11–2008 305 4.0 2800 23 700Liuyang 1–2012 485 4.0 4000 50 1000Taizhou 2–2010 820 4.0 40,000 205 10,000Changde 10–2012 200 4.0 4000 63 1000Aksu 5–2013 106 4.2 2118 20 500Wenling 1–2012 415 4.5 22,500 120 5000Guangzhou 8–2009 730 4.6 23,000 116 5000Nanchang 9–2008 1125 4.8 24,000 120 5000Tongliang 10–2010 300 5.0 2500 16 500Fuzhou 6–2011 670 5.0 7000 59 1400Zhangjiagang 6–2010 990 5.0 16,000 152 3200Shenzhen 9–2010 630 5.1 45,932 300 9054Mengzi 10–2013 93 5.2 2216 43 426Shenmu 5–2013 221 5.3 4000 30 750Huangyan 1–2012 630 5.4 21,430 114 4000Mianyang 10–2012 395 5.8 5479 51 950Shanghai 3–2009 1140 5.8 162,400 574 28,000Zhenjiang 4–2013 95 6.0 6000 40 1000Jiyuan 8–2013 120 6.0 3000 32 500Shaoyang 10–2013 180 6.1 3200 30 528Yongcheng 1–2013 297 6.2 6851 55 1100Beijing c 6–2011 399 6.3 35,000 280 5600Lishui 2–2013 210 6.3 5000 26 800Sunning 9–2011 370 6.3 7500 109 1190Chizhou 9–2009 303 6.7 20,000 67 3000Suzhou 8–2010 365 6.8 101,450 640 15,000Zhongshan 10–2011 390 6.8 47,300 267 7000Chengdu 6–2010 450 7.0 10,500 156 1500Changshu 5–2011 370 7.2 21,600 150 3000Yixing 12–2012 152 7.3 19,000 115 2600Zhuzhou 5–2011 730 7.5 150,000 502 20,000Wenzhou 12–2012 425 7.6 53,500 254 7000Kunshan 9–2010 510 7.8 46,666 300 6000Xuzhou 9–2012 377 8.0 64,000 297 8000Taiyuan 9–2012 265 9.5 190,000 1000 20,000
a Data from various sources, including local bikesharing agencies, onlinedocuments, unpublished records, and websites (such as, http://www.hzsggzxc.com/ (Hangzhou Public Bicycle), http://www.bjysj.gov.cn/bjggzxc/ (Beijing PublicBicycle), http://zxc.gzzc.com.cn/ (Guangzhou Public Bicycle) to name very afew here).
b The days between the system opening day and the data releasing day.c Whilst the history of Beijing's public can be dated back to the 1990s, the first
bikesharing system supported by the local governments and public agencies waslaunched in June 2011 in the districts of Dongcheng and Chaoyang.
J. Zhao et al. / Transport Policy ∎ (∎∎∎∎) ∎∎∎–∎∎∎ 11
Please cite this article as: Zhao, J., et al., Ridership and effectiveness of bikesharing: The effects of urban features and systemcharacteristics on daily use and.... Transport Policy (2014), http://dx.doi.org/10.1016/j.tranpol.2014.06.008i

Clark, W.A.V., Hosking, P.L., 1986. Statistical Methods for Geographers. Wiley, NewYork.
Cui, Y., 2011. Wuhan's Public Bikes. Available from: ⟨http://www.hb.xinhuanet.com/newscenter/2011-08/25/content_23546188.htm⟩ (accessed 21.02.14.).
DeMaio, P., 2009. Bike sharing: history, impacts, models of provision, and future. J.Public Transp. 12, 41–56.
DeMaio, P., Meddin, R., 2014. The Bike-sharing World Map. Available from: ⟨http://bit.ly/K9pKmO⟩ (accessed 23.02.14.).
García-Palomares, J.C., Gutiérrez, J., Latorre, M., 2012. Optimizing the location ofstations in bike-sharing programs: a GIS approach. Appl. Geogr. 35, 235–246.
Gauthier, A., Hughes, C., Kost, C., Li, S., et al., 2013. The Bike-share Planning Guide.ITDP Report. Available from: ⟨http://www.itdp.org/documents/ITDP_Bike_Share_Planning_Guide.pdf⟩(accessed 19.02.14.).
Guerra, E., Cervero, R., 2011. Cost of a ride: the effects of densities on fixed-guideway transit ridership and costs. J. Am. Plan. Assoc. 77, 267–290.
Hangzhou Public Bicycle, 2013. An Introduction of Hangzhou Public Bicycle.Available from: ⟨http://www.hzsggzxc.com/about.aspx?c_kind=521&c_kind2=522&c_kind3=531⟩ (accessed 10.11.13.).
Hangzhou Public Bicycle, 2014. Available from: ⟨http://www.hzsggzxc.com/about.aspx?c_kind=521&c_kind2=525&c_kind3=906⟩ (accessed 19.02.14.).
Hughes, C., 2014. Planning Bike Share for Better Performance. Presented atTransforming Transportation 2014. Available from: ⟨http://www.slideshare.net/EMBARQNetwork/planning-bike-share-for-better-performance-colin-hughes-itdp⟩ (accessed 19.02.14.).
Jäppinen, S., Toivonen, T., Salonen, M., 2013. Modelling the potential effect of sharedbicycles on public transport travel times in Greater Helsinki: an open dataapproach. Appl. Geogr. 43, 13–24.
Jensen, P., Rouquier, J.B., Ovtracht, N., Robardet, C., 2010. Characterizing the speedand paths of shared bicycles in Lyon. Transp. Res. Part D 15, 522–524.
Kaltenbrunner, A., Meza, R., Grivolla, J., Codina, J., Banchs, R., 2010. Urban cycles andmobility patterns: exploring and predicting trends in a bicycle-based publictransport system. Pervasive Mobile Comput. 6, 455–466.
Kutner, M.H., Nachtsheim, C.J., Neter, J., 2004. Applied Linear Regression Models,4th ed. McGraw-Hill, Irwin.
Lathia, N., Ahmed, S., Capra, L., 2012. Measuring the impact of opening the Londonshared bicycle scheme to casual users. Transp. Res. Part C 22, 88–102.
Lin, J.R., Yang, T.H., 2011. Strategic design of public bicycle sharing systems withservice level constraints. Transp. Res. Part E 47, 284–294.
Midgley, P., 2011. Bicycle-Sharing Schemes: Enhancing Sustainable Mobility inUrban Areas. United Nations Department of Economic and Social Affairs.Background Paper No. 8.
Nair, R., Miller-Hooks, E., 2014. Equilibrium network design of shared-vehiclesystems. Eur. J. Oper. Res. 235 (1), 47–61.
National Bureau of Statistics of China, 2012. Urban Statistical Yearbook of China.China Statistics Press, Beijing p. 2012.
National Bureau of Statistics of China, 2013. Statistic Yearbook of China. Availablefrom: ⟨http://www.stats.gov.cn⟩ (accessed 20.02.14.).
O'Brien, O., Cheshire, J., Batty, M., 2014. Mining bicycle sharing data for generatinginsights into sustainable transport systems. J. Transp. Geogr. 34, 262–273.
Parkes, S.D., Marsden, G., Shaheen, S.A., Cohen, A.P., 2013. Understanding thediffusion of public bikesharing systems: evidence from Europe and NorthAmerica. J. Transp. Geogr. 31, 94–103.
Raviv, T., Tzur, M., Forma, I.A., 2013. Static repositioning in a bike-sharing system:models and solution approaches. EURO J. Transp. Logist. 2 (3), 187–229.
Shaheen, S.A., Cohen, A.P., Martin, E.W., 2013. Public bikesharing in North America:early operator understanding and emerging trends. Transp. Res. Rec. 2387,83–92.
Shaheen, S.A., Guzman, S., Zhang, H., 2010. Bikesharing in Europe, the Americas,and Asia: past, present, and future. Transp. Res. Rec. 2143, 159–167.
Shaheen, S.A., Martin, E.W., Cohen, A.P., Finson, R.S., 2012. Public Bikesharing inNorth America: Early Operator and User Understanding. Available from: ⟨http://transweb.sjsu.edu/project/1029.html⟩ (accessed 02.06.14.).
Shaheen, S.A., Zhang, H., Martin, E., Guzman, S., 2011. China's Hangzhou publicbicycle: understanding early adoption and behavioral response to bikesharing.Transp. Res. Rec. 2247, 33–41.
State Council, 2012. State Council's Guidance on the Priority Development of UrbanTransit. Available from: ⟨http://www.gov.cn/zwgk/2013-01/05/content_2304962.htm⟩ (accessed 20.02.14.).
Tobias, R.D., 1999. An Introduction to Partial Least Q3Squares Regression. SAS Institute,pp. 1–8.
Wold, S., 1994. Exponentially weighted moving principal component analysi Q4s andprojections to latent structures. Chemometr. Intell. Lab. Syst., 149–161.
Zhao, B., 2012. Deposit of Xi’an's Bikesharing: 200 RMB for Local Residents vs. 700RMB for Occasional Users. Available from: ⟨http://news.hsw.cn/system/2012/08/01/051406079.shtml⟩ (accessed 21.02.14.).
123456789
10111213141516171819202122232425262728293031
J. Zhao et al. / Transport Policy ∎ (∎∎∎∎) ∎∎∎–∎∎∎12
Please cite this article as: Zhao, J., et al., Ridership and effectiveness of bikesharing: The effects of urban features and systemcharacteristics on daily use and.... Transport Policy (2014), http://dx.doi.org/10.1016/j.tranpol.2014.06.008i