dear colleague, - international society for clinical ... · — 2009 annual meeting 41 dear...
TRANSCRIPT


— 2009 Annual Meeting 41
Dear Colleague,
We are pleased to welcome all ISCD and IOF colleagues to Impact of NewParadigms on Skeletal Assessment: a joint ISCD-IOF meeting. Prompt andconcerted inter-organizational cooperation has yielded a world-class skeletalhealth meeting with global representation and impact. At this joint meeting, weanticipate an interchange of ideas that will stimulate thought and debate, withthe goal of advancing global skeletal health.
The ISCD-IOF Joint Meeting Committee and the Board hope you enjoy thismeeting!
Sanford Baim, MD, CCD John A. Kanis, MD President, ISCD President, IOF
Joint Meeting Program Chairs
Christopher Shuhart, MD, CCD Didier Hans, PhD, CCD, CDT
Bennié Leverich, RN, CDT
2009 Annual Meeting CommitteeWe would like to thank and acknowledge the hard work and time our
committee volunteers have given over the past year.
Ronald Hamdy, MD, CCD, Committee ChairDiane Krueger, BS, CDT, Committee Vice-Chair
Didier Hans, PhD, CCD, CDT, Program Co-ChairBennié Leverich, RN, CDT, Program Co-Chair
Christopher Shuhart, MD, CCD, Program Co-ChairDonald Bachman, MD, CCD
Sanford Baim, MD, CCDNeil Binkley, MD, CCDSusan Broy, MD, CCD
Kyla Kent, CBDTAnita Colquhoun, MRT, CDT
Kathy Diemer, MD, CCDCatherine Gordon, MD, CCD
Edward Leib, MD, CCDE. Michael Lewiecki, MD, CCDBradford Richmond, MD, CCD
Brian Sabowitz, MD, CCDS. Bobo Tanner, MD, CCDTamara Vokes, MD, CCD
Babette Zemel, PhDS. Bobo Tanner, MD, CCD
Carol Zapalowski, PhD, CCD

Table of Contents
PageOfficers and Board of Directors .................................................................................................................. 1
Committee Meetings ...................................................................................................................................... 2
General Information ....................................................................................................................................... 3
Evaluator Instructions ..................................................................................................................................... 4
Disclosures ....................................................................................................................................................... 5
Award Winners ............................................................................................................................................... 8
Scientific Exhibits ........................................................................................................................................... 11
Additional Educational Opportunities ...................................................................................................... 12
Abstracts ......................................................................................................................................................... 13
Evaluation Notes ........................................................................................................................................... 41


— 2009 Annual Meeting 1
2009-2010 Officers and Board of DirectorsPRESIDENT
Andrew J. Laster, MD, CCD - 2009Charlotte, NC
PRESIDENT-ELECT
Didier B. Hans, PhD, CCD, CDT - 2009Lausanne, Switzerland
VICE-PRESIDENT
Sarah L. Morgan, MD, CCD - 2009Birmingham, AL
TREASURER
S. Bobo Tanner, MD, CCD - 2010Nashville, TN
SECRETARY
Open Position
IMMEDIATE PAST PRESIDENT
Sanford Baim, MD, CCD - 2009Lakewood, CO
Board of DirectorsAnn M. Babbitt, MD - 2012South Portland, ME
Susan B. Broy, MD, CCD - 2011Morton Grove, IL
Jan M. Bruder, MD, CCD - 2012San Antonio, TX
Anita Colquhoun, MRT(N), CDT - 2010Toronto, ON Canada
Kathryn M. Diemer, MD, CCD - 2011St. Louis, MO
Catherine Gordon, MD, CCD - 2012Boston, MA
Akira Itabashi, MD, PhD, CCD - 2011Kumagaya, Saitama, Japan
Lawrence G. Jankowski, CDT - 2011Morton Grove, IL
Diane C. Krueger, BS, CBDT - 2010Madison, WI
Brian C. Lentle, MD, CCD - 2011Vancouver, BC Canada
William D. Leslie, MD, FRCPC, MSc, CCD - 2011Winnipeg, MB Canada
Roman S. Lorenc, MD, PhD, CCD - 2011Warsaw, Poland
Sergio Ragi-Eis, MD, CCD, CDT - 2011Vitoria, ES Brazil
Joseph L. Shaker, MD, CCD - 2010Boise, ID
Christine Simonelli, MD, CCD - 2011Woodbury, MN
Wendy J. Tolman-Andrews, RT, CBDT - 2012Farmington, CT
Sunil J. Wimalawansa, MD, PhD, DSc - 2011New Brunswick, NJ
EX OFFICIO BOARD MEMBERSJCD EDITOR
Past President (1993-1998)Paul Miller, MD, CCDLakewood, CO
EDUCATION COUNCIL
Edward S. Leib, MD, CCDBurlington, VT
CERTIFICATION COUNCIL
Susan E. Williams, MD, CCDXenia, OH
PUBLICATIONS COMMITTEE
Marc-Antoine Krieg, MD, CCD, CDTLausanne, Vaud, Switzerland
SCIENTIFIC ADVISORY COUNCIL
E. Michael Lewiecki, MD, CCDAlbuquerque, NM
PAST PRESIDENTS
John Bilezikian, MD, CCD (1999-2002)New York, NY
Neil Binkley, MD, CCD (2006-2007)Madison, WI
David Kendler, MD, CCD (2007-2008)Vancouver, BC Canada
E. Michael Lewiecki, MD, CCD (2003-2005)Albuquerque, NM
Steven Petak, MD, JD, CCD (2005-2006)Houston, TX
Nelson B. Watts, MD, CCD (2002-2003)Cincinnati, OH

2 — 2009 Annual Meeting
Committee Meetings – Invitation Only
Wednesday, March 11, 2009
Asia Pacific PanelEurope 119:00 p.m.
Thursday, March 12, 2009
Combined Education CommitteeEurope 116:30 - 7:30 a.m.
Certification CouncilAmericas Seminar7:00 - 8:30 a.m.
President’s ReceptionAmericas Seminar9:30 - 11:00 p.m.
Friday, March 13, 2009
JCD Editorial Board/Publications CommitteeAmericas Seminar7:00 - 8:00 a.m.
CACAmericas Seminar5:30- 7:00 p.m.
Saturday, March 14, 2009
Annual Meeting CommitteeEurope 117:00 - 8:00 a.m.
CONTACT INFORMATION
Address: 342 North Main StreetWest Hartford, CT 06117-2507USA
Phone: 860.586.7563Fax: 860.586.7550
E-mail General: [email protected]: [email protected]
[email protected]: [email protected] site: www.ISCD.org
STAFF
M. Suzanne C. Berry, MBA, CAE (Ext. 510)Executive [email protected]
Priscilla T. Shisler (Ext. 549)Director of [email protected]
JoLynn Amsden (Ext. 585)Education Project [email protected]
Beth Baddeley (Ext. 543)Certification [email protected]
Jean Fazzino (Ext. 545)Leadership [email protected]
Donna Fiorentino (Ext. 553)Public Policy Affairs [email protected]
Jennifer Gentry (Ext. 529)Publications/Web Site [email protected]
Nancy Gianetti (Ext. 534)Membership Services [email protected]
Anabela Gomes (Ext. 583)Education [email protected]
Amanda Neal (Ext. 515)Education [email protected]
Helene Weston (Ext. 539)Certification [email protected]

— 2009 Annual Meeting 3
General Information
Purpose StatementThe incidence of osteoporotic fractures is increasing both inNorth America and globally. Contributing to this is aging of thepopulation, suboptimal diet and exercise in children andadolescents leading to low peak bone mass, more sedentarylifestyles in many parts of the world, and an increase in theprevalence of diseases and use of medications that lower bonemass. The need for tailored screening, diagnosis and treatmentsuitable for different cultures is therefore increasingly important.To this end, new technologies and treatments should be assessedand appropriate standards and guidelines developed andimplemented. Position statements arising from ISCD conferenceswill be helpful in this regard. The meeting will help as a forum toeducate healthcare professionals and assist them to successfullydiagnose, prevent and treat osteoporosis worldwide.
Learning ObjectivesUpon completion of this activity, participants should be able to:• Recognize the advantages and limitations of the FRAX model
to develop an effective management strategy for yourpatients with low bone mass
• Apply the recommendations of the ISCD official positionsand expert panelists to provide optimum evaluation andtreatment of skeletal diseases for adult and pediatric patients
• For your adult patients with fragility fracture, evaluate for skeletaldisease and interventions for fracture risk reduction to reducelikelihood of subsequent fracture thereby reducing the likelihoodof mortality and morbidity and improving quality of life
• Recognize the scope and impact of poor quality bonedensitometry on patient care and how to implementrecommended standards to reduce acquisition, interpretationand subsequent clinical errors
Target AudienceThe target audience for this educational activity is clinicians,technologists, researchers, scientists, and healthcare providerswho wish to learn the skills and techniques of quality skeletalassessment to implement in their practice.
Accreditation StatementThis activity has been planned and implemented in accordancewith the Essential Areas and Policies of the AccreditationCouncil for Continuing Medical Education through thesponsorship of the International Society for ClinicalDensitometry (ISCD). The ISCD is accredited by theAccreditation Council for Continuing Medical Education toprovide continuing medical education for physicians.
Credit DesignationThe International Society for Clinical Densitometry designates thiseducational activity for a maximum of 28.0 AMA PRA Category 1Credit(s)™. Physicians should only claim credits commensuratewith the extent of their participation in the activity.
Disclosure StatementThe International Society for Clinical Densitometry is committed toresolving all conflicts of interest issues that could arise as a result ofprospective faculty members’ relevant relationships with drug ordevice manufacturers. The ISCD is committed to maintaining only
those speakers with financial interest that can be reconciled withthe goals and educational integrity of the CME program.
In accordance with ACCME Standards for Commercial Support,the speaker(s) for this meeting have been asked to disclose toparticipants the existence of any financial relationships in anyamount occurring within the past 12 months. Disclosures canbe found starting on page five of this program book.
ISCD Disclaimer StatementThe opinions expressed during this educational activity arethose of the faculty and do not necessarily represent the viewsof the International Society for Clinical Densitometry.Participants have an implied responsibility to use the newlyacquired information to enhance patient outcomes and theirown professional development.
CE CreditThis meeting qualifies for up to 28.0 Category A Credits throughthe American Society of Radiologic Technologists (ASRT).
Policy on Commercial Support and Faculty DisclosureThe ISCD maintains a policy on the use of commercial supportwhich ensures that all educational activities supported by theISCD provide in-depth presentations that are fair, independent,free of commercial bias and scientifically rigorous. To this end, allspeakers are required to complete a Conflict of InterestDisclosure Form. All disclosures are included in this programbook starting on page five.
Clinicians - CME CertificatesFull instructions for completing your evaluation of the meetingare on page four of this program book. A CME certificate will becreated during that process for you to print for your records.
Technologists - CE CertificatesFull instructions for completing your evaluation of the meetingare on page four of this program book. If you would like toreceive Category A CE credit, you will need a special badgewhich will be scanned upon entry to and exit from each room.For the General Session Room (Southern IV & V), you must enterthrough a doorway that has an electronic gate. To capture yourentry or exit, you only need to walk in, no swiping is required.For the Concurrent Room (Northern E-2), and the Meet theProfessor and Workshop Rooms (Oceanic Rooms), you will needto swipe your badge on the scanner. This must be done when youenter the room as well as when you exit the room. Once youcomplete the online evaluation, ISCD staff will verify yourattendance. After the number of credits is verified, your certificatewill be sent to you via email.
Acknowledgment
We gratefully acknowledge the following companies for theireducational grants in support of this activity: Eli Lilly andCompany, GE Healthcare-Lunar, Hologic, Medtronic, NovartisPharmaceuticals, Roche Diagnostics Corporation and theAlliance for Better Bone Health, P&G Pharmaceuticals andsanofi-aventis. We gratefully acknowledge Amgen for theireducational donation.
4 — 2009 Annual Meeting
ISCD Annual Meeting Education Evaluator
The International Society for Clinical Densitometry (ISCD)Education Evaluator is the credit reporting and evaluationsystem which will allow the ISCD staff to get your feedback onthe meeting and make it easy for you to process your ownCME/CE certificate.
Evaluations are very important to us. The planning andexecution of useful, sound, continuing medical educationprograms are largely guided by input provided by programparticipants. These evaluations are required for continuingmedical education accreditation. In addition, your response tothe following questions will help to ensure that future programsare informative and meet participants’ educational needs. Yourevaluation must be completed online in order to process yourCME/CE certificate.
Information submitted through ISCD Education Evaluator will only beshared in the aggregate and will not include any contact reference orinformation. Access to course attendees is limited to the ISCD staffadministrator and is only used to assist the attendee with obtainingtheir attendance certificate.
ISCD Education Evaluator InstructionsIf you pre-registered for the Annual Meeting, you received anemail with this instruction sheet and your ID Number andPassword. If you registered on-site, you will receive an emailwith your ID Number and Password about two weeks after themeeting.
Below are the instructions for accessing the Education Evaluatorand frequently asked questions.
Steps for Accessing the ISCD Education Evaluator1. Access the ISCD evaluator at www.ISCD.org under the Quick
Links section, from any computer that has internet access forup to six weeks after the meeting.
2. Select Annual Meeting. (If you attended the BDC and/or VFAcourse, evaluation(s) will be done separately.)
3. Enter your ID number and Password. These can be found onyour acknowledgment and on your ISCD name badge.
4. Select Technologist or Clinician.
5. Select sessions attended and complete the individual sessionevaluations using your notes from this booklet.
6. Complete the overall Annual Meeting evaluation.
7. Please verify that all sessions attended have been selectedbefore selecting Yes or No.
8. Print your certificate.
9. Please NOTE: Use the back button on your browser andthen select Log Out from the upper right-hand corner of thepage to complete the session. Logging Out must becompleted before evaluating a education course. (e.g. BDC orVFA course)
Frequently Asked Questions
Where can I find my ID number and Password? If youpre-registered for the Annual Meeting, you received an e-mailwith this instruction sheet and your ID Number and Password.If you registered on-site, you will receive an e-mail with your IDNumber and Password about two weeks after the meeting.
When can I start entering my evaluation information?As long as you are pre-registered for the ISCD Annual Meetingyou may start entering each day’s session evaluations at the endof each day. The system will be available until six weeks after theAnnual Meeting.
Where can I access the ISCD evaluation system? You canaccess the evaluation system from any computer that hasinternet access at www.ISCD.org under the Quick Links section.An internet café is available for your convenience in the GrandBallroom of the hotel at the Annual Meeting.
What is the paper evaluation for? You will need to takenotes for each lecture so you can enter the information onlinelater.
Can I enter part of my information now and finishlater? Yes, you may enter partial information and return at alater time to finish. The system will allow this until you indicatethat you are finished.
— 2009 Annual Meeting 5
Disclosures
Robert Adler, MD, CCDConsulting: MerckSpeaker: NovartisResearch: Eli Lilly, GSK, Novartis, P&G
Gerald W. Avery, RT(R)(N), CNMT, CBDTNo Financial Relationships to Disclose
Donald Bachman, MD, CCDNo Financial Relationships to Disclose
Sandford Baim, MD, CCDResearch: Amgen, Eli Lilly, Merck, Novartis, P&G, Roche
Carmen Barbu, MD, PhD, CCDNo Financial Relationships to Disclose
John P. Bilezikian, MD, CCDRoyalty: Elsevier PublishingConsulting: Alliance for Better Bone HealthEli Lilly, NovartisResearch: GSK, Alliance for Better Bone Health
Neil C. Binkley, MD, CCDConsulting: Merck, Novartis, Eli LillySpeakers’ Bureaus: Novartis, Merck, Roche,P&G, GSKResearch: Merck, Novartis, Roche, Aventis,GSK, Deltanoid, Unigene
Robert Blank, MD, PhD, CCDSpeakers’ Bureaus: Novartis
Mary Bouxsein, PhDConsulting: Amgen, Merck, Eli LillySpeakers’ Bureaus: Roche/GSKResearch: Merck
Susan Broy, MD, CCDSpeaker: Eli Lilly, Novartis, P&GResearch: Eli Lilly
Jan Bruder, MD, CCDNo Financial Relationships to Disclose
Jane Cauley, PhDConsulting: NovartisResearch: Novartis
JoAnn P. Caudill, RT(R)(M)(BD), CDTNo Financial Relationships to Disclose
Mary Checovich, MS, CBDTNo Financial Relationships to Disclose
Anita Colquhoun, MRT, CDTNo Financial Relationship to Disclose
William H. Cottrell, MD, CCDSpeaker’ Bureaus: P&G
Bess Dawson-Hughes, MDConsulting: Amgen, Eli Lilly, Danone, P&G, Cytochroma,GSK, J&J, Merck, Maxesence guest, Servier, Tethys, WyethResearch: Unilever
Kathryn Diemer, MD, CCDSpeaker’ Bureaus: Eli Lilly, GSK, Novartis, P&G, Roche,sanofi-aventis
Linda A. DiMeglio, MD, MPHNo Financial Relationships to Disclose
Robert Downs, MD, CCDConsulting: Amgen, NovartisSpeaker: Novartis
Gary Edelson, MD, CCDConsulting: Merck, Novartis, Alliance for Better BoneHealth, Eli LillySpeakers’ Bureaus: Merck, Novartis, Alliance for BetterBone Health, Eli Lilly
Beatrice Edwards, MD, CCD, FACPConsulting: P&GSpeakers’ Bureaus: Eli Lilly, Novartis, Roche, P&GResearch: P&G
Florent Elefteriou, PhDNo Financial Relationships to Disclose
Kenneth G. Faulkner, PhDSalary: Perceptive InformaticsOwnership Interest: Synarc
In accordance with FDA and ACCME guidelines, which are concerned with the balance, independence, objectivity, and scientificrigor of all accredited programs, ISCD requires all faculty to make full disclosure. Full disclosure entails indicating whether thefaculty member and/or his/her immediate family has any relationships with pharmaceutical companies, biomedical devicemanufacturers, and/or other corporations whose products or services are related to pertinent therapeutic areas. All facultyparticipating in ISCD sponsored programs are expected to disclose to the audience any relationship(s) with companies whomanufacture products having a direct bearing on the subject matter of the CME activity and/or relationship(s) between the speakerand commercial contributor of the activity. Additionally, faculty members are required to inform the audience when they arediscussing off-label, unapproved uses of devices and drugs. Devices or drugs that are still undergoing clinical trials should beidentified as such and should not be portrayed as standard, accepted therapy. In weighing the benefits of treatment against the risks,clinicians should be guided by clinical judgment. Any procedures, medications or treatments discussed in this program should notbe used by clinicians without evaluation of their patient’s condition or possible contraindication or dangers in use, review ofapplicable product information and comparison with recommendations of other authorities.

6 — 2009 Annual Meeting
Harry Genant, MDConsulting: BMS, Eli Lilly, GSK, Merck, ServierOwnership Interest: Synarc
Catherine Gordon, MD, CCDNo Financial Relationships to Disclose
Didier B. Hans, PhD, CCD, CDTNo Financial Relationships to Disclose
Ronald Hamdy, MD, CCDSpeakers’ Bureaus: Novartis, P&GResearch: P&G
Michelle M. Heater, RT(R)(M)(BD), CBDTNo Financial Relationships to Disclose
Larry G. Jankowski, CDTNo Financial Relationships to Disclose
John A. Kanis, MDNo Financial Relationships to Disclose
Theresa Kehoe, MDNo Financial Relationships to Disclose
David L. Kendler, MD, CCDConsulting: Novartis, Eli Lilly, Servier, Nycomed, Wyeth,Amgen, Pfizer, GSKSpeakers’ Bureau: Novartis, Eli Lilly, Servier, Nycomed,Wyeth, Amgen, Pfizer, GSKResearch: Novartis, Eli Lilly, Servier, Nycomed, Wyeth,Amgen, Pfizer, GSK
Kyla Kent, CBDTConsulting: Metabolx, Inc.
Aliya A. Khan, MD, CCDConsulting: Novartis, Merck, Lilly, Servier, NycomedResearch: NPS, Allelix
Michael Kleerekoper, MDSalary: MicroMRI, Inc.Consulting: Roche DiagnosticsCME: Amgen, GSK
Lynn Kohlmeier, MD, CCDConsulting: AmgenCME: Merck, Eli Lilly, sanofi-aventis, P&G, Roche, GSK,Novartis, Wyeth, Solvay
Marc-Antoine Krieg, MD, CCD, CDTNo Financial Relationships to Disclose
Kelly D. Krohn, MD, CCDSalary: Eli LillyOwnership Interest: Eli Lilly
Diane C. Krueger, BS, CBDTNo Financial Relationships to Disclose
Annie W. C. Kung, MD, FRCP, CCDNo Financial Relationships to Disclose
Andrew J. Laster, MD, FACR, CCDConsulting: Roche/GSK, Genentech, Eli LillySpeakers’ Bureaus: Novartis, Roche/GSK, Genentech,Eli Lilly, P&G
Edward S. Leib, MD, CCDNo Financial Relationships to Disclose
Brian Lentle, MD, CCDNo Financial Relationships to Disclose
Mary B. Leonard, MD, MSCDNo Financial Relationships to Disclose
William Leslie, MD, CCDConsulting: Genzyme CanadaSpeakers’ Bureaus: Merck
E. Michael Lewiecki, MD, FACP, FACE, CCDResearch: Amgen, Eli Lilly, GSK, Novartis, Pfizer, P&G,Roche, sanofi-aventis, WyethConsulting: Amgen, Eli Lilly, Novartis, Roche/GSK,Upsher-Smith, WyethSpeakers’ Bureaus: Eli Lilly, Novartis, Roche/GSKOwnership Interest: General Electric, P&G, Teva
Roman S. Lorenc, MD, PhD, CCDNo Financial Relationships to Disclose
Marjorie M. Luckey, MD, CCDConsulting: AmgenSpeakers’ Bureaus: Eli Lilly, P&G, sanofi-aventis, NovartisResearch: Roche, Amgen, P&G
Kenneth W. Lyles, MDResearch: Novartis, Alliance for Better Bone Health, AmgenConsulting: Novartis, P&G, Merck, Amgen,Kirin Pharmaceutical, GTx, Eli Lilly, GSK, Bone Medical Ltd,Wyeth, Osteologix
Sharmila Majumdar, PhDNo Financial Relationships to Disclose
Michael R. McClung, MDConsulting: Amgen, Eli Lilly, Merck, NovartisSpeakers’ Bureaus: Eli Lilly, NovartisResearch: Amgen, GSK, Eli Lilly, Merck, Novartis, P&G,
Tikeda
Jennifer Moore, PhDResearch: P&G
Sarah Morgan, MD, CCDConsulting: Amgen, Roche, Eli Lilly, P&GSpeakers’ Bureaus: Novartis, Roche/GSK, Sciele, Eli Lilly,P&GResearch: Roche
M. Zulf Mughal, MBChB, FRCPNo Financial Relationships to Disclose
Mary K. Oates, MD, CCDSpeakers’ Bureaus: NovartisResearch: GE Lunar, P&G

— 2009 Annual Meeting 7
Thomas Olenginski, MD, CCDResearch: Eli Lilly, Roche, AmgenSpeaker’s Bureaus: Novartis, Eli Lilly, sanofi-aventis, P&G,Wyeth, Amgen, Abbott
Steven Petak, MD, JD, CCDCME: GSK, Roche, sanofi-aventis, P&G, Novartis, Eli Lilly
Sergio Ragi-Eis, MD, CCD, CDTConsulting: sanofi-aventis, Eli Lilly, Merck Sharp & Dohme,RocheResearch: Amgen, Roche, GSK, Pfizer, Merck, BoehringerIlgenheim
Matthew Redinbo, PhDOwnership Interest: Exigent Pharmaceuticals
Bradford J. Richmond, MD, CCDOther: GE-Lunar
René Rizzoli, MDConsulting: Amgen, Danone, Eli Lilly, MSD, Nycomed,Roche/GSK, ServierSpeakers’ Bureaus: Amgen, Danone, MSD, Novartis,Roche/GSK, Servier
Harold N. Rosen, MD, CCDSpeakers’ Bureaus: Novartis, P&G
Brian Sabowitz, MD, CCDSpeaker: Eli Lilly, P&G
Diane Schneider, MD, MSc, CCDConsulting: Eli LillySpeakers’ Bureaus: Eli LillyResearch: P&G
John T. Schousboe, MD, MSConsulting: RocheResearch: Eli Lilly
Elliott Schwartz, MD, CCDSpeaker: Novartis, Eli LillyResearch: Eli Lilly, Merck, Amgen, Novartis, P&G, Unigene
Ego Seeman, MDAdvisory Board: Servier, sanofi-aventis, MSD, Eli Lilly,Novartis, GSK
Joseph Shaker, MD, CCDCME: Novartis
Elizabeth Shane, MDResearch: Novartis, Amgen, Eli Lilly
John A. Shepherd, PhD, CCD, CDTResearch: Roche, Eli Lilly, Hologic, GE-Lunar
Kathy M. Shipp, PT, MHS, PhDNo Financial Relationships to Disclose
Christopher R. Shuhart, MD, CCDStockholder: Cubist PharmaceuticalsGrant Recipient: Hoffman-LaRoche, Inc.
Stuart Silverman, MDConsulting: Merck, P&G, Roche, Novartis, WyethResearch: Eli Lilly, Merck, P&G, Roche, Novartis, WyethSpeaker’s Bureaus: Eli Lilly, Merck, P&G, Roche
Bonny Specker, PhDNo Financial Relationships to Disclose
S. Bobo Tanner, MD, CCDConsulting: Genetech, P&G, Biogen-IOECSpeakers’ Bureaus: Merck, P&G, sanofi-aventis, Wyeth,Amgen, Novartis, Roach, GSK, Eli LillyResearch: Roche, Genetech, Eli Lilly, Wyeth, CSL,Greer Pharmaceuticals
Rogene Tesar, PhD, CCD, CBDTConsulting: P&G
Laura Tosi, MDNo Financial Relationships to Disclose
Jill Vargo, MD, CCDSpeaker Bureaus: Eli Lilly, P&G, Centacor, Abbott,Genetech, Pfizer, sanofi-aventis, Roche, Novartis, GSKResearch: Abbott, Genetech, Roche, Eli Lilly, GSK, Novartis,Pfizer, Merck
Tanawat Vaseenon, MDNo Financial Relationships to Disclose
Tamara J. Vokes, MD, CCDSpeakers’ Bureaus: Novartis, GSK/RocheOwnership Interest: Merck, P&G
Sarah E. Warner, PhD, CCDNo Financial Relationships to Disclose
Sharon R. Wartenbee, RT(R)(BD), CDTNo Financial Relationships to Disclose
Nelson Watts, MD, CCDConsulting: Amgen, Eli Lilly, Novartis, P&G, sanofi-aventisSpeakers’ Bureaus: Amgen, Novartis, P&G, sanofi-aventisResearch: Amgen, Eli Lilly, Novartis, P&G, sanofi-aventis
Michael P. Whyte, MDConsulting: Enobia Pharma, CanadaResearch: Enobia Pharma, CanadaOwnership Interest: Merck
Susan E. Williams, MD, MS, CCDNo Financial Relationships to Disclose
Babette S. Zemel, PhDNo Financial Relationships to Disclose
Ekaterina Zivanovic, MD, MCH, CDTNo Financial Relationships to Disclose

8 — 2009 Annual Meeting
2009 Annual Meeting Award Winners
ISCD Dr. Oscar S. Gluck Humanitarian Award
Presented to an ISCD Member with a history of contributing tothe alleviation of human suffering, protection of life, outstanding
service to the community, or the promotion of health inunderserved populations – with no expectation of
compensation.
John A. Kanis, MDProfessor John Kanis, Professor at University ofSheffield, Sheffield, UK has an unparalleled bondwith osteoporosis as well as providing originalthought in broad areas of metabolic bonediseases. A Rheumatologist by training Professor
Kanis has been a thought leader in Paget’s disease epidemiologyand management; a thought leader in renal bone disease andhistomorphometry; and in the epidemiology of osteoporosis in aglobal aspect. He has led the worldwide community in definingosteoporosis by bone mass measurements before a fracture hasoccurred and in that regard launched bone mass measurementsand the World Health Organization’s (WHO) criteria (The “T”score). In doing so, Professor Kanis helped global healthcareeconomies to anticipate the economic burden that osteoporosisany government could anticipate and at the same time providedclinicians with a specific number to define osteoporosis and inthat regard helped launch one of the purposes of the ISCD.
In most recent commitments to the global clinical and economicapproaches to osteoporosis, Professor Kanis was the geniusbehind the development of validated risk factors for theprediction of fracture risk in the postmenopausal population(e.g. FRAX ™). In the context of the ISCD, Professor Kanis hasbeen a friend as well as critical colleague of all processes thatinfluence good thought and practice in osteoporosismanagement. Dr. Oscar Gluck, another great clinicalRheumatologist is given appropriate recognition of his owncontribution to ISCD and osteoporosis by having ProfessorKanis accept this humanitarian award in his name.
Ethel S. Siris, MDEthel Siris is The Tony Stabile Professor of ClinicalMedicine at Columbia University College ofPhysicians and Surgeons, New York, NY.
A Phi Beta Kappa graduate of Radcliffe College(Harvard) and an AOA graduate of Columbia
Medical School, Professor Siris has been an international leaderin the field of osteoporosis and other metabolic bone diseases.She has been a former President of the National OsteoporosisFoundation and is on the Board of Directors of the InternationalOsteoporosis Foundation. Professor Siris has been a championin advancing the clinical application of methodologies todiagnose and treat postmenopausal osteoporosis. She is theMedical Director of the National Osteoporosis Risk Assessment(NORA), the largest longitudinal population database evaluatingrisk factors for fracture worldwide. In recognition of herunwavering devotion and respect in this field, she was awardedan endowed chair in this field, a rarity at this level forrecognition in the field of osteoporosis. Professor Siris has been
recognized for her major contributions in Paget’s disease ofbone, has been a delegate for The White House Conference onAging, and an awardee of The American Medical Women’sAssociation for Osteoporosis. In giving The Oscar S. GluckHumanitarian Award to Professor Siris, the ISCD acknowledgesthe equal humanitarian aspects of Professor Siris’s professionalcareer.
ISCD Dr. Paul D. Miller Service Award
Presented to an ISCD Member for distinguished serviceand dedication to ISCD
Edward S. Leib, MD, CCDDr. Leib is a professor at the University ofVermont College of Medicine and an attendingphysician at Fletcher Allen Health Care (FAHC)specializing in Rheumatology & ClinicalImmunology. With a specific interest in
osteoporosis, he was instrumental in establishing theOsteoporosis Center at FAHC in 1990, and has remainedinvolved as the director of the Center. He has been an ISCDmember since 1997 and has served on, or led, numerousleadership committees over the last decade.
His activities with the ISCD are reflective of his commitment toeducation and quality. Not only is Dr. Leib faculty for theclinician Bone Densitometry Course, he currently, chairs theEducation Council. Additionally, he is a member of the ClinicianBone Densitometry Course Update, Continuing MedicalEducation and Faculty committees along with being a regionalrepresentative. His work as Co-Chair of the FacilityAccreditation Committee is helping to establish a qualitystandard among centers performing densitometry. As a memberof the Finance and International Relations Committee, he isassisting in ensuring the longevity of the Society and worldwidecollaborations with groups actively promoting the ISCD mission.The ISCD has greatly benefited from not only Dr. Leib’s serviceand dedication, but his skill in teaching and leadership. He has,for many years, been a willing and reliable advocate for theSociety deserving of recognition for his service andaccomplishments.
ISCD Technologist of the Year Award
Presented to an ISCD Technologist Member for distinguishedservice and dedication to the field of bone densitometry
Anita Colquhoun, MRT(N), CDTMs. Colquhoun is the charge technologist in theMultidisciplinary Osteoporosis Program at theWomen’s College Hospital in Toronto. She hasworked in all aspects of Nuclear Medicine, andspecializes in the field of bone densitometry. Her
affiliation with the Bone Mineral Group in Toronto as well asOsteoporosis Canada has allowed her to organize andparticipate in educational activities related to skeletal health fortechnologists and clinicians. She has been an ISCD certifieddensitometry technologist since 1997 and member of thetechnologist Bone Density Course faculty since 2000. Ms.

— 2009 Annual Meeting 9
Colquhoun has served on various ISCD committees over thelast 10 years, which is a demonstration of her commitment toaccomplishing Society goals, especially in the areas of educationand an international network.
In an effort to promote quality densitometry and educationalopportunities, she is Vice-Chair of the Faculty Committee, serveson the Technologist Bone Densitometry Update Committee andScientific Advisory Board. Ms. Colquhoun appreciates theimportance of international collaborative affiliations;consequently, she also serves on the International RelationsCommittee and is a Canadian Regional Representative. Hertireless effort and dedication to advancement of the Society inNorth America and internationally have been of great benefit.Her leadership activities as a member of the Board of Directorsand Management Committee member reflect her dedication tothe Society. Ms. Colquhoun is a dependable and devotedvolunteer who has generously offered her skills and passion tothe ISCD mission.
ISCD Clinician of the Year Award
Presented to an ISCD Clinician Member for distinguishedservice and dedication to the field of bone densitometry
Judith E. Adams, MBBS, FRCR, FRCPProfessor Adams: consultant musculoskeletalradiologist, Manchester Royal Infirmary (MRI);Professor Diagnostic Radiology, UniversityManchester (UM; since 1993). Involved in bonedensitometry since 1982 (26 years); established
one of the best equipped clinical service/research units inEurope, with comprehensive array of equipment [DXA (4),pQCT (2), pDXA (3), 4 QUS scanners; mobile research unithousing fan beam ‘C’ arm DXA & pQCT); access to whole bodyQCT]; over 100,000 scans performed in 70,000+ patient visits.
Professor Adams graduated in Medicine, University London(UCL/UCH), 1968. After medical posts, Addenbrooke’s Hospital,Cambridge, began radiology training Manchester (1972), joiningthe University in 1976. Has served on many local, national andinternational committees, including: Dean/Vice President RoyalCollege Radiologists (’93-’95), President UK Annual RadiologyCongress (’97, ’98), Chairman Osteoporosis Group, EuropeanSociety Skeletal Radiology (ESSR) (’97-’06), Clinical DirectorRadiology, MRI (’97-’00), Head Research School, Imaging Science& Biomedical Engineering UoM (’98-’04); Head of Training,Manchester Radiology Training Scheme (MRTS; largest in UK; 19trainees, 17 participating departments)(’93-’07).
She has 167 peer-reviewed publications, 23 invited reviews, 24book chapters, 3 invited editorships; served on five editorialboards and reviews regularly for 20 journals, including JCD. Hermain areas of research activity are children’s bone health, cysticfibrosis, growth hormone deficiency and vertebral fracturedetection. Since 1998 she has held £4.25 million collaborativeresearch grants; collaborated with International OsteoporosisFoundation (IOF) Vertebral Fracture Initiative (since 2002);endeavors to raise the profile amongst radiologists ofosteoporosis and the important role they play in diagnosis.Awarded Founders’ Gold Medal International Skeletal Society(ISS) 2007; member 2007 ISCD QCT Position Statement panel.
ISCD Global Leadership Award
Presented to an ISCD Member for distinguished service andleadership in the global promotion of the field of bone
densitometry and ISCD
Roman S. Lorenc, MD, PhD, CCDRoman S. Lorenc, MD, PhD, CCD graduated fromMedical School in Warsaw, Poland in 1961; since1968, MD, PhD. In 1972 defended AssociateProfessor Degree. Nominated in 1984 asProfessor of Medicine. Awarded by Fogarthy
Foundation, spent two years during post doctoral training inMadison, WI as a member of Professor De Luca’s researchgroup. His area of research effort was directed on calcium andphosphate metabolism and regulation in animal and humanmodels. Since 1984 chairs Department of Biochemistry andExperimental Medicine of the Children’s Health Institute inWarsaw, Poland where during last two years is working on theposition of scientific consultant. Prof. R. S. Lorenc served duringthe last twenty years in National and later on Scientific AdvisoryCommittee of International Foundation of Osteoporosis, Boardof Directors of International Society of Clinical Densitometryand in Poland as a founder and President of MultidisciplinaryOsteoporotic Forum. He is very deeply involved in local andinternational educational efforts related to diagnostic andtreatment of osteoporosis being a member of organizingcommittees and scientific board of several International andNational scientific meetings.
He actively participated in the evaluation and developmentdiagnostic of bone diseases and treatment of children andadolescence as well as in diagnostic of osteoporosis in adultpatients. He chairs the Faculty Committee of ISCD and serves asorganizer and faculty of several ISCD courses in Poland; speakerin several scientific meetings in Poland and other countriesaround the world. For the past 40 years Professor Lorenc hasparticipated in numerous osteoporosis clinical research studiesand has published several articles in this field. He lives inWarsaw, Poland and has two granddaughters.
Catalina Poiana, MD, PhD, CCD, FADr. Poiana is Associate Professor ofEndocrinology at the “Carol Davila” University ofMedicine and Pharmacy, Bucharest, Romania andSenior Endocrinologist in “C.I.Parhon” NationalInstitute of Endocrinology from Bucharest. She
has more than 15 years of experience and expertise in the fieldof Medical Teaching and Research and is author and coauthor inmore than 100 scientific papers.
She was acting as Principal Investigator in many RCT and asProject Assistant for “The European Research Area in Ageing”ERA-AGE, the EC Framework Six Program.
She is Fellow of the American College of Endocrinology since2005 and NAMS Menopause Practitioner since 2008.
Dr. Poiana is Clinical Certified Bone Densitometrist since 2000and Member in the International Relations Committee of ISCDsince 2006. She was approved as International Full ISCD Facultyfor BDC Clinician since 2006.
10 — 2009 Annual Meeting
She initiated and fully organized four ISCD Clinician BoneDensitometry Courses and ISCD Bone DensitometryCertification Exams (CCD), as well as a Technologist BoneDensitometry Course and Exam (CDT), in Bucharest, since2006. Open minded leader and honest team player, Dr. Poianahas successfully organized these courses along with therheumatologysts at the Research Center of the Pathology andTreatment of the Systemic Rheumatic Diseases (RCRD) – “Sf.Maria Hospital” in Bucharest.
Dr. Poiana was also Co-Chair of the first QuantitativeUltrasound Bone Densitometry Course hold last year inBucharest and co-author in the “Quantitative Ultrasound in theManagement of Osteoporosis: The ISCD Official Positions”.
She is also member in the Board of the Romanian Society ofEndocrinology as well as a member in good standing of teninternational scientific societies.
She lives in Bucharest and has a daughter who is a 5th yearmedical student.
ISCD Super Tech Award
Presented to an ISCD Technologist Member for exhibiting andmaintaining high standards as a densitometry
technologist
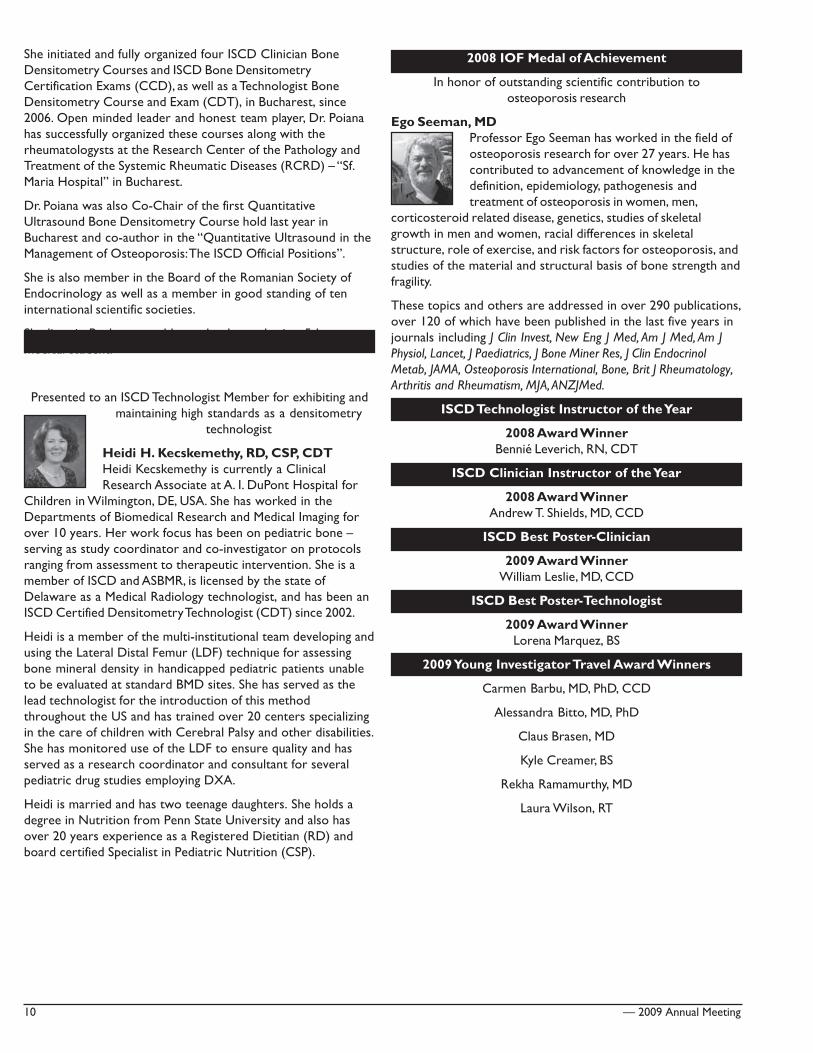
Heidi H. Kecskemethy, RD, CSP, CDTHeidi Kecskemethy is currently a ClinicalResearch Associate at A. I. DuPont Hospital for
Children in Wilmington, DE, USA. She has worked in theDepartments of Biomedical Research and Medical Imaging forover 10 years. Her work focus has been on pediatric bone –serving as study coordinator and co-investigator on protocolsranging from assessment to therapeutic intervention. She is amember of ISCD and ASBMR, is licensed by the state ofDelaware as a Medical Radiology technologist, and has been anISCD Certified Densitometry Technologist (CDT) since 2002.
Heidi is a member of the multi-institutional team developing andusing the Lateral Distal Femur (LDF) technique for assessingbone mineral density in handicapped pediatric patients unableto be evaluated at standard BMD sites. She has served as thelead technologist for the introduction of this methodthroughout the US and has trained over 20 centers specializingin the care of children with Cerebral Palsy and other disabilities.She has monitored use of the LDF to ensure quality and hasserved as a research coordinator and consultant for severalpediatric drug studies employing DXA.
Heidi is married and has two teenage daughters. She holds adegree in Nutrition from Penn State University and also hasover 20 years experience as a Registered Dietitian (RD) andboard certified Specialist in Pediatric Nutrition (CSP).
2008 IOF Medal of Achievement
In honor of outstanding scientific contribution toosteoporosis research
Ego Seeman, MDProfessor Ego Seeman has worked in the field ofosteoporosis research for over 27 years. He hascontributed to advancement of knowledge in thedefinition, epidemiology, pathogenesis andtreatment of osteoporosis in women, men,
corticosteroid related disease, genetics, studies of skeletalgrowth in men and women, racial differences in skeletalstructure, role of exercise, and risk factors for osteoporosis, andstudies of the material and structural basis of bone strength andfragility.
These topics and others are addressed in over 290 publications,over 120 of which have been published in the last five years injournals including J Clin Invest, New Eng J Med, Am J Med, Am JPhysiol, Lancet, J Paediatrics, J Bone Miner Res, J Clin EndocrinolMetab, JAMA, Osteoporosis International, Bone, Brit J Rheumatology,Arthritis and Rheumatism, MJA, ANZJMed.
ISCD Technologist Instructor of the Year
2008 Award WinnerBennié Leverich, RN, CDT
ISCD Clinician Instructor of the Year
2008 Award WinnerAndrew T. Shields, MD, CCD
ISCD Best Poster-Clinician
2009 Award WinnerWilliam Leslie, MD, CCD
ISCD Best Poster-Technologist
2009 Award WinnerLorena Marquez, BS
2009 Young Investigator Travel Award Winners
Carmen Barbu, MD, PhD, CCD
Alessandra Bitto, MD, PhD
Claus Brasen, MD
Kyle Creamer, BS
Rekha Ramamurthy, MD
Laura Wilson, RT

— 2009 Annual Meeting 11
Scientific Exhibits
MEDTRONICThursday, March 12, 12:30 p.m. – 1:30 p.m.
Southern IV & V
KYPHON® Balloon Kyphoplasty –Treating Vertebral Compression Fractures and Improving Quality of Life
1. Vertebral Osteoporosis and Vertebral Compression Fractures (VCFs)2. Consequences of VCFs3. Management of VCFs4. New Clinical Results: Comparing Balloon Kyphoplasty to Non-Surgical Management for the Treatment of Acute Vertebral
Compression Fractures
Michael Ziebelman, MD and Charles A. Cefalu, MD
This session does not offer CME or CE credit. This session is supported by a grant from Medtronic.
AMGENThursday, March 12, 2:00 p.m. – 5:00 p.m.
Northern E-4
Exploring New Insights in Bone BiologyExhibit objectives: To provide recent pre-clinical data with RANL Ligand inhibition; review new insights into the bone biology;role of RANKL/RANK in osteoclast-mediated bone loss RANKL/RANK pathway; and review the current unmet medical need withcurrent therapies.
Exhibit Topics:1. Biotechnology overview2. New insights into the bone biology, role of RANKL/RANK in osteoclast-mediated bone loss RANKL/RANK pathway3. Unmet medical need with current therapies
a. Significant opportunity remains to improve osteoporosis outcomesb. Adherence to oral bisphosphonates is generally suboptimal, resulting in reduced patient outcomesc. Currently available osteoporosis therapies are associated with tolerability and safety concerns
4. Strategies for improving the management of postmenopausal osteoporosisa. Evaluate postmenopausal women for risk and screen patients appropriatelyb. Follow NOF recommendations for initiating pharmacologic therapy
P&GFriday March 13, 12:00 p.m. – 5:30 p.m.
Northern E-4
Clinical Insights into Osteoporosis: An Interactive Scientific ExhibitExhibit Objectives: To be able to identify risk factors for osteoporosis and guidelines for treatment; discuss fracture dataavailable for risedronate in the prevention and treatment of postmenopausal osteoporosis and glucocorticoid inducedosteoporosis; describe different components of bone strength; discuss mechanism of action of bisphosphonates.
Exhibit Topics:1. Fracture risk assessment2. Treatment guidelines3. Fracture efficacy of risedronate in PMO and GIO4. Components of bone strength5. Mechanism of action

12 — 2009 Annual Meeting
Exhibit Hall HoursWednesday, March 11, 2009 – Friday, March 13, 2009
Exhibit Hall and Poster Hours
Posters on Display Wednesday through Friday
Wednesday, March 11, 2009 6:00 p.m. - 7:00 p.m.
Thursday, March 12, 2009 10:00 a.m. - 4:00 p.m.
Authors Present 1:30 p.m. - 2:30 p.m.
Friday, March 13, 2009 11:00 a.m. - 4:00 p.m.
Additional Educational OpportunitiesSaturday, March 14, 2009
Pediatric Bone Densitometry Course Northern E-2
12:30 p.m. - 1:00 p.m. Registration
1:00 p.m. - 5:30 p.m. Course
Vertebral Fracture Assessment Course Southern IV & V
12:30 p.m. - 1:00 p.m. Registration
1:00 p.m. - 6:15 p.m. Course
— 2009 Annual Meeting 13
Best Abstract – Clinician
002 William Leslie, MD, CCDImputation of Absolute Ten Year Osteoporotic Fracture Rates from Hip Fractures:A Clinical Validation Study
Best Abstract – Technologist
016 Lorena Marquez, BSEstimated variables from hip and spine scans compared to measured variables from whole body scans
Best Abstracts
The ISCD thanks the following abstract reviewers:
Robert D. Blank, MD, PhD, CCDLorna J. Cole, CDTAnita Colquhoun, MRT(N), CDTSylvia Hom, RT(R)(D), CBDTLawrence G. Jankowski, CDTElaine M. Ledoux, RT(R)(BD), CBDTEdward S. Leib, MD, CCDFergus E. McKiernan, MDBradford J. Richmond, MD, FACR, CCDRussell J. Stankiewicz, MD, CCDDee M. Steinberg, CBDTNellie L. Vallarta-Ast, RT(R)Sunil J. Wimalawansa, MD, PhD, DSc.
ISCD Acknowledgment of Abstract Reviewers

14 — 2009 Annual Meeting
Poster Number 016 Young Investigator Awardees
Estimated Variables from Hip and Spine Scans Compared to Measured Variables from Whole Body Scans
Lorena Marquez, University of California San Francisco; Bo Fan, University of California San Francisco; Joanne Dorgan, Fox ChaseCancer Center; John Shepherd, University of California San Francisco
Percent fat variables for the whole body have usually been measured using only whole body DXA scans. New applications have beendeveloped to estimate whole body, android, and gynoid percent fat from hip and spine scans alone. The aim of this study is to comparethe estimates for whole body, gynoid, and android percent fat derived from spine and hip scans to those same measures from wholebody scans. A total of 104 female subjects received whole body, hip, and spine DXA scans on GE Prodigy scanners. They ranged from24 to 30 years old (mean=27 +/- 1.2). 90 subjects had estimates on whole body percent fat, 85 had android percent fat estimates, and89 contained gynoid percent fat estimates. The ethnic breakdown for this population was 91 Caucasians, 9 African Americans, 3Hispanics, and 1 Asian. Missing estimated values were due to either a lack of ethnic reference data or an android %fat greater than 61%. The number of patient with low (<18.5 kg/m2), medium (18.5-24.9 kg/m2), and high (>25 kg/m2) BMIs were 3, 54, and 44respectively. All images were centrally analyzed using Lunar Prodigy enCORE v11.4. The student’s t-test was used to test for significantdifferences in the whole body and estimates from the spine and hip scans. Bland-Altman analysis was used to investigate anydisagreements and trends.We found that there was a high correlation between the whole body scan variables and the estimatesderived from the spine and hip scans. The correlation coefficient value ranged from .90 (A/G) to .97(android). There was no differencebetween the two measurements for whole body percent fat, android percent fat and A/G ratio (p=0.434, p=0.564, and p=0.058,respectively). The hip/spine gynoid percent fat estimates were 1 % greater than the whole body gynoid percent fat (p=0.0046). Therewas no BMI effect for the difference between the two measurements for whole body percent fat, but there was a BMI effect for the A/Gratio. We conclude that dedicated spine and hip scans can accurately estimate whole body composition values across a broad range ofBMIs values.
Poster Number 002 Oral Session
Imputation of Absolute Ten Year Osteoporotic Fracture Rates from Hip Fractures: A Clinical Validation Study
William Leslie, University of Manitoba; Lisa Lix, University of Saskatchewan
The WHO fracture risk assessment system (FRAX) allows for the use of country-specific fracture data to explicitly calibrate the tool forestimation of 10-year absolute hip and osteoporotic fracture rates in the population being assessed. Although the use of population-based hip and non-hip fracture data (clinical spine, humerus, wrist) is clearly desirable, the WHO has proposed a method forimputation of osteoporotic fracture rates from hip fractures alone. The objective of this study is to objectively evaluate this procedurein a large clinical population.38,784 women age 47.5 years or older at the time of baseline femoral neck DXA were identified in adatabase containing all clinical results for the Province of Manitoba, Canada. Health service records were assessed for the presence ofnon-trauma osteoporotic fracture codes subsequent to BMD testing (431 hip fractures and 1,409 spine, wrist, or humerus fractures).10 year hip and osteoporotic fracture rates were estimated from the Kaplan-Meier method using up to 10 years of continuous data.The population was stratified by age (50 to 90, 5 year width strata) and again by femoral neck T-scores (0.0 to -4.0, 0.5 SD widthstrata). Within each stratum, the ratio of hip to osteoporotic fractures (Rh/o) was calculated and compared to the predicted ratiofrom the FRAX website using the mean age and T-score for that stratum (Swedish FRAX tool, no clinical risk factors).As shown in thefigure, increasing age was associated with greaterpredicted Rh/o (youngest 0.07 vs oldest 0.41) andobserved Rh/o (youngest 0.10 vs oldest 0.48). LowerT-scores were associated with greater predicted Rh/o(highest 0.04 vs lowest 0.71) and observed Rh/o(highest 0.06 vs lowest 0.44). There was a strongpositive correlation between predicted and observedRh/o (all p<.001, r2 .89-.92). For 14 of the 18 strata,the predicted Rh/o was within the 95% CI (estimatedby Monte Carlo simulation) for the observed Rh/o.Inconclusion, the WHO method for imputation ofosteoporotic fracture rates from hip fractures alone isbroadly consistent with clinical observational data.Since collection of population-based hip fracture datais considerably easier than collection of non-hipfracture data, this supports the current emphasis onusing hip fractures as the preferred site for FRAXmodel calibration, though whenever possible non-hipfracture data should be analyzed to confirm theimputation and calibration for osteoporotic fracturerates.

— 2009 Annual Meeting 15
Poster Sections – Listing by Category
Abstracts Presented in Thursday, March 12Oral Session ................................................................... 18001 Bone Micro-Architecture Assessed by TBS Predicts Hip, Clinical Spine
and All Osteoporotic Fractures Independently of BMD in 22234Women Aged 50 and Older: The Manitoba Prospective Study.Didier Hans, Bone Diseases Center - Lausanne University Hospital
002 Imputation of Absolute Ten Year Osteoporotic Fracture Rates fromHip Fractures: A Clinical Validation Study. William Leslie, University ofManitoba
003 Prevalence of Osteopenia and Osteoporosis in Patients UndergoingJoint Replacement Surgery. Jennifer Moore, Florida OrthopaedicInstitute
004 Long Term Mortality After Osteoporotic hip Fracture in Chiang Mai,Thailand. Tanawat Vaseenon, Orthopaedic Surgeon,ChiangmaiUniversity Hospital, Chiangmai,Thailand
005 Use of QUS Bone Evaluation in Clinical Practice in Romania.Carmen Barbu, Carol Davila University
Young Investigator Awardees ....................................... 19010 Clinical Impact of Revised Osteoporosis Treatment Guidelines.
Laura Wilson, Bone & Mineral Unit, Oregon Health & ScienceUniversity, Portland, OR
011 Association of Luteinizing Hormone Receptor Polymorphism withBone Mineral Density in Men – Results from Odense AndrogenStudy. Claus Brasen, MD, Clinical Biochemistry, Odense UniversityHospital, Denmark
012 Genistein Aglycone for the Management of Secondary Osteoporosis:An Experimental Study. Alessandra Bitto, University of Messina
013 High Dose Vitamin D Supplementation in the Elderly is Both Safe andEfficacious. Rekha Ramamurthy, University of Wisconsin, Madison, WI
014 Variables that Predict Tibial Bending Strength in Pre-MenopausalWomen: Relative Importance of vBMD? Kyle Creamer, RadiologyTechnician, Virginia Tech, Blacksburg, VA
015 Use of QUS Bone Evaluation in Clinical Practice in Romania. Same as005 – NO POSTER; presented only in oral session
016 Estimated Variables from Hip and Spine Scans Compared toMeasured Variables from Whole Body Scans. Lorena Marquez,University of California San Francisco
Assessment of Bone Architecture/Microstructure .... 21100 Correlation Between Microdensity and Microvascularisation of the
Glenoid. Sophie Abrassart, Hopital Universitaire de Genève
101 Effect of Hand Dominance on Bone Microarchitecture at the DistalRadius as Determined Using High Resolution Magnetic ResonanceImaging. Michael Kleerekoper, St. Joseph Mercy Reichert HealthCenter
102 Radiographic Texture Analysis of Densitometric Calcaneal Images –Relationship to Clinical Characteristics and Fragility. Tamara Vokes,University of Chicago
103 Multiparametric Imaging of Bone Architecture: A Cadaveric Study.Noah Allen, University Hospital Cincinnati
104 Lumbar Spine Micro-Architecture In Caucasian French WomenDerived From DXA: TBS Normative Data. Remy Dufour, CliniqueRhône – Durance
Assessment of Fracture Risk ........................................ 22105 Skeletal Health Among African Americans with Rheumatoid Arthritis:
Associations with Disease Activity and Application of the WHOFracture Risk Assessment Tool (FRAXTM) and National OsteoporosisFoundation Guidelines. Jeffrey Curtis, University of Alabama atBirmingham
106 Clinical Impact of Using T-Scores from FRAX® Patch to EstimateFracture Risk with FRAX®. Michael McClung, Oregon OsteoporosisCenter
107 Validation of Illuminatus Based Ten-Year Fracture Risk Against theFRAX® Paper Chart Based Ten-Year Fracture Risk Assessment. TomSanchez, Norland—a CooperSurgical Company
108 The Risk of Vertebral Fractures in Predicting Ten-Year Probability ofOsteoporotic Fracture in Southern Chinese Postmenopausal Women:The Hong Kong Osteoporosis Study. Eva Yuet-Wah Chu,Postdoctoral fellow of Medicine, University of Hong Kong, HK
109 Bone Mineral Density In Postmenopausal Women With OsteoporoticFractures. Vladyslav Povoroznyuk, Institute of Gerontology AMSUkraine
110 Impact of Lifestyle Risk Factors on Bone Mineral Density. MohammadAlmatari, ABM University Trust
111 Is Withholding Osteoporosis Medication after Fracture SometimesRational? A Comparison of the Risk for Recurrent Fracture VersusDeath. Jeffrey Curtis, University of Alabama at Birmingham
Central DXA .................................................................. 24112 Bilateral Hip Scanning Leads to Additional Testing That May Benefit
the Patient. Diana Heckadon, HealthEast Clinics
113 Effect of Spinal Height on Spinal Bone Mineral Density Between Withand Without Hips Flexion. Yi-Shi Hwua, Central Taiwan University ofSc Science and Technology, Taiwan
114 Supine vs. Sitting Forearm Measurement in a Chinese Population.Jinhua Zhao, The First People’s Hospital, Shanghai Jiaotong University
115 Dual-energy X-ray Absorptiometry (DXA): Frequency of Difficultieswith Spine and Femur Measurements. Malachi McKenna, St. Vincent’sUniversity Hospital
116 Accurate Measurement of Hip Axis Length. Eric Lee, University ofCalifornia, San Francisco
117 Correlation of Bone Mineral Density (BMD) of the Lumbar Spine,Femur and Radius by Dual X-Ray Absorptiometry (DXA) in ThaiPerimenopausal and Menopausal Women, Who Received the DXAMeasurement in Faculty of Medicine, Chiang Mai University, Thailand.Sirianong Namwongprom, Intructor of Nuclear Medicine, Chiang MaiUniversity, Thailand
118 Disagreement in the Diagnosis of Osteopenia and Osteoporosisin theSpine and Hip Regions. Diana Wiluzanski, Centroseo
119 Reference Data of Forearm Bone Mineral Density in HealthyIndonesian Women. Gunawan Tirtarahardja, Jakarta OsteoporosisCenter, Medistra Hospital
120 Implementation of FRAX in a Clinical Practice. Are we missingsomething? Jorge Ferreira, Consultorio de Radiodiagnostico deOdivelas
121 Bone Density Analysis Using Dual Energy X-Ray (DXA) BoneAbsorptiometry in Clinical Investigation. Claudia Maksoud, CEPEM
122 Which Vertebrae Should be Included in Reporting Spine BoneDensity by DEXA? Ruth Freeman, Albert Einstein College ofMedicine
123 Re-Training Technologists Improves Patient Positioning for DXA andPrecision. Chanika Sritara, Ramathibodi Hospital, Mahidol University
124 Use of External Quality Control Site for Validation of DXA Data.Sunil Wimalawansa, UMDNJ-RWJMS
125 The Importance of Lean Body Mass in Bone Mineral Density of Post-Menopausal Women. Mee-Ran Kim, The Catholic University of Korea
126 Body Composition Assessment Using Siri Underwater EquivalentPercent Fat Assessed by Norland Equipment. Chad Dudzek,Norland—a CooperSurgical Company
127 Cross Calibration of Whole Body Scans Between GE-Lunar andHologic Systems. Bo Fan, Department Radiology, University ofCalifornia San Francisco
128 Lateral Distal Femur Bone Mineral Density: Application in SpinaBifida, Another Pediatric Population at Risk. Heidi Kecskemethy, A.I.duPont Hospital for Children
Page Page

16 — 2009 Annual Meeting
129 Evaluation of the Android/Gynoid Regions for Hologic PediatricWhole Body Scans. Mary Sherman, Sr. Radiologic Technologist, UCSF,San Francisco, CA
130 Are HSA and HAL Useable Analyses in Pediatric Populations? LiWang, University of California, San Francisco
131 Performing Densitometry on Persons with Disabilities and/or MobilityLimitations. Sparkle Williams, VA Palo Alto Medical Center, Palo Alto,CA
132 Do Bone Bars on Radiographs Predict Low Bone Mineral Density.Sarah Morgan, The University of Alabama at Birmingham
133 Bone Mineral Density of Male Athletes with Vitamin D Deficiency inQatar. Chi-Kei Li, Aspetar - Qatar Orthopaedic and Sports MedicineHospital
134 Impact of Decreasing Medicare Reimbursement on Bone MineralDensity Testing and Osteoporosis Health Care. Beth Mitchell, Eli Lillyand Company
Clinical Trials .................................................................. 29135 Bone Marker Responses to Exercise Parameters: Relative Effectiveness
of Mechanical,Temporal, and Hormonal Stimulation. Katarina Borer,School of Kinesiology, The University of Michigan
136 Osteoporosis in Sarcoidosis Patients IOF WCO No P615SA-Bangkok.Violeta Vucinic, Medical School Belgrade, Clinical Center, Serbia
137 Antifracture Efficacy of Combined Treatment with Alendronate andAlfacalcidol for Osteoporotic Vertebrae in Early-Phase Treatment: aPreliminary Report. Naohisa Miyakoshi, Orthopedic Surgery, AkitaUniversity
138 Comparison of BMD Responders as Determined by Least SignificantChange in Women Transitioned to Denosumab or ReceivingContinued Alendronate. D Kendler, Clinical Research Centre
139 ACE-011, a Soluble Activin Receptor Type IIA IgG-Fc fusion Protein,Increases BMD in Postmenopausal Healthy Women. Niels Borgstein,Acceleron Pharma
Epidemiology.................................................................. 31140 Prevalence and Risk Factors for Osteoporosis in Individuals with
Paralysis. Cristina Sadowsky, The Hugo W. Moser Research Instituteat Kennedy Krieger, Baltimore, MD
141 Edentulism as a Predictor of Osteoporosis Among PostmenopausalBahraini Women. Shehab Alsawy, Arabian Gulf University
142 Effectiveness of Bisphosphonates for the Reduction of ClinicalFractures – An Observational Study. Abby Abelson, Cleveland Clinic
143 Usefulness of Armspan in Screening for Undiagnosed VertebralFractures: JPOS Study. Junko Tamaki, Kinki Uni. Sch of Med.
144 Under-Estimation and Under-Treatment of Osteoporosis: The HalvesPhenomenon. Chih-Hsing Wu, National Cheng Kung UniversityMedical Center
145 Increasing Incidence of Hip Fracture in Chiang Mai, Thailand. PrasitWongtriratanachai, Instructor, Chiang Mai University
146 Relationship of Bone State and Hormonal Status in Men. VladyslavPovoroznyuk, Institute of Gerontology AMS Ukraine
147 Reproductive Parameters and Fractures Prevalence in 700 WomenTreated for Osteoporosis. Catalina Poiana, Carol Davila University ofMedicine and Pharmacy, Bucharest, Romania
148 Ultrasound Densitometry Evaluation In Postmenopausal WomenWith Colles’ Fracture. Vladyslav Povoroznyuk, Institute ofGerontology AMS Ukraine
149 Ultrasound Densitometry of the Calcaneus In Children andAdolescents of Ukraine. Vladyslav Povoroznyuk, Institute ofGerontology AMS Ukraine
Peripheral DXA ............................................................. 33150 A Cross-Sectional Association of Phalangeal Bone Mineral Density
Versus Hip Bone Mineral Density with Osteoporosis and Non-Vertebral Fracture. Denise von Muhlen, University of California,San Diego
Prevention and Treatment of Osteoporosis ................ 33151 Evaluation of Different Assessment Tools in the Determination of
Treatment Thresholds for Osteoporotic Fractures – The Hong KongOsteoporosis Study. Eva Yuet-Wah Chu, Postdoctoral fellow ofMedicine, University of Hong Kong, HK
152 Bisphosphonate Therapy in Fragility Fractures. Alan Highcock,Speciality Registrar
153 Osteoporosis-Related Nonvertebral Fracture Risk Reduction Vs.Hitoric Control at Two Years with Risedronate 150 mg Once-A-Month. Nelson Watts, University of Cincinnati
154 Risedronate 150 mg Once a Month in the Treatment ofPostmenopausal Osteoporosis: 2 Year Efficacy and Safety Data.Michael McClung, Oregon Osteoporosis Center
155 The Efficacy and Tolerability of a Monthly Dosing Regimen of 75 mgRisedronate Dosed on 2 Consecutive Days a Month for theTreatment of Postmenopausal Women with Osteoporosis – 2 YearStudy Results. Michael McClung, Oregon Osteoporosis Center
156 Treatment with Risendronate and its Effect on PostmenopausalWomen. Galesanu Corina, Professor of Endocrinology, University ofMedicine and Pharmacy, Iasi
157 Variations in Bone Mineral Density with Once-Yearly i.v. ZoledronicAcid 5 mg: Retrospective Subgroup Analysis of HORIZON RecurrentFracture Trial. Peter Mesenbrink, Novartis PharmaceuticalsCorporation
158 Male Patients with Idiopathic Osteoporosis and Long TermAlendronate Care. Miro Cokolic, UKC Maribor
159 Two-Year Results of Odanacatib (MK-822) Treatment inPostmenopausal Women with Low Bone Mineral Density. CarolynHustad, Merck & Co., Inc.
160 Treatment Assessment with Strontium Ranelate in PostmenopausalOsteoporosis by Dual X-ray Absorptiometry. Galesanu Corina,Professor of Endocrinology, University of Medicine and Pharmacy, Iasi
161 Advantageous Effect of TNA-alfa Inhibitors on the Osteoporosis ofAnkylosing Spondylitis Patients. Éva Lányi, Polyclinic of theHospitaller Brothers’ of St. John in God in Budapest
162 Genistein Aglycone Effectively Manages Postmenopausal Bone Loss.Francesco Squadrito, University of Messina
163 Do the Effects of Nitric Oxide Donor Nitroglycerin Mediate throughIGF-1? Sunil Wimalawansa, UMDNJ-RWJMS
164 Calcium and Vitamin D Suppress of Bone Resorption Markers inElderly Women More Effectively than Either Agent Alone. SunethraDevika Thomas, Trainee (resident) Chemical Pathologist SA Pathology
165 Cholecalciferol is More Effective Than Ergocalciferol to IncreaseSerum 25(OH)D. Diane Krueger, UW Osteoporosis Clinical ResearchProgram
166 25(OH)D Measurement: Deja vu All Over Again? Neil Binkley, UWOsteoporosis Clinical Research Program
167 Does Vertebroplasty Lead to Osteoporosis Diagnosis and/orTreatment? Robert Adler, McGuire Veterans Affairs Medical Center
QCT/Peripheral QCT .................................................... 38168 The Effects of Exercise and Physical Activity Participation on
Geometric Properties of Bone in Postmenopausal Women: aSystematic Review of pQCT Studies. Celeste Hamilton, Women’sCollege Hospital, Toronto ON
169 Sample Size Considerations for Clinical Trials of AntiresorptiveTherapies Using Quantitative Computed Tomography. ThomasFuerst, Synarc, Inc.
170 Multivariate Correlations between Quantitative ComputedTomography Parameters and Femoral Strength Change over 12Months in Osteoporotic Postmenopausal Women ReceivingIbandronate or Placebo. Harry Genant, University of California SanFrancisco
Page Page
— 2009 Annual Meeting 17
Ultrasonometry ............................................................. 38171 Precision Study of Various QUS Devices Compared with DXA Data in
Korean Women. Seoung-Oh Yang, Eulji University Hospital
Other ............................................................................... 39172 Diabetes Mellitus, Osteoporosis and Non-vertebral Clinical Fractures:
Related Factors. Maria Pippa, Hospital Heliopolis
173 Clinical and Laboratorial Factors Related to High Bone Mineral Density.Maria Pippa, Hospital Heliopolis
174 High Bone Mineral Density: A Comparative Analysis of AssociatedClinical Factors. Maria Pippa, Hospital Heliopolis
175 Body Composition of Collegiate Swimmers and Baseball PlayersMeasured with iDXA. Mary Oates, Marian Osteoporosis Center
176 Body Composition Precision with the Lunar iDXA. Howard Barden,GE Healthcare Lunar
177 Body Composition Analysis by Dual-energy X-ray Absortiometry(DXA) in Underweight, Normal, Overweight and Obese MexicanNutrition College Students. Raúl Pineda, Pindel Diagnosis
178 In Vitro Disintegration Differences Between Branded and GenericWeekly Alendronate Sodium Tablets (70mg) Available in the UnitedStates. Richard Dansereau, Procter & Gamble Pharmaceuticals
Page

18 — 2009 Annual Meeting
Poster Number 001 Oral Session
Bone Micro-Architecture Assessed by TBS Predicts Hip, Clinical Spine andAll Osteoporotic Fractures Independently of BMD in 22234 Women aged50 and Older: The Manitoba Prospective Study
Didier Hans, Bone Diseases Center - Lausanne University Hospital; Andrew Goertzen,University of Manitoba; Marc-Antoine Krieg, Bone Diseases Center - LausanneUniversity Hospital; William Leslie, University of Manitoba
BMD as assessed by DXA constitutes the gold standard for osteoporosis diagnosis.However, it does not take into account deterioration in bone micro-architecture.Trabecular Bone Score (TBS), a new grey-level texture measurement that can beextracted from the DXA image, correlates with 3D parameters of bone micro-architecture. Previous cross-sectional studies reported the ability of spine TBS todiscriminate fractured women from age- and BMD-matched controls. The aim of ourstudy was to prospectively evaluate the ability of lumbar spine TBS to predictosteoporotic fractures.22,234 women age 50 years and older at the time of baselinehip and spine DXA were identified in a database containing all clinical results for theProvince of Manitoba, Canada. Health service records were assessed for the presenceof non-trauma osteoporotic fracture codes subsequent to BMD testing. Lumbarspine TBS was derived by the Bone Disease Unit, University of Lausanne, for eachspine DXA examination using anonymized files (blinded from clinical parameters andoutcomes). We used Cox proportional hazard regression to model the hazard offirst hip, spine or any osteoporotic fracture (hip, clinical spine, humerus, forearm).Age-adjusted HRs for fracture per SD decrease in TBS and/or BMD are reported.Incremental gain in prediction information when TBS was added to age and BMDwas assessed using the log-likelihood ratio test.The mean age of the population was65.0 ± 9.5 y and the numbers of fractures during mean 4.6 y of follow up were: allosteoporotic 946 (4.3%), hip 194 (0.9%) and clinical spine 297 (1.3%). Significantlylower spine BMD, total hip BMD and spine TBS parameters were found in fracturethan non fracture women for all fracture definitions (all p<.0001). Correlationbetween spine BMD and spine TBS was modest (r=.32) and less than correlationbetween spine and hip BMD (r=.72), consistent with a skeletal parameter largelyunrelated to BMD. Spine BMD and TBS predicted fractures equally well andindependently. Total hip BMD was the best predictor of hip fracture but addition ofspine TBS significantly improved hip fracture prediction.In conclusion, we havedemonstrated that spine TBS predicts fractures (hip, clinical spine and allosteoporotic). Furthermore, TBS provided information that was independent ofspine and hip BMD. Combiningthe TBS micro-architectureindex with BMD fromconventional DXAincrementally improvedfracture prediction inpostmenopausal women.
Poster Number 002 Oral Session
Imputation of Absolute Ten Year Osteoporotic Fracture Rates from HipFractures: A Clinical Validation Study
William Leslie, University of Manitoba; Lisa Lix, University of Saskatchewan
The WHO fracture risk assessment system (FRAX) allows for the use of country-specific fracture data to explicitly calibrate the tool for estimation of 10-yearabsolute hip and osteoporotic fracture rates in the population being assessed.Although the use of population-based hip and non-hip fracture data (clinical spine,humerus, wrist) is clearly desirable, the WHO has proposed a method for imputationof osteoporotic fracture rates from hip fractures alone. The objective of this study isto objectively evaluate this procedure in a large clinical population.38,784 womenage 47.5 years or older at the time of baseline femoral neck DXA were identified ina database containing all clinical results for the Province of Manitoba, Canada. Healthservice records were assessed for the presence of non-trauma osteoporotic fracturecodes subsequent to BMD testing (431 hip fractures and 1,409 spine, wrist, orhumerus fractures). 10 year hip and osteoporotic fracture rates were estimated fromthe Kaplan-Meier method using up to 10 years of continuous data. The populationwas stratified by age (50 to 90, 5 year width strata) and again by femoral neck T-scores (0.0 to -4.0, 0.5 SD width strata). Within each stratum, the ratio of hip toosteoporotic fractures (Rh/o) was calculated and compared to the predicted ratiofrom the FRAX website using the mean age and T-score for that stratum (SwedishFRAX tool, no clinical risk factors).As shown in the figure, increasing age wasassociated with greater predicted Rh/o (youngest 0.07 vs oldest 0.41) and observedRh/o (youngest 0.10 vs oldest 0.48). Lower T-scores were associated with greaterpredicted Rh/o (highest 0.04 vs lowest 0.71) and observed Rh/o (highest 0.06 vslowest 0.44). There was a strong positive correlation between predicted andobserved Rh/o (all p<.001, r2 .89-.92). For 14 of the 18 strata, the predicted Rh/owas within the 95% CI (estimated by Monte Carlo simulation) for the observed Rh/o.In conclusion, the WHO method for imputation of osteoporotic fracture ratesfrom hip fractures alone is broadlyconsistent with clinical observationaldata. Since collection of population-based hip fracture data isconsiderably easier than collectionof non-hip fracture data, thissupports the current emphasis onusing hip fractures as the preferredsite for FRAX model calibration,though whenever possible non-hipfracture data should be analyzed toconfirm the imputation andcalibration for osteoporotic fracturerates.
Poster Number 003 Oral Session
Prevalence of Osteopenia and Osteoporosis in Patients Undergoing JointReplacement Surgery
Jennifer Moore, Florida Orthopaedic Institute; Thomas Bernasek, Florida OrthopaedicInstitute; Mark Frankle, Florida Orthopaedic Institute; Melissa Levering, Foundation forOrthopaedic Research and Education; Derek Pupello, Foundation for OrthopaedicResearch and Education
The purpose of this study was to determine the prevalence of osteopenia andosteoporosis in a population of patients undergoing joint replacement surgery. AfterInstitutional Review Board approval was obtained, we prospectively enrolled 273patients who were scheduled for joint replacement surgery. Twenty-eight patientswere excluded due to age (< 50 years) leaving 245 patients for our study. Patientsunderwent a dual energy x-ray absorptiometry (DXA) scan prior to their surgery.Age, gender and T-scores were collected for each patient. We classified our patientsaccording to the World Health Organization criteria with normal (at or above 1.0SD), osteopenic (between -1 and -2.5 SD), and osteoporotic (below -2.5 SD). We had135 female patients and 110 male patients. Of the female patients, 29% wereconsidered osteoporotic with a high fracture risk, 40% were considered osteopenic,and 30% were considered normal. Of the male patients, 8% were consideredosteoporotic with a high fracture risk, 50% were considered osteopenic, and 42%were considered normal. We believe this to be the first study showing the prevalencerates of osteoporosis and osteopenia among patients undergoing joint replacement.Orthopaedic surgeons should be aware of the prevalence of osteopenia andosteoporosis in patients indicated for joint replacement surgery.
Poster Number 004 Oral Session
Long Term Mortality After Osteoporotic Hip Fracture in Chiang Mai,Thailand
Tanawat Vaseenon, Orthopaedic Surgeon,Chiangmai UniversityHospital,Chiangmai,Thailand; Sirichai Luevitoonvechkij, OrthopaedicSurgeon,Chiangmai University Hospital,Chiangmai,Thailand; Sattaya Rojanasthien,Orthopaedic Surgeon,Chiangmai University Hospital,Chiangmai,Thailand
Aim: There exists limited data in the literature regarding the long term mortality afterhip fracture in Thailand. The purpose of this study was to investigate 10 yearsmortality and associated factors of osteoporotic hip fracture in Chiang Mai,Thailand.Methods: We performed a prospective cohort study of mortality andassociated factors on the mortality of 632 patients, who had sustained the hipfracture and received treatments in Chiang Mai University hospital from 1998 to2003. There were 367 patients (mean age 74 years) who met eligible criteria, definedas aged >50, hip fractures caused by simple fall and Singh index of 3 or less. Theywere followed up for 4 to 10 years.Results: The 3-, 6-, 12-, 24-, 36-, 60-, 96-, and 120-month mortality rates were 10%, 14%, 18%, 27%, 32%, 45%, 55%, and 68%respectively. The median survival time was 6 years after fracture. Associated factors ofosteoporotic hip fracture which correlated to mortality were male gender, aged >70and non-operative treatment. Mortality in male was higher than in female. The hazardratio for gender was 1.72(95% CI, 1.20-2.50). Mortality of patients aged >70 washigher when compared with patients aged <70. The hazard ratio was 1.45(95% CI,1.03-2.03). In addition, mortality of non-operative treatments was higher thanoperative treatments. The hazard ratio was 1.81(95% CI, 1.29-2.54). Location offractures, method of operations, calcium and vitamin D supplementations, and takingof antiresorptive agents did not influence mortality.Conclusion: Mortality afterosteoporotic hip fracture increased significantly in the first two years and was about12 times higher than the age-related populations withoutfracture. The median survivaltime was 6 years after fracture.Increased mortality wasassociated with non-operativetreatment, male gender andaged >70.Keywords:osteoporosis, hip fracture, longterm, mortality, Chiang Mai,Thailand, median survival,associated factorsP562SAOsteoporosis Int (2008) 19(Suppl. 2)

— 2009 Annual Meeting 19
Poster Number 005 Oral Session
Use of QUS Bone Evaluation in Clinical Practice in Romania
Carmen Barbu, Carol Davila University; Catalina Poiana, Carol Davila Univesrity;Alina Roman, Elais Hospital; Simona Fica, Carol Davila University
Background: There are a significant number of bone QUS equipments in Romania.The specific end points of our study were: QUS equipments distribution by regionand type of medical office, QUS problems in clinical practice, the QUS use fordiagnostic, therapy initiation and monitoring, fracture risk evaluation and theimplications of social security reimbursement of QUS in Romania. Methods: differentsources of information were used: public health network, questionnaire addressed toclinicians attending QUS course (100 subjects), previous reports from screeningcampaign (800women), medical records from 2200 patients refereed forosteoporosis treatment trough a National Program in two endocrinologydepartment segregated in different study groups according to the first indication –refereed for DXA, refereed for Treatment, refereed for screening). Results: Numberof the QUS equipments rose constantly with a report nowadays of 4/1 comparing toDXA machines, used mostly by endocrinologists and rheumatologists (35 % each).From 1500 patient refereed for QUS screening, 93.4% were women vs. 6.6 % menwith a mean age of 62 ± 9.8 yrs; 23% has no clinical risk factors. Clinicians tend touse QUS results similar to DXA results (almost 42% are using WHO classificationbased on QUS T score); in spite of this aspect which can be due to the socialreimbursement restriction of the treatment, a significant part of the clinicians (37%)are using QUS parameters to evaluate fracture risk. 21% of the patients refereed toDXA had QUS evaluation; from it, 7% had also treatment initiated after QUS andsignificantly (min 6 months) before DXA. 50% of the patients refereed for medicalprescription were diagnosed based only on QUS evaluation. Social reimbursementwas a major determinant of the raise of QUS use in Romania but is depending by thediagnostic of osteoporosis on the medical record. Consequently, there is a pressureon the clinician to simplify the evaluation’s results leading to inadequateinterpretation. Conclusion: osteoporosis treatment in Romania is frequently based ona QUS evaluation only; clinicians are using either an inadequate extrapolation ofWHO criteria for diagnosis or a modern concept of high fracture risk for initiatingtherapy. This aspect suggests the need for clinical guidelines integrating both QUSresults and social reimbursement criteria in a context of a more adequate trainingof the physicians in using fracture risk assessment.
Poster Number 010 Young Investigator Awardees
Clinical Impact of Revised Osteoporosis Treatment Guidelines
Laura Wilson, Bone & Mineral Unit, Oregon Health & Science University, Portland,OR; Linda Norcutt, Bone & Mineral Unit, Oregon Health & Science University,Portland, OR
Both bone mineral density (BMD)-dependent and independent factors contribute toosteoporotic fracture risk. Thus, the US National Osteoporosis Foundation (NOF) hasrecommended treatment guidelines combining BMD measures with additional riskfactors for the past decade. Recently, the US NOF incorporated absolute fracture riskcalculations derived from population-specific World Health Organization FRAXalgorithms. To determine the clinical impact of these revised guidelines onosteoporosis treatment recommendations, we retrospectively applied FRAX w/o BMD,FRAX w/ BMD, NOF 2005 and NOF 2008 treatment criteria to 600 women betweenthe ages of 40 and 90 who were evaluated in our bone densitometry unit betweenJanuary 2002 and December 2008. 41% of the study population was 65 or olderand 25% was younger than 50 years. No subjects had received hormonereplacement therapy or osteoporosis medication. FRAX w/o BMD, FRAX w/ BMD,NOF 2005 and NOF 2008 criteria recommended treatment initiation in 37%, 32%,23% and 38%, respectively. There were 71 women (12%) for whom FRAX w/o BMDand FRAX w/ BMD yielded different treatment conclusions (p = 0.0006). Adding theBMD information moved 29 patients (all 70 or older) out of the treatment category.There were 130 women (22%) for whom NOF 2005 and NOF 2008 yieldeddifferent treatment conclusions (p < 0.0001). NOF 2008 added 110 women (acrossthe age spectrum/without age specificity) to the treatment category. There were 72women (12%) for whom FRAX w/ BMD and NOF 2008 yielded different treatmentconclusions (p < 0.0001). NOF 2008 added 55 patients (all younger than 70) to thetreatment category. Our results indicate that the particular criteria employed cansubstantially alter drug treatment decisions for a specific woman. Given theseclinically relevant discrepancies, it is now, more than ever, crucial that drug treatmentdecisions based on a given criterion are supported by prospective fracture trials.
Poster Number 011 Young Investigator Awardees
Association of Luteinizing Hormone Receptor Polymorphism with BoneMineral Density in Men – Results from Odense Androgen Study
Claus Brasen, MD, Clinical Biochemistry, Odense University Hospital, Denmark; T.L.Nielsen, Odense University Hospital; K. Wraae, Odense University Hospital; B.Abrahamsen, Odense University Hospital; L. Christiansen, Odense UniversityHospital; C. Hagen, Odense University Hospital; M. Andersen, Odense UniversityHospital; K. Brixen, Odense University Hospital; L. Bathum, Odense UniversityHospital
We have previously shown, that the N312S polymorphism in the luteinizinghormone receptor (LHR) is associated with bone mineral density (BMD) in youngmen. Through in vitro studies, we found, that N312S and N291S influences theactivation of the receptor. We therefore tested the influence of both SNP’s onBMD.We genotyped 783 healthy men aged 20-29 years and 600 men aged 60-76from the population-based Odense Androgen Study for both SNP’s and investigatedassociation with BMD in the spine and hip. 406 of the young and 282 of theelderly participants underwent MRI scans to determine visceral and subcutaneousadipose tissue(VAT and SAT) and muscle tissue. We furthermore tested forassociation with testicular volume, height, lean body mass, testosterone, oestrogen,dihydrotestosterone and androstenedione. We also tested for association with BMDin truncus, whole body BMD, LH and carboxy-terminal telopeptide of type Icollagen(ICTP) in the young population. All genotype distributions were consistentwith the Hardy-Weinberg equilibrium. Using the young study group, we foundsignificant association between N312S alleles and testicular-volume (p=0.03) as wellas with BMD in spine (p=0.04) and trend association between LHR alleles and BMDin truncus and whole body BMD. Stratifying the young participants into “sedentary”and “non-sedentary”, we found that in the non-sedentary participants (n=615),LHR N312S was significantly associated with testicular volume, BMD in spine,truncus, and whole body. The results also indicated a trend association with BMD inhip and extremities, as well as the level of ICTP. N291S indicated a trend withwhole body BMD(p=0.075). Using the elderly population, we found significantassociation between N312S and BMD of the hip (p=0.05). We also found trendassociation between N291S and BMD in the spine and the hip, the CC-genotypeshowing respectively a 15.6% and 8.6% drop in BMD compared to wildtype.Thesefindings strengthen the hypothesis that the LHR N312S polymorphism is associatedto genital undermasculinization and hereby low BMD. More studies are needed toverify these results. More participants are needed to estimate the true significanceof N291S. In vitro and fracture data studies will be discussed.The contents of thisabstract has been submitted and accepted for WCO for oral presentation id OC7,Osteoporosis Int (2008) 19 (Suppl. 2).
Poster Number 012 Young Investigator Awardees
Genistein Aglycone for the Management of Secondary Osteoporosis: AnExperimental Study
Alessandra Bitto, University of Messina; Bruce Burnett, Primus Pharmaceuticals;Antonio Bonaiuto, University of Messina; Domenica Altavilla, University of Messina;Francesco Squadrito, University of Messina
Background: Glucocorticoid-induced osteoporosis (GIO) is the most importantsecondary cause of osteoporosis.Methods: In a first set of animals (n= 21) of animalswe tested if genistein aglycone (5 mg/kg/sc) may prevent methylprednisolone-inducedosteoporosis. In a following experiment (28 rats) we tested if genistein aglycone atthe same dose could represent an efficacious treatment for GIO compared toalendronate. Female Sprague-Dawley rats were used. GIO was induced by dailyinjections of methylprednisolone (MP; 30mg/kg/sc) for 60 days in both experimentalprocedures. Sham GIO animals (n=14) were daily injected with themethylprednisolone vehicle. In the first experiment a group of animals (n=7)received only MP and the other group received also genistein (n=7) for 60 days. Inthe second experiment all animals (n=21) received MP for 60 days to developosteoporosis, subsequently MP rats were randomized to receive: vehicle (n=7),genistein aglycone (5 mg/kg/sc; n=7) or alendronate (0.03 mg/kg/sc; n=7).Thetreatment lasted for additional 60 days. Sham GIO animals were treated withvehicle for an additional 60 days. At thebeginning and at the end of the treatmentperiod all animals were examined for bone mineral density (BMD) and bone mineralcontent (BMC). At the time of sacrifice, bone-alkaline phosphatase (b-ALP) andcarboxy-terminalcollagen crosslinks (CTX) were determined in serum. Femurs wereremoved and tested for breaking strength or histology.Results: In the first experimentgenistein aglycone was able to preserve bone mineral content, bone morphology andmechanical properties compared to vehicle. In the second experiment genisteinaglycone showed a greater increase in both BMD and BMC than alendronate,significantly increased b-alp (bone formation marker), reduced CTX (boneresorption marker), and caused a greater increase in breaking strength thanalendronate. Finally, a more beneficial effect of genistein aglycone on bone histologyand mechanical properties has been observed.Conclusion: The results suggest thatgenistein in its aglycone form might be useful for the management of GIO.
20 — 2009 Annual Meeting
Poster Number 013 Young Investigator Awardees
High Dose Vitamin D Supplementation in the Elderly is Both Safe andEfficacious
Rekha Ramamurthy, University of Wisconsin, Madison, WI; Robert Przybelski,University of Wisconsin, Madison, WI; Dessa Gemar, University of Wisconsin, Madison,WI; Diane Krueger, University of Wisconsin, Madison, WI; Neil Binkley, University ofWisconsin, Madison, WI
Low vitamin D status is endemic, especially in the older population, due toinadequate dietary intake and limited sun exposure. Long-term adherence to dailyoral therapies including supplementation is poor. As such, other approaches arenecessary to effectively correct vitamin D inadequacy on a population basis. Onesuch supplementation regimen used in clinical practice at our medical center isloading doses of ergocalciferol 50,000 units three times weekly for one to threemonths, followed by maintenance dosing of ergocalciferol with 50,000 units weekly.We hypothesized that this regimen is both safe and efficacious in increasing25(OH)D level to the optimal range. To investigate this hypothesis, we reviewedmedical records of 17 geriatric clinic patients receiving this regimen for up to 18months. Mean age of this cohort was 75 years, on average they had 8.9 diagnoses intheir problem list and 12.6 medications on their active medication list. Their mean(SEM) baseline 25(OH)D level was 23.5 (2.3) ng/ml. Following vitamin D therapyinitiation, their 25(OH)D increased (p<0.0001) to 55.6 (3.9) ng/ml at 3 months.This elevation persisted at the 18-month time point. The highest 25(OH)D levelobserved was 85 ng/ml. Serum calcium levels were available in 15 at baseline andfollow-up with a mean value of 9.41 (0.11) mg/dl at both time points. The highestserum calcium observed was 10.4 mg/dl. This real world experience demonstratesthat 50,000 IU of ergocalciferol weekly is a safe, well-tolerated and efficacioustreatment option for hypovitaminosis D.
Poster Number 014 Young Investigator Awardees
Variables that Predict Tibial Bending Strength in Pre-Menopausal Women:Relative Importance of vBMD?
Kyle Creamer, Radiology Technician, Virginia Tech, Blacksburg, VA; Katrina Butner,Virginia Tech, Blacksburg, VA; William Herbert, Virginia Tech, Blacksburg, VA
Susceptibility to osteoporotic bone fracture is dependent on bone strength, whichis influenced by its geometry, microarchitecture, mineral distribution, content(BMC) and density (BMD). While clinicians have relied upon aBMD from DXA as asurrogate for fracture risk, newer technologies allow quantification of additionalbone parameters, such as cortical and trabecular volumes and densities, as well asgeometry. Using these measures, pQCT provides the means to accurately estimatebone mechanical strength from its physical and material properties. In this study, 82healthy pre-menopausal women with a mean age (± SD) of 38.6±4.7 yr andpossessing broad ranges for both BMI (18.3–46.6 kg/m2) and a calculated measureof physical activity (PA) (98.5–1701.5 MET-min/day) underwent four tibial pQCTscans at 4, 14, 38 and 66% of the tibial length from the distal end. Torsional (tBBS)and axial bone bending strength were calculated from the section moduli at eachof the four measurement sites; the weakest point of these was found at the 14%locus (tBBS=4495.2 ± 713.4 N). Torsional and axial bone bending strength valueswere strongly correlated (r>0.93, p<0.001); therefore, only torsional values arepresented here. Regressing tBBS on the physical and material properties obtainedfrom pQCT (cortical BMC, average cortical thickness, cortical area and corticalvBMD) yielded a prediction model with R^2=0.90 (F[4,77]=165.8, p<0.001).Standardized coefficients for these independent variables were 0.76, -0.49, 0.52 and-0.32, respectively (all coefficients, p<0.05). Cortical BMC accounted for 54.2%,average cortical thickness and cortical area accounted for 21.3 and 13.5%, whilevBMD accounted for only 0.5% of the variance in tibial torsional strength. AlthoughvBMD remained a significant contributor in the model, its contribution wasminimal. Tibial tBBS obtained from pQCT more completely defines the overall bonestrength as it relates to the physical and material properties of the bone. Furtherresearch is needed to determine if this index may translate into improved clinicalstrategies for detection of fracture risk.
Poster Number 015 Young Investigator Awardees
Use of QUS Bone Evaluation in Clinical Practice in Romania
(ACCEPTED AS ORAL NUMBER 005 – NO POSTER PRESENTATION)
Carmen Barbu, Carol Davila University; Catalina Poiana, Carol Davila Univesrity;Alina Roman, Elais Hospital; Simona Fica, Carol Davila University
Poster Number 016 Young Investigator Awardees
Estimated Variables from Hip and Spine Scans Compared to MeasuredVariables from Whole Body Scans
Lorena Marquez, University of California San Francisco; Bo Fan, University ofCalifornia San Francisco; Joanne Dorgan, Fox Chase Cancer Center; John Shepherd,University of California San Francisco
Percent fat variables for the whole body have usually been measured using onlywhole body DXA scans. New applications have been developed to estimate wholebody, android, and gynoid percent fat from hip and spine scans alone. The aim of thisstudy is to compare the estimates for whole body, gynoid, and android percent fatderived from spine and hip scans to those same measures from whole body scans. Atotal of 104 female subjects received whole body, hip, and spine DXA scans on GEProdigy scanners. They ranged from 24 to 30 years old (mean=27 +/- 1.2). 90subjects had estimates on whole body percent fat, 85 had android percent fatestimates, and 89 contained gynoid percent fat estimates. The ethnic breakdown forthis population was 91 Caucasians, 9 African Americans, 3 Hispanics, and 1 Asian.Missing estimated values were due to either a lack of ethnic reference data or anandroid %fat greater than 61 %. The number of patient with low (<18.5 kg/m2),medium (18.5-24.9 kg/m2), and high (>25 kg/m2) BMIs were 3, 54, and 44respectively. All images were centrally analyzed using Lunar Prodigy enCORE v11.4.The student’s t-test was used to test for significant differences in the whole body andestimates from the spine and hip scans. Bland-Altman analysis was used to investigateany disagreements and trends.We found that there was a high correlation betweenthe whole body scan variables and the estimates derived from the spine and hipscans. The correlation coefficient value ranged from .90 (A/G) to .97(android). Therewas no difference between the two measurements for whole body percent fat,android percent fat and A/G ratio (p=0.434, p=0.564, and p=0.058, respectively).The hip/spine gynoid percent fat estimates were 1 % greater than the whole bodygynoid percent fat (p=0.0046). There was no BMI effect for the difference betweenthe two measurements for whole body percent fat, but there was a BMI effect for theA/G ratio. We conclude that dedicated spine and hip scans can accurately estimatewhole body composition values across a broad range of BMIs values.

— 2009 Annual Meeting 21
Poster Number 100 Assessment of Bone Architecture/Microstructure
Correlation Between Microdensity and Microvascularisation of theGlenoid
Sophie Abrassart, Hopital Universitaire de Genève; Pierre Hoffmeyer, HUG; RichardStern, HUG
Objectives: The aim of this study is to quantify bone microarchitecture within theglenoidfossa of the scapulaand to compare the bone density with the bonevascularisation.High-resolution micro-computed tomography ([mu]CT) imaging havebeen instrumental in providing true quantitative and qualitative three-dimensionaldata on baseline bone morphology.Materials and Methods35 fresh-frozen humancadaveric shoulders were analysed. The mean age of the specimens was 70 years. Allscapulae were inspected for normal anatomic landmarks.The peripheral quantitativecomputed tomography (pQCT) .was used perpendicular to the articular surface(pixel size,1536/1536 slice thickness 80 microns ) .Scanco software was used tocalculate the bone volume per tissue volume; mean trabecular separation; meantrabecular number , connectivity density in three layers from the articular surfaceto the deep scapula. On the same time micro angioCt were done on injectedscapulae .ResultsThe total BMD of the posterior- superior glenoid area wassignificantly higher than those of the anterior and inferior glenoid . Trabecular BMDof the posterior glenoid was significantly higher than that of the anterior glenoid,and systematic large trabecula was found in the posterior area. We found the samerepartition as the density ,for the vascularization .Number of arteries grow up fromthe antero-inferior area to the postero-superior area . The density follows the sameplan.The mean total BMD in different regions of 35 glenoid specimens ranged from0,243 to 0,489 g/cm2. The average number of trabecular structures was 0,9650 permm and the average thickness of trabecular structures was 0,3153 mm.The center ofthe glenoid is surprisingly poor in trabecular structures as we found a bony gap at8 mm of distance from the articular surface .Conclusions and ClinicalrelevanceAlthough the specimen age was quite high in our material, we believe agingdoes not affect our study as shoulders prosthesis are generally performed on oldpatients. In the future, component design should use areas of stronger sub-chondralbone . Posterio-superior bone area could be another alternative for fixation indecreasing glenoid-loosening rates. As the inferior center of the glenoid is an areadevoided of trabecular bone, center-keel design component doesn’t seem to be thebest choice.
Poster Number 101 Assessment of Bone Architecture/Microstructure
Effect of Hand Dominance on Bone Microarchitecture at the Distal Radiusas Determined Using High Resolution Magnetic Resonance Imaging
Michael Kleerekoper, St. Joseph Mercy Reichert Health Center; Pamela Seaman,MicroMRI Inc; Xiaohai Wan, Lilly USA, LLC; Mayme Wong, Lilly USA, LLC; Kelly Krohn,Lilly USA, LLC
Bone mineral density as measured using dual-energy X-ray absorptiometry has beenfound to be significantly higher in the hand, forearm, and calcaneus on the dominantside compared with the nondominant side. Correspondingly, higher bone area andbone mineral content was observed in the dominant forearm. It is not knownwhether hand dominance influences bone microarchitecture. Bonemicroarchitecture was measured bilaterally at the distal radius of 18 right-handedpostmenopausal women with osteoporosis (aged 45 to 85 years) using noninvasivehigh resolution magnetic resonance imaging (microMRI). Three-dimensionalstructural parameters of bone volume/tissue volume (BV/TV), trabecular thickness(Tb.Th), trabecular number (Tb.N), trabecular spacing (Tb.Sp), and cortical thickness(Ct.Th) were compared between the right (R) and left (L) radius in each woman.The Plate:Rod ratio was calculated from dividing the trabecular surface by thetrabecular curve value. Arithmetic mean and standard deviation (SD) were calculatedfor the R and L radius parameters, and for the difference (R-L) and ratio (R/L). BV/TV, Tb.Th, Tb.N, and Plate:Rod ratio were greater, and Tb.Sp was smaller, in thedominant R radius, compared with values in the L radius (Table), suggesting thatdominance may affect bone microarchitecture, although neither the difference (R-L)nor ratio (R/L) was statistically significantly different. Statistical power to determinesignificance was limited by the small number of subjects. Conclusions cannot bemade on the differences in structural parameters using microMRI between thedominant and nondominant radius in this small cohort of postmenopausal women.
Poster Number 102 Assessment of Bone Architecture/Microstructure
Radiographic Texture Analysis of Densitometric Calcaneal Images –Relationship to Clinical Characteristics and Fragility
Tamara Vokes, University of Chicago; Diane Lauderdale, University of Chicago; MikeChinander, University of Chicago; Maryelln Giger, University of Chicago
Osteoporotic fractures are related to bone mass, measured as bone mineral density(BMD), and bone structure or microarchitecture which cannot be easily assessedusing currently available methods. We have developed Radiographic Texture Analysis(RTA) preformed on calcaneal images obtained using a peripheral densitometer as aneasy non-invasive method for assessing bone structure. We examined the relationshipbetween RTA and clinical characteristics and bone fragility, defined by presence ofprevalent vertebral fractures, in 900 subjects (94 males) between ages 19 and 99,referred for bone densitometry as part of their routine medical care. We usedProdigy to measure BMD of the lumbar spine and proximal femur and obtain VFAfor detection of vertebral fractures, and PIXI equipped with high resolution camerato measure heel BMD and obtain calcaneal images for RTA. Two types of RTA analysiswere performed. Fourier based analysis yielded RMS (root mean square variation, ameasure of magnitude of texture pattern) and FMP (first moment of powerspectrum, a measure of the spatial frequency of the texture pattern). The secondtype of analysis, spectral analysis, yielded a feature beta, as a measure of roughness/smoothness of the radiographic texture pattern. In a multivariate regression analysiswe found that RTA features were related to age, weight, and heel BMD, and differedbetween glucocorticoid users and non users, and between subjects with and withoutprevalent vertebral fractures. There were 753 subjects who had information onprevalent vertebral fractures and were over the age of 40, which allowed calculationof FRAX®. When controlling for FRAX or individual clinical risk factors and BMD,RTA features, particularly beta, were significantly different between 148 subjects withand 605 subjects without prevalent vertebral fractures. The odds ratio (OR) ofhaving prevalent vertebral fractures was 1.4 (95% confidence interval 1.2, 1.8,p=0.001) per 1 standard deviation decrease in beta. In the same model, the OR forFRAX was 1.6 (1.5, 1.8, p<0.001) per 10 year probability of major osteoporoticfracture of 10%. Gender, race, use of glucocorticoids or pharmacologic therapy forosteoporosis did not significantly affect the findings suggesting that RTA can be usedin a wide range of densitometry patients. We conclude that RTA obtained using aportable instrument has a potential for wide application as a non-invasive methodfor assessment of bone structure.
Poster Number 103 Assessment of Bone Architecture/Microstructure
Multiparametric Imaging of Bone Architecture: A Cadaveric Study
Noah Allen, University Hospital Cincinnati; Kenneth Weiss, University of Cincinnati;Suzanne Numan, University of Cincinnati; Michael Hazenfield, University of Cincinnati;Jun Ying, University of Cincinnati; Ronald Huston, University of Cincinnati; NelsonWatts, University of Cincinnati; Paula Chmielewski, Procter & GamblePharmaceuticals; Gary Gross, Procter & Gamble Pharmaceuticals, Inc.; ThomasDufresne, Procter & Gamble Pharmaceuticals, Inc.; Babul Borah, Procter & GamblePharmaceuticals, Inc.
Osteoporosis is a skeletal disorder characterized by compromised bone strengthpredisposing to increased risk of fracture. A major determinant of bone strength isbone microarchitecture. This study tested the correlation of vertebral strength withmeasures of distal radius and vertebral body microarchitecture, and prevalentfractures.
METHODS: Thoracic and lumbar vertebrae were dissected from five cadavers for thestudy. Whole body dual energy MDCT was used for QCT analysis, analyzing bonemineral density (BMD) and determining fracture presence. Based on Genant methodgrading, summed spinal deformity indices (SDI) were calculated. Strength of eachvertebra was evaluated by controlled compressive loading until the force needed todeform (shorten) the vertebra decreased dramatically. Vertebra strength wascalculated using the derived force/deformation data. The bilateral distal radii and L2-L4 vertebrae were analyzed using Imtek μCT. Structural and architectural assessmentincluded bone volume fraction (BV/TV), connectivity density (Conn Dens), marrowstar volume, and structure model index (SMI). Appropriate statistical models whereemployed to compare the strength measures to SDI, and to asses the relationshipsbetween strength and architecture.
RESULTS: 3/5 subjects had minor-moderate fractures (SDI=1.5, 2, 3) and vertebralstrength of ± SE 221± 19lb/in2(p=0.001). 2/5 subjects had multiple severe fractures(SDI=14, 14) and vertebral strength of 92± 22lb/in2 (p=0.001). Strength positivelycorrelated with BV/TV and Conn Dens, (slope ±SE17±7, p=0.033, and 89±29,p=0.012); and negatively correlated with SMI and Star volume (slope ±SE-90±32,p=0.017 and -0.99±0.3, p=0.003). Strength and BMD relationship was not significant,with slope ±SE0.38±0.32 (p=0.261). Vertebra strength measures correlated weakly todistal radius architectural measures (p >0.05).
DISCUSSION: As hypothesized, prevalence of vertebral fractures and decreasedvertebral strength were highly correlated. Vertebral microarchitecture proved amuch better predictor of vertebral strength than distal radius microarchitecturemeasures suggesting that microarchitecture across sites may be variable and that thedistal radius may be a relatively poor surrogate marker of vertebral strength. Incontradistinction to previous in-vitro studies, QCT derived BMD did not correlatesignificantly with vertebral strength. A larger sample size study is planned to furtherinvestigate these findings.
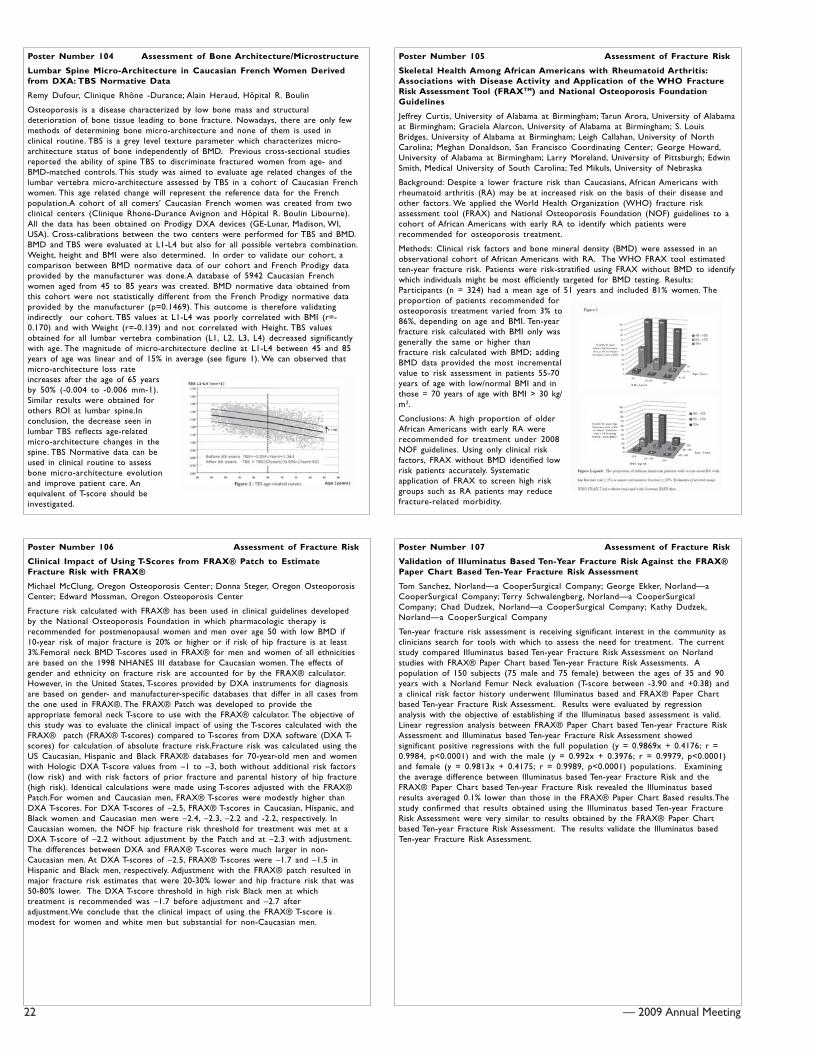
22 — 2009 Annual Meeting
Poster Number 104 Assessment of Bone Architecture/Microstructure
Lumbar Spine Micro-Architecture in Caucasian French Women Derivedfrom DXA: TBS Normative Data
Remy Dufour, Clinique Rhône -Durance; Alain Heraud, Hôpital R. Boulin
Osteoporosis is a disease characterized by low bone mass and structuraldeterioration of bone tissue leading to bone fracture. Nowadays, there are only fewmethods of determining bone micro-architecture and none of them is used inclinical routine. TBS is a grey level texture parameter which characterizes micro-architecture status of bone independently of BMD. Previous cross-sectional studiesreported the ability of spine TBS to discriminate fractured women from age- andBMD-matched controls. This study was aimed to evaluate age related changes of thelumbar vertebra micro-architecture assessed by TBS in a cohort of Caucasian Frenchwomen. This age related change will represent the reference data for the Frenchpopulation.A cohort of all comers’ Caucasian French women was created from twoclinical centers (Clinique Rhone-Durance Avignon and Hôpital R. Boulin Libourne).All the data has been obtained on Prodigy DXA devices (GE-Lunar, Madison, WI,USA). Cross-calibrations between the two centers were performed for TBS and BMD.BMD and TBS were evaluated at L1-L4 but also for all possible vertebra combination.Weight, height and BMI were also determined. In order to validate our cohort, acomparison between BMD normative data of our cohort and French Prodigy dataprovided by the manufacturer was done.A database of 5942 Caucasian Frenchwomen aged from 45 to 85 years was created. BMD normative data obtained fromthis cohort were not statistically different from the French Prodigy normative dataprovided by the manufacturer (p=0.1469). This outcome is therefore validatingindirectly our cohort. TBS values at L1-L4 was poorly correlated with BMI (r=-0.170) and with Weight (r=-0.139) and not correlated with Height. TBS valuesobtained for all lumbar vertebra combination (L1, L2, L3, L4) decreased significantlywith age. The magnitude of micro-architecture decline at L1-L4 between 45 and 85years of age was linear and of 15% in average (see figure 1). We can observed thatmicro-architecture loss rateincreases after the age of 65 yearsby 50% (-0.004 to -0.006 mm-1).Similar results were obtained forothers ROI at lumbar spine.Inconclusion, the decrease seen inlumbar TBS reflects age-relatedmicro-architecture changes in thespine. TBS Normative data can beused in clinical routine to assessbone micro-architecture evolutionand improve patient care. Anequivalent of T-score should beinvestigated.
Poster Number 105 Assessment of Fracture Risk
Skeletal Health Among African Americans with Rheumatoid Arthritis:Associations with Disease Activity and Application of the WHO FractureRisk Assessment Tool (FRAXTM) and National Osteoporosis FoundationGuidelines
Jeffrey Curtis, University of Alabama at Birmingham; Tarun Arora, University of Alabamaat Birmingham; Graciela Alarcon, University of Alabama at Birmingham; S. LouisBridges, University of Alabama at Birmingham; Leigh Callahan, University of NorthCarolina; Meghan Donaldson, San Francisco Coordinating Center; George Howard,University of Alabama at Birmingham; Larry Moreland, University of Pittsburgh; EdwinSmith, Medical University of South Carolina; Ted Mikuls, University of Nebraska
Background: Despite a lower fracture risk than Caucasians, African Americans withrheumatoid arthritis (RA) may be at increased risk on the basis of their disease andother factors. We applied the World Health Organization (WHO) fracture riskassessment tool (FRAX) and National Osteoporosis Foundation (NOF) guidelines to acohort of African Americans with early RA to identify which patients wererecommended for osteoporosis treatment.
Methods: Clinical risk factors and bone mineral density (BMD) were assessed in anobservational cohort of African Americans with RA. The WHO FRAX tool estimatedten-year fracture risk. Patients were risk-stratified using FRAX without BMD to identifywhich individuals might be most efficiently targeted for BMD testing. Results:Participants (n = 324) had a mean age of 51 years and included 81% women. Theproportion of patients recommended forosteoporosis treatment varied from 3% to86%, depending on age and BMI. Ten-yearfracture risk calculated with BMI only wasgenerally the same or higher thanfracture risk calculated with BMD; addingBMD data provided the most incrementalvalue to risk assessment in patients 55-70years of age with low/normal BMI and inthose = 70 years of age with BMI > 30 kg/m2.
Conclusions: A high proportion of olderAfrican Americans with early RA wererecommended for treatment under 2008NOF guidelines. Using only clinical riskfactors, FRAX without BMD identified lowrisk patients accurately. Systematicapplication of FRAX to screen high riskgroups such as RA patients may reducefracture-related morbidity.
Poster Number 106 Assessment of Fracture Risk
Clinical Impact of Using T-Scores from FRAX® Patch to EstimateFracture Risk with FRAX®
Michael McClung, Oregon Osteoporosis Center; Donna Steger, Oregon OsteoporosisCenter; Edward Mossman, Oregon Osteoporosis Center
Fracture risk calculated with FRAX® has been used in clinical guidelines developedby the National Osteoporosis Foundation in which pharmacologic therapy isrecommended for postmenopausal women and men over age 50 with low BMD if10-year risk of major fracture is 20% or higher or if risk of hip fracture is at least3%.Femoral neck BMD T-scores used in FRAX® for men and women of all ethnicitiesare based on the 1998 NHANES III database for Caucasian women. The effects ofgender and ethnicity on fracture risk are accounted for by the FRAX® calculator.However, in the United States, T-scores provided by DXA instruments for diagnosisare based on gender- and manufacturer-specific databases that differ in all cases fromthe one used in FRAX®. The FRAX® Patch was developed to provide theappropriate femoral neck T-score to use with the FRAX® calculator. The objective ofthis study was to evaluate the clinical impact of using the T-scores calculated with theFRAX® patch (FRAX® T-scores) compared to T-scores from DXA software (DXA T-scores) for calculation of absolute fracture risk.Fracture risk was calculated using theUS Caucasian, Hispanic and Black FRAX® databases for 70-year-old men and womenwith Hologic DXA T-score values from –1 to –3, both without additional risk factors(low risk) and with risk factors of prior fracture and parental history of hip fracture(high risk). Identical calculations were made using T-scores adjusted with the FRAX®Patch.For women and Caucasian men, FRAX® T-scores were modestly higher thanDXA T-scores. For DXA T-scores of –2.5, FRAX® T-scores in Caucasian, Hispanic, andBlack women and Caucasian men were –2.4, –2.3, –2.2 and -2.2, respectively. InCaucasian women, the NOF hip fracture risk threshold for treatment was met at aDXA T-score of –2.2 without adjustment by the Patch and at –2.3 with adjustment.The differences between DXA and FRAX® T-scores were much larger in non-Caucasian men. At DXA T-scores of –2.5, FRAX® T-scores were –1.7 and –1.5 inHispanic and Black men, respectively. Adjustment with the FRAX® patch resulted inmajor fracture risk estimates that were 20-30% lower and hip fracture risk that was50-80% lower. The DXA T-score threshold in high risk Black men at whichtreatment is recommended was –1.7 before adjustment and –2.7 afteradjustment.We conclude that the clinical impact of using the FRAX® T-score ismodest for women and white men but substantial for non-Caucasian men.
Poster Number 107 Assessment of Fracture Risk
Validation of Illuminatus Based Ten-Year Fracture Risk Against the FRAX®Paper Chart Based Ten-Year Fracture Risk Assessment
Tom Sanchez, Norland—a CooperSurgical Company; George Ekker, Norland—aCooperSurgical Company; Terry Schwalengberg, Norland—a CooperSurgicalCompany; Chad Dudzek, Norland—a CooperSurgical Company; Kathy Dudzek,Norland—a CooperSurgical Company
Ten-year fracture risk assessment is receiving significant interest in the community asclinicians search for tools with which to assess the need for treatment. The currentstudy compared Illuminatus based Ten-year Fracture Risk Assessment on Norlandstudies with FRAX® Paper Chart based Ten-year Fracture Risk Assessments. Apopulation of 150 subjects (75 male and 75 female) between the ages of 35 and 90years with a Norland Femur Neck evaluation (T-score between -3.90 and +0.38) anda clinical risk factor history underwent Illuminatus based and FRAX® Paper Chartbased Ten-year Fracture Risk Assessment. Results were evaluated by regressionanalysis with the objective of establishing if the Illuminatus based assessment is valid.Linear regression analysis between FRAX® Paper Chart based Ten-year Fracture RiskAssessment and Illuminatus based Ten-year Fracture Risk Assessment showedsignificant positive regressions with the full population (y = 0.9869x + 0.4176; r =0.9984, p<0.0001) and with the male (y = 0.992x + 0.3976; r = 0.9979, p<0.0001)and female (y = 0.9813x + 0.4175; r = 0.9989, p<0.0001) populations. Examiningthe average difference between Illuminatus based Ten-year Fracture Risk and theFRAX® Paper Chart based Ten-year Fracture Risk revealed the Illuminatus basedresults averaged 0.1% lower than those in the FRAX® Paper Chart Based results.Thestudy confirmed that results obtained using the Illuminatus based Ten-year FractureRisk Assessment were very similar to results obtained by the FRAX® Paper Chartbased Ten-year Fracture Risk Assessment. The results validate the Illuminatus basedTen-year Fracture Risk Assessment.

— 2009 Annual Meeting 23
Poster Number 108 Assessment of Fracture Risk
The Risk of Vertebral Fractures in Predicting Ten-Year Probability ofOsteoporotic Fracture in Southern Chinese Postmenopausal Women: TheHong Kong Osteoporosis Study
Eva Yuet-Wah Chu, Postdoctoral fellow of Medicine, University of Hong Kong, HK;Annie Wai-Chee Kung, Professor of Medicine, HKU, HK
Previous fracture is one of the major risk factors for predicting future fractures.Diagnosing asymptomatic vertebral fracture enables a better assessment of the 10-year probability of osteoporotic fracture (OF). Prevalent vertebral fracture wasassociated with a 2-5 fold increased risk of future OF. The aim of this study was todefine the risk profile of prevalent morphometric vertebral fractures (MVF) inpostmenopausal Southern Chinese women to predict the 10-year probability of OFand vertebral fracture.This was a part of the Hong Kong Osteoporosis Study (HKOS)whereby postmenopausal Southern Chinese women were recruited from thecommunity and followed prospectively for fracture outcome. Within the cohort,1,372 subjects had baseline thoraco-lumbar spine X-ray and were followed withserial X-rays for more than 1 year. MVF was defined according to Genant’sclassification. Information on incident OF was obtained from the computerizedpatient record system of the Hospital Authority of the Hong Kong Government. Themean age of the group was 61.1±8.7 years. The median follow-up was 4.4 (range 1–9.2) years. 298 (21.7%) subjects had 464 prevalent MVF (Grade 1: 269; Grade 2:107; Grade 3: 88) but only 10.7% of the patients were symptomatic of their spinefacture. Subjects with vertebral fractures had significantly lower BMD at both thespine and hip (p<0.001), but only 43.6% had BMD T-score=-2.5 at any site. Onfollow-up, 51 (17.1%) subjects in the prevalent MVF group and 16 (1.5%) in the noMVF group reported one or more incident OF. Grade III MVF was associated with arelative risk of 3.2 (95%CI: 1.7 -6.1, p < 0.001) for OF; 3.6 (95%CI: 1.9 – 7.0, p <0.001) for spine fracture; and 2.1 (95%CI: 0.5 – 9.1, p <0.05) for non-spine fracture.Ten-year probability of OF based on Cox-regression model was 17.2% with aprevalent OF, and 33.8 % with a prevalent Grade 3 MVF.Asymptomatic MVF is amajor risk factor for future fracture in postmenopausal Southern Chinese women.The risk profile data will assist in building the population-specific model with theWHO FRAX-risk calculator in determining the 10-year probability of OF inSouthern Chinese.(Update abstract IOF08-0390)
Poster Number 109 Assessment of Fracture Risk
Bone Mineral Density in Postmenopausal Women with OsteoporoticFractures
Vladyslav Povoroznyuk, Institute of Gerontology AMS Ukraine; Volodymyr Vayda,Institute of Gerontology AMS Ukraine; Nataliia Dzerovych, Institute of GerontologyAMS Ukraine
This research is aimed at studying the bone mineral density among postmenopausalwomen with osteoporotic fractures. Object. The total of 160 postmenopausal women45–79 years old (average age – 63,4±0,7 years; average duration of postmenopausalperiod – 14,4±0,7 years) were examined. Patients were divided into two groups:group A – women (n=100, average age – 63,2±0,9 years) without osteoporoticfractures, group B – women (n=60, average age – 65,5±1,2 years) with osteoporoticfractures in their anamnesis.Methods. The questionnaire; measurement ofanthropometrical characteristics (height, mass, body mass index); bone mineraldensity (BMD), T- and Z-scores of the spine (L1–L4), hip (femoral neck, trochanterand total femur), and forearm (ultradistal, midforearm) were determined by means ofDual-energy X-ray absorptiometer ‘Prodigy’ (GE Medical systems, 2005).Results. Allindexes of different skeletal areas measured by DXA in postmenopausal women withosteoporotic fractures were significantly lower (p<0,001) compared with the data ofwomen without osteoporotic fractures: total body – BMD: 0,999±0,015 g/cm2 and1,097±0,010 g/cm2, ?-score: -1,59±0,18 and -0,34±0,12, Z-score: -0,81±0,15 and -0,06±0,09; spine (L1–L4) – BMD: 0,909±0,023 g/cm2 and 1,094±0,017 g/cm2, ?-score: -2,26±0,20 and -0,78±0,14, Z-score: -1,18±0,18 and -0,02±0,13; femoral neck– BMD: 0,780±0,016 g/cm2 and 0,886±0,014 g/cm2, T-score: -1,88±0,11 and -1,09±0,01, Z-score: -0,59±0,10 and -0,05±0,09; trochanter – BMD: 0,696±0,017 g/cm2 and 0,819±0,016 g/cm2, T-score: -1,35±0,15 and -0,36±0,12, Z-score: -0,42±0,14 and 0,33±0,11; total femur – BMD: 0,839±0,019 g/cm2 and0,968±0,016 g/cm2, T-score: -1,29±0,16 and -0,27±0,12, Z-score: -0,33±0,13 and0,45±0,11; ultradistal forearm– BMD: 0,299±0,008 g/cm2 and 0,352±0,08 g/cm2, T-score: -2,12±0,20 and -0,77±0,19, Z-score: -0,74±0,21 and 0,39±0,18; midforearm– BMD: 0,562±0,013 g/cm2 and 0,648±0,010 g/cm2, T-score: -2,13±0,18 and -0,96±0,12, Z-score: -0,69±0,16 and 0,18±0,12, accordingly.Conclusion. Low bonemineral density of different skeletal areas is a significant predictor of osteoporoticfractures in postmenopausal women.
Poster Number 110 Assessment of Fracture Risk
Impact of Lifestyle Risk Factors on Bone Mineral Density
Mohammad Almatari, ABM University Trust; Parvaiz Ali, ABM University Trust; Saleh El-Sharkawi, ABM University Trust; Peter Willshaw, Swansea University
Aim: Factors which are considered to have an impact on patients’ bone density werestudied. One main factor is patient lifestyle. Information regarding lifestyle factorswhich significantly appear to affect bone density and those known to influence bonemetabolism was collected.
Methods: A self-administered questionnaire was devised for this purpose; it includedmost of the lifestyle factors that might affect the health of bone. A total of 1851patients (214 (11.6%) male and 1637(88.4%) female) participated in the study. BoneMineral Density (BMD) was measured in the lumbar spine and left hip region on aHologic Dual Energy X-ray Absorptiometry (DXA) scanner. Osteoporosis andOsteopenia were categorised using the World Health Organisation T-score assessment.Using SPSS (version 13.0) software, statistical significance was defined as P<0.05,regression standardized coefficient (B) estimates and 95% confidence intervals (CI)were determined.
Results: The results showed that a family history of osteoporosis was not associatedwith increased risk of osteoporosis. Also there was no association betweenHyperthyroidism or Diabetes and the risk of osteoporosis.Where a patient hadtaken contraceptive pills for more than 3 months, the analysis showed a highlysignificant (P<0.001) negative association with the risk of osteoporosis (B=-0.127,95% CI: -0.158,-0.047,). HRT intake also showed negative association with the risk ofosteoporosis, statistical analysis showing significance in the lumbar spine (P=0.002, B=-0.109, 95% CI: -0.143, -0.032). This means that patients taking contraceptive pillsand HRT will have a reduced risk of osteoporosis.Finally, this study group showed ahighly significant relation (P<0.001, B=0.1, 95% CI: 0.075, 0.126,) between the BodyMass Index (BMI) and the T-score, as the BMI index increases the risk of developingosteoporosis decreases.
Conclusion: This study shows that intake of HRT, contraceptive pills, daily milk intake,having hysterectomy, having natural periods and high BMI index are indicators ofreduced risk of osteoporosis. However, age and fragility fracture are indicators ofincreased risk of osteoporosis.Cheese intake, fish intake, vegetables intake, mobility,regular exercises, removal of ovaries, family history hyperthyroidism and diabetes,showed no significant association with the risk of osteoporosis.
Poster Number 111 Assessment of Fracture Risk
Is Withholding Osteoporosis Medication after Fracture Sometimes Rational? AComparison of the Risk for Recurrent Fracture Versus Death
Jeffrey Curtis, University of Alabama at Birmingham; Tarun Arora, University ofAlabama at Birmingham; David Becker, University of Alabama at Birmingham; LisaGary, University of Alabama at Birmingham; Meredith Kilgore, University of Alabamaat Birmingham; Robert Matthews, University of Alabama at Birmingham; MichaelMorrisey, University of Alabama at Birmingham; Kenneth Saag, University of Alabamaat Birmingham; Monika Safford, University of Alabama at Birmingham; Allison Taylor,University of Alabama at Birmingham; Elizabeth Delzell, University of Alabama atBirmingham
Introduction: Under-treatment of osteoporosis is common in all healthcare settings,even for high risk patients such as persons with prior fracture. Among the reasonsfor under-treatment is a clinician’s perception of a lack of treatment benefit,particularly in light of patients’ expected future mortality (unrelated to asubsequent fracture). Among U.S. Medicare beneficiaries, we evaluated the risk forsecond fracture vs. death in the five years following a hip, clinical vertebral, andwrist/forearm fracture.
Methods: Using data from 1999-2006 for a random 5% sample of U.S. Medicarebeneficiaries age >= 65 with Part A + B coverage not enrolled in an HMO, weidentified individuals who experienced an incident hip, clinical vertebral, or wrist/forearm fracture in 2000 or 2001. We evaluated the risk for a second incidentfracture versus death in the following five years. Results were stratified by age, gender,race/ethnicity, and various comorbidities. Assuming 30% efficacy of an osteoporosismedication to prevent a second fracture, we calculated the number of individualsneeded to treat (NNT) for 5 years to prevent a subsequent fracture.
Results: We identified 11157, 8761, and 3722 persons with an incident hip, clinicalvertebral, and wrist/forearm fracture, respectively. The 5-year risk for 2nd fracturevaried substantially, from a low of 7.2% (men age 65-74 with wrist/forearm fracture)to a high of 32.1% (women age >= 85 with clinical vertebral fracture). Across age,gender, and racial/ethnic groups, the 5-year risk of death almost always exceeded therisk for second fracture (median ratio of death : second fracture = 2.6, range 0.75 –12.2). Across demographic groups, the NNT ranged from 10 to 72.
Conclusion: Among older personswith hip, clinical vertebral, orwrist/forearm fracture, the riskfor death almost always exceededthe risk for a second fracture.Despite this, the NNT needed totreat to prevent a secondfracture fell within a rangeusually considered cost-effective.

24 — 2009 Annual Meeting
Poster Number 112 Central DXA
Bilateral Hip Scanning Leads to Additional Testing That May Benefit thePatient
Diana Heckadon, HealthEast Clinics; Gary Knudsen, HealthEast Clinics; ChristineSimonelli, HealthEast Clinics
We have the ability to perform bilateral femur measurements and in most casesthere is little variability between the right and left measurements. In some facilities,unilateral femur measurements are the protocol. However, discrepancy between thefemur measurements can be a clue that leads to an underlying disorder. Two caseswere examined that demonstrated a large discrepancy between femur measurements.In each case discrepancy between the femur measurements led to further testing. Inthe first case, a baseline exam demonstrated a total proximal femur T-score of -1.6on the right and 3.0 on the left. This would have led to a compromised study if theright femur had not been included; and if unilateral femur scanning was performed,the left femur would have been the most common side to scan. Both the right femurand the spine demonstrated low bone mass. However, the right femur measurementof -1.6 was lower than the spine L 1-4 with a T-score of -1.2. In addition, a moderatewedge deformity was identified by lateral vertebral morphometry. As a result, x-rayswere advised leading to a diagnosis of Paget’s disease. In the second case, the currentscan was compared to multiple scans over a five year duration. The total femurcomparison on the right showed an increase of 31.7% compared to an increase of4.5% on the left since the first scan. There was a 12.9% increase since the previousscan on the right and no significant change on the left. Incidentally, an unusualdensity was noted within the right femur prompting radiographic follow-up. A focusof compact bone within the cancellous bone of the femur was seen, consistent withan enostosis or bone island. Bilateral hip scanning can demonstrate a discrepancybetween femur measurements that may lead to additional diagnosis and improvedpatient care.
Poster Number 113 Central DXA
Effect of Spinal Height on Spinal Bone Mineral Density Between Withand Without Hips Flexion
Yi-Shi Hwua, Central Taiwan University of Sc Science and Technology, Taiwan; Bao-Yuan Huang, Central Taiwan University of Science and Technology, Taiwan; Mu-YiHua, Chang Gung University, Taiwan; Hsiao-Wei Wen, National Chung HsingUniversity, Taiwan
Although the modern dual-energy X-ray absorptiometry (DXA) scannermanufacturers recommended that patients unnecessarily keep their hips flexed by90? during the measurement of spinal bone mineral density (BMD), there is nouniform opinion on the positioning of legs while scanning the lumbar spine. Using aGE Lunar DPX-MD+ scanner to measure spinal BMD in 13 young women, from L1to L4 in posterior-anterior projection, first the scan was done with their legselevated as recommended by the manufacturer and then with their legs flat on thescanning table. Differences of BMD, T-score, Z-score, bone mineral content (BMC),area of the region of interest (ROI), width and height of the total spine between the2 scans were compared. The mean (SD) age of the women was 20.4 yr (0.2 yr),height was 163 cm (4), body weight was 54 kg (9), and the body mass index (BMI)was 20.6 (3.6). Paired student’s t-test for an L1-L4 PA showed all of the BMD, BMC,region of interest (ROI), T-scores and Z-scores changed significantly between the 2scans (p < 0.05). With spinal BMD measured in the legs-down position, thepercentage change (1.33 %) of BMD was higher than these measured in the legs-upposition. Between the 2 measurements, BMD, T-scores, Z-scores, BMC, the area of theROI, width and height showed high correlations (r = 0.985, 0.982, 0.980, 0.997,0.980, 0.967 and 0.931, respectively). According to these data, we have also foundthe major BMD difference of L1-L4 between 2 legs-up and legs-down position wascreated by L1(1.049 g/cm2, 1.061), L3(1.160, 1.180), L4(1.109, 1.130), L3-4(1.131,1.152), L1-L3(1.116, 1.127), and L2-L4(1.131, 1.145), respectively (p<0.05), but thechanges in L2, L1-L2 and L2-L3 were not significant. Legs-elevated position willincrease spinal height was involved in BMD values of L1, L3, L3-L4 and L1-L3,respectively (p<0.05). Either spinal BMD was measured with their legs elevated ordown, 12 women were found to have normal BMD but 1 woman was found tohave low bone mass. In conclusion, significant increase in the total spinal BMD wasfound when the BMD in a group of young women was measured with their legspositioned flat, and shorter spinal height might be the major factor involved in theresults.
Poster Number 114 Central DXA
Supine vs. Sitting Forearm Measurement in a Chinese Population
Jinhua Zhao, The First People’s Hospital, Shanghai Jiaotong University; Qi Zhou, GEHealthcare; Wenya Jin, The First People’s Hospital, Shanghai Jiaotong University; WynnWacker, GE Healthcare; Howard Barden, GE Healthcare
Forearm BMD measurements with DXA have traditionally been taken with subjectseated beside the scanner and forearm positioned on the scanner bed.Improvements in patient throughput, comfort, and safety would be achieved if theforearm could be measured with subject in the conventional, supine position usedfor spine and femur scans. We measured the forearm of 25 male and 25 femaleChinese subjects (age 23-52 years) with DXA (Prodigy), with the forearm positionedin the sitting and supine positions. The standard enCORE software adjustment forsupine position was applied to the BMD values for radius 33%, radius UD(ultradistal), and radius total ROIs to give sitting-equivalent values. The supine resultswere regressed on thesitting values throughthe origin, and 95%confidence intervalscalculated for theslope. Table 1 showsthe regression slopewith 95% confidenceintervals, correlationcoefficient, and thestandard error ofestimate for eachregression. Only theradius 33% ROI had aslope significantlydifferent from 1. Basedon the slope, thesupine 33% BMDwould average 1%higher than the sittingvalue. This difference,amounting to less than0.1 T-score in thediagnostic BMD range,was clinicallyinsignificant.
Poster Number 115 Central DXA
Dual-energy X-ray Absorptiometry (DXA): Frequency of Difficulties withSpine and Femur Measurements
Malachi McKenna, St. Vincent’s University Hospital; Susan van der Kamp, St. Vincent’sUniversity Hospital; Oliver FitzGerald, St. Vincent’s University Hospital
According to the International Society of Clinical Densitometry (ISCD) in its 2007Official Positions, central DXA at lumbar spine (postero-anterior L1-L4), totalproximal femur or femoral neck should be used for diagnosis of osteoporosis.Sometimes hip DXA cannot be performed due to prior surgery; lumbar spinemeasurements may be compromised due to degenerative changes or fracture. ISCDrecommends that a vertebra be excluded from analysis if it is non-assessable or ifthere is more than 1.0 T-score difference between adjacent vertebrae; there must be2 evaluable vertebrae. As written, the ISCD guidelines favour deletion of L1 and L4compared to either L2 or L3; we modified the exclusion guidelines to equalize thechance of exclusion – namely, more than 1.0 T-score difference between vertebra(e)in question and all other vertebrae. We surveyed our DXA practice over a calendaryear from June 2007 to May 2008 in order to evaluate difficulties with DXAdiagnosis. Confining our studies to subjects aged 50 years and over (n=2615), allpatients could be assessed at either spine or femur giving a diagnoses of osteoporosis(30.4%), osteopaenia (42.9%) and normal bone density (26.7%). The femur couldnot be evaluated in 57 subjects (2.2%) and the spine in 5 (0.2%). Spine DXA had tobe curtailed in 301(11.5%) subjects to either 3 vertebrae in 217 subjects or 2vertebrae in 84 subjects. The number of deletions per vertebrae was as follows:L1=96; L2=62; L3=75; L4=152. Bone mineral density Z-score was similar betweenthose with and without deleted vertebrae at spine (0.044±0.081 vs 0.064±0.030;p=0.445) and femur (0.265±0.070 vs 0.241± 0.023; p=0.144). Central DXA gave adiagnosis in all subjects. Expertise is needed in excluding vertebrae from analysisthat in turn enhances the diagnostic information gained from DXA.

— 2009 Annual Meeting 25
Poster Number 116 Central DXA
Accurate Measurement of Hip Axis Length
Eric Lee, University of California, San Francisco; Mary Sherman, University ofCalifornia, San Francisco; Bo Fan, University of California, San Francisco; JoanneDorgan, Fox Chase Cancer Center; John Shepherd, University of California, SanFrancisco
The Hip Axis Length (HAL) is defined as the distance from the outer edge of thegreater trochanter along the femoral neck axis to the inner pelvic brim. Hologicstandard global region of interest (ROI) in femur scans may or may not include thebony edge of the pelvis inlet. The aim of this study is to investigate change in HALand bone density measurements if Hologic’s global ROI in femur scan is adjusted toinclude the pelvic brim.One-hundred fourteen (114) female femur scans (mean age27.1 ± 0.9 ranged from 24 to 30 years old) from Dietary Intervention Study inChildren (DISC) were acquired on Hologic Delphi A and W DXA systems. They werecentrally analyzed with APEX software (version 3.0) according to the manufacturer’sstandard definition of global ROI. Each femur scan was then manually inspected toidentify the scans where the global ROI did not include the pelvis brim. These scanswere reanalyzed with a wider global ROI to include the pelvic brim in the top innercorner of global ROI.A paired t-test was used to compare the mean difference inHAL, bone mineral densities (BMD), bone mineral content (BMC) and area offemoral neck, trochanter and total femur regions before and after the adjustment offemoral global ROI. Of the 114 femur scans, 50 scans were adjusted so the global ROIincluded the pelvic brim. Our results showed that there was a significant increase inHAL (2.62mm, p<0.001.) There was a clinically small but statistically significant meandifference in BMD of 0.0023g/cm2, 0.0025g/cm2 and 0.0028g/cm2 for trochanter,neck and total femur respectively. BMC of neck and total femur also significantlychanged while areas remained the same. See Table 1. This study shows that usingHologic’s standard rule will misidentify the HAL about 44% of the population. Thismay affect estimates of hip fracture risk that use HAL. Studies have shown that eachcentimeter (10%) increase in HAL increases hip fracture risk by approximately 50%.We estimate that in our population,the mean difference of 0.262cmwould represent an increase inperceived hip fracture risk by asmuch as 13%. We conclude that caremust be exercised when using thecurrent global ROI definition byHologic for quantifying HAL.Changes in the ROI definition couldbe made that would improve HALmeasures with marginal changes inthe bone density measures.
Poster Number 117 Central DXA
Correlation of Bone Mineral Density (BMD) of the Lumbar Spine, Femurand Radius by Dual X-Ray Absorptiometry (DXA) in Thai Perimenopausaland Menopausal Women, Who Received the DXA Measurement in Facultyof Medicine, Chiang Mai University, Thailand.
Sirianong Namwongprom, Intructor of Nuclear Medicine, Chiang Mai University,Thailand
OBJECTIVE: To determine the correlation of BMD in various skeletalsites include lumbar spine, non-dominant proximal femur and 1/3radial site (non-dominant side). MATERIAL AND METHOD: The dataof this study was collected from the medical records and the BMDresults of perimenopausal and postmenopausal women who had thestandard BMD measurement in Division of Nuclear Medicine,Department of Radiology, Faculty of Medicine, Chiang Mai Universitybetween January 2007 and December 2007. BMD was measuredusing DXA (Hologic, QDR-4500C). Women who had disease ortreatment known to affect bone and calcium metabolism, history ofsurgical menopause, and history of fracture or bone surgery at themeasurement sites were excluded from this study. We applied theWHO classification to axial BMD measurements as the gold standardfor defining the risk of osteoporosis. RESULTS: 885 women wereincluded in this retrospective study. Mean age (± SD) was 55.8 ± 9.3year. The lowest BMD was found 51.6% at lumbar spine (LS), 29.2 %at 1/3 radial site, 13.8% at femoral neck (FN), 2.9% at total femur (TF)and 2.5% at trochanter region (TR). There was found to be significantcorrelation between age, BMI, duration of menopause and BMD at theLS, TF, FN, TR and 1/3 radial site (p<0.01). No significant correlationwas found between the BMI and the duration after menopause(p=0.17). The correlation between the BMD measures at LS, and TF,FN, TR and one-third radial site were 0.708, 0.667, 0.721 and 0.633,respectively (p < 0.01). For the different sites of the proximal femur,this study found statistically significant correlation between TF, FN andTR regions; r=0.935 (TF vs TR), r=0.893 (TF vs FN), r= 0.830 (FN vsTR). Women with perimenopausal status had higher height and BMDvalues at all five observed sites than postmenopausal women. Thedifference was significant for both height and BMD values at all sites (p < 0.01).However, there were no statistically significant differences of the weight and BMIbetween two groups. This study also classified postmenopausal women into earlygroup of menopause (EGM, = 5 years) and late group of menopause (LGM, >5years). The similar findings were demonstrated in these two groups. CONCLUSION:This study found good correlation of BMD from various skeletal sites.Interestingly,correlation was found highest between LS vs TR,and TF vs TR. Clearly,estrogen-deficient plays important role on the low BMD values in all skeletal sites.
Poster Number 118 Central DXA
Disagreement in the Diagnosis of Osteopenia and Osteoporosis in theSpine and Hip Regions
Diana Wiluzanski, A.L.Ronco, A.Perroni Centróseo Clinic, Montevideo, Uruguay
Introduction: The aim of this paper is to study the disagreement in the diagnosis oflow bone density (osteopenia) and osteoporosis through bone densitometry incolumn A-P, femoral neck and total hip. Method: We studied a retrospective database of densitometries carried out with a GE Lunar Prodigy Advance densitometer.We analyzed data on 527 postmenopausal women (mean age 62.5 ± 8.1) who madeconsultations in our Clinic during 2006-2008. Age, age at menopause, T-score (TS)and bone mineral density (BMD) at the spine (L1-L4 vertebrae), femoral neck andtotal hip were measured and registered. Pearson correlation coefficients werecalculated for both variables in the whole sample and for age groups (in tertiles).According to densitometry, patients were categorized in significant osteopenia (OPN)having TS <= -2.0 and osteoporosis (OPS) having TS <=-2.5. We determined thefractions having OPN and OPS in only one region and not in the other one. Results:There were 138 patients with OPN only at the spine region (26.2 %) and 21 only atthe hip (4.0 %). Of the 242 with OPN at the spine, 104 (43.0 %) had it also at thehip. Osteoporosis was present at any region in 185 cases (35.1 %). Besides, OPS wasdetected in 128 cases only at the spine (24.3 %) and in 15 cases only at the hip (2.8%). Of the 170 patients with OPS at the spine, 42 cases had it also at the hip (24.7%). Regarding the correlation between BMD at spine and femoral neck, it wasmoderate for the whole sample (r =.62) and a decreasing trend was observed alongthe age groups: r= .66 for ages less than 58, r=.64 for ages 58-65, and r= .55 forages greater than 65 years. Conclusion: the determination of BMD in only oneanatomic region seems not to be adequate for densitometric classification of patients,and in fact, this is even more remarkable for the older age groups, which showed thelowest correlations between BMD of both anatomic regions.
Poster Number 119 Central DXA
Reference Data of Forearm Bone Mineral Density in Healthy IndonesianWomen
Gunawan Tirtarahardja, Jakarta Osteoporosis Center, Medistra Hospital; Qi Zhou, GEHealthcare; Howard Barden, GE Healthcare
Osteoporosis is a major public health problem, particularly in women. We reportedIndonesian bone mineral density (BMD) of spine and hip at the 2006 ASBMR meeting.We now report Indonesian female forearm reference data and compare Indonesianvalues with USA and Asian reference values. A total of 791 Indonesia healthy womenaged 20-95 years were studied. The non-dominant forearm was scanned by DXA(GE-Lunar Prodigy). The peak BMD for all forearm regions (Radius UD, Radius 33%,Radius Total) occurred between the ages of 30-39 years (Table 1). Indonesian forearmBMD values for young adults were 4% to 7% lower than USA reference values, butonly 0.2% to 3% lower than Asian young adult values. In later years, all forearmregions lost bone steadily with increased age, similar to the age-related BMD declinefound in USA and Asian reference data (Figure 1). These Indonesian-derived forearmreference values should improve clinical diagnosis and patient management of boneloss for Indonesian women.

26 — 2009 Annual Meeting
Poster Number 120 Central DXA
Implementation of FRAX in a Clinical Practice. Are we MissingSomething?
Jorge Ferreira, Consultorio de Radiodiagnostico de Odivelas; Ana Almeida,Consultorio de Radiodiagnostico de Odivelas; Ana Ferreira, Consultorio deRadiodiagnostico de Odivelas; Catarina Costa, Consultorio de Radiodiagnostico deOdivelas; Leonor Bastos, Consultorio de Radiodiagnostico de Odivelas; Marilia Jacinto,Consultorio de Radiodiagnostico de Odivelas; Anabela Almeida, Consultorio deRadiodiagnostico de Odivelas; Isabel dos Santos Silva, London School of Hygiene andTropical Medicine
The WHO fracture risk assessment tool (FRAX), which is based on several clinicalrisk factors and on the value of the femoral neck bone mass density (BMD), wasadopted in our clinic in May 2008. We studied a group of 178 postmenopausalwomen (mean age=61.5, SD=9.5 years) who were screened consecutively forosteoporosis in our clinic from May to December 2008.Seventy percent of thepatients were overweight (bone mass index (BMI)>24.9 kg/m2) and 16% were obese(BMI>29.9 kg/m2). 45% patients had at least one risk factor for bone fracture, with7% having at least two risk factors. A total of 66 patients (37%) had spine T-scoreswhich were at least 1 SD lower than their corresponding femoral neck scores, with29 (16%) being placed in a different WHO diagnostic category.The FRAX model doesnot take into account the value of the T-score of the spine in its assessment of thefracture risk, and it appears to give different weights to different clinical risk factors.Our findings suggest that in addition to the major osteoporotic/hip values estimatedby the FRAX model, low T-scores in the spine should not be forgotten.
Poster Number 121 Central DXA
Bone Density Analysis Using Dual Energy X-Ray (DXA) BoneAbsorptiometry in Clinical Investigation.
Claudia Maksoud, CEPEM; Cristina Iruzun, CEPEM; Christiane Silva, CEPEM
Osteoporosis is a silent disease and dual energy x-ray (DXA) bone absorptiometry isstill considered the gold standard method for the diagnosis and follow-up. Our goalwas to investigate the osteoporosis prevalence and bone mineral densities less thenexpected for age. We studied 408 females referred for clinical investigations,performing DXA analysis, including pre and postmenopausal women. We summarizethe bone mineral density (BMD) of lumbar spine, femoral neck and total hip, with T-scores and Z-scores. The cutoffs for osteoporosis was based on the WHOinternational standard. The difference between means of BMD spine and femoralneck for postmenopausal and pre-menopausal women was statistically significant(p<0.000). In other hand, the difference between means of BMD femoral neck agegroups was statistically significant and between means of BMD spine wasn´t. Theprevalence risk factor was 13,2% for cigarette smoking, 10,2% for fracture familyhistory, 16,9% for previous fracture analysis. In the presence of the last risk factor,the difference between spine BMD almost achieved statistical significance (p=0,06).The prevalence of osteoporosis among postmenopausal females (n=335) was 14%.Considering lumbar spine and femoral neck T-score for the diagnosis of normal,osteopenia and osteoporosis, the agreement was 65%.When considered the femoralsite as a gold standard, osteoporosis and osteopenia was around 21% underestimate.The prevalence of osteoporosis was higher in the group of postmenopausal womenup 70 years (55%).In 17% of the cases of premenopausal women (n=72) we foundbone mineral densities less than expected for age. For patients in premenopausalstage the DXA studies may be a tool to identified patients at a higher risk for futureosteoporosis.Osteoporosis was better identified considering BMD of femoral neck. Inthe older group the femoral neck evaluation was more confident than the lumbarspine, probably because it was less compromised by spine degenerative changes.
Poster Number 122 Central DXA
Which Vertebrae Should be Included in Reporting Spine Bone Density byDEXA?
Ruth Freeman, Albert Einstein College of Medicine; Judi Chervenak, Albert EisnteinCollege of Medicine; Monisha Samanta, Montefiore. Medical Center
Historically DEXA software reported spine bone density (BD) based on the resultsof L2-L4. (1) More recently some of the different machines use L1-L4 as the standardgenerated report. There has been a suggestion that any low BD vertebra isassociated with increased risk of fractures. Bone densitometry is used to identifyindividuals at increased risk of having non-traumatic fractures of the hip or spine.(2) Many patients, especially older ones, have arthritic changes in the spine falselyelevating the BD, often at L4. This study based on our BD data,attempts to determinewhich lumbar area provides the best data. 203 consecutive BD test were reviewed.The lowest overall summary T score was identified as the T score of L1-L3 in 105patients; 86 were lowest at L2-L4 and only 13 were lowest at L1-L4. Ages betweenthe groups were not different. In 61 BD studies L4 was >1 standard deviation abovethe T score for L1-L3, often in the normal range, wheras L1-L3 was in osteopenic orosteoporotic range.In conclusion if would be more effective to use L1-L3 excludingthe abnormal L4 in routine reports. The L1-L4 T score is least likely to provide thelowest T score and correctly identify patients with low BD. Excluding L4 and usingL1-L3 would be provide the most useful data. 1) Schousbe JT Appl Health EconHealth Policy 2008;6:1.2) Ott SM, Ichikawa LE, Lacroix AZ, Scholes D. J ClinDensitom 2008;Nov 4th {Epub ahead of print}.
Poster Number 123 Central DXA
Re-Training Technologists Improves Patient Positioning for DXA andPrecision
Chanika Sritara, Ramathibodi Hospital, Mahidol University; SasithornAmnuaywattakorn, Ramathibodi Hospital, Mahidol University; KrisanatChuamsaamarkkee, Ramathibodi Hospital, Mahidol University; Sasivimol Promma,Ramathibodi Hospital, Mahidol University; Kanokon Poonak, Ramathibodi Hospital,Mahidol University; Suchawadee Musikarat, Ramathibodi Hospital, Mahidol University;Ratanaporn Toengkhuntod, Ramathibodi Hospital, Mahidol University; OrayaWongkaew, Ramathibodi Hospital, Mahidol University; Chirawat Utamakul,Ramathibodi Hospital, Mahidol University
Patients with osteoporosis can be diagnosed and monitored with dual energy X-rayabsorptiometry (DXA). However, the DXA bone mineral density (BMD) can beaffected by improper positioning. The aim of this study was to assess whether re-training the technologists performing DXA improved positioning, which in turn,improved the quality of the BMD determination and precision. First, DXA imagesof 160 hips and 160 spines without gross scoliosis were retrieved from the databasefor evaluation, half of which were scanned before and the other half after sometechnologists had undergone the International Society for Clinical Densitometry(ISCD) technologist training course and had shared the knowledge with theircolleagues. An ISCD certified clinician evaluated each image after the date of thescan was masked to avoid bias. For proper spine DXA, the lumbar spine must bestraight and positioned at midline. The scan must include T12 and L5 vertebrae andboth iliac crest. For the hip, the scan must have straight femoral shaft, minimalvisualization of the lesser trochanter, and include the ischium and greatertrochanter. Secondly, the least significant change (LSC) of the hip and femoral neckwas determined according to the ISCD recommendation. Improper positioning wasreduced from 47.5% to 21.3% (26.3%, 95%CI 11.5%, 41.0%) for the hip, and from66.3% to 57.5% (8.8%, 95%CI -6.3%, 23.8%) for the spine. After re-training the 95%limits of the LSC of spine and the femoral neck have been reduced from 4.99% to2.61% and 5.92% to 3.78%, respectively. In conclusions, although re-training thetechnologists did not statistically improve positioning of the spine, it did lead tostatistically significant improvement in positioning of the hip and precision at bothsites.

— 2009 Annual Meeting 27
Poster Number 124 Central DXA
Use of External Quality Control Site for Validation of DXA Data
Sunil Wimalawansa, UMDNJ-RWJMS
Bone Mineral Density (BMD) can be measured at several skeletal sites, including thelumber spine, femoral neck, total hip, and the forearm. Lumbar spine and dual hipsites are routinely performed in most centers. Here we describe DXA studies doneo in 186 women over a five year period (a three year follow-up) using a GE-LunaDXA Prodigy scanner. We have submitted a duplicate set of DXA scans to anindependent evaluation site for validation of data. These studies were done withoutreferring to the scanned-analyzed at the primary site; UMDNJ-RWJMS. Dataconsisted of baseline, 6 months, 12 months, and 24 months. Complete set of datafrom 36 months was not available at the time we send the DXA scans to the QA site.Study group consist of postmenopausal women (13 months to 10 years since lastmenses, and 18 percent was non-Caucasians. Half the women were within five yearsof menopause and reminder were between 5 and 10 years since menopause.Overall, study revealed a normal distribution of BMD across this study population.Table below indicate the BMD values as analyzed at the primary site vs. data analyzedat the independent quality assurance site.Timing of # Subjects Mean SEM p valueBMDBase LinePri. Site 186 1.0769 0.006 0.018186* 1.0611 0.0052 0.51QA site 179 1.0588 0.0061
6 monthsPri. Site 182 1.0765 0.0067 0.036182* 1.0603 0.0059 0.91QA site 180 1.0596 0.0065
12 monthsPri. Site 180 1.058 0.0069 0.912180* 1.0576 0.006 0.693QA site 180 1.0596 0.0067
24 monthsPri. Site 175 1.0573 0.0072 0.075175* 1.0512 0.0066 0.245QA site 175 1.0469 0.0069
Data revealed a non-statistical slightly higher BMD data for the entire group in theprimary site in comparison to the QA site. In part this was due to the non-correction of the repeat scans to the base line scan positioning using the copyfeature of the GE-Lunar GE machine. Corrections of this using the copy-featurelead to virtually identical results between the twogroups of analysis. In conclusion, the data generatedfrom the GE-Lunar Prodigy DXA machine is highlyaccurate, as indicated by this comparison of datafrom an independent DXA quality assurance site. Infollow-up DXA scans, if one uses built-in copyfeature and position patients correctly, there is noneed to have external quality assurance program tovalidate DXA data.
Poster Number 125 Central DXA
The Importance of Lean Body Mass in Bone Mineral Density of Post-menopausal Women
Mee-Ran Kim, The Catholic University of Korea
Objective: The aim of the study is to investigate the importance of lean body mass inbone mineral density (BMD) of post-menopausal women.
Materials and methods: BMD of lumbar spine and both femur were measured withDual-Energy X-ray Absorptiometry (DXA), Lunar Prodigy Advance TM (GEhealthcare, United States of America) in 55 healthy, post-menopausal women, agedbetween 50 and 77 years old. The candidates were selected from patients who visitedmenopausal clinic in department of gynecology, Kangnam St. Mary’s hospital, Catholicuniversity of Korea. Lean body mass and fat mass of both arms, legs, trunk and BMDof lumbar spine, both femur neck, trochanter were measured with DXA.
Results: The mean age was 57.19 ± 6.13 (range 50 - 77) years old, height 156 ± 5cm, weight 57.82 ± 5.80 kg, body mass index 23.73 ± 2.42. In post-menopausalwomen, percentage of android fat mass (42.84 ± 6.12%) was higher than that ofgynoid fat mass (39.57 ± 4.37%). There was negative correlation between BMD ofboth femur and android fat mass, total fat mass. Each fat mass of arms, legs, trunkand gynoid fat mass showed no significant correlation with BMD. Lean body mass oflegs, trunk had significant correlation with BMD of lumbar and femur, although thatof arms did not.
Conclusion: Body fat mass had little significance in correlation with BMD, except forandroid and total fat mass of the body, which had negative correlation with femurBMD. Lean body mass of legs, trunk showed significant relation with BMD. Inconclusion, as android fat mass and total fat mass decrease, BMD increases and leanbody mass of legs, trunk increase, BMD increases. Therefore, it will be helpful forincreasing BMD to do adequate exercise in order to increase lean body mass inpost-menopausal women.
Poster Number 126 Central DXA
Body Composition Assessment Using Siri Underwater Equivalent PercentFat Assessed by Norland Equipment
Chad Dudzek, Norland—a CooperSurgical Company; George Ekker, Norland—aCooperSurgical Company; Kathy Dudzek, Norland—a CooperSurgical Company; TomSanchez, Norland—a CooperSurgical Company
Assessment of body composition by DXA is showing significant interest in the clinicalcommunity. The current study examines effectiveness of the Norland based DXA SiriUnderwater Equivalent Percent Fat to reflect clinically labeled conditions ofUnderfat, Healthy, Overfat and Obese. A population of 150 subjects (75 malesbetween 20 and 77 years old with a Body Mass Index between 16.0 and 42.8 and75 females between 20 and 74 years old with a Body Mass Index between 17.3 and41.9) underwent whole body studies using a Norland XR-46 fitted with Illuminatussoftware. Careful measurements of height and weight were also obtained immediatelybefore scanning. The accuracy of DXA measurements in these subjects wasconfirmed by comparing the total body weight measured by DXA (bone mass +lean mass + fat mass) to the total body weight measured by scale (y = 0.9931x +0.599, r=0.9993, p<0.0001 for the population; y = 0.995x + 0.3373, r=0.9990,p<0.0001 for the male population and y = 0.9956x + 0.504, r=0.9996, p<0.0001for the female population). The Siri fat mass measured by DXA was found byregression to reflect the measured percent of soft tissue that is fat (y = 1.1124x +4.5845, r=9868, p<0.0001 for the population; y = 1.0806x + 4.5066, r=9953,p<0.0001 for the male population; y = 1.0442x + 7.8608, r=9652, p<0.0001 for thefemale population). The concurrence between DXA determined compositiongrading—based on the Siri Underwater Equivalent Percent Fat—and Body MassIndex based composition grading was 57% for the population, 56% for the malepopulation and 57% for the female population (94% concurrence for the fullpopulation, 95% for the male population and 93% for the female population whenboundary grading was considered). The study demonstrates that the Norland basedDXA Siri Underwater Equivalent Percent Fat Mass is effectively measuring in vivototal body fat mass. The study also demonstrates that the Norland based grading ofUnderfat, Healthy, Overfat and Obese are reflecting composition in these individuals.
Poster Number 127 Central DXA
Cross Calibration of Whole Body Scans Between GE-Lunar and HologicSystems
Bo Fan, Department Radiology, University of California San Francisco; X.P. Wu, SecondXiang-Ya Hospital, Hunan, China; M.A Levine, CHOP , University of PennsylvaniaSchool of Medicine; W Wacker, GE Healthcare, Madison, WI; H.S. Barden, GEHealthcare, Madison, WI; David Ergun, GE Healthcare; John Shepherd, DepartmentRadiology, University of California San Francisco
We investigated the relationship between GE-Lunar and Hologic systems for wholebody DXA, as well as derived conversion equations between these two systems. Thiswork extends previous work with more systems, representing both adult andpediatric results. Three hundred four participants (77 male) were recruited for thisstudy from the US (49, aged from 6 to 16 years old) and China (205, aged from 14to 81 years old) with mixed ethnicity. The mean age of the participants was 44.2 ±20 yrs. Each participant was scanned on both GE-Lunar Prodigy and Hologic DelphiDXA systems on the same day using each manufacturer’s standard scan mode,positioning, as well as analysis protocols. The scans were analyzed using Hologicversion 12.5 and GE-Lunar version 9.15 at the US study site, whereas the Chinastudy site used Hologic version 11.2 and GE-Lunar version 10.5. The Hologicversions are identical in their results for adults but differ for children below 40 kg.The Prodigy versions are identical for both children and adults. All participantsbelow 40 kg were from the US site only. Thus, this comparison is equivalent to acomparison of Hologic version 12.5 to the Prodigy. Paired t-tests were used to testthe results differences between the systems. Deming regression was used to derivethe cross calibration equations.The results for body composition and BMD werehighly correlated between the Hologic and GE-Lunar systems, with r ranging from0.96 (%Fat) to 0.98 (BMC). As expected, there were significant differences betweenthe two systems for all variables (p<0.05 or less). The average absolute differences for%Fat, BMC and BMD were 2.5%, 235.7 g and 0.031 g/cm2, respectively. Theindividual regression models were similar to the pooled regression results. Thepooled cross-calibration formulas are presented in Table 1. After cross-calibration, nosignificant differences remained between actual GE-Lunar results and the resultsconverted from Hologic. The mean differences for %Fat, BMC and BMD werereduced to 0.006%, 0.81g and 0.005 g/cm2, respectively. Our results suggested theneed of standardization equations forconverting the whole body BMD andcomposition results between GE-Lunarand Hologic systems. The equations wederived could reduce result differencesbetween Hologic and GE-Lunar systemsand could be used to pool study resultsfrom these two systems in clinical orepidemiological studies.
28 — 2009 Annual Meeting
Poster Number 128 Central DXA
Lateral Distal Femur Bone Mineral Density: Application in Spina Bifida,Another Pediatric Population at Risk
Heidi Kecskemethy, A.I. duPont Hospital for Children; H. Theodore Harcke, A. I.dupont Hospital for Children; Rochelle Haas, A.I. duPont Hospital for Children;Maria LoPiccolo, A.I. duPont Hospital for Children; Rochelle Dy, A.I. duPont Hospitalfor Children; Steven Bachrach, A.I. duPont Hospital for Children
The lateral distal femur (LDF) is an alternative site used to measure BMD in childrenwith disabilities. While studies examining LDF bone mineral density (BMD) inchildren with muscular dystrophy and cerebral palsy have been published, there areno studies of lower extremity BMD in the Spina Bifida (SB) population. Spinedeformities and/or internal devices limit ability to acquire whole body and lumbarspine (LS) scans in this population. Sixty-four children (36 female) 3-21 years (mean12.3) with SB were enrolled in the study. Data collected on each subject included:ambulatory status, fracture history, Tanner stage, neurologic examination todetermine level (high=above L3, mid=L3-L4, low=L5 and below), and dual energy x-ray absorptiometry (DXA) of the LDF and if possible, the LS. LDF BMD results werereported as Z-scores for three regions of interest (metaphyseal, metadiaphyseal anddiaphyseal). Multivariate analyses were performed to examine relationships betweenLDF BMD and the other variables. LDF DXA scans were obtained on all subjects.Twenty valid LS DXAs were obtained and of those, there was a 90% agreement ratewith the LDF results. Non-ambulatory children yielded no usable LS data. LDF BMDZ-scores were lowest in non-ambulatory and high level subjects. All regions reflectedthis finding with significant mean differences between ambulatory and non-ambulatory groups (p<0.05). Of the 23 subjects who were Tanner 5, only 3 hadnormal BMD values in all LDF regions. No correlation was found between BMD andfracture.The LDF is a reliable DXA site to measure in children with SB. Clinicallymeaningful LS DXAs could be obtained on fewer than 1/3 of the subjects and onnone in the highest risk group. Reduced BMD was observed in children with SB,particularly those with no ability to ambulate. A high neurologic level and sexualmaturation are additional risk factors for low BMD. Low LDF BMD did not correlatewith gender or fracture history.
Poster Number 129 Central DXA
Evaluation of the Android/Gynoid Regions for Hologic Pediatric WholeBody Scans
Mary Sherman, Sr. Radiologic Technologist, UCSF, San Francisco, CA; Bo Fan, UCSF, SanFrancisco, CA; Li Wang, UCSF, San Francisco, CA; Karen Winer, CTASC, Baltimore, MD;John Shepherd, UCSF, San Francisco, CA
With obesity at an epidemic level worldwide, there is a need for more advanceddescriptions of adiposity. The android/gynoid (A/G) sub-regions on whole body DXAscans could potentially be useful in describing the risk associated with different bodyshapes and fat distributions in the pediatric population. This study describes theprecision and range of these variables across 3 age groups.Duplicate whole bodyscans were acquired on 154 pediatric participants (ages 6 to 16 years) using eitherHologic DXA 4500A or 4500W scanners (Hologic, Bedford, MA, USA). Theparticipants’ second scans were done on the same day with repositioning by thesame technologist. All scans were analyzed using Hologic Apex 3.0 by two ISCD-certified operators using the manufacturer-recommended compare mode betweenthe baseline and follow up scans, without altering the placement of the shoulder orpelvic lines and minimal change of points horizontally. The android and gynoid sub-regions were automatically located over the abdomen, and over the lower pelvisand upper femurs respectively.The results were reported as a ratio of the androidand gynoid percent fat (A/G ratio) in 3 age groups (ages 6 to 9, 10 to 12, and 13to 16 years). Precision was expressed as an RMS standard deviation using SAS. (SASInstitute, Cary, NC) The precision of the A/G ratio was shown to be very good for allthree age groups: RMS SD about 0.029. This implies a least significant change (LSC)of around 0.08. The A/G ratio ranged from 0.47 to 1.27. Thus, the ability tomonitor change in the A/G ratio is excellent. Our results demonstrate that the A/G ratio should be considered as a valuable tool for monitoring body fat distributionin studies for pediatrics.
Poster Number 130 Central DXA
Are HSA and HAL Useable Analyses in Pediatric Populations?
Li Wang, University of California, San Francisco; Bo Fan, University of California, Sanfrancisco; Babette Zemel, Children’s Hospital of Philadelphia; Heidi Kalkwarf,Cincinnati Children’s Hospital; Karen Winer, National Institute of Child Health andHuman Development; John Shepherd, University of California, San Francisco
The Hip Structure Analysis (HSA) option in the new APEX 3.0 software from Hologicis the measurement of geometric contributions to bone strength in the proximalfemur. Since the precision of measurements can vary due to bone density and bodysize, the purpose of our study was to assess the repeatability of HSA and Hip AxisLength (HAL) in growing children using APEX 3.0 as well as its usefulness in pediatricstudies. 1554 healthy children between 6 and 16 years of age were enrolled in theBone Mineral Density in Children Study. The left femur was measured by a dual-energy X-ray absorptimetry (DXA), using Hologic 4500A /W devices. To assess theprecision of the device, a subset of 155 children was scanned twice withrepositioning. The baseline scans were re-analyzed using Hologic APEX 3.0. Thevariables studied were HAL, bone mineral density (BMD), cross-sectional area (CSA),cross-sectional moment of inertia (CSMI), and section modulus (Z) for both FemoralShaft (FS) and Narrow Neck (NN). The mean values were calculated in each agegroup for boys and girls separately; annual rates of change were calculated betweentwo consecutive ages. The precision was determined for four age groups (A:14 to 16yrs, B: 10 to 13 yrs, C: 6 to 9 yrs, Pool:6-16 yrs) and calculated in terms of a percentcoefficient of variation (%CV) for rest of the variables. Monitoring time interval (MTI)was also calculated using formula (MTI=2.77*Precision/Annual change rate). The meanvalues of all variables increased as function of age. The annual change rate rangedfrom 3.74% (FS_BMD) to as high as 34.5% (NN_CSMI). In general, the oldest agegroup had the better precision for all the variables, with the %CV ranging from 1.1% (FS_CSA) to 2.0 % (FS_CSMI). The youngest group had generally the poorestprecision, ranging from 2.6 % (CSA) to 5 % (NN_Z). The %CV in Pool group of NNranged from 2.3 (CSA) to 5.8 (CSMI), the annual change rate of NN ranged from2.05% (BMD) to 34.5% (CSMI), and thus the MTI ranged from 0.6 year(Z) to 3years (BMD). FS had the shortest MTIs (0.2 to 1.3years) as the result of goodprecision and high annual change rate. In conclusion, the precision for Hologic HSAmeasurements for children varied with age but were found to be similar to previousreports on adults. Given, the reasonable MTIs, the HSA and HAL measures may beuseful for monitoring bone strength changes in pediatric populations.
Poster Number 131 Central DXA
Performing Densitometry on Persons with Disabilities and/or MobilityLimitations
Sparkle Williams, VA Palo Alto Medical Center, Palo Alto, CA; Jenny Kiratli, VA PaloAlto Medical Center, Palo Alto, CA
Patients with a disabling condition require special considerations when seen for bonedensitometry. The prescribing clinician and/or technologist should be able torecognize relevant physical and situational constraints that will invalidate scan resultsand identify how to modify standard protocols to accommodate individuallimitations. Disabling conditions requiring protocol modifications include paralysis/paresis (e.g., spinal cord injury, stroke, traumatic brain injury, degenerative disorders,etc), amputation, severe arthritis, and other circumstances resulting in wheelchair use,as well as illnesses (diabetes, cancer, liver/kidney failure) that lead to increased fragility.Accommodations may be necessary from pre-procedure screening, through scanacquisition, to post-procedure analysis. Persons with disabilities may requireassistance getting on/off the scan table by use of trained personnel or an overheadlift, and correct positioning may be compromised. Proper limb placement may beaffected by severe joint stiffness or contracture; spasticity, pain, or respiratory distresswhen lying supine may further invalidate measurements. In some cases, it may not bepossible to achieve ideal positioning. The technologist must appropriatelycompensate for these conditions and recognize scanning limitations that exist. Scananalysis will require consideration of factors such as prosthetics and other devices(e.g., catheters/leg bags and implants) and procedures such as a laminectomy orfusion that may further interfere with valid scanning. Prior to scheduling, it isadvisable to perform a thorough screening to identify disabling conditions andlimiting factors (e.g., degree of transfer dependence) and be informed aboutcomplications. Awareness of these conditions will allow the technologist to adjustappointment length and make necessary prearrangements. If possible, reporting ofresults should include consideration of population-specific reference information inaddition to standard reference comparisons because immobility can result inexcessive reduction in bone mass and standard reference values may beinappropriate. In summary, for patients with a disability, awareness and sensitivity areessential and creativity may be warranted during and after the scan in order toacquire and report bone densitometry results in a manner that ensures clinicalvalidity.
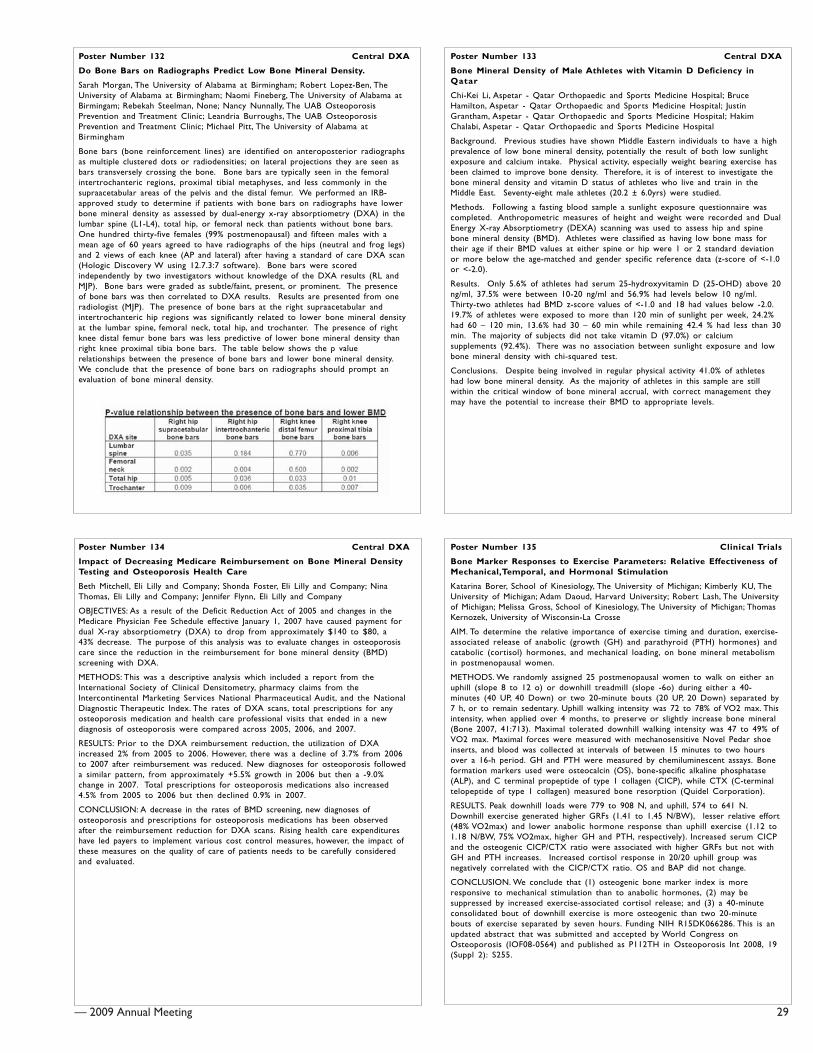
— 2009 Annual Meeting 29
Poster Number 132 Central DXA
Do Bone Bars on Radiographs Predict Low Bone Mineral Density.
Sarah Morgan, The University of Alabama at Birmingham; Robert Lopez-Ben, TheUniversity of Alabama at Birmingham; Naomi Fineberg, The University of Alabama atBirmingam; Rebekah Steelman, None; Nancy Nunnally, The UAB OsteoporosisPrevention and Treatment Clinic; Leandria Burroughs, The UAB OsteoporosisPrevention and Treatment Clinic; Michael Pitt, The University of Alabama atBirmingham
Bone bars (bone reinforcement lines) are identified on anteroposterior radiographsas multiple clustered dots or radiodensities; on lateral projections they are seen asbars transversely crossing the bone. Bone bars are typically seen in the femoralintertrochanteric regions, proximal tibial metaphyses, and less commonly in thesupraacetabular areas of the pelvis and the distal femur. We performed an IRB-approved study to determine if patients with bone bars on radiographs have lowerbone mineral density as assessed by dual-energy x-ray absorptiometry (DXA) in thelumbar spine (L1-L4), total hip, or femoral neck than patients without bone bars.One hundred thirty-five females (99% postmenopausal) and fifteen males with amean age of 60 years agreed to have radiographs of the hips (neutral and frog legs)and 2 views of each knee (AP and lateral) after having a standard of care DXA scan(Hologic Discovery W using 12.7.3:7 software). Bone bars were scoredindependently by two investigators without knowledge of the DXA results (RL andMJP). Bone bars were graded as subtle/faint, present, or prominent. The presenceof bone bars was then correlated to DXA results. Results are presented from oneradiologist (MJP). The presence of bone bars at the right supraacetabular andintertrochanteric hip regions was significantly related to lower bone mineral densityat the lumbar spine, femoral neck, total hip, and trochanter. The presence of rightknee distal femur bone bars was less predictive of lower bone mineral density thanright knee proximal tibia bone bars. The table below shows the p valuerelationships between the presence of bone bars and lower bone mineral density.We conclude that the presence of bone bars on radiographs should prompt anevaluation of bone mineral density.
Poster Number 133 Central DXA
Bone Mineral Density of Male Athletes with Vitamin D Deficiency inQatar
Chi-Kei Li, Aspetar - Qatar Orthopaedic and Sports Medicine Hospital; BruceHamilton, Aspetar - Qatar Orthopaedic and Sports Medicine Hospital; JustinGrantham, Aspetar - Qatar Orthopaedic and Sports Medicine Hospital; HakimChalabi, Aspetar - Qatar Orthopaedic and Sports Medicine Hospital
Background. Previous studies have shown Middle Eastern individuals to have a highprevalence of low bone mineral density, potentially the result of both low sunlightexposure and calcium intake. Physical activity, especially weight bearing exercise hasbeen claimed to improve bone density. Therefore, it is of interest to investigate thebone mineral density and vitamin D status of athletes who live and train in theMiddle East. Seventy-eight male athletes (20.2 ± 6.0yrs) were studied.
Methods. Following a fasting blood sample a sunlight exposure questionnaire wascompleted. Anthropometric measures of height and weight were recorded and DualEnergy X-ray Absorptiometry (DEXA) scanning was used to assess hip and spinebone mineral density (BMD). Athletes were classified as having low bone mass fortheir age if their BMD values at either spine or hip were 1 or 2 standard deviationor more below the age-matched and gender specific reference data (z-score of <-1.0or <-2.0).
Results. Only 5.6% of athletes had serum 25-hydroxyvitamin D (25-OHD) above 20ng/ml, 37.5% were between 10-20 ng/ml and 56.9% had levels below 10 ng/ml.Thirty-two athletes had BMD z-score values of <-1.0 and 18 had values below -2.0.19.7% of athletes were exposed to more than 120 min of sunlight per week, 24.2%had 60 – 120 min, 13.6% had 30 – 60 min while remaining 42.4 % had less than 30min. The majority of subjects did not take vitamin D (97.0%) or calciumsupplements (92.4%). There was no association between sunlight exposure and lowbone mineral density with chi-squared test.
Conclusions. Despite being involved in regular physical activity 41.0% of athleteshad low bone mineral density. As the majority of athletes in this sample are stillwithin the critical window of bone mineral accrual, with correct management theymay have the potential to increase their BMD to appropriate levels.
Poster Number 134 Central DXA
Impact of Decreasing Medicare Reimbursement on Bone Mineral DensityTesting and Osteoporosis Health Care
Beth Mitchell, Eli Lilly and Company; Shonda Foster, Eli Lilly and Company; NinaThomas, Eli Lilly and Company; Jennifer Flynn, Eli Lilly and Company
OBJECTIVES: As a result of the Deficit Reduction Act of 2005 and changes in theMedicare Physician Fee Schedule effective January 1, 2007 have caused payment fordual X-ray absorptiometry (DXA) to drop from approximately $140 to $80, a43% decrease. The purpose of this analysis was to evaluate changes in osteoporosiscare since the reduction in the reimbursement for bone mineral density (BMD)screening with DXA.
METHODS: This was a descriptive analysis which included a report from theInternational Society of Clinical Densitometry, pharmacy claims from theIntercontinental Marketing Services National Pharmaceutical Audit, and the NationalDiagnostic Therapeutic Index. The rates of DXA scans, total prescriptions for anyosteoporosis medication and health care professional visits that ended in a newdiagnosis of osteoporosis were compared across 2005, 2006, and 2007.
RESULTS: Prior to the DXA reimbursement reduction, the utilization of DXAincreased 2% from 2005 to 2006. However, there was a decline of 3.7% from 2006to 2007 after reimbursement was reduced. New diagnoses for osteoporosis followeda similar pattern, from approximately +5.5% growth in 2006 but then a -9.0%change in 2007. Total prescriptions for osteoporosis medications also increased4.5% from 2005 to 2006 but then declined 0.9% in 2007.
CONCLUSION: A decrease in the rates of BMD screening, new diagnoses ofosteoporosis and prescriptions for osteoporosis medications has been observedafter the reimbursement reduction for DXA scans. Rising health care expenditureshave led payers to implement various cost control measures, however, the impact ofthese measures on the quality of care of patients needs to be carefully consideredand evaluated.
Poster Number 135 Clinical Trials
Bone Marker Responses to Exercise Parameters: Relative Effectiveness ofMechanical,Temporal, and Hormonal Stimulation
Katarina Borer, School of Kinesiology, The University of Michigan; Kimberly KU, TheUniversity of Michigan; Adam Daoud, Harvard University; Robert Lash, The Universityof Michigan; Melissa Gross, School of Kinesiology, The University of Michigan; ThomasKernozek, University of Wisconsin-La Crosse
AIM. To determine the relative importance of exercise timing and duration, exercise-associated release of anabolic (growth (GH) and parathyroid (PTH) hormones) andcatabolic (cortisol) hormones, and mechanical loading, on bone mineral metabolismin postmenopausal women.
METHODS. We randomly assigned 25 postmenopausal women to walk on either anuphill (slope 8 to 12 o) or downhill treadmill (slope -6o) during either a 40-minutes (40 UP, 40 Down) or two 20-minute bouts (20 UP, 20 Down) separated by7 h, or to remain sedentary. Uphill walking intensity was 72 to 78% of VO2 max. Thisintensity, when applied over 4 months, to preserve or slightly increase bone mineral(Bone 2007, 41:713). Maximal tolerated downhill walking intensity was 47 to 49% ofVO2 max. Maximal forces were measured with mechanosensitive Novel Pedar shoeinserts, and blood was collected at intervals of between 15 minutes to two hoursover a 16-h period. GH and PTH were measured by chemiluminescent assays. Boneformation markers used were osteocalcin (OS), bone-specific alkaline phosphatase(ALP), and C terminal propeptide of type 1 collagen (CICP), while CTX (C-terminaltelopeptide of type 1 collagen) measured bone resorption (Quidel Corporation).
RESULTS. Peak downhill loads were 779 to 908 N, and uphill, 574 to 641 N.Downhill exercise generated higher GRFs (1.41 to 1.45 N/BW), lesser relative effort(48% VO2max) and lower anabolic hormone response than uphill exercise (1.12 to1.18 N/BW, 75% VO2max, higher GH and PTH, respectively). Increased serum CICPand the osteogenic CICP/CTX ratio were associated with higher GRFs but not withGH and PTH increases. Increased cortisol response in 20/20 uphill group wasnegatively correlated with the CICP/CTX ratio. OS and BAP did not change.
CONCLUSION. We conclude that (1) osteogenic bone marker index is moreresponsive to mechanical stimulation than to anabolic hormones, (2) may besuppressed by increased exercise-associated cortisol release; and (3) a 40-minuteconsolidated bout of downhill exercise is more osteogenic than two 20-minutebouts of exercise separated by seven hours. Funding NIH R15DK066286. This is anupdated abstract that was submitted and accepted by World Congress onOsteoporosis (IOF08-0564) and published as P112TH in Osteoporosis Int 2008, 19(Suppl 2): S255.

30 — 2009 Annual Meeting
Poster Number 136 Clinical Trials
Osteoporosis in Sarcoidosis Patients IOF WCO No P615SA-Bangkok
Violeta Vucinic, Medical School Belgrade, Clinical Center, Serbia; Desanka Mitrovic,Head of the Rehabilitation Depertment; Snezana Filipovic, Physician in Training,Clinical Center, Belgrade; Jelica Videnovic, Clinical Center, Belgrade, Serbia; VladimirZugic, Assistent Lecturer, Medical School, Belgrade, Serbia
Introduction: Osteoporosis is the most prevalent metabolic bone disease in olderpeople. It causes much morbidity, mortality and cost in terms of health and socialservices payments.Fractures (hip, wrist and vertebrae) are the importantconsequences and can adversely affect quality of life by causing pain, reducingphysical functioning and affecting the activities of daily living. Low mood, depressionand social isolation can often result. As in other important chronic conditionsassessing health-related quality of life is becoming increasingly important both inhealth services research and in clinical trials. As a multisystem granulomatous diseasesarcoidosis impacts the health related quality of life in many different ways as well asosteoporosis.
MethodsThe focus of the study was to establish the connection between the boneloss (due to the diseases and the steroid therapy) and the patients‘ health status. Thequality of life in 120 biopsy positive sarcoidosis patients we measured using the twodisease specific questionnaires: ECOS 16 designed for women with osteoporosis andSarcoidosis Health Questionnaire (: SHQ) the only disease specific questionnaire forsarcoidosis.In the Institute of Pulmonary Diseases, Clinical Center, Beograd, Serbia,120 patients 91 (76%) female were analyzed. Age of female patients 47, 81 yrs, SD11, 15.Bone mineral density BMD was measured in the Institute for OrthopedicSurgery. Beograd, Serbia. Regarding the value of the T score all patients were dividedinto 3 groups: Group A: T-score from 0 to –1 normal; B group: T-score from -1 to -2.5 ostepenia, and C group: T-score -2.5 and beyond osteoporosis.
Results: 24 pts has normal T-score. (20%) 86 pts (72%) of our patients have T-scorefrom -1 to –2.5 and 10 pts (8%) has T-score lower than –2.5. The mean ECOS-16score was 2.24 in the group B and 2.51 in the group C. The correlations betweenthe SHQ scores and the ECOS-16 scores are statistically significant in the groups Band C in all the domains. (Pearson correlation).
Conclusion: Problems caused by the bone loss have severe negative impacts on thequality of life in sarcoidosis patients. The main goal is to accomplish the propertherapy in the domain of slowing or stopping bone loss as well as treatingsarcoidosis. Bone loss is great problem in sarcoidosis (concerning the disease and thetherapy).
Poster Number 137 Clinical Trials
Antifracture Efficacy of Combined Treatment with Alendronate andAlfacalcidol for Osteoporotic Vertebrae in Early-Phase Treatment: APreliminary Report
Naohisa Miyakoshi, Orthopedic Surgery, Akita University; Yuji Kasukawa, OrthopedicSurgery, Akita University; Hideaki Noguchi, Orthopedic Surgery, Akita University;Hiroshi Sasaki, Orthopedic Surgery, Akita University; Keiji Kamo, OrthopedicSurgery, Akita University; Yoichi Shimada, Orthopedic Surgery, Akita University
Background. Alendronate decreases the incidence of vertebral fractures byincreasing bone mineral density (BMD). However, because the effects on bone areexerted in an indirect manner by reducing the remodeling space and prolongingthe duration of mineralization, several months are required to increase bonestrength. Previous reports have shown significant antifracture effects can beexpected after 6 months of treatment. Alfacalcidol also displays preventive effectsagainst osteoporotic fractures, despite a small effect on bone mass. We thusconducted a 6-month, prospective, randomized trial of postmenopausal womenwith osteoporosis to evaluate the possibility of early-phase superiority usingcombined treatment with alendronate and alfacalcidol compared to either alone,with radiographically diagnosed vertebral fracture as the primary endpoint.
Methods. Subjects comprised 363 postmenopausal women >60-years-old (mean age,74 years) and with osteoporosis. Subjects were randomly divided into 3 groups:ALN group (n=119), treated with daily oral administration of 5 mg of alendronate;D group (n=122), treated with daily oral administration of 1 μg of alfacalcidol; andALN+D group (n=122), treated with daily oral administration of 5 mg ofalendronate plus 1 μg of alfacalcidol. Demographic data including age, baseline BMDof distal radius, and number of vertebral fractures did not differ significantlybetween groups. The number of vertebral fractures at baseline and follow-up wereevaluated using spinal radiography.
Results. During the 6-month treatment period, new vertebral fractures comprised11 fractures in 9 ALN group patients (7.6%), 9 fractures in 9 D group patients(7.4%), and 3 fractures in 3 ALN+D group patients (2.5%).
Conclusions. In conclusion, combination therapy with alendronate and alfacalcidolexhibited superiority in terms of preventing vertebral fracture over eithertreatment alone in early-phase treatment. However, as several other risk factorssuch as spinal hyperkyphosis, lower BMD, and higher bone resorption markers alsoaffect incidence of vertebral fractures, further studies including these factors will beneeded to reconfirm the present findings and clarify the antifracture efficacy ofcombination therapy using alendronate and alfacalcidol in early-phase treatment.The contents of the abstract had been submitted and accepted for WCO(P169TH).Osteoporosis Int (2008) 19(Suppl.2).
Poster Number 138 Clinical Trials
Comparison of BMD Responders as Determined by Least SignificantChange in Women Transitioned to Denosumab or Receiving ContinuedAlendronate
D Kendler, Clinical Research Centre; G Weryha, Centre Hospitalier Universitaire deNancy Brabois; M Bolognese, Bethesda Health Research Center; P Orcel, GroupeHospitalier Larboisiere, Universite Paris 7; R Dore, Robin K. Dore, MD, Inc.; G Isaia,Ospedale San Giovanni Battista and University of Torino; S Siddhanti, Amgen Inc.; HMan, Amgen Inc.; B Cortet, CHU de Lille Hôpital Roger Salengro
Background: The investigational, fully-human monoclonal antibody, denosumab, is aRANKL inhibitor that has been shown to reduce osteoclast-mediated boneresorption, increase BMD, and reduce fracture risk in postmenopausal women withosteoporosis.
Methods: In this head-to-head comparison, postmenopausal women with BMD T-scores <=-2.0 and >=-4.0 receiving alendronate 70 mg weekly or equivalent for >=6months were randomly assigned to continued oral alendronate 70 mg once weeklyor denosumab 60 mg subcutaneously every 6 months, following a 1-month run-inperiod when all women received open-label alendronate. BMD at the total hip andlumbar spine was measured in duplicate by DXA at baseline, month 6 and month12. The mean of the duplicate measurements was used for analyses. Least significantchange (LSC) in the BMD measurements for the spine and hip was calculated usingthe duplicate scans from baseline based on a DXA precision calculation of the rootmean square CV (RMS-CV%). The 95% confidence interval LSC was calculated bymultiplying the RMS-CV% by 2.77.
Results: Women transitioned to denosumab had significantly greater 12 month BMDgains at the lumbar spine and total hip (both sites, P<0.0001) than womencontinuing on alendronate. The calculated LSC was 3.29% at the lumbar spine and3.24% at the total hip. Most women in both groups maintained or increased BMD atthe lumbar spine and total hip. More women in the denosumab group than thealendronate group achieved 12-month BMD gains that exceeded the LSC at thelumbar spine (41% DMAb vs 26% ALN) and total hip (23% DMAb vs 14% ALN),P<0.0001 for both.
Conclusions: In this study, transitioning postmenopausal women to denosumab fromlong-term alendronate therapy led to greater increases in BMD than remaining onalendronate therapy. More women in the denosumab group had BMD gains thatexceeded the LSC, which is an appropriate measure for evaluating the BMD increasebeyond the precision error of the DXA instrument and is used to indicate change inan individual patient in clinical practice. These results may reflect differentmechanisms of action inhibiting bone resorption between denosumab andalendronate.
Poster Number 139 Clinical Trials
ACE-011, a Soluble Activin Receptor Type IIA IgG-Fc Fusion Protein,Increases BMD in Postmenopausal Healthy Women
Niels Borgstein, Acceleron Pharma
Inhibition of signaling through the activin receptor type IIA (ActRIIA) increasesbone formation, improves bone architecture and increases BMD in non-clinicalstudies. ACE-011, a soluble receptor fusion protein comprised of the ActRIIAreceptor linked to the Fc region of human IgG1, inhibits signaling through theActRIIA receptor. ACE-011 is currently in clinical development for the treatment ofbone loss in a variety of disease indications. In a recently conducted randomized,double-blind, placebo-controlled, multiple dose-escalation study to evaluate thesafety, tolerability and pharmacodynamic bone markers following dosing of ACE-011, 31 postmenopausal women received up to 4 monthly doses of ACE-011 orplacebo by subcutaneous administration and were followed for 3 months aftertheir last dose. Three dose levels of 8 subjects each received 4, 3, and 2 doses ofACE-011 at 0.1, 0.3, and 1 mg/kg monthly, respectively. Bone biomarkers wereassessed throughout the study and DXA scans were performed at baseline,following last dose, and at end of study after 3 months follow-up. There was a dose-and time-dependent increase in total hip BMD following treatment with ACE-011.An increase of 0.6%, 0.9% and 2.4% (P=0.006) was observed at the end of studycompared to baseline following treated with 0.1, 0.3 and 1 mg/kg respectively,versus a decrease of 0.7% (P<0.01) in placebo subjects. We also observed asustained dose-dependent increase in serum levels of BSAP following multiple dosesof ACE-011. A maximum mean percent increase in BSAP from baseline of 12.5%,24.5% and 33% was seen in subjects treated with multiple doses of ACE-011 at the0.1, 0.3, and 1.0 mg/kg dose level, respectively. Furthermore, a sustained decreasein sCTX was seen. In contrast to other anabolic agents such as PTH, these datademonstrate a desirable increase in biochemical markers of bone formationwithout an increase in bone resorption. These data indicate that ACE-011 is anovel bone anabolic agent that generates significant and rapid increases in BMDwithin 4 months by increasing bone formation and decreasing bone resorption,and is a promising therapeutic compound for the treatment of bone loss.Disclaimer: updated abstract, P759SA

— 2009 Annual Meeting 31
Poster Number 140 Epidemiology
Prevalence and Risk Factors for Osteoporosis in Individuals with Paralysis
Cristina Sadowsky, The Hugo W. Moser Research Institute at Kennedy Krieger,Baltimore, MD; Heather Whiting, The Hugo W. Moser Research Institute at KennedyKrieger, Baltimore, MD; Sarah Pai, The Hugo W. Moser Research Institute at KennedyKrieger, Baltimore, MD; Albert Recio, The Hugo W. Moser Research Institute atKennedy Krieger, Baltimore, MD; Daniel Becker, The Hugo W. Moser ResearchInstitute at Kennedy Krieger, Baltimore, MD; Thierry Houdayer, The Hugo W. MoserResearch Institute at Kennedy Krieger, Baltimore, MD; Samir Al-Adawi, College ofMedicine, Sultan Qaboos University, Muscat, Omen
The objectives of this study were to define the prevalence of osteoporosis inindividuals with paralysis, and to examine the relationship among neurogenic/disuseosteoporosis and commonly associated risk factors. Participants were 154individuals with paralysis evaluated in the International Center for Spinal CordInjury at Kennedy Krieger Institute in Baltimore between June 2005 and March2008 who underwent dual-energy x-ray absorptiometry (DXA) exams. Datacollected included bone mineral densities (BMD) for lumbar spine and bilateral hips,as well as functional and demographic information. 33% (51/154) of individuals withparalysis were found to have osteoporosis, defined as one or more regions in whicha T-score was equal to or less than -2.5. There was no significant difference in theprevalence of osteoporosis with regards to the following factors: gender (male 33.3%, female 32.7 %) (p = 0.94), level of injury (tetraplegia 34.8 %, paraplegia 30.8 %)(p =0.60), severity of spinal cord injury classified by ASIA grade (motor complete36.7 %, incomplete 29.3 %) (p = 0.33), ambulatory status (ambulatory 20.5 %; non-ambulatory 37.4 %) (p = 0.053). Osteoporosis was more prevalent in individualswhose injury was over 1 year old (under 1 year injury, 13.3 %, 1-5 years 41.4 %,over 5 years 33.3 %) (p=0.024). These findings underline the importance of a)identifying methods to prevent bone loss immediately after the onset of neurologicinjury and b) routinely monitoring bone health in individuals with paralysis.Standardized guidelines are still needed for when and how frequently bone massassessment should be performed, and future research needs to focus on effectivetreatment interventions in this highly at risk population.
Poster Number 141 Epidemiology
Edentulism as a Predictor of Osteoporosis Among PostmenopausalBahraini Women
Shehab Alsawy, Arabian Gulf University
Aim of the study:to appraise a simple and cost-effective tool that may be used aspart of a health policy approach to the detection and mitigation of osteoporosis inpost-menopausal Bahraini women.
Objectives:to assess the reliability of edentulism as a predictor of osteoporosis amongpostmenopausal Bahraini women.methods: a cross sectional study was conducted infive randomly selected primary health care centers in Bahrain, to test the associationbetween the co-existing conditions (edentulism and osteoporosis), between March17- May 15, 2007. Within these centres, a convenience sample of 170postmenopausal Bahraini women were recruited, interviewed and examined througha questionnaire, tooth count, and ultrasound bone density screening procedure.edentulism was categorized with regard to magnitude of tooth loss; 1-5 missed teeth(group 1), 6-15 (group 2), 16-25(group 3), >25(group 4).
Results:only 21.7% of the women, who participated in the study, were shown to havenormal bone density, using the ultrasound bone density screening tool, 51.2% hadosteopenia and 27.1% had osteoporosis. in oral screening, 2.9% of participants hadfull dentition, whereas 97.1% had missing teeth. after adjusting for the effect of age,the odds of having osteoporosis for group 2, was 3.0 times greater than the odds ofgroup 1. the odds ratios associated with group 3 and group 4 were 15.32 and66.55, respectively. no significant association between edentulism and parity orgravidity was found. a mathematical model was developed that linked edentulismand probability of osteoporosis, across post-menopausal women.
Conclusions:edentulism was found to be significantly associated with osteoporosis,and can be used to identify those women in whom further specific investigations forosteoporosis, is indicated. Therefore, and given the need to repeat this study usingthe gold standard for assessing bone mineral density, edentulism can potentially serveas a simple and cost effective tool to predict latent osteoporosis.
Poster Number 142 Epidemiology
Effectiveness of Bisphosphonates for the Reduction of Clinical Fractures –An Observational Study
Abby Abelson, Cleveland Clinic; Thierry Thomas, Professor of Medicine, HospitalBellevue - CHU De St-Etienne; Deborah Gold, Duke University Medical Center; JeffLange, Procter & Gamble Pharmaceuticals; Johann Ringe, Medizinische Klinik IV(Osteology, Rheumatology)
In the United States, alendronate, risedronate, and ibandronate have been availablefor the treatment of osteoporosis for several years. We investigated the consistencyof fracture reduction in clinical practice with each bisphosphonate against thatobserved in the randomized controlled trials.In this study, women aged =65 yearsstarting treatment with any of the three bisphosphonates were followed within twodatabases of healthcare utilization records inclusive of years 2000–2006. Fracturerisk at the time of initiating a bisphosphonate was described by utilizing, up to a 5-year history period to obtain measures of co-morbidities, medication history and aFRAX® probability of fracture. To estimate the effectiveness of each bisphosphonate,a pre-post study design was used to assess if the clinical fracture incidence decreasedwith adherence to an individual bisphosphonate. ‘Pre’ was defined by the fractureincidence during a wash-in phase of 3 months after starting therapy and ‘post’ wasdefined by the fracture incidence in the subsequent 1-year follow-up on therapy.Patients initiating therapy with ibandronate were younger, had less fracture history,greater prior bisphosphonate use, and a lower FRAX® probability of fracture thanthose initiating either risedronate or alendronate. Relative to the wash-in phase, theincidence of clinical fractures was lower in the subsequent year of therapy at allfracture sites with both alendronate and risedronate. No difference in fractureincidence was observed at non-vertebral or hip sites with ibandronate (table).Overall, these data show that the effectiveness of bisphosphonates in real-worldpractice is consistent with results from phase III clinical trials.
Poster Number 143 Epidemiology
Usefulness of Armspan in Screening for Undiagnosed Vertebral Fractures:JPOS Study
Junko TAMAKI, Kinki Uni. Sch of Med.; Masayuki IKI, Kinki Uni. Sch. of Med.; EikoKadowaki, Kinki Uni. Sch. of Med.; Yuho Sato, Jin-Ai Women’s College; SadanobuKagamimori, University Of Toyama; Yoshiko Kagawa, Kagawa Nutrition University;Hideo Yoneshima, Shuuwa General Hospital
Our objective was to investigate whether or not anthropometric indicators of armspan or sitting height could attribute the improvement in fit of models for screeningasymptomatic vertebral fractures. We conducted a baseline survey with arepresentative sample of Japanese women as JPOS study in 1996. Lateral imaging ofthe spine by dual energy X-ray absorptiometry and vertebral morphometry wereconducted in women aged 50 or more. Vertebral deformities were diagnosed by theMcCloskey-Kanis criteria and were used as a proxy for vertebral fractures. Womenof 608 without a history of diseases or taking medication which could have affectedbone metabolism were used for analysis. Receiver operating characteristics curveanalysis was performed, and cut-off values were determined to give maximumdifference between sensitivity and false-positive rate. The multiple logistic regressionfor vertebral deformities was conducted using age, height, weight, BMD at lumbarspine (LS) or total hip (TH), and arm span or sitting height as explanatory variables.To evaluate the goodness-of-fit of the regression equations to the data, Akaike’sinformation criterion (AIC) was calculated with the following equation, AIC= -2(logM– k) for which M was the maximum likelihood of a model and k was the number ofadjusted parameters in the model. When a difference in AIC between two models ismore than 1, the model with the smaller AIC was considered to afford a significantlybetter fit to the data. Expected probabilities for vertebral deformities werecalculated using the logistic regression equation. Seventy-nine women (13.0%) werediagnosed with vertebral deformities. The mean values of body height, arm span, andsitting height for those participants with and without vertebral deformities were144.8±5.6 cm and 148.8±5.0 cm (p<0.001); 146.5±6.6 cm and 148.6±5.6 cm (p =0.002); 77.7±7.0 cm and 80.1±4.4 (p = 0.005), respectively. Sitting height indicatedno statistically significance in the multiple logistic regression models for vertebraldeformities. The AIC values of the models including age, height, weight, BMD at LS orTH, and arm span as variables were smallerby 6.1 or 2.0, respectively, than thosewithout arm span (Table). It was shownthat the goodness of fit of models forasymptomatic vertebral fractures includingage, height, weight, and BMD was improvedwhen arm span was taken into account. Amodel for screening asymptomaticvertebral fractures should include armspan.
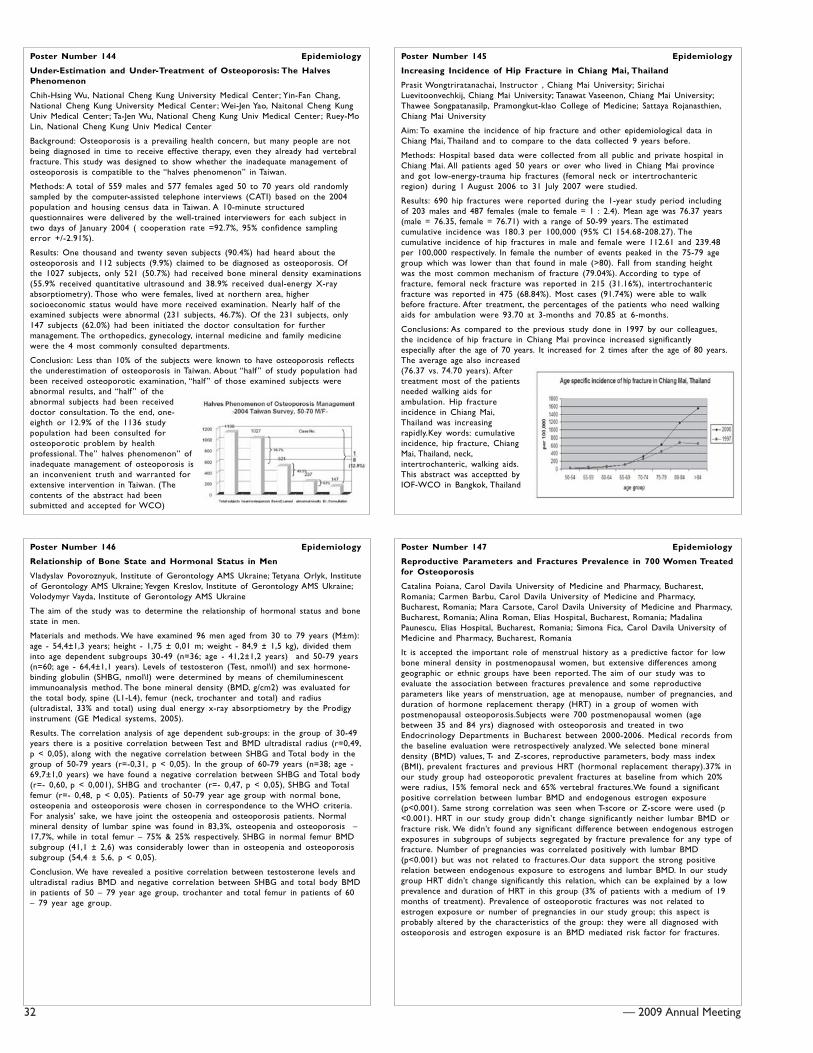
32 — 2009 Annual Meeting
Poster Number 144 Epidemiology
Under-Estimation and Under-Treatment of Osteoporosis: The HalvesPhenomenon
Chih-Hsing Wu, National Cheng Kung University Medical Center; Yin-Fan Chang,National Cheng Kung University Medical Center; Wei-Jen Yao, Naitonal Cheng KungUniv Medical Center; Ta-Jen Wu, National Cheng Kung Univ Medical Center; Ruey-MoLin, National Cheng Kung Univ Medical Center
Background: Osteoporosis is a prevailing health concern, but many people are notbeing diagnosed in time to receive effective therapy, even they already had vertebralfracture. This study was designed to show whether the inadequate management ofosteoporosis is compatible to the “halves phenomenon” in Taiwan.
Methods: A total of 559 males and 577 females aged 50 to 70 years old randomlysampled by the computer-assisted telephone interviews (CATI) based on the 2004population and housing census data in Taiwan. A 10-minute structuredquestionnaires were delivered by the well-trained interviewers for each subject intwo days of January 2004 ( cooperation rate =92.7%, 95% confidence samplingerror +/-2.91%).
Results: One thousand and twenty seven subjects (90.4%) had heard about theosteoporosis and 112 subjects (9.9%) claimed to be diagnosed as osteoporosis. Ofthe 1027 subjects, only 521 (50.7%) had received bone mineral density examinations(55.9% received quantitative ultrasound and 38.9% received dual-energy X-rayabsorptiometry). Those who were females, lived at northern area, highersocioeconomic status would have more received examination. Nearly half of theexamined subjects were abnormal (231 subjects, 46.7%). Of the 231 subjects, only147 subjects (62.0%) had been initiated the doctor consultation for furthermanagement. The orthopedics, gynecology, internal medicine and family medicinewere the 4 most commonly consulted departments.
Conclusion: Less than 10% of the subjects were known to have osteoporosis reflectsthe underestimation of osteoporosis in Taiwan. About “half ” of study population hadbeen received osteoporotic examination, “half ” of those examined subjects wereabnormal results, and “half ” of theabnormal subjects had been receiveddoctor consultation. To the end, one-eighth or 12.9% of the 1136 studypopulation had been consulted forosteoporotic problem by healthprofessional. The” halves phenomenon” ofinadequate management of osteoporosis isan inconvenient truth and warranted forextensive intervention in Taiwan. (Thecontents of the abstract had beensubmitted and accepted for WCO)
Poster Number 145 Epidemiology
Increasing Incidence of Hip Fracture in Chiang Mai, Thailand
Prasit Wongtriratanachai, Instructor , Chiang Mai University; SirichaiLuevitoonvechkij, Chiang Mai University; Tanawat Vaseenon, Chiang Mai University;Thawee Songpatanasilp, Pramongkut-klao College of Medicine; Sattaya Rojanasthien,Chiang Mai University
Aim: To examine the incidence of hip fracture and other epidemiological data inChiang Mai, Thailand and to compare to the data collected 9 years before.
Methods: Hospital based data were collected from all public and private hospital inChiang Mai. All patients aged 50 years or over who lived in Chiang Mai provinceand got low-energy-trauma hip fractures (femoral neck or intertrochantericregion) during 1 August 2006 to 31 July 2007 were studied.
Results: 690 hip fractures were reported during the 1-year study period includingof 203 males and 487 females (male to female = 1 : 2.4). Mean age was 76.37 years(male = 76.35, female = 76.71) with a range of 50-99 years. The estimatedcumulative incidence was 180.3 per 100,000 (95% CI 154.68-208.27). Thecumulative incidence of hip fractures in male and female were 112.61 and 239.48per 100,000 respectively. In female the number of events peaked in the 75-79 agegroup which was lower than that found in male (>80). Fall from standing heightwas the most common mechanism of fracture (79.04%). According to type offracture, femoral neck fracture was reported in 215 (31.16%), intertrochantericfracture was reported in 475 (68.84%). Most cases (91.74%) were able to walkbefore fracture. After treatment, the percentages of the patients who need walkingaids for ambulation were 93.70 at 3-months and 70.85 at 6-months.
Conclusions: As compared to the previous study done in 1997 by our colleagues,the incidence of hip fracture in Chiang Mai province increased significantlyespecially after the age of 70 years. It increased for 2 times after the age of 80 years.The average age also increased(76.37 vs. 74.70 years). Aftertreatment most of the patientsneeded walking aids forambulation. Hip fractureincidence in Chiang Mai,Thailand was increasingrapidly.Key words: cumulativeincidence, hip fracture, ChiangMai, Thailand, neck,intertrochanteric, walking aids.This abstract was acceptted byIOF-WCO in Bangkok, Thailand
Poster Number 146 Epidemiology
Relationship of Bone State and Hormonal Status in Men
Vladyslav Povoroznyuk, Institute of Gerontology AMS Ukraine; Tetyana Orlyk, Instituteof Gerontology AMS Ukraine; Yevgen Kreslov, Institute of Gerontology AMS Ukraine;Volodymyr Vayda, Institute of Gerontology AMS Ukraine
The aim of the study was to determine the relationship of hormonal status and bonestate in men.
Materials and methods. We have examined 96 men aged from 30 to 79 years (M±m):age - 54,4±1,3 years; height - 1,75 ± 0,01 m; weight - 84,9 ± 1,5 kg), divided theminto age dependent subgroups 30-49 (n=36; age - 41,2±1,2 years) and 50-79 years(n=60; age - 64,4±1,1 years). Levels of testosteron (Test, nmol\l) and sex hormone-binding globulin (SHBG, nmol\l) were determined by means of chemiluminescentimmunoanalysis method. The bone mineral density (BMD, g/cm2) was evaluated forthe total body, spine (L1-L4), femur (neck, trochanter and total) and radius(ultradistal, 33% and total) using dual energy x-ray absorptiometry by the Prodigyinstrument (GE Medical systems, 2005).
Results. The correlation analysis of age dependent sub-groups: in the group of 30-49years there is a positive correlation between Test and BMD ultradistal radius (r=0,49,p < 0,05), along with the negative correlation between SHBG and Total body in thegroup of 50-79 years (r=-0,31, p < 0,05). In the group of 60-79 years (n=38; age -69,7±1,0 years) we have found a negative correlation between SHBG and Total body(r=- 0,60, p < 0,001), SHBG and trochanter (r=- 0,47, p < 0,05), SHBG and Totalfemur (r=- 0,48, p < 0,05). Patients of 50-79 year age group with normal bone,osteopenia and osteoporosis were chosen in correspondence to the WHO criteria.For analysis’ sake, we have joint the osteopenia and osteoporosis patients. Normalmineral density of lumbar spine was found in 83,3%, osteopenia and osteoporosis –17,7%, while in total femur – 75% & 25% respectively. SHBG in normal femur BMDsubgroup (41,1 ± 2,6) was considerably lower than in osteopenia and osteoporosissubgroup (54,4 ± 5,6, p < 0,05).
Conclusion. We have revealed a positive correlation between testosterone levels andultradistal radius BMD and negative correlation between SHBG and total body BMDin patients of 50 – 79 year age group, trochanter and total femur in patients of 60– 79 year age group.
Poster Number 147 Epidemiology
Reproductive Parameters and Fractures Prevalence in 700 Women Treatedfor Osteoporosis
Catalina Poiana, Carol Davila University of Medicine and Pharmacy, Bucharest,Romania; Carmen Barbu, Carol Davila University of Medicine and Pharmacy,Bucharest, Romania; Mara Carsote, Carol Davila University of Medicine and Pharmacy,Bucharest, Romania; Alina Roman, Elias Hospital, Bucharest, Romania; MadalinaPaunescu, Elias Hospital, Bucharest, Romania; Simona Fica, Carol Davila University ofMedicine and Pharmacy, Bucharest, Romania
It is accepted the important role of menstrual history as a predictive factor for lowbone mineral density in postmenopausal women, but extensive differences amonggeographic or ethnic groups have been reported. The aim of our study was toevaluate the association between fractures prevalence and some reproductiveparameters like years of menstruation, age at menopause, number of pregnancies, andduration of hormone replacement therapy (HRT) in a group of women withpostmenopausal osteoporosis.Subjects were 700 postmenopausal women (agebetween 35 and 84 yrs) diagnosed with osteoporosis and treated in twoEndocrinology Departments in Bucharest between 2000-2006. Medical records fromthe baseline evaluation were retrospectively analyzed. We selected bone mineraldensity (BMD) values, T- and Z-scores, reproductive parameters, body mass index(BMI), prevalent fractures and previous HRT (hormonal replacement therapy).37% inour study group had osteoporotic prevalent fractures at baseline from which 20%were radius, 15% femoral neck and 65% vertebral fractures.We found a significantpositive correlation between lumbar BMD and endogenous estrogen exposure(p<0.001). Same strong correlation was seen when T-score or Z-score were used (p<0.001). HRT in our study group didn’t change significantly neither lumbar BMD orfracture risk. We didn’t found any significant difference between endogenous estrogenexposures in subgroups of subjects segregated by fracture prevalence for any type offracture. Number of pregnancies was correlated positively with lumbar BMD(p<0.001) but was not related to fractures.Our data support the strong positiverelation between endogenous exposure to estrogens and lumbar BMD. In our studygroup HRT didn’t change significantly this relation, which can be explained by a lowprevalence and duration of HRT in this group (3% of patients with a medium of 19months of treatment). Prevalence of osteoporotic fractures was not related toestrogen exposure or number of pregnancies in our study group; this aspect isprobably altered by the characteristics of the group: they were all diagnosed withosteoporosis and estrogen exposure is an BMD mediated risk factor for fractures.
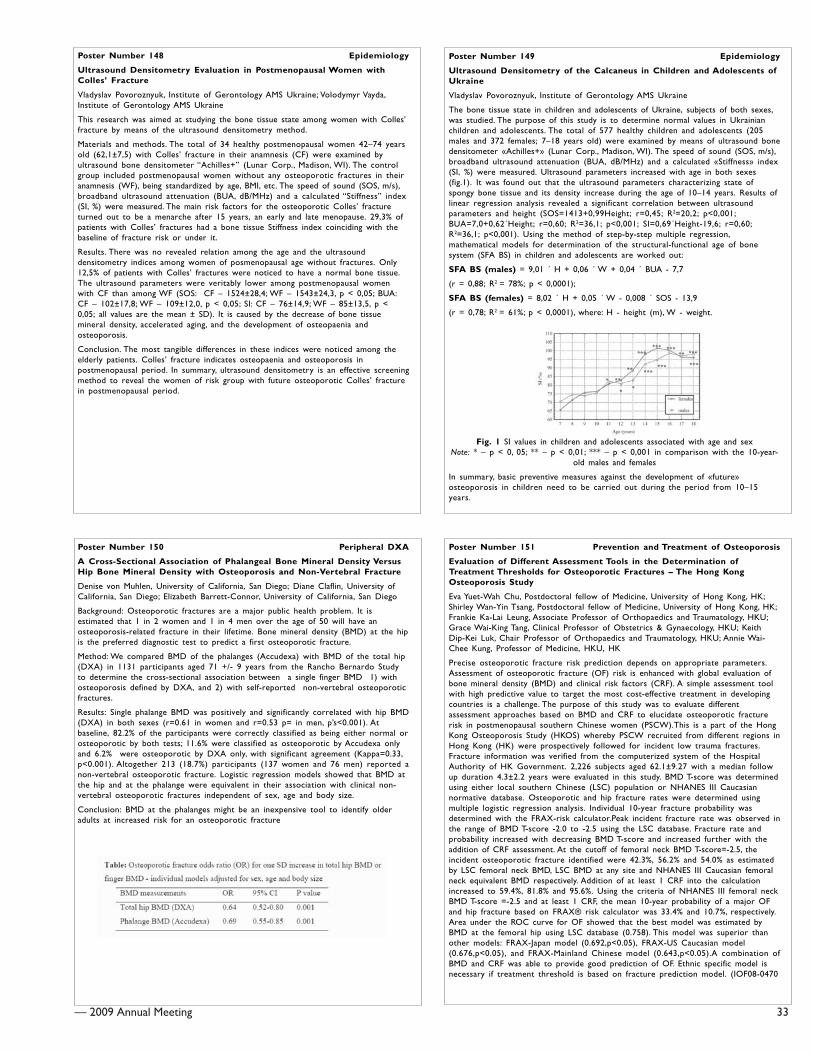
— 2009 Annual Meeting 33
Poster Number 148 Epidemiology
Ultrasound Densitometry Evaluation in Postmenopausal Women withColles’ Fracture
Vladyslav Povoroznyuk, Institute of Gerontology AMS Ukraine; Volodymyr Vayda,Institute of Gerontology AMS Ukraine
This research was aimed at studying the bone tissue state among women with Colles’fracture by means of the ultrasound densitometry method.
Materials and methods. The total of 34 healthy postmenopausal women 42–74 yearsold (62,1±7,5) with Colles’ fracture in their anamnesis (CF) were examined byultrasound bone densitometer “Achilles+” (Lunar Corp., Madison, WI). The controlgroup included postmenopausal women without any osteoporotic fractures in theiranamnesis (WF), being standardized by age, BMI, etc. The speed of sound (SOS, m/s),broadband ultrasound attenuation (BUA, dB/MHz) and a calculated “Stiffness” index(SI, %) were measured. The main risk factors for the osteoporotic Colles’ fractureturned out to be a menarche after 15 years, an early and late menopause. 29,3% ofpatients with Colles’ fractures had a bone tissue Stiffness index coinciding with thebaseline of fracture risk or under it.
Results. There was no revealed relation among the age and the ultrasounddensitometry indices among women of posmenopausal age without fractures. Only12,5% of patients with Colles’ fractures were noticed to have a normal bone tissue.The ultrasound parameters were veritably lower among postmenopausal womenwith CF than among WF (SOS: CF – 1524±28,4; WF – 1543±24,3, p < 0,05; BUA:CF – 102±17,8; WF – 109±12,0, p < 0,05; SI: CF – 76±14,9; WF – 85±13,5, p <0,05; all values are the mean ± SD). It is caused by the decrease of bone tissuemineral density, accelerated aging, and the development of osteopaenia andosteoporosis.
Conclusion. The most tangible differences in these indices were noticed among theelderly patients. Colles’ fracture indicates osteopaenia and osteoporosis inpostmenopausal period. In summary, ultrasound densitometry is an effective screeningmethod to reveal the women of risk group with future osteoporotic Colles’ fracturein postmenopausal period.
Poster Number 149 Epidemiology
Ultrasound Densitometry of the Calcaneus in Children and Adolescents ofUkraine
Vladyslav Povoroznyuk, Institute of Gerontology AMS Ukraine
The bone tissue state in children and adolescents of Ukraine, subjects of both sexes,was studied. The purpose of this study is to determine normal values in Ukrainianchildren and adolescents. The total of 577 healthy children and adolescents (205males and 372 females; 7–18 years old) were examined by means of ultrasound bonedensitometer «Achilles+» (Lunar Corp., Madison, WI). The speed of sound (SOS, m/s),broadband ultrasound attenuation (BUA, dB/MHz) and a calculated «Stiffness» index(SI, %) were measured. Ultrasound parameters increased with age in both sexes(fig.1). It was found out that the ultrasound parameters characterizing state ofspongy bone tissue and its density increase during the age of 10–14 years. Results oflinear regression analysis revealed a significant correlation between ultrasoundparameters and height (SOS=1413+0,99Height; r=0,45; R2=20,2; p<0,001;BUA=7,0+0,62´Height; r=0,60; R2=36,1; p<0,001; SI=0,69´Height-19,6; r=0,60;R2=36,1; p<0,001). Using the method of step-by-step multiple regression,mathematical models for determination of the structural-functional age of bonesystem (SFA BS) in children and adolescents are worked out:
SFA BS (males) = 9,01 ´ H + 0,06 ´ W + 0,04 ´ BUA - 7,7
(r = 0,88; R2 = 78%; p < 0,0001);
SFA BS (females) = 8,02 ´ H + 0,05 ´ W - 0,008 ´ SOS - 13,9
(r = 0,78; R2 = 61%; p < 0,0001), where: H - height (m), W - weight.
Fig. 1 SI values in children and adolescents associated with age and sexNote: * – p < 0, 05; ** – p < 0,01; *** – p < 0,001 in comparison with the 10-year-
old males and females
In summary, basic preventive measures against the development of «future»osteoporosis in children need to be carried out during the period from 10–15years.
Poster Number 150 Peripheral DXA
A Cross-Sectional Association of Phalangeal Bone Mineral Density VersusHip Bone Mineral Density with Osteoporosis and Non-Vertebral Fracture
Denise von Muhlen, University of California, San Diego; Diane Claflin, University ofCalifornia, San Diego; Elizabeth Barrett-Connor, University of California, San Diego
Background: Osteoporotic fractures are a major public health problem. It isestimated that 1 in 2 women and 1 in 4 men over the age of 50 will have anosteoporosis-related fracture in their lifetime. Bone mineral density (BMD) at the hipis the preferred diagnostic test to predict a first osteoporotic fracture.
Method: We compared BMD of the phalanges (Accudexa) with BMD of the total hip(DXA) in 1131 participants aged 71 +/- 9 years from the Rancho Bernardo Studyto determine the cross-sectional association between a single finger BMD 1) withosteoporosis defined by DXA, and 2) with self-reported non-vertebral osteoporoticfractures.
Results: Single phalange BMD was positively and significantly correlated with hip BMD(DXA) in both sexes (r=0.61 in women and r=0.53 p= in men, p’s<0.001). Atbaseline, 82.2% of the participants were correctly classified as being either normal orosteoporotic by both tests; 11.6% were classified as osteoporotic by Accudexa onlyand 6.2% were osteoporotic by DXA only, with significant agreement (Kappa=0.33,p<0.001). Altogether 213 (18.7%) participants (137 women and 76 men) reported anon-vertebral osteoporotic fracture. Logistic regression models showed that BMD atthe hip and at the phalange were equivalent in their association with clinical non-vertebral osteoporotic fractures independent of sex, age and body size.
Conclusion: BMD at the phalanges might be an inexpensive tool to identify olderadults at increased risk for an osteoporotic fracture
Poster Number 151 Prevention and Treatment of Osteoporosis
Evaluation of Different Assessment Tools in the Determination ofTreatment Thresholds for Osteoporotic Fractures – The Hong KongOsteoporosis Study
Eva Yuet-Wah Chu, Postdoctoral fellow of Medicine, University of Hong Kong, HK;Shirley Wan-Yin Tsang, Postdoctoral fellow of Medicine, University of Hong Kong, HK;Frankie Ka-Lai Leung, Associate Professor of Orthopaedics and Traumatology, HKU;Grace Wai-King Tang, Clinical Professor of Obstetrics & Gynaecology, HKU; KeithDip-Kei Luk, Chair Professor of Orthopaedics and Traumatology, HKU; Annie Wai-Chee Kung, Professor of Medicine, HKU, HK
Precise osteoporotic fracture risk prediction depends on appropriate parameters.Assessment of osteoporotic fracture (OF) risk is enhanced with global evaluation ofbone mineral density (BMD) and clinical risk factors (CRF). A simple assessment toolwith high predictive value to target the most cost-effective treatment in developingcountries is a challenge. The purpose of this study was to evaluate differentassessment approaches based on BMD and CRF to elucidate osteoporotic fracturerisk in postmenopausal southern Chinese women (PSCW).This is a part of the HongKong Osteoporosis Study (HKOS) whereby PSCW recruited from different regions inHong Kong (HK) were prospectively followed for incident low trauma fractures.Fracture information was verified from the computerized system of the HospitalAuthority of HK Government. 2,226 subjects aged 62.1±9.27 with a median followup duration 4.3±2.2 years were evaluated in this study. BMD T-score was determinedusing either local southern Chinese (LSC) population or NHANES III Caucasiannormative database. Osteoporotic and hip fracture rates were determined usingmultiple logistic regression analysis. Individual 10-year fracture probability wasdetermined with the FRAX-risk calculator.Peak incident fracture rate was observed inthe range of BMD T-score -2.0 to -2.5 using the LSC database. Fracture rate andprobability increased with decreasing BMD T-score and increased further with theaddition of CRF assessment. At the cutoff of femoral neck BMD T-score=-2.5, theincident osteoporotic fracture identified were 42.3%, 56.2% and 54.0% as estimatedby LSC femoral neck BMD, LSC BMD at any site and NHANES III Caucasian femoralneck equivalent BMD respectively. Addition of at least 1 CRF into the calculationincreased to 59.4%, 81.8% and 95.6%. Using the criteria of NHANES III femoral neckBMD T-score =-2.5 and at least 1 CRF, the mean 10-year probability of a major OFand hip fracture based on FRAX® risk calculator was 33.4% and 10.7%, respectively.Area under the ROC curve for OF showed that the best model was estimated byBMD at the femoral hip using LSC database (0.758). This model was superior thanother models: FRAX-Japan model (0.692,p<0.05), FRAX-US Caucasian model(0.676,p<0.05), and FRAX-Mainland Chinese model (0.643,p<0.05).A combination ofBMD and CRF was able to provide good prediction of OF. Ethnic specific model isnecessary if treatment threshold is based on fracture prediction model. (IOF08-0470
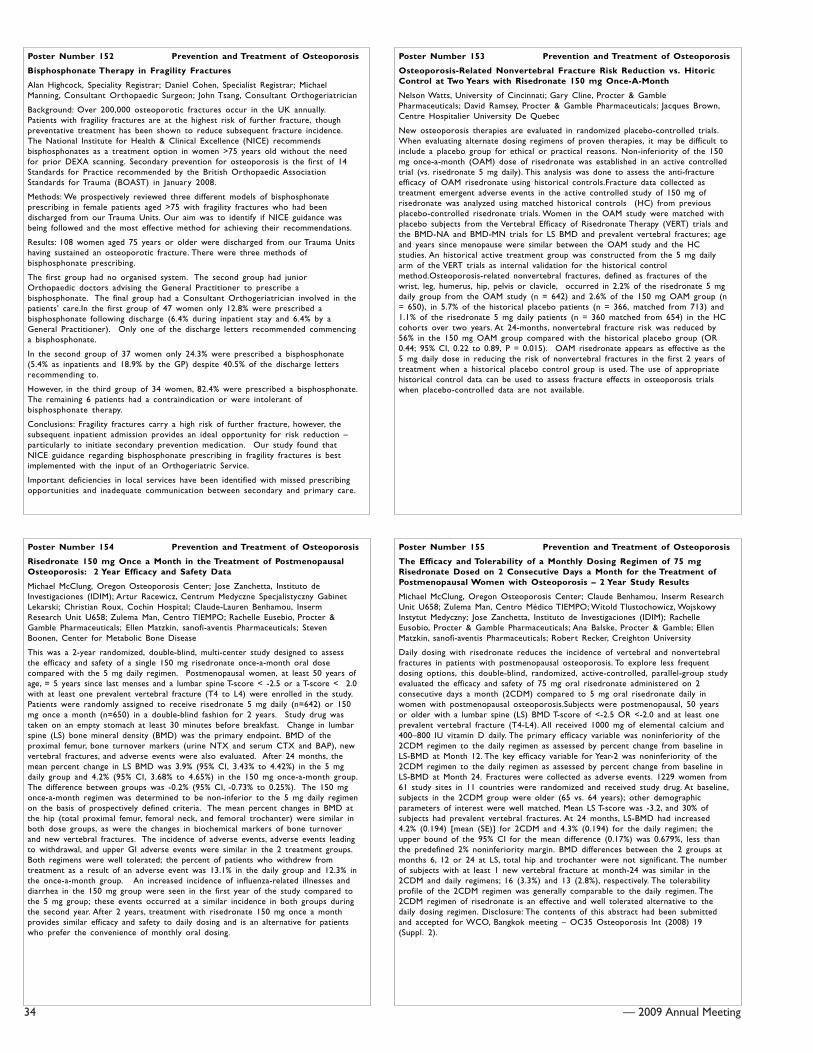
34 — 2009 Annual Meeting
Poster Number 152 Prevention and Treatment of Osteoporosis
Bisphosphonate Therapy in Fragility Fractures
Alan Highcock, Speciality Registrar; Daniel Cohen, Specialist Registrar; MichaelManning, Consultant Orthopaedic Surgeon; John Tsang, Consultant Orthogeriatrician
Background: Over 200,000 osteoporotic fractures occur in the UK annually.Patients with fragility fractures are at the highest risk of further fracture, thoughpreventative treatment has been shown to reduce subsequent fracture incidence.The National Institute for Health & Clinical Excellence (NICE) recommendsbisphosphonates as a treatment option in women >75 years old without the needfor prior DEXA scanning. Secondary prevention for osteoporosis is the first of 14Standards for Practice recommended by the British Orthopaedic AssociationStandards for Trauma (BOAST) in January 2008.
Methods: We prospectively reviewed three different models of bisphosphonateprescribing in female patients aged >75 with fragility fractures who had beendischarged from our Trauma Units. Our aim was to identify if NICE guidance wasbeing followed and the most effective method for achieving their recommendations.
Results: 108 women aged 75 years or older were discharged from our Trauma Unitshaving sustained an osteoporotic fracture. There were three methods ofbisphosphonate prescribing.
The first group had no organised system. The second group had juniorOrthopaedic doctors advising the General Practitioner to prescribe abisphosphonate. The final group had a Consultant Orthogeriatrician involved in thepatients’ care.In the first group of 47 women only 12.8% were prescribed abisphosphonate following discharge (6.4% during inpatient stay and 6.4% by aGeneral Practitioner). Only one of the discharge letters recommended commencinga bisphosphonate.
In the second group of 37 women only 24.3% were prescribed a bisphosphonate(5.4% as inpatients and 18.9% by the GP) despite 40.5% of the discharge lettersrecommending to.
However, in the third group of 34 women, 82.4% were prescribed a bisphosphonate.The remaining 6 patients had a contraindication or were intolerant ofbisphosphonate therapy.
Conclusions: Fragility fractures carry a high risk of further fracture, however, thesubsequent inpatient admission provides an ideal opportunity for risk reduction –particularly to initiate secondary prevention medication. Our study found thatNICE guidance regarding bisphosphonate prescribing in fragility fractures is bestimplemented with the input of an Orthogeriatric Service.
Important deficiencies in local services have been identified with missed prescribingopportunities and inadequate communication between secondary and primary care.
Poster Number 153 Prevention and Treatment of Osteoporosis
Osteoporosis-Related Nonvertebral Fracture Risk Reduction vs. HitoricControl at Two Years with Risedronate 150 mg Once-A-Month
Nelson Watts, University of Cincinnati; Gary Cline, Procter & GamblePharmaceuticals; David Ramsey, Procter & Gamble Pharmaceuticals; Jacques Brown,Centre Hospitalier University De Quebec
New osteoporosis therapies are evaluated in randomized placebo-controlled trials.When evaluating alternate dosing regimens of proven therapies, it may be difficult toinclude a placebo group for ethical or practical reasons. Non-inferiority of the 150mg once-a-month (OAM) dose of risedronate was established in an active controlledtrial (vs. risedronate 5 mg daily). This analysis was done to assess the anti-fractureefficacy of OAM risedronate using historical controls.Fracture data collected astreatment emergent adverse events in the active controlled study of 150 mg ofrisedronate was analyzed using matched historical controls (HC) from previousplacebo-controlled risedronate trials. Women in the OAM study were matched withplacebo subjects from the Vertebral Efficacy of Risedronate Therapy (VERT) trials andthe BMD-NA and BMD-MN trials for LS BMD and prevalent vertebral fractures; ageand years since menopause were similar between the OAM study and the HCstudies. An historical active treatment group was constructed from the 5 mg dailyarm of the VERT trials as internal validation for the historical controlmethod.Osteoporosis-related nonvertebral fractures, defined as fractures of thewrist, leg, humerus, hip, pelvis or clavicle, occurred in 2.2% of the risedronate 5 mgdaily group from the OAM study (n = 642) and 2.6% of the 150 mg OAM group (n= 650), in 5.7% of the historical placebo patients (n = 366, matched from 713) and1.1% of the risedronate 5 mg daily patients (n = 360 matched from 654) in the HCcohorts over two years. At 24-months, nonvertebral fracture risk was reduced by56% in the 150 mg OAM group compared with the historical placebo group (OR0.44; 95% CI, 0.22 to 0.89, P = 0.015). OAM risedronate appears as effective as the5 mg daily dose in reducing the risk of nonvertebral fractures in the first 2 years oftreatment when a historical placebo control group is used. The use of appropriatehistorical control data can be used to assess fracture effects in osteoporosis trialswhen placebo-controlled data are not available.
Poster Number 154 Prevention and Treatment of Osteoporosis
Risedronate 150 mg Once a Month in the Treatment of PostmenopausalOsteoporosis: 2 Year Efficacy and Safety Data
Michael McClung, Oregon Osteoporosis Center; Jose Zanchetta, Instituto deInvestigaciones (IDIM); Artur Racewicz, Centrum Medyczne Specjalistyczny GabinetLekarski; Christian Roux, Cochin Hospital; Claude-Lauren Benhamou, InsermResearch Unit U658; Zulema Man, Centro TIEMPO; Rachelle Eusebio, Procter &Gamble Pharmaceuticals; Ellen Matzkin, sanofi-aventis Pharmaceuticals; StevenBoonen, Center for Metabolic Bone Disease
This was a 2-year randomized, double-blind, multi-center study designed to assessthe efficacy and safety of a single 150 mg risedronate once-a-month oral dosecompared with the 5 mg daily regimen. Postmenopausal women, at least 50 years ofage, = 5 years since last menses and a lumbar spine T-score < -2.5 or a T-score < 2.0with at least one prevalent vertebral fracture (T4 to L4) were enrolled in the study.Patients were randomly assigned to receive risedronate 5 mg daily (n=642) or 150mg once a month (n=650) in a double-blind fashion for 2 years. Study drug wastaken on an empty stomach at least 30 minutes before breakfast. Change in lumbarspine (LS) bone mineral density (BMD) was the primary endpoint. BMD of theproximal femur, bone turnover markers (urine NTX and serum CTX and BAP), newvertebral fractures, and adverse events were also evaluated. After 24 months, themean percent change in LS BMD was 3.9% (95% CI, 3.43% to 4.42%) in the 5 mgdaily group and 4.2% (95% CI, 3.68% to 4.65%) in the 150 mg once-a-month group.The difference between groups was -0.2% (95% CI, -0.73% to 0.25%). The 150 mgonce-a-month regimen was determined to be non-inferior to the 5 mg daily regimenon the basis of prospectively defined criteria. The mean percent changes in BMD atthe hip (total proximal femur, femoral neck, and femoral trochanter) were similar inboth dose groups, as were the changes in biochemical markers of bone turnoverand new vertebral fractures. The incidence of adverse events, adverse events leadingto withdrawal, and upper GI adverse events were similar in the 2 treatment groups.Both regimens were well tolerated; the percent of patients who withdrew fromtreatment as a result of an adverse event was 13.1% in the daily group and 12.3% inthe once-a-month group. An increased incidence of influenza-related illnesses anddiarrhea in the 150 mg group were seen in the first year of the study compared tothe 5 mg group; these events occurred at a similar incidence in both groups duringthe second year. After 2 years, treatment with risedronate 150 mg once a monthprovides similar efficacy and safety to daily dosing and is an alternative for patientswho prefer the convenience of monthly oral dosing.
Poster Number 155 Prevention and Treatment of Osteoporosis
The Efficacy and Tolerability of a Monthly Dosing Regimen of 75 mgRisedronate Dosed on 2 Consecutive Days a Month for the Treatment ofPostmenopausal Women with Osteoporosis – 2 Year Study Results
Michael McClung, Oregon Osteoporosis Center; Claude Benhamou, Inserm ResearchUnit U658; Zulema Man, Centro Médico TIEMPO; Witold Tlustochowicz, WojskowyInstytut Medyczny; Jose Zanchetta, Instituto de Investigaciones (IDIM); RachelleEusobio, Procter & Gamble Pharmaceuticals; Ana Balske, Procter & Gamble; EllenMatzkin, sanofi-aventis Pharmaceuticals; Robert Recker, Creighton University
Daily dosing with risedronate reduces the incidence of vertebral and nonvertebralfractures in patients with postmenopausal osteoporosis. To explore less frequentdosing options, this double-blind, randomized, active-controlled, parallel-group studyevaluated the efficacy and safety of 75 mg oral risedronate administered on 2consecutive days a month (2CDM) compared to 5 mg oral risedronate daily inwomen with postmenopausal osteoporosis.Subjects were postmenopausal, 50 yearsor older with a lumbar spine (LS) BMD T-score of <-2.5 OR <-2.0 and at least oneprevalent vertebral fracture (T4-L4). All received 1000 mg of elemental calcium and400–800 IU vitamin D daily. The primary efficacy variable was noninferiority of the2CDM regimen to the daily regimen as assessed by percent change from baseline inLS-BMD at Month 12. The key efficacy variable for Year-2 was noninferiority of the2CDM regimen to the daily regimen as assessed by percent change from baseline inLS-BMD at Month 24. Fractures were collected as adverse events. 1229 women from61 study sites in 11 countries were randomized and received study drug. At baseline,subjects in the 2CDM group were older (65 vs. 64 years); other demographicparameters of interest were well matched. Mean LS T-score was -3.2, and 30% ofsubjects had prevalent vertebral fractures. At 24 months, LS-BMD had increased4.2% (0.194) [mean (SE)] for 2CDM and 4.3% (0.194) for the daily regimen; theupper bound of the 95% CI for the mean difference (0.17%) was 0.679%, less thanthe predefined 2% noninferiority margin. BMD differences between the 2 groups atmonths 6, 12 or 24 at LS, total hip and trochanter were not significant. The numberof subjects with at least 1 new vertebral fracture at month-24 was similar in the2CDM and daily regimens; 16 (3.3%) and 13 (2.8%), respectively. The tolerabilityprofile of the 2CDM regimen was generally comparable to the daily regimen. The2CDM regimen of risedronate is an effective and well tolerated alternative to thedaily dosing regimen. Disclosure: The contents of this abstract had been submittedand accepted for WCO, Bangkok meeting – OC35 Osteoporosis Int (2008) 19(Suppl. 2).

— 2009 Annual Meeting 35
Poster Number 156 Prevention and Treatment of Osteoporosis
Treatment with Risendronate and its Effect on Postmenopausal Women
Galesanu Corina, Professor of Endocrinology, University of Medicine and Pharmacy,Iasi; Natalia Lisnic, University of Medicine and Pharmacy; Liliana Moisii, University ofMedicine and Pharmacy; Mihail Galesanu, Centre of Imaging and RadiologicDiagnosis; Valentin Zaharia, University of Medicine and Pharmacy; Adrian Aancute,University of Medicine and Pharmacy
Risedronate has been used in the treatment of postmenopausal osteoporosis withsuccess in the recent years. We proposed to determine the efficacy and safety atRisedronate (Actonel®) 35mg once a week compared with a control groupuntreated women. We used DXA measurement for BMD change from baseline andafter the treatment in lumbar spine, total proximal femur and femoral neck. 100postmenopausal women with mean age of 66.76±5.26 years who had osteoporosis(lumbar spine T - score = -2.5 SD and femoral neck T - score -1 SD) ware treatedwith Risedronate 35 mg once week. Time since menopause was 18.4±0.1 years. Thecontrol group was made by 30 postmenopausal women with mean age 59.13±4.57years; time since menopause of 14.6±3.4 and T - score at lumbar spine between -2and -1.5 SD. The efficacy of treatment was assessed by percent change from baselinein lumbar spine, total proximal femur and femoral neck. Our result showed: themean percent change value for lumbar spine BMD from baseline at 24 months was11.3 (0.659 g/cm2 to 0.733 g/cm2; T - score from -2.75 to -2.47 SD). The meanpercent change for total proximal femur was 2.1 (0.782 g/cm2 to 0.799 g/cm2; T -score -1.3 to -1.2 SD) and for femoral neck 10% (0.650 g/cm2 to 0.715 g/cm2; T -score -1.7 to -1.5 SD). No significantly changes in control group. In conclusion,Risedronate therapy in postmenopausal women increases BMD at lumbar spine andfemoral neck. Patients receiving Risedronate showed an improvement of BMD vscontrol untreated group.
Poster Number 157 Prevention and Treatment of Osteoporosis
Variations in Bone Mineral Density with Once-yearly i.v. Zoledronic acid 5mg: Retrospective Subgroup Analysis of HORIZON Recurrent FractureTrial
Peter Mesenbrink, Novartis Pharmaceuticals Corporation; Jay Magaziner, University ofMaryland, Baltimore, MD, USA; Denise Orwig, University of Maryland, Baltimore, MD,USA; Kenneth W. Lyles, Duke University and VA Medical Centers, Durham, NC, USA;Lars Nordsletten, Ullevål University Hospital, N-0407 Oslo, Norway; Steven Boonen,University of Leuven, Belgium; Jonathan D. Adachi, McMaster University, Hamilton, ON,Canada; Cathleen Colon-Emeric, Duke University and VA Medical Centers, Durham,NC, USA; Christina Bucci-Rechtweg, Novartis Pharmaceuticals, East Hanover, NJ, USA.;Carl Pieper, Duke University and VA Medical Centers, Durham, NC, USA
Background: Results of HORIZON Recurrent fracture Trial (RFT) published in NEJM(Lyles et al.)1 reported a 35% risk-reduction with zoledronic acid (ZOL) (p=0.001)in all clinical fractures along with significant increases in total hip (TH) and femoralneck (FN) bone mineral density (BMD) as compared with placebo. This retrospectiveanalysis of HORIZON-RFT identified the subgroups of patients who demonstrated agreater or lesser BMD benefit following a hip fracture.
Methods: A retrospective analysis was done using the data from HORIZON-RFT, amulticenter, randomized, double-blind, placebo-controlled trial, involving 2127patients with a recent hip fracture, who were randomized to receive i.v. once-yearlyZOL 5 mg (n=1065) or placebo (n=1062) started within 90 days after the surgicalrepair of the hip. ANOVA models (with treatment, geographic region, subgroup, andtreatment-by-subgroup interaction) for the percentage change in TH and FN BMDrelative to baseline were used to evaluate the effects of ZOL within and across thesubgroups. Treatment-by-subgroup interaction was considered significant if p<0.10.Subgroups evaluated: age, gender, body mass index (BMI), baseline FN BMD, locationof hip fracture, fracture history, and mental status by “The Short Portable MentalStatus Questionnaire”.
Results: Overall, ZOL 5 mg consistently increased TH and FN BMD at Months 12 and24 from baseline across all subgroups as compared to placebo. The table shows thesubgroups that achieved greater statistically significant improvement in TH/FN BMDwith ZOL vs. placebo.
Conclusions: Treatment with ZOL consistently showed a reduction in fracture riskand mortality as well as an increased TH/FN BMD at Months 12 and 24 across allsubgroups. In addition, patients at highest risk for bone loss following hip fracturerepair (aged =85 years, BMD T-score <-2.5, history of vertebral and non-vertebralfracture in addition to the baseline hipfracture) experienced greater increases inBMD than observed for the rest of theZOL-treated population vs. placebo.
Poster Number 158 Prevention and Treatment of Osteoporosis
Male Patients with Idiopathic Osteoporosis and Long Term AlendronateCare
Miro Cokolic, UKC Maribor
Aims
In men with osteoporosis, but no obvious cause, the treatment choice remains to beclearly established. The aim of this study was to assess the effectiveness of alendronatetherapy in treatment of male patients with idiopathic osteoporosis.
Methods
Twenty men with idiopathic osteoporosis (T-score at lumbar spine or hip < - 2.5 SD,serum concentrations of free testosterone, TSH, Ca, P, Mg, and alkaline phosphatase(ALP) within normal limits) were enrolled in a prospective study between January2001 and September 2007. Patients were 51 to 71 years old (mean: 61,7 years).They were treated with alendronate sodium (70 mg/w) in combination with 500-mgelemental calcium and 800 IU vitamin D. The BMD in the lumbar spine (L1 - L4) andleft hip was measured in all patients using dual energy X-ray densitometry (HologicQDR 2000+) at the start of the treatment and at 12 to 60 months after initiation ofthe treatment. The serum levels of Hgb, Hct, WBC, Plt, testosterone, TSH, Ca, P, Mg,Na, K, Cl, ALP, AST, ALT, BUN, creatinine, osteocalcin and ß cross laps were measuredevery 12 months.
Results
Average baseline BMD was 0.782 g/cm2 (n=20, range 0.649 to 0.929 g/cm2) at thelumbar spine and 0.728 g/ cm2 (n=20, range 0.599 to 0.891 g/cm2) at the hip.After treating patients on average for 48 months, the average BMD was 0.852 g/cm2(n=20, range 0.711 to 1.038 g/cm2) at the lumbar spine and 0.731 g/ cm2 (n=20,range 0.720 to 0.985 g/cm2) at the hip. BMD thus increased on average by 8.9% atthe lumbar spine and 0.5% at the hip. Serum levels remained within normal limitsthroughout the treatment, with no adverse events observed during the study.
Conclusions
In male patients with idiopathic osteoporosis alendronate sodium in combinationwith 500-mg elemental calcium and 800 IU vitamin D can provide clinically relevantbenefits and was well tolerated.
Poster Number 159 Prevention and Treatment of Osteoporosis
Two-Year Results of Odanacatib (MK-822) Treatment in PostmenopausalWomen with Low Bone Mineral Density
Michael McClung, Oregon Osteoporosis Center; John Eisman, Garvan Institute ofMedical Research; Henry Bone, Michigan Bone and Mineral Center; Christian Roux,Cochin Hospital, University of Paris; Robert Recker, School of Medicine, CreightonUniversity; Nadia Verbruggen, Merck & Co., Inc.; Carolyn Hustad, Merck & Co., Inc.;Carolyn DaSilva, Merck & Co., Inc.; Donald Kimmel, Merck & Co., Inc.; ArthurSantora, Merck & Co., Inc.; B. Ince, Merck & Co., Inc.
Background: Odanacatib, a selective inhibitor of cathepsin K, has been shown torapidly and reversibly decrease bone resorption in preclinical and Phase I studies.
Methods: A randomized, double-blind, 2-year study (1-year base + 1-year extension)was performed in postmenopausal women with low bone mineral density (BMD) toevaluate the safety and efficacy vs. placebo of 3, 10, 25 or 50 mg weekly ofodanacatib on BMD, bone turnover indices, and histomorphometry. Postmenopausalwomen (N=399, mean age: 64.2 ± 7.8 years) with BMD T-scores =<-2.0 at thelumbar spine, total hip, femoral neck or hip trochanter and =>-3.5 at all sites wererandomized to receive placebo or 1 of 4 doses of odanacatib. 320 women continuedinto the 1-year extension, and 280 women completed 2 years of treatment;participants and investigators remained blinded to treatment allocation during theextension period. The primary endpoint was percent change vs. baseline in lumbarspine BMD. Trabecular bone turnover was assessed via transilial biopsies obtainedfrom all consenting participants at 24 months.
Results: There were progressive dose-related increases in BMD vs. baseline. Lumbarspine and total hip BMD increased 5.5% and 3.2%, respectively, with the highest dosewhile being essentially unchanged with placebo (-0.2% and -0.9%). Urinary N-telopeptides (NTx/Cr) and bone-specific alkaline phosphatase (BSAP) decreased 52%and 13%, respectively, with the 50-mg dose, whereas uNTx/Cr decreased 5% andBSAP increased 3% with placebo. Preliminary transilial biopsies (N=27) indicated nosignificant effect on bone formation or osteoclast number at the 2-year time point(table).
Conclusions: Two years of odanacatib treatment in postmenopausal women with lowBMD increased lumbarspine and total hipBMD with no evidenceof skeletal toxicity. Thisabstract had beensubmitted andaccepted for WCO,abstract #P229TH,Osteoporosis Int(2008) 19 (Suppl. 2).

36 — 2009 Annual Meeting
Poster Number 160 Prevention and Treatment of Osteoporosis
Treatment Assessment with Strontium Ranelate in PostmenopausalOsteoporosis by Dual X-ray Absorptiometry
Galesanu Corina, Professor of Endocrinology, University of Medicine and Pharmacy,Iasi; Natalia Lisnic, University of Medicine and Pharmacy; Liliana Moisii, University ofMedicine and Pharmacy; Mihail Galesanu, Centre of Imaging and Radiologic Diagnosis;Valentin Zaharia, University of Medicine and Pharmacy; Adrian Aancute, University ofMedicine and Pharmacy; Elena Cracana, County Medical Centre; Elena Poeata,County Medical Centre; Alexandrina Bogdan, County Medical Centre Iasi; MirceaPlescan, County Medical Centre; Lili Constantinescu, County Medical Centre
Osteoporosis is a major public health problem. In East Europe where exist the highprevalence of osteoporosis risk factors - high smoking rates and low vitamin D, thesocial and economic costs of osteoporosis will continue to rise. In Romania, anepidemiological study (2007 - PREVOSS) estimated a prevalence of postmenopausalosteoporosis at 16.5% in urban area. The objective of this work was to describe theefficacy of Strontium ranelate in bone mineral density (BMD) change. Strontiumranelate is antiosteoporotic drug that acts by reducing bone resorption andpromoting bone formation, there by inducing a positive bone balance. We examined230 postmenopausal women with osteoporosis. The diagnosis was based by WHO -criteria, using Dual X-ray Absorptiometry (DXA). Thirty-six women (15.6%) wastreated with Strontium Ranelate (OSSEOR®) 2g/d orally, eighteen months. Thirtypostmenopausal women with normal BMD ware control group. The mean ages ofpatients was 62.11±2.39 years, for treated women vs 59.13±4.3 years for untreatedwomen, time since menopause 15.7±1.3 years for treated patients vs 14.6±3.4 yearsfor untreated women.The mean lumbar spine BMD in the first group (treated) wasat the debut 0.699g/cm2 and 0.806g/cm2 after the treatment (15.3%). T - scoremeans increased from -3.2 to -1,7 SD. The mean hip BMD was 0.670g/cm2 at debutand 0.705g/cm2 after the treatment (5.2%). T - score was -2.2 before treatment and-2.0 SD after. The mean femoral neck BMD was 0.577g/cm2 before treatment and0.602g/cm2 after (4.3%). T - score was -2.5 and increased to -2.3 SD. In the controlgroup no change in BMD after eighteen months. The result demonstrate thatStrontium ranelate provides sustained efficacy in vertebral BMD change. For moreconclusions we need more patients treated for long term.
Poster Number 161 Prevention and Treatment of Osteoporosis
Advantageous Effect of TNA-alfa Inhibitors on the Osteoporosis ofAnkylosing Spondylitis Patients
Éva Lányi, Polyclinic of the Hospitaller Brothers’ of St. John in God in Budapest;Mariann Bónácz, Polyclinic of the Hospitaller Brothers’ of St. John in God inBudapest; Pál Géher, Polyclinic of the Hospitaller Brothers’ of St. John in God inBudapest
The application of biological therapy featuring TNF-alfa inhibitors has gained onimportance and popularity in the treatment of ankylosing spondylitis (AS). We aimedhere to investigate the influence of long-term application of TNF-alfa inhibitors onthe secunder osteoporosis (OP) of AS patients. The investigation of OP on 39 malepatients suffering in AS characterized by high disease activity (BASDAI=60) withrespect to the influence of biological therapy performed with infliximab oretanercept, respectively, was carried out in comparison with an age-matched controlgroup of patients with comparable disease activity but not receiving biologicaltreatment. The OP was characterized by bone densitometry (BD) on lumbar spineand hip, heel ultrasound and laboratory analitics (We, CRP, Se-Ca, Se-P, CN,Kreatinin, GGT, AP, albumin, urine-Ca-P, osteocalcine, BetaCrossLaps, TSH, PTH) aswell. The bone densitometry revealed that one-third of the study group patientsexhibited osteoporosis and two-third of them osteopenia. The TNF-alfa inhibitorssignificantly and speedily reduce the WE, CRP and the BASDAI values as well,BASDAI=25 levels were reached after half a year treatment. The level of osteocalcineand bone density increased, the BetaCrossLaps decreased. It can been concluded thatthe long-term application of the TNF-alfa not only decreases the activity of SPA butalso inhibits the deterioration of the accompanying OP.Disclaimer: (i) thispresent Abstract is based on the Abstract P716SA accepted for poster presentationat the World Congress on Osteoporosis in Bangkok (planned to be held from 3 to 7December 2008 and cancelled in the last minute)(ii) this Abstract is anupdated and revised version of P716SA
Poster Number 162 Prevention and Treatment of Osteoporosis
Genistein Aglycone Effectively Manages Postmenopausal Bone Loss
Francesco Squadrito, University of Messina; Alessandra Bitto, University of Messina;Herbert Marini, University of Messina; Rosario D’Anna, University of Messina;Domenica Altavilla, University of Messina
Background: Genistein aglycone, a Selective Estrogen Receptor Modulator, might playa preventive role against bone mass loss without the harmful estrogenic activity onreproductive tissues.
Methods: In a study of 389 postmenopausal women with osteopenia genisteinaglycone (27 mg BID) increased bone mineral density (BMD) by 2-3% per year atboth the spine and hip. The control group received calcium and vitamin D3 alone,continued to progressively loose bone density and had significantly lower BMD thanthe group of women treated with genistein at 12 and 24 months. A subgroup of138 women continued in the trial for a third year and the genistein group showeda further gain in BMD compared with the women receiving calcium and vitamin D3alone.
Results: Over the 3 year trial, 85 % of women treated with genistein gained bonedensity. These data show that genistein aglycone produces effective management ofthe metabolic processes of bone loss, leading to increased BMD over time.Symptomatic adverse events associated with genistein use were mild. The mostcommonly reported adverse events were mainly gastrointestinal. Genistein aglyconedid not affect breast density, endometrial thickness, or change vaginal cytology over3 years. These data suggest that Fosteum does not promote the development ofbreast or uterine cancers. Nevertheless, since it has not been studied in women witha history of cancer, Fosteum use is contraindicated in women with a history ofbreast or reproductive tissue cancer. A caution is also recommended in women witha first-degree family history of these cancers. Genistein has no effect on standardlaboratory safety tests, including hematology and clinical chemistry panels.Interestingly, genistein did reduce several markers of atherosclerosis, insulinresistance, and clotting. Although the clinical significance of these findings forcardiovascular disease remain to be determined, Fosteum appears safe for the heartand vasculature.
Conclusion: This conclusion is also supported by other clinical data showing thatgenistein does not affect levels of lipids, homocysteine, or C-reactive protein and thatno cardiovascular adverse events have been reported in clinical trials. These clinicalevidences candidate genistein as a possible safe therapeutic alternative for themanagement of post-menopausal symptoms.
Poster Number 163 Prevention and Treatment of Osteoporosis
Do the Effects of Nitric Oxide Donor Nitroglycerin Mediate Through IGF-1?
Sunil Wimalawansa, UMDNJ-RWJMS
Aim: Osteoporotic fractures are associated with significant morbidity and mortality,and expenses. Use of hormone replacement therapy (HRT) has declined afterWomen’s Health Initiative clinical trial. At appropriate doses, nitroglycerin, a nitricoxide (NO) donor has favorable effect on osteoblasts and osteoclasts. The beneficialeffects of estrogen on bone are mostly mediated via IGF and NO/cGMP pathways.Since therapy with IGF is not feasible, use of NO donor therapy to obtain estrogen-related beneficial effects on bone was explored.
Method: A three-year randomized, double blind, controlled clinical trial (n=186) wasconducted to assess the efficacy of nitroglycerin in preventing bone loss in earlypostmenopausal women [Nitroglycerin as an Option: Value in Early Bone Loss(NOVEL study]. Women were randomized to receive nitroglycerin ointment orplacebo ointment. There were no differences in the treatment arms in key baselinecharacteristics. Intent to treat analysis demonstrated no difference in lumbar spineBMD. But taking compliance (~75%) into consideration, the dose actually used bythe study participants is ~50% of that was originally intended to be used, and wassub-therapeutic.
Results: Nitroglycerin-treated subjects who had increased BMD (= 0.0%) over thethree year treatment period had significant increase of serum IGF-1 levels, 201 ±25.6 vs. non-responders, 40.2 ± 16.9 ng/mL (p<0.001). Whereas, those who wereon placebo group including those who had an increase BMD had no such changesof serum IGF-1 levels (-2.6 ± 24.6 vs. 10.8 ± 13.5 ng/mL, NS; responders vs. non-responders). Furthermore, in the nitroglycerin-treated group, the BMD changesobserved was significantly correlated with the change of serum IGF-1 levels from thebaseline (r = 0.5; p<0.01). However, there was no correlation of baseline serumIGF-1 levels with the change of BMD or change of IGF-1 levels followingnitroglycerin.
Conclusion: In this study, those who increased their BMD in response tonitroglycerin therapy had significantly increased in serum IGF-1 levels. Hence, inthose patients who are treated with nitroglycerin to raise their BMD, change ofserum IGF-1 levels may be used as a biochemical marker to identify dose-adequacyand the compliance with nitroglycerin therapy, and also to predict future BMDresponses. These results open new paths for exciting future research, especially inthe area of mechanisms of actions.

— 2009 Annual Meeting 37
Poster Number 164 Prevention and Treatment of Osteoporosis
Calcium and Vitamin D Suppress of Bone Resorption Markers in ElderlyWomen More Effectively than Either Agent Alone
Sunethra Devika Thomas, Trainee (resident) Chemical Pathologist SA Pathology; AllanNeed, SA Pathology; Borje Nordin, SA Pathology
Meta analyses of clinical trials show that the combination of calcium and vitamin Dprevents fractures and bone loss more effectively than either agent alone. Thecurrent study was designed to compare the effects of calcium and vitamin Dseparately and together on biochemical bone resorption markers. Twenty healthyambulatory women with vitamin D insufficiency (<60 nmol/L) aged 59 - 75 yearswere randomized to receive either 1000IU vitamin D3 daily for 7 weeks or 1000mgof elemental calcium as calcium carbonate daily for 1 week. The first group thenreceived added calcium (1000mg/day) as calcium carbonate for 1 week and thesecond received added vitamin D3 (1000IU/day) for 7 weeks. Fasting blood sampleswere collected for biochemistry, parathyroid hormone (PTH) and cross linked Cterminal telopeptides of type I collagen (CTX) at baseline, after calcium or vitamin Dand after the combination. The rise in mean serum ionised calcium was notsignificant after calcium (P 0.2) but it rose significantly after vitamin D (P 0.01) andafter the combination (P 0.003). The fall in serum PTH was not significant aftercalcium (7% fall, P 0.04) or vitamin D alone (14% fall, P 0.2) but was more significantwhen calcium and vitamin D were taken together (25% fall, P 0.04). The fall in CTXwas 37%, 8% and 40% on calcium, vitamin D and the combination (P 0.05, 0.2 and0.0002) respectively. Calcium and vitamin D in combination is a much moresignificant suppressor of bone resorption markers than either suppelement alone.These findings are compatible with recent evidence that combination therapyreduces fracture risk more effectively than either agent alone.
Poster Number 165 Prevention and Treatment of Osteoporosis
Cholecalciferol is More Effective Than Ergocalciferol to Increase Serum25(OH)D
Diane Krueger, UW Osteoporosis Clinical Research Program; Dessa Gemar, UWOsteoporosis Clinical Research Program; Jean Engelke, UW Osteoporosis ClinicalResearch Program; Rekha Ramamurthy, UW Osteoporosis Clinical Research Program;Neil Binkley, UW Osteoporosis Clinical Research Program
Vitamin D2 (Ergocalciferol, [D2]) is often assumed to be less effective than vitaminD3 (cholecalciferol, [D3]) in maintaining serum 25-hydroxyvitamin D [25(OH)D].However, supporting data are limited and a recent report challenges this assumption.Moreover, existing studies directly comparing D2 with D3 administration are ofshort duration. This study investigates the effects of one-year administration of D2 orD3 on circulating levels of 25(OH)D2, 25(OH)D3 and total 25(OH)D.This double-blind trial randomly assigned adults age 65+ to receive daily (1,600 IU) or once-monthly (50,000 IU) D2 or D3. Serum for 25(OH)D measurement by HPLC wasobtained at baseline and immediately before monthly dosing at months 1, 2, 3, 6, 9,and 12. All measurements for each individual were performed in a single HPLC runto minimize assay variability. Sixty-three of the 64 enrolled (40 women/23 men)completed the study, which concluded in November 2008. 25(OH)D data arereported for 61 subjects. Baseline mean (± SEM) age, BMI and 25(OH)D were 72.8(± 0.8) years, 26.6 (± 0.5) kg/m2 and 31.9 (± 1.2) ng/ml respectively. No baselinebetween group differences were observed. Suboptimal 25(OH)D levels (< 30 ng/ml)were present in 38% (24/63) of subjects at baseline. Compliance with all regimenswas >90%. At one year, the overall increase in 25(OH)D was greater (p < 0.01) withD3 (9.3 ng/ml) than with D2 (4.5 ng/ml). Additionally, a greater increase in25(OH)D (p <0.05) was observed with monthly dosing of D3 (8.9 ng/ml) comparedto D2 (2.6 ng/ml). Similarly, daily D3 dosing produced a numerical, though not yetstatistically, greater increase in 25(OH)D. For D2 and D3, no difference in total25(OH)D increase was observed between daily and monthly dosing. Although D2administration raised total 25(OH)D2, a reciprocal decline in 25(OH)D3 wasobserved (p < 0.001) in both D2 dosing groups resulting in a less robust increase intotal 25(OH)D than observed with D3. Substantial between-individual variability wasobserved in 25(OH)D response to identical D2 and D3 doses. Serum and 24-hrurinary calcium concentrations were unchanged over 12 months for allgroups.These data suggest that over one year, D3 is more effective than D2 toincrease serum 25(OH)D. The benefits of D2 supplementation may be offset by acorresponding decline in circulating 25(OH)D3 concentration; the clinicalsignificance of this decline, if any, remains to be determined.
Poster Number 166 Prevention and Treatment of Osteoporosis
25(OH)D Measurement: Deja vu All Over Again?
Neil Binkley, UW Osteoporosis Clinical Research Program; Diane Krueger, UWOsteoporosis Clinical Research Program; Gary Lensmeyer, University of WisconsinClinical and Laboratory Medicine; Jean Engelke, UW Osteoporosis Clinical ResearchProgram; Donald Wiebe, University of Wisconsin Clinical and Laboratory Medicine
The endemic nature of vitamin D deficiency and importance of this vitamin inskeletal and overall health is increasingly being recognized. As a result, a substantialincrease in 25-hydroxy vitamin D [(25(OH)D] measurement by clinicians hasoccurred. Several methodologies exist to measure circulating 25(OH)D. In the past,differences in approaches and lack of standard calibrators led to substantialvariability between laboratories in 25(OH)D results. Recent clinical observationshave raised concern that this variability persists. The purpose of this qualityassurance exercise was to investigate consistency in 25(OH)D results betweencurrent methods and clinical laboratories.Serum pools (n =25) selected to contain25(OH)D2 and 25(OH)D3 at concentrations ranging from undetectable to hightotal 25(OH)D levels were identified and aliquots sent to laboratories utilizingvarious 25(OH)D measurement methodologies.At this time, 25(OH)D results areavailable from six labs utilizing either high performance liquid chromatography(HPLC), liquid chromatography tandem mass spectroscopy or a chemiluminescentimmunoassay. Additional labs and methodologies are being investigated. TheUniversity of Wisconsin clinical lab HPLC results were arbitrarily selected as areferent to which the other results were compared. In comparison to this referent,good correlation was observed for the other five labs (R2 = 0.90 to 0.97). However,modest bias was observed for three labs; two with a positive bias of 4.2 and 4.1 ng/ml, the third with a negative bias of -7.2 ng/ml. For the two labs with a positive bias,22/25 and 23/25 results were numerically higher (+15.7% and +16.1% on average[range +0.4% to +33.3%]) than those obtained by HPLC. Similarly, for the lab with anegative bias, 24/25 results were lower (-23.2% on average [range -2.7% to -39.8%])than the corresponding HPLC values. As an example of this variability, the 25(OH)Dresults for one specimen ranged from 22.7 to 40.0 ng/ml. For all of the 25(OH)Dresults = 40 ng/ml from these five labs, the corresponding HPLC value was > 34 ng/ml.In conclusion, variability in 25(OH)D results persists in clinical laboratories. Suchvariability confounds use of a single cutpoint approach, e.g., 30 ng/ml, for thediagnosis of hypovitaminosis D. Further work to reduce between-laboratory25(OH)D assay variability is needed. A “target” value of 40 ng/ml likely assures thatan individual’s “true” 25(OH)D result is above ~35 ng/ml.
Poster Number 167 Prevention and Treatment of Osteoporosis
Does Vertebroplasty Lead to Osteoporosis Diagnosis and/or Treatment?
Robert Adler, McGuire Veterans Affairs Medical Center; Abu Qutubuddin, McGuireVeterans Affairs Medical Center; William Carne, McGuire Veterans Affairs MedicalCenter; Gopi Kasturi, VA Central California Health Care System
It is well-established that patients with fragility fractures are unlikely to haveevaluation and/or treatment for underlying osteoporosis, and some studies suggestthat patients who undergo vertebroplasty or kyphoplasty are also at risk forfracture in adjacent vertebrae. At a single Veterans Affairs Medical Center we did aretrospective review of 43 consecutive patients who had either a vertebroplasty(n=41) or spinoplasty (n = 2). The majority were male (93%) and Caucasian (84%),with a mean age of 65.5 + 14.8 years. In the electronic medical record, 18 (42%)and 5 (12%) had the diagnosis of osteoporosis or osteopenia listed, respectively. Ofthe 23 carrying a diagnosis, 17 had a prescription for Vitamin D and 18 for calcium.Seventeen patients had a prescription for a bisphosphonate, and 21 (91%) of 23were referred to a Metabolic Bone Clinic. In addition, 6 out of the 20 patients whodid not carry the diagnosis of osteoporosis or osteopenia in the medical record alsohad a bone mineral density performed. Follow-up of abnormal tests was variable inthose patients not referred to the Bone Clinic. Thus, overall 29 of 43 patients whounderwent vertebral augmentation had a DXA, and most of them received at leastsome treatment. This is actually more than the usual proportion of fracture patientswho receive diagnosis and/or treatment in most studies. If vertebral augmentationprocedures increase the risk of fracture in adjacent vertebrae, then treatment ofunderlying osteoporosis is imperative. The data suggest that while the majority ofpatients at least have a DXA performed and most get treatment, there is still asignificant proportion whose only treatment is the augmentation procedure.Methods to insure that underlying osteoporosis will be treated need to bedeveloped.

38 — 2009 Annual Meeting
Poster Number 168 QCT/Peripheral QCT
The Effects of Exercise and Physical Activity Participation on GeometricProperties of Bone in Postmenopausal Women: A Systematic Review ofpQCT Studies
Celeste Hamilton, Women’s College Hospital, Toronto ON; Victoria Swan, Women’sCollege Hospital, Toronto ON; Sophie Jamal, Women’s College Hospital, Toronto ON
Approximately 30% of postmenopausalwomen have osteoporosis and the cumulativerisk of fracture for a woman in her 50’s canreach up to 60%. Exercise has the potentialto prevent osteoporosis and modify fracturerisk in postmenopausal women through itseffects on bone geometry however, theseeffects are not well understood. To determinethe effects of exercise on bone geometry inpostmenopausal women, we conducted asystematic review of the literature. Weincluded all randomized controlled trials,cross-sectional studies and prospective studiesthat used pQCT to assess the effects of exercise onbone geometry in this population. Exercise effectsappear to be site-specific and preferentiallyinfluence cortical rather than trabecularcomponents of bone in postmenopausal women.Exercise type also plays a role, with the mostprominent geometric changes being observed inresponse to high-impact loading exercise. Exerciseappears to positively influence bone geometry inpostmenopausal women. However, further researchis needed to determine the types and amounts ofexercise that are necessary to optimize geometricimprovements, and determine whether or not theseimprovements are capable of preventing fractures.
Poster Number 169 QCT/Peripheral QCT
Sample Size Considerations for Clinical Trials of Antiresorptive TherapiesUsing Quantitative Computed Tomography
Thomas Fuerst, Synarc, Inc.; Harry Genant, University of San Francisco; Klaus Engelke,Synarc, Inc.; Gorana Dasic, GlaxoSmithKline; Michael Fries, GlaxoSmithKline; EMichael Lewiecki, New Mexico Clinical Research & Osteoporosis Center; MichaelBolognese, Bethesda Health Research
Quantitative computed tomography (QCT), which measures trabecular and corticalbone mineral density (BMD) and bone geometry, is increasingly used to evaluate andcompare osteoporosis therapies in clinical trials, supplementing traditional areal BMDmeasurements by dual-energy X-ray absorptiometry (DXA). Designing trials withQCT endpoints requires information on effect size and measurement variability toensure adequate statistical power. This investigation used results from the randomizedibandronate Image Quality (IQ) study to estimate and compare sample sizes requiredto detect differences in QCT and DXA parameters. Ninety-three consentingpostmenopausal women aged 55-80 years with BMD T-scores =-2.0 and =-5.0received oral once-monthly ibandronate (150 mg; n=47) or placebo (n=46) for 12months and underwent spine and hip QCT and DXA at baseline and 12 months. Wecomputed the sample size needed to detect a statistically significant differencebetween groups by a two-tailed t-test with a=0.05 and 90% power (Table). SpineDXA had a smaller standard deviation and so required a smaller sample size thanspine QCT. Hip sample size was comparable between DXA and QCT of total andtrabecular BMD, with slightly smaller samples for QCT. Regional comparisons withinthe hip showed that total hip and trochanter sample sizes were comparable whilethe femoral neck needed a larger sample than these. Comparing different hip QCTparameters, trabecular QCT BMD had a larger effect size but also larger variabilitythan other compartments, conferring no sample size advantage. Cortical BMDneeded a sample size 2- to 10-fold larger than other QCT compartments. Corticalthickness, with a small effect size and large variability, required a sample 10-fold largerthan cortical BMD. Sample sizes required to assess QCT endpoints in osteoporosisdrug trials depend on study population, drug type, image quality, and analyticalmethods. Ibandronate induced improvements in QCT total hip and trabecular BMDdemonstrable withsample sizescomparable to DXA.Cortical BMD andthickness require largersamples than DXA todetect statisticallysignificant changes withantiresorptivetherapies.
Poster Number 170 QCT/Peripheral QCT
Multivariate Correlations between Quantitative Computed TomographyParameters and Femoral Strength Change over 12 Months inOsteoporotic Postmenopausal Women Receiving Ibandronate or Placebo
Harry Genant, University of California San Francisco; Tony Keaveny, University ofCalifornia, Berkeley, and O.N. Diagnostics, LLC; David Kopperdahl, O.N. Diagnostics,LLC; Thomas Fuerst, Synarc, Inc.; Klaus Engelke, Synarc, Inc.; Gorana Dasic,GlaxoSmithKline; Michael Fries, GlaxoSmithKline; Michael Bolognese, Bethesda HealthResearch; E Michael Lewiecki, New Mexico Clinical Research & Osteoporosis Center
Quantitative computed tomography (QCT) measures trabecular and cortical bonemineral density (BMD) and bone geometry, and finite element analysis (FEA) predictsbone mechanical properties from QCT scans. These methods complement each other,providing different information for the evaluation of osteoporosis and its treatment.In this study we investigated the relationship between QCT and FEA changesfollowing 12 months of treatment with ibandronate or placebo.In the 12-monthBone Image Quality study, 93 postmenopausal women aged 55-80 years with DXA T-scores =-2.0 at the total hip, lumbar spine, or femoral neck and =-5.0 at all sitesreceived oral once-monthly ibandronate (150 mg; n=47) or placebo (n=46). HipQCT scans and FEA modeling were performed at baseline and month 12. QCTcompartments analyzed were integral (all bone within the periosteal surface),trabecular (all trabecular bone within a volume determined by uniformly erodingthe endosteal surface to a depth of 1.5 mm), and cortical (all cortical bone betweenperiosteal and endosteal surfaces). Reported here is a post hoc multivariate analysisutilizing generalized linear modeling to examine correlations between percentagechanges from baseline in hip QCT parameters and FEA whole femoral strength for asideways fall. Integral and trabecular QCT BMD were more strongly correlated withfemoral strength than was cortical BMD in the total hip and femoral neck (Table). Inthe intertrochanter region, trabecular BMD was more strongly correlated withfemoral strength than were either integral or cortical BMD.For both total hip andfemoral neck regions, integral and trabecular BMD changes were equally stronglypredictive of FEA-based femoralstrength changes, while cortical BMDchanges were only modestly predictive.For the intertrochanteric region,trabecular BMD changes were stronglypredictive, integral changes modestlypredictive, and cortical changes weaklypredictive of femoral strength changes.The strongest relationships indicatedthat approximately 50% of the variancein change in strength can be explainedby changes in volumetric BMDparameters.
Poster Number 171 Ultrasonometry
Precision Study of Various QUS Devices Compared with DXA Data inKorean Women
Seoung-Oh Yang, Eulji University Hospital; Deog Yoon Kim, Kyung Hee UniversityHospital; Yoon-Sok Chung, Ajou University Hospital; Sun Kwan Juhng, WonkwangUniversity Hospital
Appropriate roles of QUS in the management of osteoporosis is not clear and thediagnostic cut-off value for the specific QUS devices are not determined, so theconfusion is existing to diagnose osteoporosis using QUS compared with dual energyx-ray absorptiometry(DXA) results. The purpose of this study is to establish theprecision data among different QUS devices and DXA, correlation coefficients betweenDXA(L-spine BMD) normative data for Korean women to be used on the population.After survey of the national status of QUS utilization, seven most popular QUSdevices were included for the study. Only women who met all inclusion criteria andnone of the exclusion criteria with informed consents were included in the statisticalanalysis. Precision of QUS devices was taken by duplication of the test in 30examinees. All the precision for DXA was made using European Spine Phantom(ESP)which is made up of water equivalent plastics and epoxy resins and bone-equivalenttissues are simulated by adding calcium hydroxyapatite to the water-equivalentmaterials. It is composed of three vertebrae which vary in mineral density and corticalthickness. Results; 1. Precisions of DXA usingEuropean Spine Phantom(ESP) in ten hospitals varied from 0.41 to 1.10%. 2.Precisions of speed of sound(SOS) in seven QUS devices in-vivo varied 0.10 to2.76%.3. Precisions of broadband ultrasound attenuation(BUA) in-vivo varied 1.71 to3.51%. 4. The peak bone mass by DXA were found at the mid-thirties (Lunarmachine: 1.176 g/cm2 ; Hologic machine: 0.980g/cm2). 5. Correlation coefficientsbetween L-spine BMD and SOS varied 0.270 to 0.581.6. Correlation coefficientsbetween L-spine BMD and BUA varied 0.269 to 0.582. Certain QUS device showedvery low correlation and poor precision, so accurate assessment of the device qualityis mandatory to enhance the accuracy of osteoporosis diagnosis. Clinical role of QUSand its diagnostic criteria should be determined after including patients withosteoporosis by nationwide prospective longitudinal study for fracture risk assessment.

— 2009 Annual Meeting 39
Poster Number 172 Other
Diabetes Mellitus, Osteoporosis and Non-vertebral Clinical Fractures:Related Factors
Maria Pippa, Hospital Heliopolis; Cristiano Zerbini, Hospital Heliopolis
An association between DM and fractures has been reported, but the nature of thatassociation is unclear. We evaluated the prevalence of osteoporosis(OP)and non-vertebral clinical fractures (NVCF)in type 2 diabetic patients.We verified the relationbetween NVCF,comorbities and used drugs in DM2 patients as well. We studied 687women with DM2.Considering the sample of DM1 patients was small,onlyprevalence of OP and NVCF were evaluated in that group.BMD by dual-energy X-ray absorptiometry(DXA)of the lumbar spine(LSBMD),femoral neck(FNBMD)andtotal femur(TFBMD) were performed in all subjects.BMD and presence of fractureswere studied as dependent variables.To compare the difference of means betweenthe variables,Student t test was used.Significant probability(p values) presented arebilateral type.Values lower than 0,05 were considered statistically significant.Univariable regression model,(p< 0,25),polynomial fractional analyses,and multipleregression models(p< 0,05)were used. These results were found:The mean age was69,2 years.(SD= 8,0);weight 62,3 kg(SD= 11,6);height 1,50m(SD=0,06),BMI 27,7 kg/m2(SD= 4,8),and time of menopause(TM) was 22,4 years(SD = 9,7).The prevalenceof OP in DM1 was 2,4% (LS), 1,3% (FN) and 6,6% (TF). In patients with DM2, theprevalence of OP was 15,1% (LS), 6,7% (FN) and 4,0% (FT).The prevalence of NVCFin DM2 group was observed as we report below:28,3% in patients with LS OP;2,7%in patients with FN OP and 2,8% in patients with TF OP.In patients with DM1,3%of those with LS OP,10% of those with FN OP and 50% of those with TF OPpresented NVCF.Ageing, peripheral vascular disease,renal failure,use of loopdiuretics,long time of menopause and cancer history presented positive correlationwith OP in DM2 patients(p <0,0001, p=0,010, p=0,010,p=0.0009, p< 0.0001 andp=0,005,respectively).Regarding to presence of NVCF,weobserved that the history ofcancer and use of anxiolitics,barbituates and glucocorticoids had a positivecorrelation(p=0,201;p=0,150 and p=0,207 respectively).We conclude:1.Theprevalence of NVCF was higher in patients with DM1 that had OP in FN and TFOP.2.Non-diabetic patients with OP in FN and TF had higher prevalence of NVCFthan did patients with DM2.For those with OP in LS,the prevalence of NVCF washigher in DM2 patients when compared to non-diabetics subjects.3.DM1 patientswith OP in TF had high prevalence of NVCF.These results suggest that the presenceof OP in patients with DM may predict higher NVCF.
Poster Number 173 Other
Clinical and Laboratorial Factors Related to High Bone Mineral Density
Maria Pippa, Hospital Heliopolis; Cristiano Zerbini, Hospital Heliopolis
High bone mineral density(HBMD)concept has been controversial and differentvalues of BMD have been considered as threshold in that classification.ConsideringHBMD may be present in normal and abnormal subjects,it’s important to find outwhat clinical factors are involved. Aiming to understand why some women presenthigher BMD when compared to those considered normal for their race and age , wedeveloped this project.We studied 337 pos menopausal women(180 HBMD and 157control group).DXA was used to measure total BMD(TBBMD),lumbarspine(LSBMD),femoral neck(FNBMD)and total femur (TFBMD).Body compositioncompartments(fat and lean mass)were also evaluated by DXA.HBMD group had topresent areal BMD absolute value = 1,228 g/cm2(L1-L4),and = 1,006 g/cm2(FN).They also had to present T-score > 1 SD(OMS classification),and T indexpercent > 100% in all sites(L1,L2,L3,L4 ,L1-L4,FN,wards,trochanter and TF).Subjectswho did not present those criterio were included in control group.(CG).All subjectsperformed lab tests, Baecke questionnaire and nutritional evaluation.Correlationbetween variables was estimated(Pearson coefficient,Deviance and Hosmer–Lemeshow).Multiple regression models were used in order to verify independentpredictors clinical factors of HBMD. Results are bellow:in HBMD group(n=180),106women were white (58,9%)and 72 non white(40%).In CG(n=157),98 werewhite(55,7%) and 72 non white(40,9%).HBMD group mean age was60y(SD=8,3);weight 77,0 Kg (SD=11,7);height 1,57cm(SD= 0,05)and BMI 31,1Kg/m2(SD= 4,9).Mean age of menarche was 12,8y (SD=1,8),menopause 49y(SD=5,3)and estrogen exposition time(TEE2)36,3y(SD=5,8).Non previous use of HTRshowed a high negative correlation with HBMD in FN(r2=-0,011,and euthyroidstate seemed to protect and to maintain HBMD(r 2 = -0,015 )at this site.Subjectswith no previous personal fractures had HBMD at TF(r 2 = 0,008).Again,euthyroidstate seemed to protect and to maintain HBMD(r 2=-0,036).Vit.B12 values showed apositive correlation in HBMD group(r2 = 0,098).Normal or high level of leptin wasfound in HBMD (data not shown).Simvastatin using,fat leg mass and age ofmenarche(<15 years),also showed positive correlation with HBMD values (r2value=0,081;0,037;0,009 respectively).Patients with low physical activity showed aninverse correlation with HBMD.We concluded:previous using of HTR,euthyroidstate,simvastatin actual using,normal/high vit. B12 level,and high level of leptin maybe important to protect and maintain HBMD.
Poster Number 174 Other
High Bone Mineral Density: A Comparative Analysis of AssociatedClinical Factors
Maria Pippa, Hospital Heliopolis; Cristiano Zerbini, Hospital Heliopolis
There are few studies regarding to high bone mineral density (HBMD), particularlyin pos menopausal and elderly women. Aiming to compare possible clinical factorsrelated to HBMD, we studied 337 pos menopausal women . Dual-energy X-rayabsorptiometry (DXA) was used to measure bone mineral density (BMD) and bodycomposition compartments ( fat and lean mass). To be included in HBMD group,subject had to present areal BMD absolute value = 1,228 g/cm2 (L1-L4) , and =1,006 g/cm2 (femoral neck). They also had to present T-score > 1 SD (OMSclassification), and T index percent > 100% in all sites ((L1,L2,L3,L4 ,L1-L4, femoralneck, wards, trochant and total femur). Subjects who did not present those criteriawere included in control group.(CG). All subjects performed bone metabolism labtests, physical activity questionnaire (Baecke) and nutritional evaluation. Variableswere evaluated as descriptive patterns using mean, standard deviation, median,minimum and maximum values. Non-parametrics tests, Oddis Ratio and Mann Whitetest were used to compare variables between groups. Those are the results: inHBMD group (n=180), 106 women were white (58,9%) and 72 non white (40%).In CG (n=157), 98 women were white(55,7%) and 72 non white (40,9%).Therewere significant differences between HBMD and CG in all quantitative variables butmenopause age : 49,0y x 47,7y (p=0,068);vitamin D 42,8 pg /mL x 39,8 pg /mL(p=0,091); estrogen 35,0 pg /mL x 30,2 pg /mL (p=0,051); and CTX 37,6 pg /mLx 43,6 pg /mL (p=0,089) respectively .Regarding to qualitative variables, the mostsignificant differences were observed in actual Calcium + vitamin D suplemment(lesscommon in CG, p<0,001), Vitamin B12 level (normal values more common inCG,p=0,005). There was a trend to significance in high level vitamin B12 seen inHBMD , p=0,102); estrogen level <20 pg/mL(more common in CG , p=0,026) . Weconcluded that: 1. Higher levels of vitamin B12 seems to be related to HBMD. 2.Leptin and IGF1 may be an alternative to maintain HBMD. 3. Calcium + VitaminD supplement and physical activities are simple, but important measures to keepHBMD.
Poster Number 175 Other
Body Composition of Collegiate Swimmers and Baseball Players Measuredwith iDXA
Mary Oates, Marian Osteoporosis Center; David Oates, Marian Osteoporosis Center;Howard Barden, GE Lunar
Body types of elite athletes generally conform to certain standards that allow them toexcel in their chosen sport. As part of a larger observational study to document ahealthy, active total body composition database, we have measured bone mineraldensity (BMD) and body composition of 21 male members of a Division I college swimteam and 15 members of a men’s junior college baseball team with the iDXA (GEHealthcare). Total body %fat was calculated as regional %fat (fat mass/(fat mass + leanmass + BMC). Significant differences were determined by Student t-tests. Mean age,height, weight and BMI of the swimmers and ball players were 19.5 and 20.5 yrs,181.8 and 179.4 cm, and 77.3 and 88.0 kg, and 23.4 and 27.3 wt/ht2, respectively.Swimmers were similar in height to ball players, but ball players were significantlyheavier and had higher BMIs. Swimmers and ball players had similar lean mass, butswimmers had significantly less fat mass and %fat mass at total body and regionalmeasurement sites. Lean mass index (lean mass/height2) was significantly lower inswimmers (Table 1). Percentages of fat in the waist (android cut) and hip (gynoid cut)areas in baseball players were also significantly higher (27% vs. 13% and 31% vs. 18%,respectively) than for swimmers. The markedly lower total body %fat of our swimmerspresumably reflected their extremely high energy expenditure of swim training. Thenonweight-bearing swim training did not appear to provide bone mass benefits, whileball players showed high bone mass values. BMD Z-scores for swimmers were nearnormal (-0.1), but BMD Z-scores for ball players (+2.3) were substantially higher thanreference norms, perhaps attributable to important differences in weight-bearingtraining encountered in the two sports. We conclude that differences in bodycomposition between swimmers and baseball players may reflect differences in physicalattributes necessary to excel in a sport and may also reflect differences in trainingintensity and design between a Division I swim team and junior college baseballprogram.

40 — 2009 Annual Meeting
Poster Number 176 Other
Body Composition Precision with the Lunar iDXA
Serge Rezzi, Nestlé Research Center; Fiona Ginty, GE Global Research Center;Maurice Beaumont, Nestle Research Center; Anny Blondel-Lubrano, Nestle ResearchCenter; Sylviane Oguey-Araymon, Nestlé Research Center; Wynn Wacker, GEHealthcare Lunar; Howard Barden, GE Healthcare Lunar; Sunil Kochhar, NestléResearch Center; Laurent Fay, Nestlé Research Center; David Ergun, GE Healthcare
Interest in body composition measurement is increasing as clinicians, nutritionists,and researchers recognize the close relation that the distribution of fat and leantissue compartments has on disease risk factors and fitness. Baseline measurement oftotal and regional body composition, and changes resulting from dietary andexercise interventions, drug therapy, disease progression, and aging, offer valuableinsights for clinical decision-making. Precision error provides a quantitative measureof the ability of densitometry systems to measure change over time. Minimizingprecision error reduces least significant change (LSC) and time required to detectsignificant biological change. We measured body composition precision with theLunar iDXA, a high-resolution dual-energy X-ray absorptiometry (DXA) scanner(GE Healthcare). DXA uses differential attenuation of x-rays at two energy levels toestimate fat, fat-free soft tissue and bone mineral content (BMC). We performed 31paired scans on 24 subjects (8 males and 16 females), age 20-49 years, withrepositioning between scans. Paired scans from the same subject at different ageswere treated as independent for the purpose of this analysis. Region %fat wascalculated as fat/(fat + lean + BMC). Precision was calculated using the root-mean-square (RMS) method. The LSC was calculated as SD x 2.77 (95% 2-tailedconfidence for the difference between scans). Subjects had mean (SD) age, height,weight, and BMI of 35.9 (8.8) years, 167.4 (9.3) cm, 70.0 (12.9) kg, and 24.9 (4.1)kg/ht2, respectively. Total body precision error was less than 0.7% for all bodycomposition variables. Regional %fat precision (SD) values were 0.35% for trunk,0.48% for arms, 0.24% for legs, 0.46% for android (waist), and 0.48% for gynoid(hip) regions. We conclude that the iDXA has excellent precision for total andregional body composition.
Poster Number 177 Other
Body Composition Analysis by Dual-energy X-ray Absortiometry (DXA) inUnderweight, Normal, Overweight and Obese Mexican Nutrition CollegeStudents
Raúl Pineda, Pindel Diagnosis; Angélica Delgadillo, Pindel Diagnosis; María EstherIrigoyen, Metropolitan Autonomous University Xochimilco; María del ConsueloVelazquez, Metropolitan Autonomous University Xochimilco
Objective: To evaluate body composition (BC) in a group of female nutrition collegestudents and to explore the association of Body Mass Index (BMI) related to mainBC compartments.
Method: Cross- sectional design. Females at a Mexico City University participated.DXA technology was used to evaluate BC (Prodigy Advance, General Electric, USA).Weight and height were measured using standardized protocols. BMI was classifiedusing WHO criteria.
Results: 106 females were examined, their mean age was 23.6 years-old (± 2.2), meanBMI , Fat Mass% (FM%), Lean mass (LM), Bone Mineral Density (BMD), Z- Score were:22.36 Kg/m2, 33.8% (± 6.7) , 18.7Kg (± 6.8), 1.12g/cm2 (±0.07) and -0.1 (±0.89), respectively . Low weight (LW) was detected in 9.4% of the women, 72.7% werenormal and overweight-obese (OW-O) 17.9%. An association was observed betweenBMI and FM% r= 0.78, (p<0.05) and no correlation was detected with LM(r=0.03),(p>0.05). BMI and BMD showed a positive correlation r=0.43, (p<0.05).Women OW-O had a FM%= 42.9%, while FM% of the LW women was a 27.5%,(p<0.001). The BMD in the OW-O group was 1.18 g/cm2, and in the low-weightgroup was 1.05 g/cm2 (p<0.001). Z-scores were also higher among the OW-Ogroup( Z=0.52) vs. LW group (Z=-0.2) (p<0.02).
Conclusion: Overweight and obese women showed a higher BMD than low-weightwomen. Fat mass had a good correlation with BMD. Females with low weight mighthave a higher risk to develop osteoporosis later in life; thus timing for evaluation oflow BMD is a useful indicator for early intervention.
Poster Number 178 Other
In Vitro Disintegration Differences Between Branded and Generic WeeklyAlendronate Sodium Tablets (70mg) Available in the United States
Richard Dansereau, Procter & Gamble Pharmaceuticals; Debbie Crail, Procter &Gamble Pharmaceuticals; Alan Perkins, University of Nottingham
Large variations in disintegration rates have been reported for generic alendronatesodium tablets available in Europe and Canada1. Although the generic alendronatetablets are bioequivalent to the branded product, a potential concern is that thedisintegration properties of the generic tablets may be different and affect thepotential for local irritation and tolerability. Recent studies of two large patientprescribing practices in Canada and Germany reported greater GI adverse events inpatients taking the generic alendronate products.2,3 We measured the in vitrodisintegration time of generic weekly alendronate sodium tablets recently introducedin the United States and compared these to the branded product (Fosamax®).Tablet disintegration was measured using the method described in the United StatesPharmacopeia 30 (USP). As shown in the Table below, the mean disintegration timesof the generic alendronate sodium tablets ranged from 9 seconds for the Barr lot to156 seconds for the Cobalt lot. The disintegration time of the branded product(Fosamax®) was 53 seconds. The Barr, Mylan, Teva and the Aurobindo lot had rapiddisintegration times similar to orally disintegrating tablets (ODTs). ODTs arespecially designed tablets which disintegrate on the tongue before swallowing. FDA’sdisintegration guidance for ODT’s are <30 seconds. Bisphosphonate tablets shouldideally be swallowed intact, thus the observed disintegration times may be too rapid.However, the in vitro disintegration times have not been correlated with in vivodisintegration performance or clinical outcome. Generic alendronate sodium tabletsare approved based on the results of single-dose bioequivalence studies in healthysubjects and disintegration testing is not required. Since there is no establisheddisintegration time for alendronate sodium tablets there can be no assurance thatthe generic tablets are equivalent in this respect. In conclusion, generic alendronatesodium tablets available in the United States exhibit wide variability in disintegrationtimes. Additional studies should be conducted to determine if differences indisintegration time translates into meaningful differences in clinical outcomes andadverse events in patients taking these tablets. 1 Dansereau et al. CMRO 2008;24(4):1137-11452 Grima etal. JBMR 2008; 23(suppl): S2103Ringe et al. JBMR2008; 23 (suppl):S463

FOR NOTE TAKING ONLY. EVALUATION MUST BE COMPLETED THROUGH THE ONLINE EVALUATION SYSTEM TO PROCESS YOUR CME/CE CREDITS
41
ISCD
Education
Evaluator

FOR NOTE TAKING ONLY. EVALUATION MUST BE COMPLETED THROUGH THE ONLINE EVALUATION SYSTEM TO PROCESS YOUR CME/CE CREDITS
42
ISCD Education Evaluator
Annual Meeting Session Evaluation Booklet
The International Society for Clinical Densitometry (ISCD) Education Evaluator is the credit reporting and evaluation system which will allow the ISCD staff to get your feedback on the ISCD Annual Meeting and make it easy for you to process your own CME/CE certificate. Evaluations are very important to us. The planning and execution of useful sound continuing medical education programs are largely guided by input provided by program participants. These evaluations are required for continuing medical education accreditation. In addition, your response to the following questions will help to ensure that future programs are informative and meet participants’ educational needs. This booklet is for note-taking only and will facilitate the completion of your online evaluation. Your evaluation must be completed online in order to process your certificate.
Accreditation Statement This activity has been planned and implemented in accordance with the Essential Areas and policies of the Accreditation Council for Continuing Medical Education through the sponsorship of the International Society for Clinical Densitometry (ISCD). The ISCD is accredited by the Accreditation Council for Continuing Medical Education to provide continuing medical education for physicians.
Credit Designation The International Society for Clinical Densitometry designates this educational activity for a maximum of 28.0 AMA PRA Category 1 Credit(s)™. Physicians should only claim credits commensurate with the extent of their participation in the activity.
The meeting qualifies for up to 28 Category A credits through the ASRT.
Disclosure Statement The International Society for Clinical Densitometry is committed to resolving all conflicts of interest issues that could arise as a result of prospective faculty members’ relevant relationships with drug or device manufacturers. The ISCD is committed to maintaining only those speakers with financial interest that can be reconciled with the goals and educational integrity of the CME program. In accordance with ACCME Standards for Commercial Support, the speaker(s) for this meeting have been asked to disclose to participants the existence of any financial relationships in any amount occurring within the past 12 months. Disclosures can be found starting on page 5 of Program Book.
Special Note to ISCD Technologists: If you would like to receive Category A CE credit, you will need a special badge which will be scanned upon entry to and exit from each room. For the General Session room, you must enter through a doorway that has an electronic gate. To capture your entry or exit, you only need to walk in, no swiping is required. For the Concurrent Room, and the Meet the Professor and Workshop Rooms, you will need to swipe your badge on the scanner. This must be done when you enter the room as well as when you exit the room. Once you complete the online evaluation, ISCD staff will verify your attendance and your certificate will be sent to you via email. Information submitted through ISCD Education Evaluator will only be shared in the aggregate and will not include any contact reference or information. Access to course attendees is limited to the ISCD staff administrator and is only used to assist the attendee with obtaining their attendance certificate.

FOR NOTE TAKING ONLY. EVALUATION MUST BE COMPLETED THROUGH THE ONLINE EVALUATION SYSTEM TO PROCESS YOUR CME/CE CREDITS
43
This booklet is for note-taking only and will facilitate the completion of your online evaluation. Your evaluation must be completed online in order to process your CME/CE certificate. Steps
1) Access the ISCD evaluator at www.ISCD.org under Quick Links section, from any computer that has internet access for up to six weeks after the meeting.
2) Select Annual Meeting (if you attended the BDC and/or VFA course, evaluation(s) will be done separately) 3) Enter your ID number and password. These can be found on your acknowledgement and on your ISCD name badge.
4) Select Technologist or Clinician. 5) Select sessions attended and complete the individual session evaluations using your notes from this booklet.
6) Complete the overall Annual Meeting evaluation. 7) Please verify all sessions attended have been selected before selecting Yes or No. 8) Print your certificate. Note that Technologists will not be able to print a certificate. It will be sent within 4-6 weeks once
attendance is verified via the sign-in/sign-out sheets. 9) Please NOTE: Use the back button on your browser and then select “Log Out” from the upper right hand corner of the page to
complete the session. Logging Out must be completed before evaluating another education course (e.g. BDC or VFA course). Frequently Asked Questions Where can I find my ID number and password? If you pre-registered for the Annual Meeting, you received an e-mail with this instruction sheet and your ID Number and Password. If you registered onsite, you will receive an e-mail with your ID Number and Password about 2 weeks after the meeting. When can I start entering my evaluation information? As long as you are pre-registered for the ISCD Annual Meeting, you may start entering each day’s session evaluations at the end of each day. The system will be available until six weeks after the Annual Meeting (April 30, 2008). Where can I access the ISCD evaluation system? You can access the evaluation system from any computer that has internet access. Go to www.ISCD.org under the Quick Links section. What is the paper evaluation for? You will need to take notes for each lecture so you can enter the information online later. Can I enter part of my information now and finish later? Yes, you may enter partial information and return at a later time to finish. The system will allow this until you indicate that you are finished.

FOR NOTE TAKING ONLY. EVALUATION MUST BE COMPLETED THROUGH THE ONLINE EVALUATION SYSTEM TO PROCESS YOUR CME/CE CREDITS
44
Wednesday, March 11, 2009 Evaluate each session on the criteria below. Name of Session: Speaker: 1 = Poor 2 = Fair 3 = Satisfactory 4 = Good 5 = Excellent
What strategies will you implement into your practice? Degree to which learning objectives were achieved.
Name of Session: Speaker: 1 = Poor 2 = Fair 3 = Satisfactory 4 = Good 5 = Excellent
What strategies will you implement into your practice? Degree to which learning objectives were achieved.
Name of Session: Speaker: 1 = Poor 2 = Fair 3 = Satisfactory 4 = Good 5 = Excellent
What strategies will you implement into your practice? Degree to which learning objectives were achieved.
Knowledge of Topic Relevance of content to stated objective:
Presentation Skills This presentation provided you with strategies to implement into your practice
Presentation Free of Bias
○1 ○2 ○3 ○4 ○ 5 Poor → → → → Excellent
○1 ○2 ○3 ○4 ○ 5 Poor → → → → Excellent
○1 ○2 ○3 ○4 ○ 5 Poor → → → → Excellent
○1 ○2 ○3 ○4 ○ 5 Poor → → → → Excellent
○Yes ○No
○1 ○2 ○3 ○4 ○ 5 Poor → → → → Excellent
FOR NOTE TAKING ONLY. EVALUATION MUST BE COMPLETED THROUGH THE ONLINE EVALUATION SYSTEM TO PROCESS YOUR CME/CE CREDITS
45
Thursday, March 12, 2009 Evaluate each session on the criteria below. Name of Session: Speaker: 1 = Poor 2 = Fair 3 = Satisfactory 4 = Good 5 = Excellent
What strategies will you implement into your practice? Degree to which learning objectives were achieved.
Name of Session: Speaker: 1 = Poor 2 = Fair 3 = Satisfactory 4 = Good 5 = Excellent
What strategies will you implement into your practice? Degree to which learning objectives were achieved.
Name of Session: Speaker: 1 = Poor 2 = Fair 3 = Satisfactory 4 = Good 5 = Excellent
What strategies will you implement into your practice? Degree to which learning objectives were achieved.
Knowledge of Topic Relevance of content to stated objective:
Presentation Skills This presentation provided you with strategies to implement into your practice
Presentation Free of Bias
○1 ○2 ○3 ○4 ○ 5 Poor → → → → Excellent
○1 ○2 ○3 ○4 ○ 5 Poor → → → → Excellent
○1 ○2 ○3 ○4 ○ 5 Poor → → → → Excellent
○1 ○2 ○3 ○4 ○ 5 Poor → → → → Excellent
○Yes ○No
○1 ○2 ○3 ○4 ○ 5 Poor → → → → Excellent

FOR NOTE TAKING ONLY. EVALUATION MUST BE COMPLETED THROUGH THE ONLINE EVALUATION SYSTEM TO PROCESS YOUR CME/CE CREDITS
46
Evaluate each session on the criteria below. Name of Session: Speaker: 1 = Poor 2 = Fair 3 = Satisfactory 4 = Good 5 = Excellent
What strategies will you implement into your practice? Degree to which learning objectives were achieved.
Name of Session: Speaker: 1 = Poor 2 = Fair 3 = Satisfactory 4 = Good 5 = Excellent
What strategies will you implement into your practice? Degree to which learning objectives were achieved.
Name of Session: Speaker: 1 = Poor 2 = Fair 3 = Satisfactory 4 = Good 5 = Excellent
What strategies will you implement into your practice? Degree to which learning objectives were achieved.
Knowledge of Topic Relevance of content to stated objective:
Presentation Skills This presentation provided you with strategies to implement into your practice
Presentation Free of Bias
○1 ○2 ○3 ○4 ○ 5 Poor → → → → Excellent
○1 ○2 ○3 ○4 ○ 5 Poor → → → → Excellent
○1 ○2 ○3 ○4 ○ 5 Poor → → → → Excellent
○1 ○2 ○3 ○4 ○ 5 Poor → → → → Excellent
○Yes ○No
○1 ○2 ○3 ○4 ○ 5 Poor → → → → Excellent

FOR NOTE TAKING ONLY. EVALUATION MUST BE COMPLETED THROUGH THE ONLINE EVALUATION SYSTEM TO PROCESS YOUR CME/CE CREDITS
47
Evaluate each session on the criteria below. Name of Session: Speaker: 1 = Poor 2 = Fair 3 = Satisfactory 4 = Good 5 = Excellent
What strategies will you implement into your practice? Degree to which learning objectives were achieved.
Name of Session: Speaker: 1 = Poor 2 = Fair 3 = Satisfactory 4 = Good 5 = Excellent
What strategies will you implement into your practice? Degree to which learning objectives were achieved.
Name of Session: Speaker: 1 = Poor 2 = Fair 3 = Satisfactory 4 = Good 5 = Excellent
What strategies will you implement into your practice? Degree to which learning objectives were achieved.
Knowledge of Topic Relevance of content to stated objective:
Presentation Skills This presentation provided you with strategies to implement into your practice
Presentation Free of Bias
○1 ○2 ○3 ○4 ○ 5 Poor → → → → Excellent
○1 ○2 ○3 ○4 ○ 5 Poor → → → → Excellent
○1 ○2 ○3 ○4 ○ 5 Poor → → → → Excellent
○1 ○2 ○3 ○4 ○ 5 Poor → → → → Excellent
○Yes ○No
○1 ○2 ○3 ○4 ○ 5 Poor → → → → Excellent
Knowledge of Topic Relevance of content to stated objective:
Presentation Skills This presentation provided you with strategies to implement into your practice
Presentation Free of Bias
○1 ○2 ○3 ○4 ○ 5 Poor → → → → Excellent
○1 ○2 ○3 ○4 ○ 5 Poor → → → → Excellent
○1 ○2 ○3 ○4 ○ 5 Poor → → → → Excellent
○1 ○2 ○3 ○4 ○ 5 Poor → → → → Excellent
○Yes ○No
○1 ○2 ○3 ○4 ○ 5 Poor → → → → Excellent
Knowledge of Topic Relevance of content to stated objective:
Presentation Skills This presentation provided you with strategies to implement into your practice
Presentation Free of Bias
○1 ○2 ○3 ○4 ○ 5 Poor → → → → Excellent
○1 ○2 ○3 ○4 ○ 5 Poor → → → → Excellent
○1 ○2 ○3 ○4 ○ 5 Poor → → → → Excellent
○1 ○2 ○3 ○4 ○ 5 Poor → → → → Excellent
○Yes ○No
○1 ○2 ○3 ○4 ○ 5 Poor → → → → Excellent
FOR NOTE TAKING ONLY. EVALUATION MUST BE COMPLETED THROUGH THE ONLINE EVALUATION SYSTEM TO PROCESS YOUR CME/CE CREDITS
48
Evaluate each session on the criteria below. Name of Session: Speaker: 1 = Poor 2 = Fair 3 = Satisfactory 4 = Good 5 = Excellent
What strategies will you implement into your practice? Degree to which learning objectives were achieved.
Name of Session: Speaker: 1 = Poor 2 = Fair 3 = Satisfactory 4 = Good 5 = Excellent
What strategies will you implement into your practice? Degree to which learning objectives were achieved.
Name of Session: Speaker: 1 = Poor 2 = Fair 3 = Satisfactory 4 = Good 5 = Excellent
What strategies will you implement into your practice? Degree to which learning objectives were achieved.
Knowledge of Topic Relevance of content to stated objective:
Presentation Skills This presentation provided you with strategies to implement into your practice
Presentation Free of Bias
○1 ○2 ○3 ○4 ○ 5 Poor → → → → Excellent
○1 ○2 ○3 ○4 ○ 5 Poor → → → → Excellent
○1 ○2 ○3 ○4 ○ 5 Poor → → → → Excellent
○1 ○2 ○3 ○4 ○ 5 Poor → → → → Excellent
○Yes ○No
○1 ○2 ○3 ○4 ○ 5 Poor → → → → Excellent
Knowledge of Topic Relevance of content to stated objective:
Presentation Skills This presentation provided you with strategies to implement into your practice
Presentation Free of Bias
○1 ○2 ○3 ○4 ○ 5 Poor → → → → Excellent
○1 ○2 ○3 ○4 ○ 5 Poor → → → → Excellent
○1 ○2 ○3 ○4 ○ 5 Poor → → → → Excellent
○1 ○2 ○3 ○4 ○ 5 Poor → → → → Excellent
○Yes ○No
○1 ○2 ○3 ○4 ○ 5 Poor → → → → Excellent
Knowledge of Topic Relevance of content to stated objective:
Presentation Skills This presentation provided you with strategies to implement into your practice
Presentation Free of Bias
○1 ○2 ○3 ○4 ○ 5 Poor → → → → Excellent
○1 ○2 ○3 ○4 ○ 5 Poor → → → → Excellent
○1 ○2 ○3 ○4 ○ 5 Poor → → → → Excellent
○1 ○2 ○3 ○4 ○ 5 Poor → → → → Excellent
○Yes ○No
○1 ○2 ○3 ○4 ○ 5 Poor → → → → Excellent

FOR NOTE TAKING ONLY. EVALUATION MUST BE COMPLETED THROUGH THE ONLINE EVALUATION SYSTEM TO PROCESS YOUR CME/CE CREDITS
49
Friday, March 13, 2009 Evaluate each session on the criteria below. Name of Session: Speaker: 1 = Poor 2 = Fair 3 = Satisfactory 4 = Good 5 = Excellent
What strategies will you implement into your practice? Degree to which learning objectives were achieved.
Name of Session: Speaker: 1 = Poor 2 = Fair 3 = Satisfactory 4 = Good 5 = Excellent
What strategies will you implement into your practice? Degree to which learning objectives were achieved.
Name of Session: Speaker: 1 = Poor 2 = Fair 3 = Satisfactory 4 = Good 5 = Excellent
What strategies will you implement into your practice? Degree to which learning objectives were achieved.
Knowledge of Topic Relevance of content to stated objective:
Presentation Skills This presentation provided you with strategies to implement into your practice
Presentation Free of Bias
○1 ○2 ○3 ○4 ○ 5 Poor → → → → Excellent
○1 ○2 ○3 ○4 ○ 5 Poor → → → → Excellent
○1 ○2 ○3 ○4 ○ 5 Poor → → → → Excellent
○1 ○2 ○3 ○4 ○ 5 Poor → → → → Excellent
○Yes ○No
○1 ○2 ○3 ○4 ○ 5 Poor → → → → Excellent

FOR NOTE TAKING ONLY. EVALUATION MUST BE COMPLETED THROUGH THE ONLINE EVALUATION SYSTEM TO PROCESS YOUR CME/CE CREDITS
50
Evaluate each session on the criteria below. Name of Session: Speaker: 1 = Poor 2 = Fair 3 = Satisfactory 4 = Good 5 = Excellent
What strategies will you implement into your practice? Degree to which learning objectives were achieved.
Name of Session: Speaker: 1 = Poor 2 = Fair 3 = Satisfactory 4 = Good 5 = Excellent
What strategies will you implement into your practice? Degree to which learning objectives were achieved.
Name of Session: Speaker: 1 = Poor 2 = Fair 3 = Satisfactory 4 = Good 5 = Excellent
What strategies will you implement into your practice? Degree to which learning objectives were achieved.
Knowledge of Topic Relevance of content to stated objective:
Presentation Skills This presentation provided you with strategies to implement into your practice
Presentation Free of Bias
○1 ○2 ○3 ○4 ○ 5 Poor → → → → Excellent
○1 ○2 ○3 ○4 ○ 5 Poor → → → → Excellent
○1 ○2 ○3 ○4 ○ 5 Poor → → → → Excellent
○1 ○2 ○3 ○4 ○ 5 Poor → → → → Excellent
○Yes ○No
○1 ○2 ○3 ○4 ○ 5 Poor → → → → Excellent
Knowledge of Topic Relevance of content to stated objective:
Presentation Skills This presentation provided you with strategies to implement into your practice
Presentation Free of Bias
○1 ○2 ○3 ○4 ○ 5 Poor → → → → Excellent
○1 ○2 ○3 ○4 ○ 5 Poor → → → → Excellent
○1 ○2 ○3 ○4 ○ 5 Poor → → → → Excellent
○1 ○2 ○3 ○4 ○ 5 Poor → → → → Excellent
○Yes ○No
○1 ○2 ○3 ○4 ○ 5 Poor → → → → Excellent
Knowledge of Topic Relevance of content to stated objective:
Presentation Skills This presentation provided you with strategies to implement into your practice
Presentation Free of Bias
○1 ○2 ○3 ○4 ○ 5 Poor → → → → Excellent
○1 ○2 ○3 ○4 ○ 5 Poor → → → → Excellent
○1 ○2 ○3 ○4 ○ 5 Poor → → → → Excellent
○1 ○2 ○3 ○4 ○ 5 Poor → → → → Excellent
○Yes ○No
○1 ○2 ○3 ○4 ○ 5 Poor → → → → Excellent

FOR NOTE TAKING ONLY. EVALUATION MUST BE COMPLETED THROUGH THE ONLINE EVALUATION SYSTEM TO PROCESS YOUR CME/CE CREDITS
51
Evaluate each session on the criteria below. Name of Session: Speaker: 1 = Poor 2 = Fair 3 = Satisfactory 4 = Good 5 = Excellent
What strategies will you implement into your practice? Degree to which learning objectives were achieved.
Name of Session: Speaker: 1 = Poor 2 = Fair 3 = Satisfactory 4 = Good 5 = Excellent
What strategies will you implement into your practice? Degree to which learning objectives were achieved.
Name of Session: Speaker: 1 = Poor 2 = Fair 3 = Satisfactory 4 = Good 5 = Excellent
What strategies will you implement into your practice? Degree to which learning objectives were achieved.
Knowledge of Topic Relevance of content to stated objective:
Presentation Skills This presentation provided you with strategies to implement into your practice
Presentation Free of Bias
○1 ○2 ○3 ○4 ○ 5 Poor → → → → Excellent
○1 ○2 ○3 ○4 ○ 5 Poor → → → → Excellent
○1 ○2 ○3 ○4 ○ 5 Poor → → → → Excellent
○1 ○2 ○3 ○4 ○ 5 Poor → → → → Excellent
○Yes ○No
○1 ○2 ○3 ○4 ○ 5 Poor → → → → Excellent
Knowledge of Topic Relevance of content to stated objective:
Presentation Skills This presentation provided you with strategies to implement into your practice
Presentation Free of Bias
○1 ○2 ○3 ○4 ○ 5 Poor → → → → Excellent
○1 ○2 ○3 ○4 ○ 5 Poor → → → → Excellent
○1 ○2 ○3 ○4 ○ 5 Poor → → → → Excellent
○1 ○2 ○3 ○4 ○ 5 Poor → → → → Excellent
○Yes ○No
○1 ○2 ○3 ○4 ○ 5 Poor → → → → Excellent
Knowledge of Topic Relevance of content to stated objective:
Presentation Skills This presentation provided you with strategies to implement into your practice
Presentation Free of Bias
○1 ○2 ○3 ○4 ○ 5 Poor → → → → Excellent
○1 ○2 ○3 ○4 ○ 5 Poor → → → → Excellent
○1 ○2 ○3 ○4 ○ 5 Poor → → → → Excellent
○1 ○2 ○3 ○4 ○ 5 Poor → → → → Excellent
○Yes ○No
○1 ○2 ○3 ○4 ○ 5 Poor → → → → Excellent

FOR NOTE TAKING ONLY. EVALUATION MUST BE COMPLETED THROUGH THE ONLINE EVALUATION SYSTEM TO PROCESS YOUR CME/CE CREDITS
52
Evaluate each session on the criteria below. Name of Session: Speaker: 1 = Poor 2 = Fair 3 = Satisfactory 4 = Good 5 = Excellent
What strategies will you implement into your practice? Degree to which learning objectives were achieved.
Name of Session: Speaker: 1 = Poor 2 = Fair 3 = Satisfactory 4 = Good 5 = Excellent
What strategies will you implement into your practice? Degree to which learning objectives were achieved.
Name of Session: Speaker: 1 = Poor 2 = Fair 3 = Satisfactory 4 = Good 5 = Excellent
What strategies will you implement into your practice? Degree to which learning objectives were achieved.
Knowledge of Topic Relevance of content to stated objective:
Presentation Skills This presentation provided you with strategies to implement into your practice
Presentation Free of Bias
○1 ○2 ○3 ○4 ○ 5 Poor → → → → Excellent
○1 ○2 ○3 ○4 ○ 5 Poor → → → → Excellent
○1 ○2 ○3 ○4 ○ 5 Poor → → → → Excellent
○1 ○2 ○3 ○4 ○ 5 Poor → → → → Excellent
○Yes ○No
○1 ○2 ○3 ○4 ○ 5 Poor → → → → Excellent
Knowledge of Topic Relevance of content to stated objective:
Presentation Skills This presentation provided you with strategies to implement into your practice
Presentation Free of Bias
○1 ○2 ○3 ○4 ○ 5 Poor → → → → Excellent
○1 ○2 ○3 ○4 ○ 5 Poor → → → → Excellent
○1 ○2 ○3 ○4 ○ 5 Poor → → → → Excellent
○1 ○2 ○3 ○4 ○ 5 Poor → → → → Excellent
○Yes ○No
○1 ○2 ○3 ○4 ○ 5 Poor → → → → Excellent
Knowledge of Topic Relevance of content to stated objective:
Presentation Skills This presentation provided you with strategies to implement into your practice
Presentation Free of Bias
○1 ○2 ○3 ○4 ○ 5 Poor → → → → Excellent
○1 ○2 ○3 ○4 ○ 5 Poor → → → → Excellent
○1 ○2 ○3 ○4 ○ 5 Poor → → → → Excellent
○1 ○2 ○3 ○4 ○ 5 Poor → → → → Excellent
○Yes ○No
○1 ○2 ○3 ○4 ○ 5 Poor → → → → Excellent

FOR NOTE TAKING ONLY. EVALUATION MUST BE COMPLETED THROUGH THE ONLINE EVALUATION SYSTEM TO PROCESS YOUR CME/CE CREDITS
53
Evaluate each session on the criteria below. Name of Session: Speaker: 1 = Poor 2 = Fair 3 = Satisfactory 4 = Good 5 = Excellent
What strategies will you implement into your practice? Degree to which learning objectives were achieved.
Name of Session: Speaker: 1 = Poor 2 = Fair 3 = Satisfactory 4 = Good 5 = Excellent
What strategies will you implement into your practice? Degree to which learning objectives were achieved.
Name of Session: Speaker: 1 = Poor 2 = Fair 3 = Satisfactory 4 = Good 5 = Excellent
What strategies will you implement into your practice? Degree to which learning objectives were achieved.
Knowledge of Topic Relevance of content to stated objective:
Presentation Skills This presentation provided you with strategies to implement into your practice
Presentation Free of Bias
○1 ○2 ○3 ○4 ○ 5 Poor → → → → Excellent
○1 ○2 ○3 ○4 ○ 5 Poor → → → → Excellent
○1 ○2 ○3 ○4 ○ 5 Poor → → → → Excellent
○1 ○2 ○3 ○4 ○ 5 Poor → → → → Excellent
○Yes ○No
○1 ○2 ○3 ○4 ○ 5 Poor → → → → Excellent
Knowledge of Topic Relevance of content to stated objective:
Presentation Skills This presentation provided you with strategies to implement into your practice
Presentation Free of Bias
○1 ○2 ○3 ○4 ○ 5 Poor → → → → Excellent
○1 ○2 ○3 ○4 ○ 5 Poor → → → → Excellent
○1 ○2 ○3 ○4 ○ 5 Poor → → → → Excellent
○1 ○2 ○3 ○4 ○ 5 Poor → → → → Excellent
○Yes ○No
○1 ○2 ○3 ○4 ○ 5 Poor → → → → Excellent
Knowledge of Topic Relevance of content to stated objective:
Presentation Skills This presentation provided you with strategies to implement into your practice
Presentation Free of Bias
○1 ○2 ○3 ○4 ○ 5 Poor → → → → Excellent
○1 ○2 ○3 ○4 ○ 5 Poor → → → → Excellent
○1 ○2 ○3 ○4 ○ 5 Poor → → → → Excellent
○1 ○2 ○3 ○4 ○ 5 Poor → → → → Excellent
○Yes ○No
○1 ○2 ○3 ○4 ○ 5 Poor → → → → Excellent

FOR NOTE TAKING ONLY. EVALUATION MUST BE COMPLETED THROUGH THE ONLINE EVALUATION SYSTEM TO PROCESS YOUR CME/CE CREDITS
54
Saturday, March 14, 2008 Evaluate each session on the criteria below. Name of Session: Speaker: 1 = Poor 2 = Fair 3 = Satisfactory 4 = Good 5 = Excellent
What strategies will you implement into your practice? Degree to which learning objectives were achieved.
Name of Session: Speaker: 1 = Poor 2 = Fair 3 = Satisfactory 4 = Good 5 = Excellent
What strategies will you implement into your practice? Degree to which learning objectives were achieved.
Name of Session: Speaker: 1 = Poor 2 = Fair 3 = Satisfactory 4 = Good 5 = Excellent
What strategies will you implement into your practice? Degree to which learning objectives were achieved.
Knowledge of Topic Relevance of content to stated objective:
Presentation Skills This presentation provided you with strategies to implement into your practice
Presentation Free of Bias
○1 ○2 ○3 ○4 ○ 5 Poor → → → → Excellent
○1 ○2 ○3 ○4 ○ 5 Poor → → → → Excellent
○1 ○2 ○3 ○4 ○ 5 Poor → → → → Excellent
○1 ○2 ○3 ○4 ○ 5 Poor → → → → Excellent
○Yes ○No
○1 ○2 ○3 ○4 ○ 5 Poor → → → → Excellent

FOR NOTE TAKING ONLY. EVALUATION MUST BE COMPLETED THROUGH THE ONLINE EVALUATION SYSTEM TO PROCESS YOUR CME/CE CREDITS
55
Evaluate each session on the criteria below. Name of Session: Speaker: 1 = Poor 2 = Fair 3 = Satisfactory 4 = Good 5 = Excellent
What strategies will you implement into your practice? Degree to which learning objectives were achieved.
Name of Session: Speaker: 1 = Poor 2 = Fair 3 = Satisfactory 4 = Good 5 = Excellent
What strategies will you implement into your practice? Degree to which learning objectives were achieved.
Name of Session: Speaker: 1 = Poor 2 = Fair 3 = Satisfactory 4 = Good 5 = Excellent
What strategies will you implement into your practice? Degree to which learning objectives were achieved.
Knowledge of Topic Relevance of content to stated objective:
Presentation Skills This presentation provided you with strategies to implement into your practice
Presentation Free of Bias
○1 ○2 ○3 ○4 ○ 5 Poor → → → → Excellent
○1 ○2 ○3 ○4 ○ 5 Poor → → → → Excellent
○1 ○2 ○3 ○4 ○ 5 Poor → → → → Excellent
○1 ○2 ○3 ○4 ○ 5 Poor → → → → Excellent
○Yes ○No
○1 ○2 ○3 ○4 ○ 5 Poor → → → → Excellent
Knowledge of Topic Relevance of content to stated objective:
Presentation Skills This presentation provided you with strategies to implement into your practice
Presentation Free of Bias
○1 ○2 ○3 ○4 ○ 5 Poor → → → → Excellent
○1 ○2 ○3 ○4 ○ 5 Poor → → → → Excellent
○1 ○2 ○3 ○4 ○ 5 Poor → → → → Excellent
○1 ○2 ○3 ○4 ○ 5 Poor → → → → Excellent
○Yes ○No
○1 ○2 ○3 ○4 ○ 5 Poor → → → → Excellent
Knowledge of Topic Relevance of content to stated objective:
Presentation Skills This presentation provided you with strategies to implement into your practice
Presentation Free of Bias
○1 ○2 ○3 ○4 ○ 5 Poor → → → → Excellent
○1 ○2 ○3 ○4 ○ 5 Poor → → → → Excellent
○1 ○2 ○3 ○4 ○ 5 Poor → → → → Excellent
○1 ○2 ○3 ○4 ○ 5 Poor → → → → Excellent
○Yes ○No
○1 ○2 ○3 ○4 ○ 5 Poor → → → → Excellent

FOR NOTE TAKING ONLY. EVALUATION MUST BE COMPLETED THROUGH THE ONLINE EVALUATION SYSTEM TO PROCESS YOUR CME/CE CREDITS
56
Evaluate each session on the criteria below. Name of Session: Speaker: 1 = Poor 2 = Fair 3 = Satisfactory 4 = Good 5 = Excellent
What strategies will you implement into your practice? Degree to which learning objectives were achieved.
Name of Session: Speaker: 1 = Poor 2 = Fair 3 = Satisfactory 4 = Good 5 = Excellent
What strategies will you implement into your practice? Degree to which learning objectives were achieved.
Name of Session: Speaker: 1 = Poor 2 = Fair 3 = Satisfactory 4 = Good 5 = Excellent
What strategies will you implement into your practice? Degree to which learning objectives were achieved.
Knowledge of Topic Relevance of content to stated objective:
Presentation Skills This presentation provided you with strategies to implement into your practice
Presentation Free of Bias
○1 ○2 ○3 ○4 ○ 5 Poor → → → → Excellent
○1 ○2 ○3 ○4 ○ 5 Poor → → → → Excellent
○1 ○2 ○3 ○4 ○ 5 Poor → → → → Excellent
○1 ○2 ○3 ○4 ○ 5 Poor → → → → Excellent
○Yes ○No
○1 ○2 ○3 ○4 ○ 5 Poor → → → → Excellent
Knowledge of Topic Relevance of content to stated objective:
Presentation Skills This presentation provided you with strategies to implement into your practice
Presentation Free of Bias
○1 ○2 ○3 ○4 ○ 5 Poor → → → → Excellent
○1 ○2 ○3 ○4 ○ 5 Poor → → → → Excellent
○1 ○2 ○3 ○4 ○ 5 Poor → → → → Excellent
○1 ○2 ○3 ○4 ○ 5 Poor → → → → Excellent
○Yes ○No
○1 ○2 ○3 ○4 ○ 5 Poor → → → → Excellent
Knowledge of Topic Relevance of content to stated objective:
Presentation Skills This presentation provided you with strategies to implement into your practice
Presentation Free of Bias
○1 ○2 ○3 ○4 ○ 5 Poor → → → → Excellent
○1 ○2 ○3 ○4 ○ 5 Poor → → → → Excellent
○1 ○2 ○3 ○4 ○ 5 Poor → → → → Excellent
○1 ○2 ○3 ○4 ○ 5 Poor → → → → Excellent
○Yes ○No
○1 ○2 ○3 ○4 ○ 5 Poor → → → → Excellent

FOR NOTE TAKING ONLY. EVALUATION MUST BE COMPLETED THROUGH THE ONLINE EVALUATION SYSTEM TO PROCESS YOUR CME/CE CREDITS
57
Overall Program Assessment
State a practice change you are committed to make based on this activity.
May we contact you in approximately three months to determine if you were able to implement change in your practice as a result of this activity?
Have you ever attended an ISCD Annual Meeting? Yes/No
If no, why (select all that apply)? □ Location of program □ Date of program □ Cost of program □ Cost of hotel or board □ Cost of transportation □ Lack of time □ Lack of timely notification □ Program content not applicable to your work or practice □ Competition from other society meetings or educational opportunities □ Other, please specify:
Do you plan on attending the 2010 ISCD Annual Meeting in San Antonio, TX USA (March 10-13, 2010)? Yes/No
If no, why (select all that apply)? □ Location of program □ Date of program □ Cost of program □ Cost of hotel or board □ Cost of transportation □ Lack of time □ Lack of timely notification □ Program content not applicable to job or practice □ Competition from other society meetings or educational opportunities □ Other, please specify:
How many years of experience do you have in the field of bone densitometry?
1 year or less 2-5 years 5-10 years 10 or more years
In what type of community do you practice?
Urban Suburban Rural Other (please specify) __________________
In what setting do you practice? □ Physician’s Office □ Facility or Hospital Outpatient Department □ Independent Diagnostic Testing Facility
In what type of group do you practice? □ Single specialty group □ Multispecialty group □ Medical School Faculty Practice Plan

FOR NOTE TAKING ONLY. EVALUATION MUST BE COMPLETED THROUGH THE ONLINE EVALUATION SYSTEM TO PROCESS YOUR CME/CE CREDITS
58
Which of the following best describes your predominant professional activity? Check only one. □ Physician - Non-facility/Office-based □ Physician - Facility/Hospital-based □ Technologist □ Nurse Practitioner, Physicians Assistant □ RN □ Pharmacist □ Scientist □ Corporate □ Retired □ Researcher □ Industry □ Resident/Fellow
Which of the following best describes your predominant professional Specialty? Check only one. □ Adolescent Medicine □ Endocrinology □ Family Practice □ Geriatrics □ Internal Medicine □ Nephrology □ Nuclear Medicine □ OB/GYN □ Orthopedic Surgery □ Orthopedics □ Pediatrics □ Preventive Medicine □ Radiology □ Rheumatology □ Women's Health □ Other (Please specify) _________________
Of the following, where do you predominately practice? Check only one. □ United States □ Asia/Pacific □ Latin America □ Europe/Middle East □ Canada
Is ISCD your primary professional organization? Yes/No
Please identify other organizations of which you are a member (select all that apply): □ American Academy of Family Physicians □ American Association of Clinical Endocrinology □ American Association of Orthopedic Surgeons □ American College of Obstetrics and Gynecology □ American College of Radiology □ American College of Rheumatology □ American College of Physicians □ American Geriatrics Society □ American Medical Association □ American Orthopaedic Association □ American Society of Radiation Technologists □ American Society of Bone and Mineral Research □ Clinical Orthopedic Society

FOR NOTE TAKING ONLY. EVALUATION MUST BE COMPLETED THROUGH THE ONLINE EVALUATION SYSTEM TO PROCESS YOUR CME/CE CREDITS
59
□ International Bone and Mineral Society □ International Osteoporosis Foundation □ International Skeletal Society □ International Society of Internal Medicine □ National Osteoporosis Foundation □ Radiological Society of North America □ The Endocrine Society □ Other (please specify)
How did you hear about this program? Check as many as apply. □ Colleague □ Mailing □ Industry Representative □ ISCD Web site □ SCAN Newsletter □ Journal of Clinical Densitometry (JCD) □ Other scientific journal □ ISCD Postcard □ E-mail/Fax □ ASRT Newsletter □ Radiology Today □ Other (please specify)
How do you prefer to receive information regarding educational events? Check as many as apply. □ Postcard – through postal service □ e-mail □ Fax □ ISCD Website □ Related society website □ Communication from professional organization □ Scientific journal □ Scientific meeting □ Other (please specify)
Degree to which you agree that the stated learning objectives were achieved:
Recognize the advantages and limitations of the FRAX model to develop an effective management strategy for your patients with low bone mass. ○1 ○2 ○3 ○4 ○ 5 Poor → Excellent Apply the recommendations of the ISCD official positions and expert panelists to provide optimum evaluation and treatment of skeletal diseases for adult and pediatric patients. ○1 ○2 ○3 ○4 ○ 5 Poor → Excellent For your adult patients with fragility fracture, evaluate for skeletal disease and interventions for fracture risk reduction to reduce likelihood of subsequent fracture. ○1 ○2 ○3 ○4 ○ 5 Poor → Excellent Recognize the scope and impact of poor quality bone densitometry on patient care and how to implement recommended standards to reduce acquisition, interpretation and subsequent clinical errors. ○1 ○2 ○3 ○4 ○ 5 Poor → Excellent
FOR NOTE TAKING ONLY. EVALUATION MUST BE COMPLETED THROUGH THE ONLINE EVALUATION SYSTEM TO PROCESS YOUR CME/CE CREDITS
60
Please evaluate the following. Poor Fair Average Good Excellent Overall quality of meeting ○1 ○2 ○3 ○4 ○5 Degree attendance was worth time, effort and expense ○1 ○2 ○3 ○4 ○5 Registration Process ○1 ○2 ○3 ○4 ○5 Printed Materials ○1 ○2 ○3 ○4 ○5 Location ○1 ○2 ○3 ○4 ○5 To what degree do you agree with this statement: Strongly Disagree Disagree Agree Strongly Agree I will apply the knowledge/skills I learned (1) (2) (3) (4) This educational activity provided you with knowledge or skills to implement into your practice (1) (2) (3) (4)
The program content was: ( ) Just right ( ) Too advanced ( ) Too basic
The most valuable features of this meeting were:
The least valuable features of this meeting were:
How interested are you in having the following educational topics addressed at a future ISCD meeting? Rate each with one with: 1 = Not Interested 5 = Very Interested Pediatric Bone Health ○1 ○2 ○3 ○4 ○5 Vertebral Fracture Assessment ○1 ○2 ○3 ○4 ○5 Assessment of bone macro/microarchitecture ○1 ○2 ○3 ○4 ○5 Peripheral DXA ○1 ○2 ○3 ○4 ○5 Practice Management ○1 ○2 ○3 ○4 ○5 Premenopausal Women ○1 ○2 ○3 ○4 ○5 Osteoporosis in Men ○1 ○2 ○3 ○4 ○5 Other (QCT, Ultrasound) ○1 ○2 ○3 ○4 ○5 New and Emerging Treatments ○1 ○2 ○3 ○4 ○5 Combination Therapy ○1 ○2 ○3 ○4 ○5
FOR NOTE TAKING ONLY. EVALUATION MUST BE COMPLETED THROUGH THE ONLINE EVALUATION SYSTEM TO PROCESS YOUR CME/CE CREDITS
61
Legal/ Ethical issues ○1 ○2 ○3 ○4 ○5 Time Management ○1 ○2 ○3 ○4 ○5 Data Interpretation ○1 ○2 ○3 ○4 ○5 Osteoporosis and Cancer ○1 ○2 ○3 ○4 ○5 Medication Effects on Bone ○1 ○2 ○3 ○4 ○5 Other Metabolic Bone Diseases ○1 ○2 ○3 ○4 ○5 Epidemiology/Pathogenesis of Osteoporosis ○1 ○2 ○3 ○4 ○5 Bone Physiology and Pathology ○1 ○2 ○3 ○4 ○5 Non-osteoporosis Bone diseases ○1 ○2 ○3 ○4 ○5 Conditions of Increased Bone Density ○1 ○2 ○3 ○4 ○5 Osteoporosis/Bone Health in Special Populations ○1 ○2 ○3 ○4 ○5 Other Topics of Interest_____________________________________
Please identify three speakers that you would find interesting and professionally relevant for ISCD meetings.
How important is each of the Annual Meeting educational components listed to the overall experience? Breakouts was removed from this section General Sessions ○1 ○2 ○3 ○4 ○ 5 Not Important → Very Important Workshops ○1 ○2 ○3 ○4 ○ 5 Not Important → Very Important Meet the Professor sessions ○1 ○2 ○3 ○4 ○ 5 Not Important → Very Important Posters ○1 ○2 ○3 ○4 ○ 5 Not Important → Very Important Satellite Symposium ○1 ○2 ○3 ○4 ○ 5 Not Important → Very Important
The presentations were objective and free of bias? Yes/No If no, please indicate which session.
Disclosure of faculty relationships or affiliations with commercial organizations was made available before the presentation. Yes/No
Commercial supporters were acknowledged in the printed materials for the activity. Yes/No


International Osteoporosis Foundation9, rue Juste-Olivier
CH-1260 NyonSwitzerland
Phone +41 22 994 0100Fax +41 22 994 0101www.iofbonehealth.org
342 North Main Street | West Hartford, CT 06117-2507E-mail [email protected] | Phone 860.586.7563 | Fax 860.586.7550
www.ISCD.org