debating effective solution for water constrained future of pakistan dr. zaigham habib
DESCRIPTION
Debating Effective Solution for Water Constrained Future of Pakistan Dr. Zaigham Habib. Water Debate Pakistan in Global Context Natural Water Scenario Understanding Future Constraints Some of the Solutions. Need for a Debate - PowerPoint PPT PresentationTRANSCRIPT

Debating Effective Solution for Water Constrained Future of
Pakistan
Dr. Zaigham Habib

Water Debate
1.Pakistan in Global Context
2.Natural Water Scenario
3.Understanding Future Constraints
4.Some of the Solutions
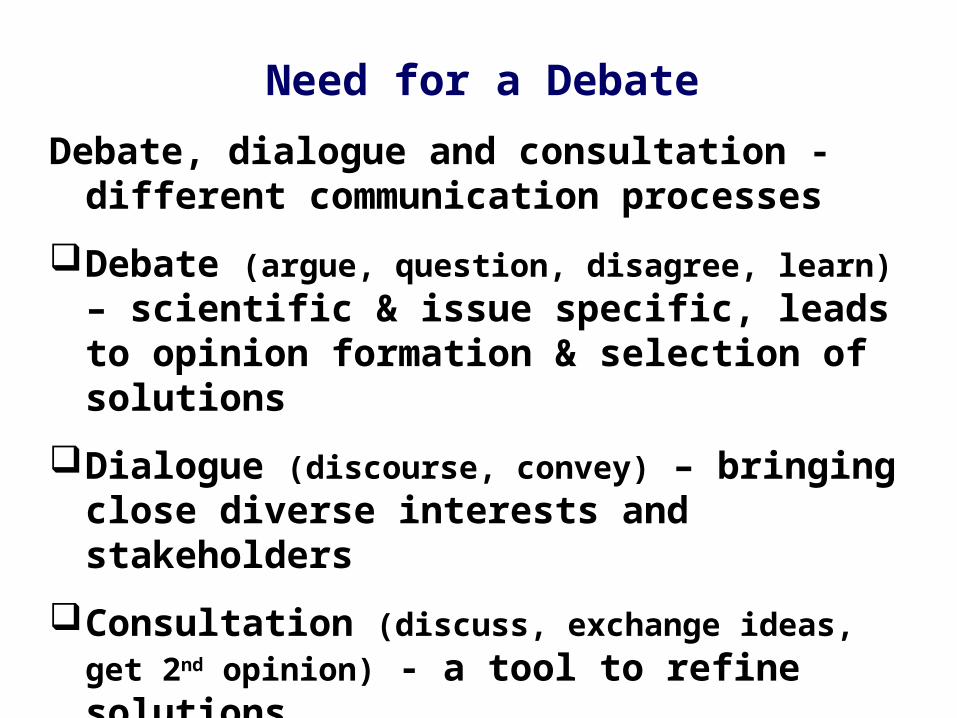
Need for a Debate
Debate, dialogue and consultation - different communication processes
Debate (argue, question, disagree, learn) – scientific & issue specific, leads to opinion formation & selection of solutions
Dialogue (discourse, convey) – bringing close diverse interests and stakeholders
Consultation (discuss, exchange ideas, get 2nd
opinion) - a tool to refine solutions

Lack of Debates in water Sector Argue, question, disagree formulate solutions and options
1.Diverse technical opinions are least discussed – leading to limited solutions and narrow perceptions
2.Scientific options not taken neutrally
3.Too much consumed by the fear of talking about “bad solutions/ options”
4.A dilemma of not accepting scientific diversity

Where is this 0.5 % of fresh water? 10^6 km3 stored in aquifers. 11.9 103 km3 net rainfall falling after accounting for evaporation.• 91*103 km3 in natural lakes• 5 103 km3 in man made storage -7 fold increase since 1950.• 2,120 km3 in rivers – constantly replaced from rainfall and melting snow and ice.
Fresh Water – Global Picture


Per Capita Gross Renewable water 2000
0
4000
8000
12000
16000
20000
Mal
dive
sS
inga
pore
Bah
rain
Isra
elO
man
Bur
undi
Ant
igua
and
Sou
th A
fric
aB
urki
na F
aso
Eth
iopi
aP
akis
tan
Cze
ch R
epub
licIn
dia
Chi
naG
erm
any
T
ogo
Nig
erU
nite
d K
ingd
omU
krai
neF
ranc
eIr
aqC
uba
Arm
enia
Aze
rbai
jan
Sud
anC
had
Phi
lippi
nes
Por
tuga
lS
witz
erla
ndB
otsw
ana
Kyr
gyz
Rep
ublic
Uni
ted
Sta
tes
ofIr
elan
dT
urkm
enis
tan
Hon
dura
sG
eorg
iaE
ston
iaG
uine
a-B
issa
uS
erbi
a an
dLa
tvia
Bru
nei
Sie
rra
Leon
eC
ambo
dia
Uru
guay
Pan
ama
Equ
ator
ial G
uine
aC
hile
Per
uC
anad
a
m3
/ p
ers
on
/ y
ea
r 2
00
0
Physical water scarcity --

Per Capita Withdrawal
0
500
1000
1500
2000
2500U
gand
aR
wan
daA
ngol
aM
ozam
biqu
eC
ape
Ver
deK
enya
Cam
eroo
nE
ritre
aM
alaw
iF
ijiLa
tvia
Hon
dura
sT
anza
nia
Jam
aica
Gua
tem
ala
Mon
golia
El S
alva
dor
Slo
vaki
aE
quat
oria
l Gui
nea
Nic
arag
uaP
anam
aIr
elan
dS
wed
enIs
rael
Bra
zil
Phi
lippi
nes
Qat
arLe
bano
nM
oroc
coC
hina
Laos
New
Zea
land
Tur
key
Fra
nce
Indi
aM
yanm
arB
elgi
umC
uba
Arg
entin
aG
reec
eG
eorg
iaB
ulga
riaLi
thua
nia
Sud
anP
akis
tan
Mac
edon
iaT
haila
ndU
nite
d S
tate
s of
Aze
rbai
jan
Kaz
akhs
tan
m3
/ pe
rso
n /y
ea
rA water based Economy ---

Fresh water withdrawals per hectare
0
5000
10000
15000
20000
25000
30000
m3
/ ha
/ ye
ar
Irrigation per Hectare close to World Average

Physical and economic water scarcity


Per capita
Eastern rivers
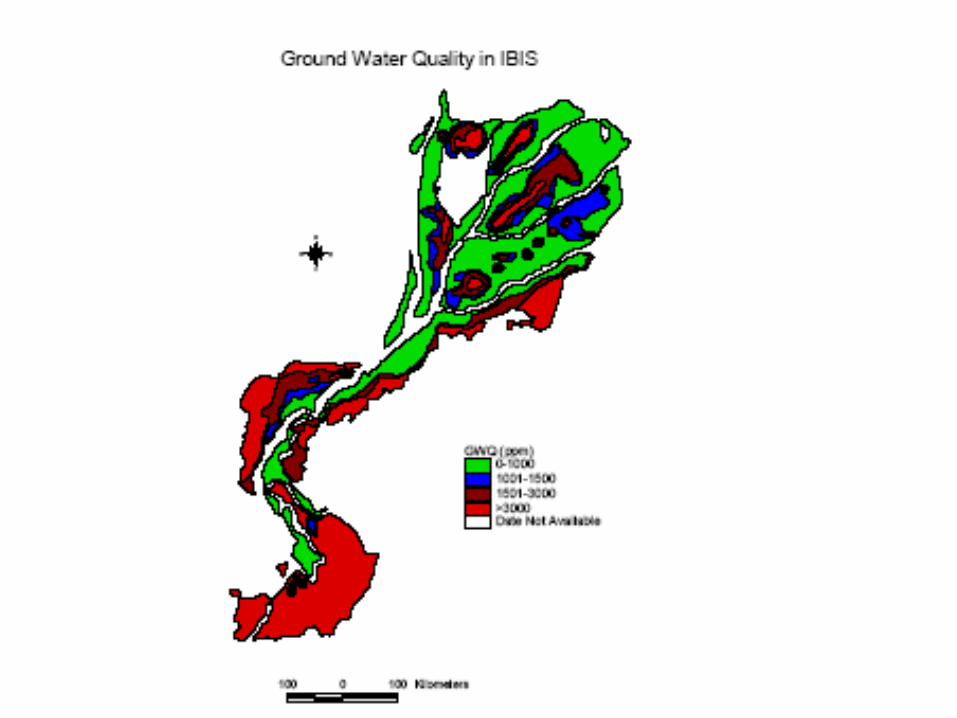
Groundwater catchments
Some FactsArea: 803,940 km2 Population: 160 millionClimate: Arid; variable rainfall, river inflows & groundwater quality


Gross Available Water
Rainfall = Avg. 45 MAF (30 to 90 MAF)
Rivers Inflow = 135 MAF (average 1978 – 2006)
Groundwater = 50 to 60 MAF

Monthly Inflow of high and low flow years Tarbella
0
7
14
21
AP
R
MA
Y
JUN
JUL
AU
G
SE
P
OC
T
NO
V
DE
C
JAN
FE
B
MA
R
Mo
nth
ly I
nfl
ow
(m
af) 1959-60
1974-751973-742001-02
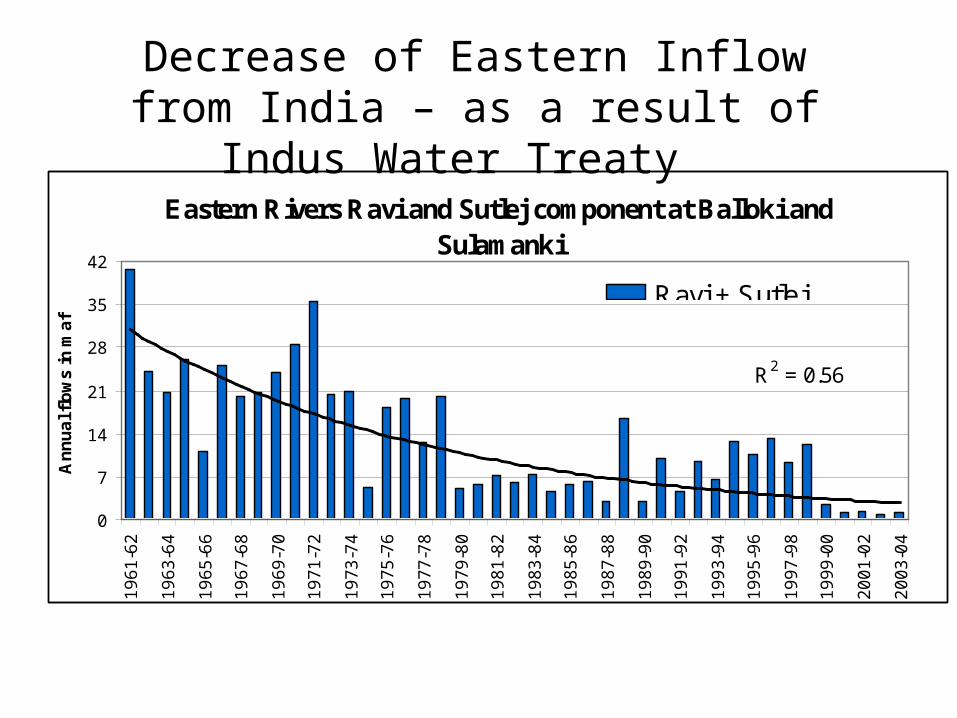
Eastern Rivers Ravi and Sutlej component at Balloki and Sulamanki
R2 = 0.56
0
7
14
21
28
35
42
19
61
-62
19
63
-64
19
65
-66
19
67
-68
19
69
-70
19
71
-72
19
73
-74
19
75
-76
19
77
-78
19
79
-80
19
81
-82
19
83
-84
19
85
-86
19
87
-88
19
89
-90
19
91
-92
19
93
-94
19
95
-96
19
97
-98
19
99
-00
20
01
-02
20
03
-04
An
nu
al f
low
s in
ma
f
Ravi + Sutlej
Expon. (Ravi +Sutlej)
Decrease of Eastern Inflow from India – as a result of Indus Water Treaty

Indus Rivers Annual Outflow versus Inflow 1976 - 2006
R2 = 0.86
R2 = 0.72
R2 = 0.94
0
10
20
30
40
50
60
70
80
90
100
90 100 110 120 130 140 150 160 170 180 190
Inflow in MAF
Ou
tflo
w b
elo
w k
otr
i - M
AF
1976-86
1986-96
1996-2006


Tubewell Growth in Pakistan Since 1950
0
200
400
600
800
1950
1960
1965
1970
1975
1980
1985
1990
1995
2000
2005
2007
Th
ousa
nd
s
No
of w
ells
Total reportedTubewells
Estimated Groundwater Extraction
0
30
60
1950
1960
1970
1980
1990
1998
2001
2004
Mill
ion
acr
e fe
et (
MA
F)

Changed Ecology along the Rivers
The riverine natural vegetation and non-irrigated agriculture is replaced by the well irrigation.
The flood based forest have severely damaged during recent drought years

Increased uses from rivers and decreased drainage inflow can cause local floods
Computed net Losses rivers and link canals as a function of Gross Inflow
R2 = 0.75
-50
-25
0
120 170 220 270 320 370Gross Annual Inflow (Riv er+rain)
Riv
er L
osse
s as
a f
unct
ion
of I
nflo
w +
rai
n
'selected y ears 1974 to 1997 Losses 1998-2000

Average Groundwater Levels Punjab
350
400
450
500
19
78
19
80
19
82
19
84
19
86
19
88
199
0
19
92
19
94
19
96
19
98
De
pth
to
wa
ter
tab
le (
cm
)
Average aquifer depth - pre monsoon
350
450
550
650
J-7
8
J-8
0
J-8
2
J-8
4
J-8
6
J-8
8
J-9
0
J-9
2
J-9
4
J-9
6
J-9
8
J-0
0
Fro
m t
he
gro
un
d in
cm
MAILSI
L-DEPALPUR
Groundwater Aquifer
Many issues
Actual potential
Limited monitoring grid
Sustainability of use patterns
High value for farmers
Control mechanism

Demand in 2025 crossing total availability

Water Constrained Future
1. Permanent Physical Scarcity - population
2. Most of the water has already been utilized
3. Natural water cushions depleting
4. Water based economy – high manpower, low productivity
5. Hydropower, a most efficient user dependent on surface storages
6. New water use sectors are emerging
7. Skewed spatio-temporal water availability and potential
8. Climate Changes

Towards Solutions

Meeting demands of Socio economic and environment sectors
Solution in hand - surface storage
• Good Scope for hydropower
• Limited water for agriculture from storage
• Domestic & infrastructure big claimers in future
• Environmental needs – an essential area to be considered

Expanding Management Approaches ConventionalLinear cause-effect solutions
Scope limited, problems deep-rooted Replicability assuming neutral Context(conservation & drainage technologies, farm practices, crops selection etc.) Complex drivers of change and management
Comprehensive adaptive Manage the Cause as well
Protect resource base and long term resilience Effective demand managementDiversification of water-intensive production

Protect Natural Water Cycle and Resource Base – in quantity
Trans-boundary waters - expanding strategy
Sacrosanct Indus Water Treaty cannot stop India from planning 11 projects on western rivers;
– Establish need of western flood water in Pakistan
– Let people talk about negative impacts of IWT on Pakistan side
Natural Water cycle must be maintained for resilience
Protect all water bodies; rivers, lakes and flood plains
Groundwater aquifer – artificial recharge in fresh zone
minimize/drain effluent in saline area


Quality Management and control
Many Grey Areas
Industrial and urban effluents to rivers and lakes – treat at source, reuse
waste water treatment – set examples
Drainage management – lessons learned?
Drainage functions of rivers and main canals
Groundwater quality – exact issue ?
Leaching of agri lands
Excess water used in saline areas

Productivity of water in AgricultureProductivity of water in Agriculture• Conservation - canal lining big initiative, 50% complete
• Field level water efficient technologies new initiative
• Value addition increasing trends
• Talking about “green to gene revolution”
Yet, • The yield of major crops stagnant
• Uncertainty for farmers has increased
• Public sector investments increasing and essential

Food security & Agriculture
National policy about produce, market and trade
Food security important because of declining production of wheat in USA & Australia,
Within Pakistan traditional grain areas are shifting towards oil seeds, vegetables, fruits & maize
A link between livelihood oriented small marginal farming and food grain production consistent
Potential of rain-fed and saline areas

wheat Rice Cotton sugarcane Maize
World 2.91 4.0 1.95 65.6 4.75
Punjab India 4.39 3.40 0.31 60.96 2.49
India average 2.67 3.0 0.8 69.95 1.9
China 4.23 6.27 3.38 66.01 5.1
Egypt 6.01 9.5 2.6 61.95 8.0
Pakistan 2.59 2 2.3 48.91 2.85
Average Crop Yields in Pakistan and other Countries tons/hectare 2005

GVP/CCA
0
100
200
300
400
500
U.C
.CM
-R-L
INK
C.B
.D.C
.D
PR U
PD
PR L
OW
L.C
.C E
ast
L.C
.C W
est
LCC
U.J
.CL.
J.C
Thal
L.B.
D.C
Hav
eli S
idhn
aiM
ails
iPa
kpat
anFo
rdw
ahEa
ster
n Sa
diqi
aQ
aim
Abba
sia
Baha
wal
Panj
nad
D.G
.Kha
nM
uzza
farg
arR
angp
ur
PAT
& D
eser
tBe
gari
Gho
tki
Nor
th W
est
Ric
e ca
nal
Dad
uKh
airp
ur W
est
Khai
rpur
Eas
tR
ohri
Nar
aKa
lriLi
ned
Can
alFu
liliPi
nyar
i
Pro
duct
ion
/ ha
(U
S$)
GVP /CCA

Canal Supplies in mm
0
200
400
600
800
1000
1200
1400
1600
1800
2000
U.C
.C
M-R
-LIN
K
C.B
.D.C
.
DP
R U
P
DP
R L
OW
L.C
.C
Eas
t
L.C
.C W
est
LCC
U.J
.C
L.J.
C
Tha
l
L.B
.D.C
Hav
eli S
idhn
ai
Mai
lsi
Pak
pata
n
For
dwah
Eas
tern
Sad
iqia
Qai
m
Abb
asia
Bah
awal
Pan
jnad
D.G
.Kha
n
Muz
zafa
rgar
Ran
gpur
PA
T &
Des
ert
Beg
ari
Gho
tki
Nor
th W
est
Ric
e ca
nal
Dad
u
Kha
irpur
Wes
t
Kha
irpur
Eas
t
Roh
ri
Nar
a
Kal
ri
Line
d C
anal
Ful
ili
Pin
yari
Wat
er d
epth
fo
r C
CA
(m
m)
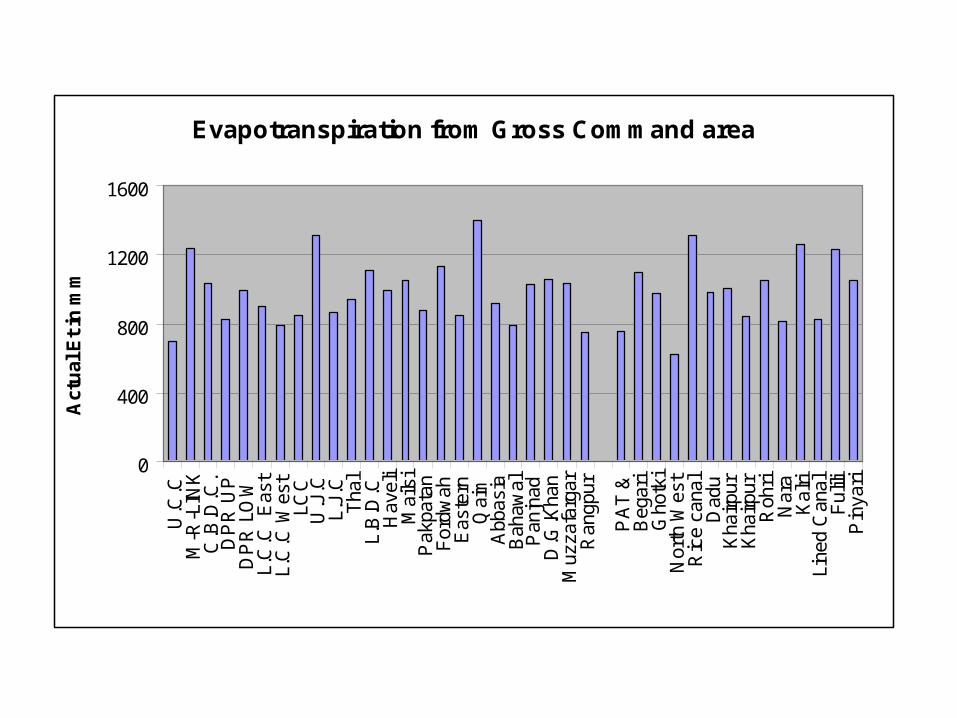
Evapotranspiration from Gross Command area
0
400
800
1200
1600U
.C.C
M-R
-LIN
KC
.B.D
.C.
DP
R U
PD
PR
LO
WL.
C.C
Eas
tL.
C.C
Wes
tLC
CU
.J.C
L.J.
CT
hal
L.B
.D.C
Hav
eli
Mai
lsi
Pak
pata
nF
ordw
ahE
aste
rnQ
aim
Abb
asia
Bah
awal
Pan
jnad
D.G
.Kha
nM
uzza
farg
arR
angp
ur
PA
T &
Beg
ari
Gho
tki
Nor
th W
est
Ric
e ca
nal
Dad
uK
hairp
urK
hairp
urR
ohri
Nar
aK
alri
Line
d C
anal
Ful
iliP
inya
ri
Act
ual
Et
in m
m

Gross Value of Production in Kharif
0
24000
48000
72000
Farm numbers
Average =11444 Rs/ha
Gross Value of Production- Rabi 1994-95
0
7000
14000
21000
1 34 67 100 133 166 199 232 265 298 331 364 397 430 463 496 529
Farm numbers
GV
P-
PA
K R
s/ha
Average = 6053 Rs/ha


Meeting Agriculture Targets
• Economically feasible agriculture model for small farms (inputs, technologies, markets)
• Protect high efficiency groundwater -recharge
• Crop zoning
• Low water use and salinity tolerant crops
• Livestock sub-sector
• New opportunities for rural labor force shifting from farming; agro-based industry, local business

Domestic, infrastructure supplies
A big future Challenge
Safe drinking water promised to all
Municipal supplies to big cities, semi-urban and advance rural areas
New infrastructure and down developments

Scenario Potable I: Only drinking water requirements
150
250
350
450
550
650
750
1990 2000 2010 2020 2030 2040 2050
mil
lio
n g
allo
ns
per
day
Potable-I Min.
Potable-I Max.
1.5 gallon/c/d
Urban = 2.5 gallon/cap/dayrural = 2.0

Sanitation scenarios based on minimum survival level and high water demand assumptions
0
2000
4000
6000
8000
10000
12000
14000
1990 2000 2010 2020 2030 2040 2050
Mil
lio
n g
allo
ns
per
day Sanitation min. requirements
Sanitation high requirement

Domestic requirements based on current municipal supply and urbanization trends
0
6
12
18
24
1998 2003 2008 2013 2018 2023 2028 2030 2040 2050
Gro
ss a
nn
ual
bcm
Rural BCM Urban BCMs

From where this water will come?
1.Main storages – needs for allocation, transfer from agriculture
From Existing canal system – some allocations in saline areas, more will be required for new projects
Local surface resources: small rivers, lakes – replacement or protection
Groundwater – largest access, quality and quantity threatened

Approach for domestic supply management
• Protect quality of all water resources
• Priority to local resources
• Allocate and account all uses
Demand side measures can not be postponed
• Capacity of household appliances
• Rain harvesting wherever possible
• Control on infrastructure, commercial uses
• Household waste management
• Pricing

Regional Context
NWFP: high allocations after seventies, natural drainage collapsing, pollution of water bodies, local water access.
Lower Indus: Saline, waterlogged, low rainfall, riverine cultivation not sustainable, shift towards perennial crops, livelihood dependence on wetlands, lakes & unallocated resources high, demand for delta
Punjab: water shortage in cash crop areas, cultivation extending outside canal irrigated area, groundwater depleting, recharge sources decreasing, rivers pollution and dry conditions.
Balochistan: groundwater fast depleting, local harvesting not reliable, domestic and sanitation
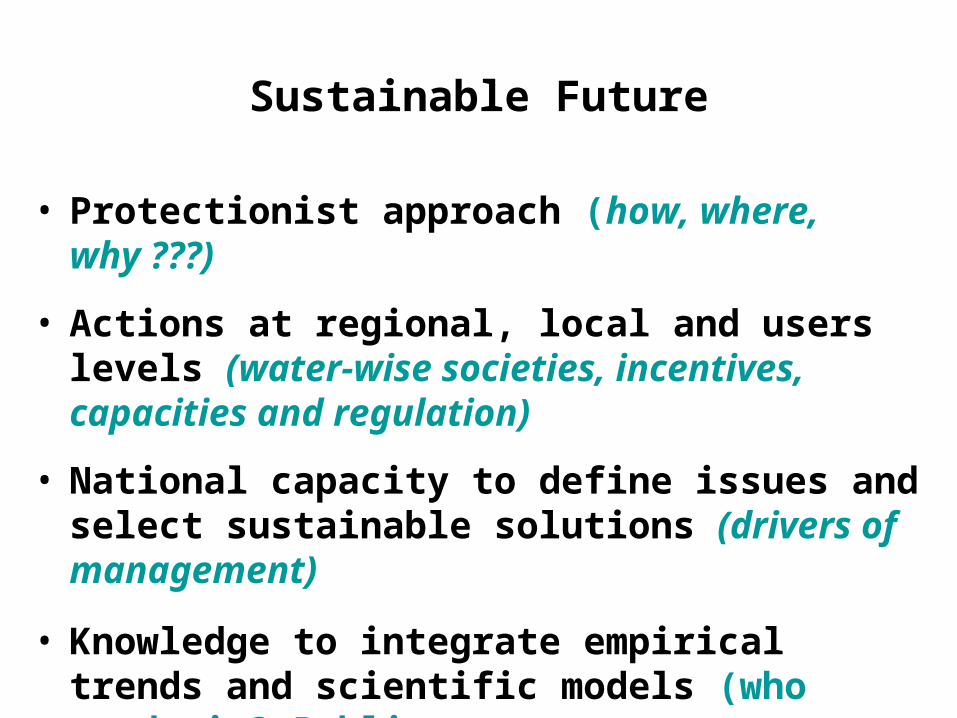
Sustainable Future
• Protectionist approach (how, where, why ???)
• Actions at regional, local and users levels (water-wise societies, incentives, capacities and regulation)
• National capacity to define issues and select sustainable solutions (drivers of management)
• Knowledge to integrate empirical trends and scientific models (who needs it? Public sector, users, donors?)

Thank You