debt market 1 - nse · debt market 1 introduction the debt market in ... during 2008-09, the...
TRANSCRIPT

www.nseindia.com
Debt MarketISMR 126
Debt Market 1
Introduction
The debt market in India comprises mainly of two categories, fi rstly the government securities or the G-Sec markets consisting of central government and state governments securities. The government to fi nance its fi scal defi cit fl oats the fi xed income instruments and borrows by issuing G-Secs that are sovereign securities and are issued by the Reserve Bank of India (RBI) on behalf of Government of India. The second category comprises of the non G-Sec markets i.e the corporate securities consisting of FI (fi nancial institutions) bonds, PSU (public sector units) bonds and corporate bonds/debentures.
The G-secs are the most dominant category of debt markets and form a major part of the market in terms of outstanding issues, market capitalization and trading value. It sets a benchmark for the rest of the market. The market for debt derivatives have not yet developed appreciably though a market for OTC derivatives in interest rate products exists.
Trends
During 2008-09, the government and corporate sector collectively mobilized Rs. 6,125,147 million (US $ 120,219 million) from primary debt market, a rise of 64.54% as compared to the preceding year (Table 6-1). About 71.29% of the resources were raised by the government (Central and State Governments), while the balance amount was mobilized by the corporate sector through public and private placement issues. The turnover in secondary debt market during 2008- 09 aggregated Rs. 62,713,470 million (US $ 1,230,883 million), 11.01% higher than that in the previous year. The share of NSE in total turnover in debt securities witnessed stood at 5.36 % during 2008-09.
Table 6-1: Debt Market: Selected Indicators
Issuer / Securities Amount raised form Primary Market
Turnover in Secondary Market
Amount raised form Primary Market
Turnover in Secondary Market
(Rs. mn.) (US $ mn.)
2007-08 2008-09 2007-08 2008-09 2007-08 2008-09 2007-08 2008-09
Government 2,559,840 4,366,880 56,273,470* 62,254,360* 64,044 85,709 1,407,893 1,221,872
Corporate/Non Government 1,162,661 1,758,267 222,273 459,110 29,088 34,510 5,561 9,011
Total 3,722,501 6,125,147 56,495,743 62,713,470 93,132 120,219 1,413,454 1,230,883
* includes NDS-OM turnoverSource : Primedatabase, RBI and NSE.
1 This chapter discusses the market design and outcome in the government securities market, both primary and secondary segment. Data avail-ability for secondary market for corporate debt securities is limited. Wherever possible, the developments in the secondary market for corpo-rate debt are also covered in this chapter. The developments in primary corporate debt market are presented in Chapter 2 of this publication.

www.nseindia.com
Debt Market ISMR127
Policy Developments
I RBI puts out draft guidelines on repo in corporate debt securities in public domain, for comments/views.
Vide press release dated September 17, 2009, the Reserve Bank of India had placed on its website “Draft Guidelines on Repo in Corporate Debt Securities” for comments/views.
The Mid-Term Review of the Annual Policy for the year 2007-08 had indicated that the Reserve Bank will permit market repo in corporate bonds once the corporate debt market develops and the Reserve Bank is assured of the availability of fair prices, and an effi cient and safe settlement system based on delivery versus payment (DvP) III and Straight Through Processing (STP) is in place. In this regard, as indicated in the Annual Policy Statement for the year 2009-10, the RBI, in consultation with SEBI, has permitted the clearing houses of the exchanges to have a transitory pooling account facility with the Reserve Bank for facilitating settlement of OTC corporate bond transactions on a DvP-I basis (i.e., on a trade-by-trade basis). With the necessary system being in place to ensure settlement of trades in corporate bonds on a DvP-1 basis and STP, the RBI has formulated, in consultation with the market participants, guidelines for repo in corporate bonds in corporate debt securities, the detailed guidelines for Eligible securities, participants, Tenor, Trading etc are available in the press release.
II Clearing and Settlement of trades in corporate bonds to be done through National Securities Clearing Corporation or the Indian Clearing Corporation from December 1, 2009
SEBI had vide its circular dated October 16, 2009 informed the stock exchanges to undertake the clearing and settlement activity of trades in corporate bonds through the clearing corporations. SEBI had earlier authorized BSE, NSE and FIMMDA to set up and maintain reporting platforms to capture information related to trading in corporate bonds. Subsequently, SEBI authorized BSE and NSE to set up and maintain trading platforms for Corporate Bonds. It had been decided that all trades in corporate bonds between specifi ed entities, namely, mutual funds, foreign institutional investors/ sub-accounts, venture capital funds, foreign venture capital investors, portfolio mangers, and RBI regulated entities as specifi ed by RBI would be cleared and settled through the National Securities Clearing Corporation Limited (NSCCL) or the Indian Clearing Corporation Limited (ICCL) from December 1, 2009. This would be applicable to all corporate bonds traded over the counter (OTC) or on the debt segment of Stock Exchanges. However, this is not applicable to trades in corporate bonds that are traded on the capital market segment/ equity segment of the stock exchanges and are required to be settled through clearing corporations/ clearing houses of stock exchanges. Meanwhile, the Reserve Bank of India (RBI) had allowed both the clearing houses NSCCL and the ICCL to open transitory pooling accounts with the central bank in Mumbai to facilitate settlement of OTC corporate bond transactions in Real-Time Gross Settlement system on a trade-by-trade basis.
Accordingly, the clearing and settlement of Corporate Bonds has started off at NSCCL. To facilitate this process the participation registration, settlement schedule, procedure and reports are put together in the circular dated November 23, 2009 placed on the NSE website.
III SEBI further simplifi es Debt Listing Agreement for Debt Securities
SEBI had, vide its circular dated May 11, 2009 put in place the Simplifi ed Listing Agreement for Debt Securities. Pursuant to suggestions from various market participants received subsequently, SEBI had amended the said Listing Agreement vide its circular dated November 26, 2009.
The amendments are briefl y summarized as under:
• 100% Asset Cover: To align the Listing Agreement with the provisions of the Companies Act, 1956, the amended Listing Agreement requires issuers to maintain 100% asset cover suffi cient to discharge the principal amount at all times for the debt securities issued. Further, to provide more information to investors, the periodic disclosures to the stock exchange shall now require disclosure of the extent and nature of security created and maintained.

www.nseindia.com
Debt MarketISMR 128
• Submission of certifi cate on maintenance of security: As against half-yearly certifi cations on security cover in respect of listed secured debt securities, the amended Listing Agreement provides for submission of such certifi cates regarding maintenance of 100% asset cover, and the time limit of submission in respect of the last half year has been aligned with the option provided for submission of annual audited results at a later date. In addition to Banks and NBFCs being exempt from submitting such certifi cates, issuers of Government guaranteed bonds shall also be exempt.
• Statement on Use of Issue Proceeds: In order to enhance the quality of disclosures made to investors, issuers shall be required to furnish a statement of deviations in use of issue proceeds, if any, to the stock exchange on a half yearly basis. Also, the same is required to be published in the newspapers simultaneously with the half-yearly fi nancial results.
• Deposit of 1% of issue proceeds: So as to ensure that the interest of investors investing in public issues of debt securities is protected, the issuer shall be required to deposit an amount calculated at 1% of the amount of debt securities offered for subscription to the public. It is refundable or forfeitable in the manner stated in the Rules, Bye-laws and Regulations of the Exchange.
• Submission/ publication of Financial Statements: The time-lines for disclosure of fi nancial statements have been aligned with the proposed changes to the Equity Listing Agreement. Accordingly, issuers would now have to publish/ furnish to the Exchange, either audited half yearly fi nancial statements or unaudited half yearly fi nancial statements subject to a limited review within 45 days from the end of the half year. In case of the last half year, issuers may opt to submit their annual audited results in lieu of the unaudited fi nancial results for the period, within 60 days from the end of the fi nancial year.
IV SEBI set up an advisory committee - “Corporate Bonds and Securitization Advisory Committee” (CoBoSAC)
In May 2008, SEBI set up an advisory committee named “Corporate Bonds and Securitization Advisory Committee” (CoBoSAC) under the chairmanship of Dr. RH Patil for making recommendations on developing the market for corporate bonds and securitized debt instruments. Thereafter, the committee met at various intervals to deliberate on the developments of corporate bond market. The key recommendation was the implementation of mandatory DvP-III clearing and settlement on exchanges with Real Time Gross Settlement RTGS. For this purpose the stock exchanges were advised to have RTGS access.
Market Design - Government Securities
Market Participants
Regulators
Given the large size of the trades, the debt market has remained predominantly a wholesale market. The matrix of issuers, investors, instruments in the debt market and their maturities are presented in (Table 6-2).
The RBI operates both as the monetary authority and the debt manager to the government. The RBI participates in the market through:
• Open-market operations (OMO)
• Liquidity Adjustment facility (LAF)
• Bank rate
• Repo rate.
SEBI regulates the debt instruments listed on the stock exchanges.• It issues guidelines for its issuance and also for their listing on stock exchanges.• The secondary market trading is conducted as per the rules set by SEBI.

www.nseindia.com
Debt Market ISMR129
Primary Dealers Primary dealers (PDs) are important intermediaries in the government securities markets. There were 19 PDs operating in the market at the end of July 2009.
Primary Dealers act as underwriters in the primary market and are expected to support the primary issues of dated securities of Central Government and State Government and Treasury Bills of Central Government, through underwriting/bidding commitments and success ratios.
The underwriting commitment on dated securities of Central Government is divided into two parts, Minimum Underwriting Commitment (MUC) and Additional Competitive Underwriting (ACU). The MUC of each PD is computed to ensure that at least 50 percent of the notifi ed amount of each issue is mandatory underwritten equally by all PDs. The share under MUC will be uniform for all PDs, irrespective of their capital or balance sheet size. The remaining portion of the notifi ed amount will be underwritten through an Additional Competitive Underwriting (ACU) auction.
For auction of dated securities, RBI may invite PDs to collectively bid to underwrite up to 100 per cent of the notifi ed amount of State Development Loans (SDL).
In case of underwriting of Treasury Bills each PD individually commits, at the beginning of the year, to submit bids for a fi xed percentage of the notifi ed amount of Treasury Bills in each auction. The minimum bidding commitment amount / percentage for each PD is determined by the Reserve Bank, in consultation with the PD. • They are Market makers in the secondary market. PDs underwrite a portion of the issue of
government security that is fl oated for a pre-determined amount. • RBI provides liquidity support to the PDs through LAF against collateral of government
securities and through repo operations/refi nance. • PDs are also given favoured access to the RBI’s open market operations. • They are permitted to borrow and lend in the money market.
Brokers • Play an important role in secondary debt market by bringing together counterparties and negotiating terms of trade.
• Trades are entered through them on the stock exchanges
The brokers are regulated by the stock exchanges and by SEBI.
Investors • Banks • Mutual Funds.• Insurance Company’s• Foreign Institutional Investors (FIIs) also are permitted to invest in treasury and corporate
bonds, within certain limits. • Provident and pension funds are large investors in the debt markets. Charitable institutions,
trusts and societies are also large investors in the debt markets. They are, however, governed by their rules and bye-laws with respect to the kind of bonds they can buy and the manner in which they can trade on their debt portfolios.
• Small and Medium Sized Investors: To enable small and medium sized investors to participate in the primary auction of government securities, a “Scheme of Non Competitive Bidding” was introduced in January 2002, which is open to any person including fi rms, companies, corporate bodies, institutions, provident funds, trusts, and any other entity prescribed by RBI. The scheme provides for allocation of up to 5 per cent of the notifi ed amount at the weighted average rate of accepted bids. Investors can bid through banks or PDs a minimum amount of Rs.10,000. The aggregate amount of bids submitted by a person in an auction should not exceed the notifi ed amount of auction.

www.nseindia.com
Debt MarketISMR 130
Types & Issuers of Securities
Types of Securities
Securities with fi xed coupon rates
These securities carry a specifi c coupon rate remaining fi xed during the term of the security and payable periodically. These may be issued at a discount, at par or at a premium to the face value, but are redeemed at par.
Securities with variable coupon rates, viz, Floating Rate Bonds etc.
These securities carry a coupon rate which will vary according to the change in the base rate to which it is related.
Floating Rate Bonds
These securities carry a coupon rate, which consists of a variable base and a spread. The most common base rate used is the weighted average of yield of 364 day-treasury bills. The spread is decided at the auction.
Zero Coupon Bonds
These are issued at discount and redeemed at par. On the basis of the bids tendered, the RBI determines the cut-off price at which tenders would be accepted at the auction
Treasury Bills
Treasury bills (T-bills) are short-term debt instruments issued by the Central government. They have either 91-days, 182-days or 364-days maturity. T-bills are sold through an auction process announced by the RBI at a discount to its face value. RBI issues an indicative calendar of T-bill auctions.
Securities with Embedded Options
These securities, where a ‘call option’/ ‘put option’ is specifi ed, are repaid at the option before the specifi ed redemption date.
Government Securities issued by Central and State Government and Local bodies. In the recent past, local bodies such as municipalities have also tapped the market. The Central Government mobilises funds mainly through issue of dated securities and T-bills, while State Governments rely solely on state development loans.
The States raise resources through Auctions and Tap routes. The State Government raised a gross amount of Rs.1,181,380 million in 2008-09 as compared with Rs.677,790 million in the previous year. The entire gross amount was raised through the auction route.
Primary Issuance Process of Government Securities
Government issues securities through the auction, tap sale, pre-announced coupon rate etc. A brief about them are as given below:
Issue of securities through auction
The securities are issued through auction either on price basis or yield basis.
• If the issue is on price basis, the coupon is pre-determined, then the bidders should quote price per Rs.100 of the face value of the security.
• If the issue is on yield basis, then the coupon of the security is decided in an auction and the security carries the same coupon till maturity. On the basis of the bids received, RBI determines the maximum rate of yield or the minimum offer price as the case may be at which offers for purchase of securities would be accepted.
The auctions for issue of securities (on either yield basis or price basis) are held either on ‘Uniform Price’ method or ‘Multiple Price Method’.

www.nseindia.com
Debt Market ISMR131
Issue of securities with pre-announced coupon rates:
The coupon on securities is announced before the date of fl oatation and the securities are issued at par. In case the total subscription exceeds the aggregate amount offered for sale, RBI may make partial allotment to all the applicants.
Issue of securities through tap sale
No aggregate amount is indicated in the notifi cation in respect of the securities sold on tap. Sale of such securities may be extended to more than one day and the sale may be closed at any time on any day.
Issue of securities in conversion of maturing treasury bills/dated securities
The holders of treasury bills of certain specifi ed maturities and holders of specifi ed dated securities are provided an option to convert their holding at specifi ed prices into new securities offered for sale. The new securities could be issued on an auction/pre-announced coupon basis.
Purchasers of G-Secs
• Any person including fi rm, company, corporate body, institution, state government, provident fund, trust, NRI, OCB predominantly owned by NRIs and FII registered with SEBI and approved by RBI can submit offers, including in electronic form for purchase of government securities. The payments can be done through a variety of means such as cash or cheque drawn on RBI or Banker’s pay order or by authority to debit their current account with RBI or by Electronic Fund Transfer. Government securities are issued for a minimum amount of Rs. 10,000 (face value) and in multiples of Rs. 10,000 thereafter. These are issued to the investors by credit to their SGL Account or to a Constituent SGL Account of the institution as maintained with RBI or by credit to their Bond Ledger or in the form of physical certifi cate. These are repaid at Public Debt Offi ces of RBI or any other institution at which they are registered at the time of repayment.
• Retail investors can participate in the auctions on ‘non-competitive’ basis. Allocation of the securities to the non-competitive bidders are made at the discretion of the RBI and at a price higher than the weighted average price arrived at on the basis of the competitive bids accepted at the auction. The nominal amount of securities that would be allocated to retail investors on non-competitive basis is restricted to a maximum of 5 percentage of the aggregate nominal amount of the issue, within or outside of the nominal amount which is issued at the weighted average price of the issue at the auction.
Secondary Market Participants
• Banks
• Financial Institutions
• Primary Dealers
• Mutual Funds
Most of the secondary market trades in government securities are negotiated between participants (Banks, FIs, PDs, MFs) having SGL accounts with RBI. These may be negotiated directly between counter parties or negotiated through brokers.
Listing of Government Securities
All government securities are ‘deemed’ listed as and when they are issued. All eligible securities, whether publicly issued or privately placed, can be made available for trading in the WDM segment. Amongst other requirements, privately placed debt paper of banks, institutions and corporates requires an investment grade credit rating to be eligible for listing. The listing requirements for securities on the WDM segment of NSE are presented in (Table 6-3).

www.nseindia.com
Debt MarketISMR 132
SECONDARY MARKET – Trading System
Most of the secondary market trades in government securities are negotiate between participants (Banks, FIs, PDs, MFs) having SGL accounts with RBI. These may be negotiated directly between counter parties or negotiated through brokers.
Various Trading Platforms
Negotiated Dealing System (NDS)
NDS of RBI provides an electronic platform for negotiating trades in government securities. If a broker is involved, the trade is reported to the concerned exchange.
NDS– Order Matching (NDS-OM)
• NDS-OM is an electronic, screen based, anonymous, order driven trading system, introduced by RBI as part of the existing NDS system to facilitate electronic dealing in government securities.
• It is accessible to members through RBI’s INFINET Network.
• The system facilitates better price discovery, liquidity, increased operational effi ciency and transparency.
• NDS-OM facilitates straight- through-processing, with all the trades on the system automatically sent to CCIL for settlement.
• NDS-OM is open to all existing NDS members who are regulated by RBI. Trading in this platform has been gradually extended to entities like insurance companies, mutual funds and, provident funds.
• The NDS-OM system supports trading in all Central Government Dated Securities and State Government Securities in T+1 settlement type.
• RBI has permitted the execution of intra-day short sale transaction and the covering of short position only on this trading platform.
WDM Segmentof NSE Trading System
NSE’s Wholesale Debt Market (WDM) segment offers a fully automated screen based trading platform through the NEAT (National Exchange for Automated Trading) system. The WDM segment as the name suggest permits only high value transactions in debt securities.
Hence, it is meant primarily for banks, institutional and corporate participants and intermediaries.
The trades on the WDM segment can be executed through the continuous market and negotiated market. In continuous market, the buyer and seller do not know each other and they put their best buy/sell orders, which are stored in order book with price/time priority. If orders match, it results into a trade. The trades in WDM segment are settled directly between the participants, who take an exposure to the settlement risk attached to any unknown counter-party. In the NEAT-WDM system, all participants can set up their counter-party exposure limits against all probable counter-parties. This enables the trading member/participant to reduce/minimise the counter-party risk associated with the counter-party to trade. A trade does not take place if both the buy/sell participants do not invoke the counter-party exposure limit in the trading system.
In the negotiated market, the trades are normally decided by the seller and the buyer outside the exchange, and reported to the Exchange through the broker. Thus, deals negotiated or structured outside the exchange are disclosed to the market through NEAT-WDM system. In negotiated market, as buyers and sellers know each other and have agreed to trade, no counter-party exposure limit needs to be invoked.

www.nseindia.com
Debt Market ISMR133
Types of Securities traded in the WDM Segment of NSE
All types of SLR (Government securities, T-bills etc) and non-SLR (CPs, CDs etc) securities are available for trading in the WDM segment of the NSE. All government securities are ‘deemed’ listed as and when they are issued. The other debt securities are traded either under the ‘permitted to trade’ or ‘listed’ category. All eligible securities, whether publicly issued or privately placed, can be made available for trading in the WDM segment.
Charges The NSE has waived the transaction charges for the WDM segment of the Exchange for the period April 1, 2009 to March 31, 2010.
Clearing and Settlement
NSE currently has settlement periods ranging from same day (T+0) settlement to a maximum of (T+2) for non-government securities while settlement of all outright secondary market transactions in government securities was standardized to T+1. In case of repo transactions in government securities, fi rst leg can be settled either on T+0 basis or T+1 basis.
In case of government securities, the actual settlement of funds and securities are effected directly between participants or through Reserve Bank of India (RBI). Trades in government securities are reported to RBI-SGL through the Negotiated Dealing System (NDS) of RBI, and Clearing Corporation of India Limited (CCIL) provides settlement guarantee for transactions in government securities including repos. The trades are settled on a net basis through the DvP-III system. In the DvP-III, the settlement of Securities and Funds are carried out on a net basis.
For securities other than government securities and T-bills, trades are settled on a gross basis directly between participants on delivery versus payment basis. On the scheduled settlement date, the Exchange provides data/information to the respective member/participant regarding trades to be settled on that day with details like security, counter party and consideration.
The settlement details for non-government securities, i.e. certifi cate no., Cheque no., constituent etc. are reported by the member/participant to the Exchange.
The Exchange closely monitors the settlement of transactions through the reporting of settlement details by members and participants. In case of deferment of settlement or cancellation of trade, participants are required to seek prior approval from the Exchange. For any dispute arising in respect of the trades or settlement, the exchange has established arbitration mechanism for resolving the same.
Table 6-2: Participants and Products in Debt Market
Issuer Instruments Maturity Investors
Central Government Dated Securities (including MSS)
2 - 30 years RBI (secondary market only), Banks, Insurance Companies, Provident Funds, Mutual Funds, PDs, corporates
Central Government T-Bills 91/182/364 days RBI, Banks, Insurance companies, Provident Funds, Mutual Funds, Individuals, PDs
State Government Dated Securities
10-13 years (During 2008-09, only 10 years)
RBI, Banks, Insurance Companies, Provident Funds, Mutual Funds, Individuals and PD’s.
PSUs Bonds, Structured Obligations
5-10 years Banks, Insurance Companies, Provident Funds, Mutual Funds, Individuals, Corporates
Corporates Debentures 1 - 12 years Banks, Mutual Funds, Corporates, Individuals
Contd.

www.nseindia.com
Debt MarketISMR 134
Issuer Instruments Maturity Investors
Corporates, PDs Commercial Papers
7 days to 1 year Banks, Mutual Funds, Financial Institutions, Corporates, Individuals, NRI’s and FIIs
All- India Financial Institutions permitted by RBI to raise short-term resources within the umbrella limit fi xed by RBI)
Certifi cates of Deposits
1-3 years Banks, Companies, Individuals, FIIs, Corporations, Trusts, Funds, Associations and Fis. NRIs may also subscribe to CDs, but only on non-repatriable basis which should be clearly stated on the Certifi cate. Such CDs cannot be endorsed to another NRI in the secondary market.
Scheduled Commercial Banks Bank Bonds 1-10 years Corporations, Individuals, Companies, Trusts, Funds, Associations, FIs, Non-Resident Indians
Municipal Corporation Municipal Bonds
0-7 years Banks, Corporations, Individuals, Companies, Trusts, Funds, Associations, FIs, Non-Resident Indians
Corporate Bond MarketCorporate debt instruments are traded either as bilateral agreements between two counterparties or on a stock exchange through brokers. In the latter category, these are traded on BSE and on the CM and WDM segments of NSE. The difference between trading of government securities and corporate debt securities is that the latter are traded on the electronic limit order book. This is in view of SEBI mandate, which prohibits negotiated deals in respect of corporate listed debt securities. The SEBI regulation also prescribes that all such trades should be executed on the basis of price and order matching mechanism of stock exchanges as in case of equities. The trades on BSE are settled through the clearing house. The trades on CM segment of NSE are settled through National Securities Clearing Corporation. Trades on WDM segment of NSE are settled on a trade-by-trade basis on the settlement day.
The corporate bond market has been in existence in India for a long time. However, despite a long history, the size of the public issue segment of the corporate bond market in India has remained quite insignifi cant. The lack of market infrastructure and comprehensive regulatory framework coupled with low issuance leading to low liquidity in the secondary market, narrow investor base, inadequate credit assessment skills, high cost of issuance, lack of transparency in trades and underdevelopment of securitization of products are some of the major factors that hindered the growth of the private corporate debt market. However, many reforms have recently been made in the regulatory and legal aspects of these markets leading to some pick up in the activity in these markets. These change are presented in the market design section below:
The market design of corporate bond markets is summarized below:
Market segments • Bonds issued by public sector units, including public fi nancial institutions, and
• Bonds issued by the private corporate sector
Regulatory framework
In January, 2007, the regulatory jurisdiction and market design for corporate bonds was clarifi ed by the Government as under:
(a) Agency responsible for different segments of the corporate debt market
(i) SEBI is responsible for primary market (public issues as well as private placement by listed companies) for corporate debt;
Contd.

www.nseindia.com
Debt Market ISMR135
(ii) RBI is responsible for the market for repo/reverse repo transactions in corporate debt. However, if it is traded on exchanges, trading and settlement procedure would be determined by SEBI.
(iii) SEBI is responsible for the secondary market (OTC as well as Exchange) for the corporate debt;
(iv) The above framework would apply irrespective of the parties (bank or non bank involved in a transaction;
(v) The views in respect of trading of unlisted securities and derivatives on corporate debt (other than repo/reverse repo) are taken as and when the need arises.
(b) The market design for the secondary market of corporate debt market (i) OTC as well as exchange based transactions need to be reported to reporting
platforms(s); (ii) All the eligible and willing national stock exchanges need to be allowed to set up
and maintain reporting platforms if they approach SEBI for the same. SEBI needs to coordinate among such reporting platforms and assign the job of coordination to a third agency;
(iii) The trades executed on or reported to an Exchange need not be reported to a reporting platform;
(iv) The participants must have a choice of platform. They may trade on OTC or any exchange trading platform;
(v) Existing exchanges could be used for trading of corporate debts. NSE and BSE could provide trading platforms for this purpose. There is no need to create a separate infrastructure;
(vi) There would be no separate trading platforms for different kinds of investors. Institutional and retail investors would trade on the same platform;
(vii) Only brokers would have access to trading platform of an Exchange. Banks would have the option of becoming a broker or trading through a broker. RBI, may if considered necessary restricts a bank to trade only on proprietary account as a broker.
Trade reporting platforms
BSE operationalised its reporting platform to capture information related to trading in corporate bond market in January 2007. NSE set up its reporting platform in March, 2007.
Further, Fixed Income Money Market and Derivatives Association of India (FIMMDA) proposed to set up a reporting platform for corporate bonds and also provide value added dissemination of information on corporate bonds as in the case of government securities. SEBI granted permission to FIMMDA and thus, its reporting platform was operationalised in September, 2007.
Accordingly, for reporting of OTC trades the concerned parties could opt to report their trades on any one of the three reporting platforms.
Trading platforms & Clearing and Settlement
In April, 2007 SEBI permitted both BSE and NSE to have in place corporate bond trading platforms and advised both the exchanges advises them that the stock exchanges may provide their services for clearing and settlement of corporate bonds traded or the entities trading in listed corporate debt securities may settle their trades bilaterally.
BSE and NSE trading platforms became operational in July 2007. Initially, trade matching platforms at BSE and NSE are order driven with the essential features of OTC market
In October 2009 SEBI mandated the clearing and settlement of all trades through the National Securities Clearing Corporation (NSCCL ) or the Indian Clearing Corporation Limited (ICCL). Accordingly clearing and settlement through both the clearing corporations at NSE and BSE commenced in December 2009.

www.nseindia.com
Debt MarketISMR 136
Table 6-3: Eligibility Criteria for Securities on WDM Segment
Issuer Eligibility Criteria for listing
Public Issue /Private Placement
Corporates (Public limited companies and Private limited companies)
• Paid-up capital of Rs.10 crores; or• Market capitalisation of Rs.25 crores (In case of unlisted companies Networth more than Rs.25 crores)• Credit rating
Public Sector Undertaking, Statutory Corporation established/ constituted under Special Act of Parliament /State Legislature, Local bodies/authorities,
• Credit rating
Mutual Funds:Units of any SEBI registered Mutual Fund/scheme :• Investment objective to invest
predominantly in debt or• Scheme is traded in secondary market
as debt instrument
• Qualifi es for listing under SEBI’s Regulations
Infrastructure companies• Tax exemption and recognition as
infrastructure company under related statutes/regulations
• Qualifi es for listing under the respective Acts, Rules or Regulations under which the securities are issued.
• Credit rating
Financial Institutions u/s. 4A of Companies Act, 1956 including Industrial Development Corporations
Public Issue Private PlacementQualifi es for listing under the respective Acts, Rules or Regulations under which the securities are issued.
Credit rating
Banks • Scheduled banks • Networth of Rs.50 crores or above• Qualifi es for listing under the respective Acts, Rules
or Regulations under which the securities are issued.
• Scheduled Banks• Networth of Rs.50
crores or above• Credit rating
Market Outcome
Primary Market
Resource Mobilization
During 2008-09, the central government and state governments borrowed Rs.3,185,500 million (US $ 62,522 million) and Rs.1,181,380 million (US $ 23,187 million) respectively. The gross borrowings of the central and state governments taken together increased by 70.59 % from Rs. 2,559,840 million (US $ 64,044 million) during 2007-08 to Rs. 4,366,880 million (US $ 85,709 million) during 2008-09 (Table 6-4). Their net borrowings also increased by 108.83 % from Rs.1,657,270 million (US $ 41,463 million) in the previous year to Rs. 3,460,840 million (US $ 67,926 million) during 2008-09. The gross and net market borrowings of central government are budgeted to increase further to Rs. 4,910,440 million and Rs.4,011,390 million respectively while those of the state governments are budgeted to increased to Rs. 1,562,380 million and Rs. 1,400,000 million in the same period.
The Central Government mobilised Rs. 2,730,000 million (US $ 53,582 million) through issue of dated securities and Rs. 455,500 million (US $ 8,940 million) through issue of T-bills. After meeting repayment liabilities of Rs.440,280 million (US $ 8,641 million) for dated securities, and redemption of T-bills of Rs. 322,050 million (US $ 6,321 million), net market borrowing of Central Government amounted to Rs.2,423,170 million (US $ 47,560 million) for the year

www.nseindia.com
Debt Market ISMR137
Tabl
e 6-
4: M
arke
t Bor
row
ings
of G
over
nmen
ts
(Am
ount
in R
s. m
n)
(Am
ount
in U
S $.
mn)
Secu
rity
Gro
ssRe
paym
ents
Net
Gro
ssRe
pay-
men
tN
et
2009
-201
0 (B
E)20
08-0
9 20
07-0
8 20
09-2
010
(BE)
2008
-09
2007
-08
2009
-201
0 (B
E)20
08-0
920
07-0
820
08-0
9
1C
entra
l Gov
ernm
ent
(a+
b)4,
910,
440#
3,1
85,5
00
1,8
82,0
50
899,
050
762,
330
787,
020
4,01
1,39
02,
423,
170
1,09
5,03
062
,522
14,
962
47,
560
a) D
ated
Sec
uriti
es4,
510,
930#
2,73
0,00
0*1,
560,
000*
53
1,36
044
0,28
045
3,29
03,
979,
570
2,28
9,72
01,
106,
710
53,5
82 8
,641
4
4,94
1
b) 3
64-d
ay T
-bill
s39
9,51
0 4
55,5
00
322
,050
36
7,69
032
2,05
033
3,73
031
,820
133,
450
-11,
680
8,94
0 6
,321
2
,619
2St
ate
Gov
ernm
ent*
1,56
2,38
0(E)
1,1
81,3
80
677
,790
16
2,38
014
3,71
011
5,55
01,
400,
000
1,03
7,67
056
2,24
0(E)
23,1
87 2
,821
2
0,36
6
Tota
l (1+
2)6,
472,
820
4,3
66,8
80
2,5
59,8
40
1,06
1,43
090
6,04
090
2,57
05,
411,
390
3,46
0,84
01,
657,
270
85,7
09 1
7,78
3 6
7,92
6 BE
: Bu
dget
Est
imat
es E
: Est
imat
es*
: Inc
lude
s Rs
120
,000
mill
ion
dequ
este
red
from
the
MSS
cas
h ac
coun
t dur
ing
2008
-09
# : I
nclu
des
Rs. 3
30,0
00 m
illio
n be
ing
the
proj
ecte
d M
SS d
eque
ster
ing
for 2
009-
10

www.nseindia.com
Debt MarketISMR 138
2008-09. The state governments collectively raised Rs. 1,181,380 million (US $ 23,187 million) during 2008-09 as against Rs. 677,790 million (US $ 16,957 million) in the preceding year. The net borrowings of State Governments in 2008-09 amounted to Rs. 1,037,670 million (US $ 20,366 million). (Table 6-4)
Central Government Dated Securities
Yields and Maturity Structure
A profi le of Central Government Dated Securities is shown in (Table 6-5). The net borrowing through dated securities increased twice the amount raised in 2007-08. The weighted average yield on dated securities decreased for the fi rst time in the last fi ve years in 2008-09. The yield decreased from 14.90 % in 2007-08 to 13.81 % in the current year. The cut off yield varied between 5.44 % and 10.03 % in 2008-09 as against 7.55 % and 8.64 % in 2007-08.
Government has been consciously trying to lengthen maturity profi le. However 2008-09 witnessed a dip in the maturity profi le, the weighted average maturity of dated securities issued in this period was lower at 7.69 % than 8.12 % in the 2007-08. Around 39 % of central government borrowings were affected through securities with maturities above 10 years and 55% borrowings were effected through securities with maturities above 5 and upto 10 years.
Table 6-5: Profi le of Central Government Dated Securities
Items 2007-08 2008-09 2007-08 2008-09
(Amount in Rs.mn.) (Amount in US $ mn.)
1 Gross Borrowing 1,560,000 2730000* 39,029 53,582
2 Repayments 453,290 440,280 11,341 8,641
3 Net Borrowings 1,106,710 2,289,720 27,689 44,941
4 Weighted Average Maturity (In years) 14.90 13.81 N.A N.A
5 Weighted Average Yield (Per cent) 8.12 7.69 N.A N.A6 (A) Maturity Distribution (Amount)
a Upto 5 years - 150,000 - 2,944
b Above 5 and upto 10 years 890,000 1,430,000 22,267 28,067
c Above 10 years 670,000 1,030,000 16,763 20,216
Total 1,560,000 2,610,000 39,029 51,227
(B) Maturity Distribution (Per cent)
a Upto 5 years 0 6 N.A N.A
b Above 5 and upto 10 years 57 55 N.A N.A
c Above 10 years 43 39 N.A N.A
Total 100 100 N.A N.A7 Price based Auctions Amount 1,500,000 2,420,000 37,528.1 47,4988 Yield - (Per cent)
Minimum 7.55(9 years, 6 months)
5.44(9 years, 3 months)
N.A N.A
Maximum 8.64(29 years, 7 months)
10.03(23 years, 7 months)
N.A N.A
Contd.

www.nseindia.com
Debt Market ISMR139
Items 2007-08 2008-09 2007-08 2008-09
(Amount in Rs.mn.) (Amount in US $ mn.)
9 Yield - Maturity Distribution-wise
(A) Less than 10 years Minimum 7.55
(9 years, 6 months)5.44
(9 years, 3 months)N.A N.A
Maximum 8.44(9 years, 10 months)
9.14(9 years, 8 months)
N.A N.A
(B) 10 years
Minimum 7.99 6.05 N.A N.A
Maximum 7.99 8.24 N.A N.A
(C) Above 10 years Minimum 7.62
(14 years)6.52
(26 years, 8 months)N.A N.A
Maximum 8.64(29 years)
10.03(23 years, 7 months)
N.A N.A
Note: Figures in brackets indicate residual maturity in years.N.A Not applicable* Includes the amount dequestered from (MSS)- Market Stabilisaion Scheme cash account.Source: RBI Annual Report 2008-09
Secondary Market
Turnover
The aggregate secondary market transactions in debt securities (including government and non-government securities) increased by 11.0 % to Rs. 62,713,470 million (US $ 1,230,883 million) in 2008-09 from Rs. 56,495,743 million (US $ 1,407,893 million) in 2007-08. Non-government securities accounted for a meager 0.73% of total turnover in debt market. NSE accounted for about 5 % of total turnover in debt securities during 2008-09. (Table 6-6).
Table 6-6: Turnover of Debt Securities
Securities 2007-08 2008-09 April-June 2009 2007-08 2008-09 April-June 2009
(Rs. mn.) (US $ mn.)
Government Securities* 56,273,470 62,254,360 16,576,430 1,407,893 1,221,872 346,280
WDM Segment of NSE 2,604,088 2,911,124 999,289 65,151 57,137 20,875
Rest of SGL 53,669,382 59,343,816 15,577,141 1,342,742 1,164,746 325,405
Non Government Securities 222,273 459,110 309,024 5,561 9,011 6,455
CM Segment of NSE 845 1,005 683 21 20 14
WDM Segment of NSE 219,082 448,391 305,576 5,481 8,801 6,383
‘F’ Category of BSE 2,346 9,714 2,765 59 191 58
Total 56,495,743 62,714,050 16,885,454 1,413,454 1,230,894 352,736 Source: RBI, BSE and NSE.* includes NDS-OM turnover
Contd.

www.nseindia.com
Debt MarketISMR 140
The non-government securities are traded on the WDM and CM segments of the NSE, and on the BSE (F Category). Except WDM, the volumes are quite insignifi cant on other segments. The turnover in non-government securities on WDM segment of NSE was Rs. 448,391 million (US $ 8,801 million) in 2008-09, higher by 104.67% than that during the preceding year. BSE reported a turnover of Rs.9,714 million (US $ 191 million) during 2008-09. NSE accounted for 97.88% of total turnover in non-government securities during the year.
The aggregate turnover in (central and state government dated securities and T-bills) through non-repo SGL transactions touched a level of Rs.6,645,488 million (US $ 130,432 million) in 2008-09 recording an increase of 32.83% from Rs. 5,003,047million (US $ 125,170 million) in the previous year (Table 6-7). The monthly turnover in non-repo transactions for the year 2008-09 ranged between Rs. 280,244 million (US $ 5,500) and Rs. 984,006 million (US $ ,726 million). The average turnover during 2008-09 amounted to Rs. 553,791 million (US $ 10,869).
Table 6-7: Secondary Market Transactions in Government Securities
Month/ Year SGL Non-Repo Transactions Share in Non-Repo Turnover (%)
GOI Securities Treasury Bills Total (1+2) Total (1+2)(US $ mn.)
GOI Securities T-Bills
(Rs in mn.)
1 2 3 4 5 6
1994-95 115,860 97,210 213,070 6,779 54.38 45.62
1995-96 180,170 115,130 295,300 8,597 61.01 38.99
1996-97 604,990 334,220 939,210 26,176 64.41 35.59
1997-98 1,198,890 412,010 1,610,900 40,751 74.42 25.58
1998-99 1,446,410 428,900 1,875,310 44,197 77.13 22.87
1999-00 4,089,160 475,750 4,564,910 104,651 89.58 10.42
2000-01 5,120,836 600,620 5,721,456 122,673 89.50 10.50
2001-02 11,446,342 673,316 12,119,658 248,354 94.44 5.56
2002-03 13,155,989 767,845 13,923,834 293,133 94.49 5.51
2003-04 15,813,076 1,200,556 17,013,632 392,110 92.94 7.06
2004-05 9,897,351 2,711,314 12,608,665 288,198 78.50 21.50
2005-06 4,986,040 2,094,107 12,066,187 270,482 41.32 17.36
2006-07 2,747,384 1,235,603 3,982,988 91,374 68.98 31.02
2007-08 3,541,760 1,461,287 5,003,047 125,170 70.79 29.21
Apr-08 329,338 81,756 411,094 8,069 80.11 19.89
May-08 301,869 66,964 368,833 7,239 81.84 18.16
Jun-08 519,832 65,194 585,027 11,482 88.86 11.14
Jul-08 344,634 63,687 408,321 8,014 84.40 15.60
Aug-08 216,372 63,872 280,244 5,500 77.21 22.79
Sep-08 274,300 99,661 373,961 7,340 73.35 26.65
Oct-08 289,124 82,303 371,427 7,290 77.84 22.16
Contd.

www.nseindia.com
Debt Market ISMR141
Month/ Year SGL Non-Repo Transactions Share in Non-Repo Turnover (%)
GOI Securities Treasury Bills Total (1+2) Total (1+2)(US $ mn.)
GOI Securities T-Bills
(Rs in mn.)
1 2 3 4 5 6
Nov-08 381,847 134,028 515,876 10,125 74.02 25.98
Dec-08 810,273 153,319 963,591 18,912 84.09 15.91
Jan-09 634,171 128,725 762,896 14,973 83.13 16.87
Feb-09 480,742 139,471 620,213 12,173 77.51 22.49
Mar-09 845,247 138,758 984,006 19,313 85.90 14.10
2008-09 5,427,749 1,217,740 6,645,488 130,432 81.68 18.32
Apr-09 611,609 203,000 814,609 17,017 75.08 24.92
May-09 567,630 191,381 759,010 15,856 74.79 25.21
Jun-09 541,885 211,564 753,449 15,739 71.92 28.08
April-June 09 1,721,123 605,945 2,327,069 48,612 73.96 26.04
Source : NSE*excludes NDS-OM turnover
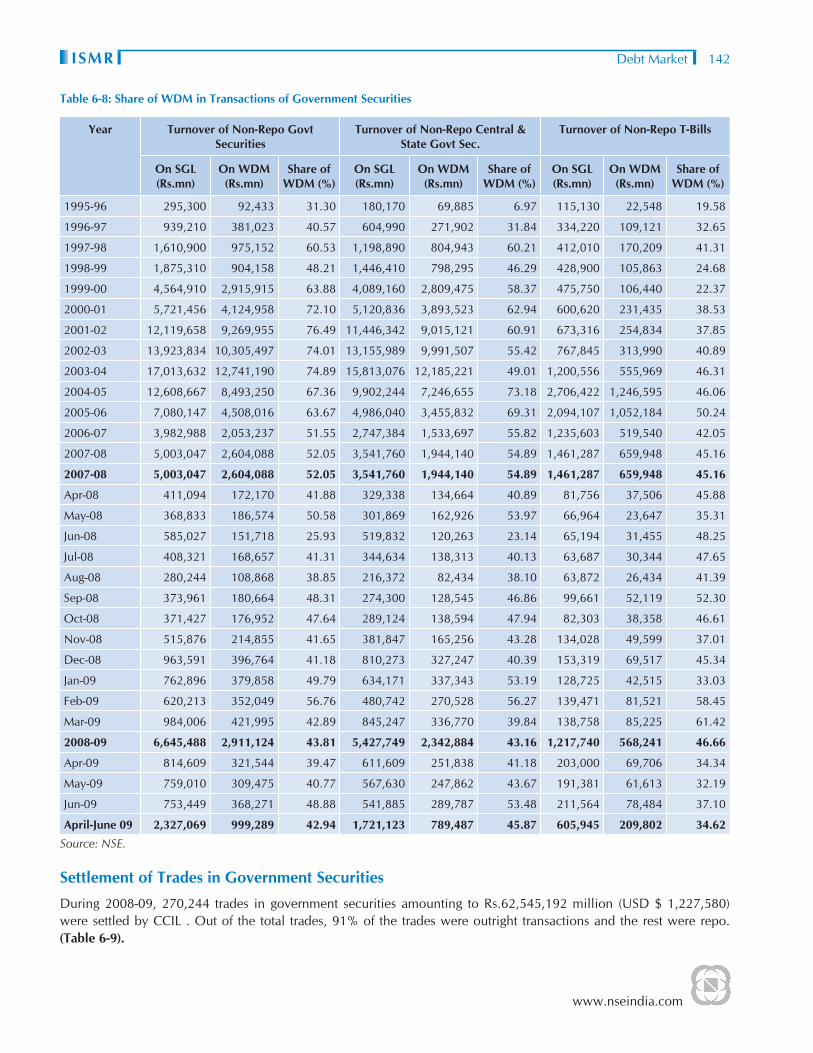
The share of WDM segment of NSE in the total turnover of non-repo SGL transaction witnessed a decrease in 2008-09. It accounted for a share of 43.81% as against 52.06% in the preceding year. (Table 6-8). The share of WDM in turnover of non-repo dated securities (central and state government securities) also witnessed a decrease from 54.89% in 2007-08 to 43.16% in 2008-09 (Chart 6-1) The share of WDM in turnover of non-repo T-bills has rose to 46.66 % as compared to 45.16 % in the corresponding period.
Chart 6-1: Share of WDM in Non-Repo Government Transaction
Contd.
www.nseindia.com
Debt MarketISMR 142
Table 6-8: Share of WDM in Transactions of Government Securities
Year Turnover of Non-Repo Govt Securities
Turnover of Non-Repo Central & State Govt Sec.
Turnover of Non-Repo T-Bills
On SGL (Rs.mn)
On WDM(Rs.mn)
Share of WDM (%)
On SGL (Rs.mn)
On WDM(Rs.mn)
Share of WDM (%)
On SGL (Rs.mn)
On WDM(Rs.mn)
Share of WDM (%)
1995-96 295,300 92,433 31.30 180,170 69,885 6.97 115,130 22,548 19.58
1996-97 939,210 381,023 40.57 604,990 271,902 31.84 334,220 109,121 32.65
1997-98 1,610,900 975,152 60.53 1,198,890 804,943 60.21 412,010 170,209 41.31
1998-99 1,875,310 904,158 48.21 1,446,410 798,295 46.29 428,900 105,863 24.68
1999-00 4,564,910 2,915,915 63.88 4,089,160 2,809,475 58.37 475,750 106,440 22.37
2000-01 5,721,456 4,124,958 72.10 5,120,836 3,893,523 62.94 600,620 231,435 38.53
2001-02 12,119,658 9,269,955 76.49 11,446,342 9,015,121 60.91 673,316 254,834 37.85
2002-03 13,923,834 10,305,497 74.01 13,155,989 9,991,507 55.42 767,845 313,990 40.89
2003-04 17,013,632 12,741,190 74.89 15,813,076 12,185,221 49.01 1,200,556 555,969 46.31
2004-05 12,608,667 8,493,250 67.36 9,902,244 7,246,655 73.18 2,706,422 1,246,595 46.06
2005-06 7,080,147 4,508,016 63.67 4,986,040 3,455,832 69.31 2,094,107 1,052,184 50.24
2006-07 3,982,988 2,053,237 51.55 2,747,384 1,533,697 55.82 1,235,603 519,540 42.05
2007-08 5,003,047 2,604,088 52.05 3,541,760 1,944,140 54.89 1,461,287 659,948 45.16
2007-08 5,003,047 2,604,088 52.05 3,541,760 1,944,140 54.89 1,461,287 659,948 45.16
Apr-08 411,094 172,170 41.88 329,338 134,664 40.89 81,756 37,506 45.88
May-08 368,833 186,574 50.58 301,869 162,926 53.97 66,964 23,647 35.31
Jun-08 585,027 151,718 25.93 519,832 120,263 23.14 65,194 31,455 48.25
Jul-08 408,321 168,657 41.31 344,634 138,313 40.13 63,687 30,344 47.65
Aug-08 280,244 108,868 38.85 216,372 82,434 38.10 63,872 26,434 41.39
Sep-08 373,961 180,664 48.31 274,300 128,545 46.86 99,661 52,119 52.30
Oct-08 371,427 176,952 47.64 289,124 138,594 47.94 82,303 38,358 46.61
Nov-08 515,876 214,855 41.65 381,847 165,256 43.28 134,028 49,599 37.01
Dec-08 963,591 396,764 41.18 810,273 327,247 40.39 153,319 69,517 45.34
Jan-09 762,896 379,858 49.79 634,171 337,343 53.19 128,725 42,515 33.03
Feb-09 620,213 352,049 56.76 480,742 270,528 56.27 139,471 81,521 58.45
Mar-09 984,006 421,995 42.89 845,247 336,770 39.84 138,758 85,225 61.42
2008-09 6,645,488 2,911,124 43.81 5,427,749 2,342,884 43.16 1,217,740 568,241 46.66
Apr-09 814,609 321,544 39.47 611,609 251,838 41.18 203,000 69,706 34.34
May-09 759,010 309,475 40.77 567,630 247,862 43.67 191,381 61,613 32.19
Jun-09 753,449 368,271 48.88 541,885 289,787 53.48 211,564 78,484 37.10
April-June 09 2,327,069 999,289 42.94 1,721,123 789,487 45.87 605,945 209,802 34.62 Source: NSE.
Settlement of Trades in Government Securities
During 2008-09, 270,244 trades in government securities amounting to Rs.62,545,192 million (USD $ 1,227,580) were settled by CCIL . Out of the total trades, 91% of the trades were outright transactions and the rest were repo.(Table 6-9).

www.nseindia.com
Debt Market ISMR143
Table 6-9: Settlement of Trades in Government Securities
Month Non Repo Transactions Repo Transactions Total
No. of Trades Amount (Face Value in
Rs.mn)
No. of Trades Amount (Face Value in
Rs.mn)
No. of Trades Amount (Face Value in
Rs.mn)
Amount (Face Value in
US$.mn)
2001-02 7,131 389,190 524 159,300 7,655 548,480 11,239
2002-03 191,843 10,761,470 11,672 4,682,290 203,515 15,443,760 325,132
2003-04 243,585 15,751,330 20,972 9,431,890 264,512 25,183,220 580,392
2004-05 160,682 11,342,221 24,364 15,579,066 185,046 26,921,287 615,344
2005-06 125,509 8,647,514 25,673 16,945,087 151,182 25,592,601 573,697
2006-07 137,100 10,215,357 29,008 25,565,014 166,108 35,780,371 802,071
2007-08 188,843 16,538,512 26,612 39,487,508 215,455 56,026,020 1,401,702
April-June 2008 39,161 3,612,876 5,648 9,940,022 44,809 13,552,898 315,551
2008-09 245,964 21,602,334 24,280 40,942,858 270,244 62,545,192 1,227,580
April-June 2009 83,736 7,934,332 7,934 15,137,353 91,670 23,071,685 481,965 Source:CCIL Fact Book
Developments in WDM Segment of NSE
As at end March 2009, 3,954 securities were available for trading on the WDM Segment, of which 711 securities were active during 2008-09 as compared to 601 in the previous year. During 2008-09, the turnover in the WDM segment of NSE registered an increase of 18.99% to Rs.3,359,515 million (US$ 65,937 million) from Rs. 2,823,170 million (US$ 70,632 million) in 2007-08. The average daily turnover also increased from Rs. 11,380 million (US $ 287.71 million) to Rs. 14,116 million (US$ 277.05 million) during the same period.
The summary statement of business growth of WDM segment is presented in Annexure 6-1 and Chart 6-2. The highest turnover of Rs. 492,055 million (US $ 9,658 million) was witnessed in March 2009. The average daily turnover ranged between Rs.6,054 million (US $ 119 million) and Rs. 25,898 million (US $ 508 million).
Chart 6-2: Business Growth of WDM Segment
www.nseindia.com
Debt MarketISMR 144
Securities Profi le
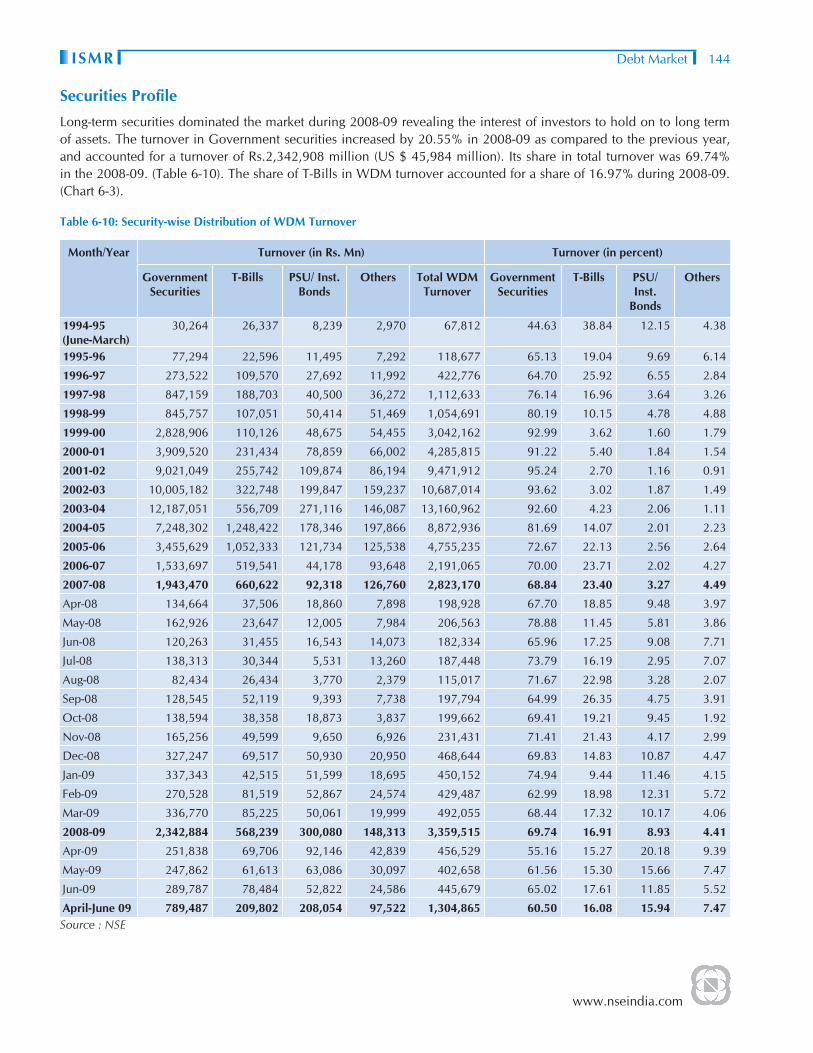
Long-term securities dominated the market during 2008-09 revealing the interest of investors to hold on to long term of assets. The turnover in Government securities increased by 20.55% in 2008-09 as compared to the previous year, and accounted for a turnover of Rs.2,342,908 million (US $ 45,984 million). Its share in total turnover was 69.74% in the 2008-09. (Table 6-10). The share of T-Bills in WDM turnover accounted for a share of 16.97% during 2008-09. (Chart 6-3).
Table 6-10: Security-wise Distribution of WDM Turnover
Month/Year Turnover (in Rs. Mn) Turnover (in percent)
Government Securities
T-Bills PSU/ Inst. Bonds
Others Total WDM Turnover
Government Securities
T-Bills PSU/ Inst.
Bonds
Others
1994-95 (June-March)
30,264 26,337 8,239 2,970 67,812 44.63 38.84 12.15 4.38
1995-96 77,294 22,596 11,495 7,292 118,677 65.13 19.04 9.69 6.14
1996-97 273,522 109,570 27,692 11,992 422,776 64.70 25.92 6.55 2.84
1997-98 847,159 188,703 40,500 36,272 1,112,633 76.14 16.96 3.64 3.26
1998-99 845,757 107,051 50,414 51,469 1,054,691 80.19 10.15 4.78 4.88
1999-00 2,828,906 110,126 48,675 54,455 3,042,162 92.99 3.62 1.60 1.79
2000-01 3,909,520 231,434 78,859 66,002 4,285,815 91.22 5.40 1.84 1.54
2001-02 9,021,049 255,742 109,874 86,194 9,471,912 95.24 2.70 1.16 0.91
2002-03 10,005,182 322,748 199,847 159,237 10,687,014 93.62 3.02 1.87 1.49
2003-04 12,187,051 556,709 271,116 146,087 13,160,962 92.60 4.23 2.06 1.11
2004-05 7,248,302 1,248,422 178,346 197,866 8,872,936 81.69 14.07 2.01 2.23
2005-06 3,455,629 1,052,333 121,734 125,538 4,755,235 72.67 22.13 2.56 2.64
2006-07 1,533,697 519,541 44,178 93,648 2,191,065 70.00 23.71 2.02 4.27
2007-08 1,943,470 660,622 92,318 126,760 2,823,170 68.84 23.40 3.27 4.49
Apr-08 134,664 37,506 18,860 7,898 198,928 67.70 18.85 9.48 3.97
May-08 162,926 23,647 12,005 7,984 206,563 78.88 11.45 5.81 3.86
Jun-08 120,263 31,455 16,543 14,073 182,334 65.96 17.25 9.08 7.71
Jul-08 138,313 30,344 5,531 13,260 187,448 73.79 16.19 2.95 7.07
Aug-08 82,434 26,434 3,770 2,379 115,017 71.67 22.98 3.28 2.07
Sep-08 128,545 52,119 9,393 7,738 197,794 64.99 26.35 4.75 3.91
Oct-08 138,594 38,358 18,873 3,837 199,662 69.41 19.21 9.45 1.92
Nov-08 165,256 49,599 9,650 6,926 231,431 71.41 21.43 4.17 2.99
Dec-08 327,247 69,517 50,930 20,950 468,644 69.83 14.83 10.87 4.47
Jan-09 337,343 42,515 51,599 18,695 450,152 74.94 9.44 11.46 4.15
Feb-09 270,528 81,519 52,867 24,574 429,487 62.99 18.98 12.31 5.72
Mar-09 336,770 85,225 50,061 19,999 492,055 68.44 17.32 10.17 4.06
2008-09 2,342,884 568,239 300,080 148,313 3,359,515 69.74 16.91 8.93 4.41
Apr-09 251,838 69,706 92,146 42,839 456,529 55.16 15.27 20.18 9.39
May-09 247,862 61,613 63,086 30,097 402,658 61.56 15.30 15.66 7.47
Jun-09 289,787 78,484 52,822 24,586 445,679 65.02 17.61 11.85 5.52
April-June 09 789,487 209,802 208,054 97,522 1,304,865 60.50 16.08 15.94 7.47 Source : NSE

www.nseindia.com
Debt Market ISMR145
Chart 6-3: Security-wise Distribution of Turnover, 2008-09
The share of top ‘10’ securities has decreased to 43.05% in 2008-09 as compared to 53.31% in 2007-08 (Table 6-12). The share of top ‘100’ securities increased substantially to 83..87% as against 49.55% during 2007-08. Top 50 securities accounted for 72.45 % of turnover in 2008-09.
Participant Profi le
Indian banks, foreign banks and PDs together accounted for over 51.95% of WDM turnover during 2008-09 and 49.18% of the WDM turnover during April-June 2009. The share of the Indian banks fell from 23.78% in 2007-08 to 18.11% in 2008-09. The trading member’s contribution was the highest at 44.65% during 2008-09. (Table 6-11 and Chart 6-4)
Chart 6-4: Participant-wise Distribution of Turnover, 2008-09

www.nseindia.com
Debt MarketISMR 146
Table 6-11: Participant wise Distribution of WDM Turnover(In per cent)
Month/Year Turnover
Trading Members
FIs/MFs/ Corporates
Primary Dealers
Indian Banks Foreign Banks
1994-95 (June-March) 57.82 6.43 0.02 14.16 21.57
1995-96 23.48 7.60 1.16 30.07 37.69
1996-97 22.95 3.81 6.10 30.01 37.13
1997-98 19.75 4.30 12.06 41.24 22.65
1998-99 15.48 4.93 14.64 42.12 22.83
1999-00 18.63 4.18 19.42 42.72 15.05
2000-01 23.24 4.18 22.14 33.54 16.90
2001-02 23.52 4.16 22.50 36.60 13.22
2002-03 24.81 3.77 22.03 38.77 10.62
2003-04 34.80 4.56 17.03 36.36 7.25
2004-05 33.96 5.14 18.50 29.89 12.51
2005-06 32.01 3.92 21.89 28.07 14.11
2006-07 30.88 2.70 19.82 26.03 20.57
2007-08 38.15 2.34 8.64 23.78 27.09
Apr-08 35.27 2.01 5.54 16.25 40.93
May-08 27.03 1.75 8.42 26.82 35.98
Jun-08 37.05 1.81 4.61 18.13 38.40
Jul-08 46.66 0.93 7.63 18.61 26.17
Aug-08 46.81 0.95 9.25 16.14 26.85
Sep-08 50.40 0.68 3.92 15.44 29.56
Oct-08 37.24 6.17 8.70 18.80 29.09
Nov-08 36.93 6.20 6.57 16.10 34.20
Dec-08 48.86 4.39 9.70 20.86 16.19
Jan-09 47.40 3.05 7.58 11.97 30.00
Feb-09 49.53 3.50 5.62 16.26 25.09
Mar-09 50.95 4.67 3.10 21.84 19.44
2008-09 44.65 3.40 6.58 18.11 27.26
Apr-09 51.19 2.98 6.08 17.05 22.70
May-09 47.44 3.12 4.77 19.01 25.66
Jun-09 44.66 2.96 5.30 18.60 28.48
April-June 09 47.80 3.02 5.41 18.18 25.59Source : NSE
Top ‘50’ trading members accounted for the total turnover of WDM in 2008-09, which is indicative of the narrow membership structure of WDM segment (Table 6-12). As on June 30, 2009, there were 63 members on the WDM segment.

www.nseindia.com
Debt Market ISMR147
Table 6-12: Share of Top ‘N’ Securities/Trading Members/ Participants in Turnover in WDM Segment
Year In Percent
Top 5 Top 10 Top 25 Top 50 Top 100
Securities
1994-95 42.84 61.05 80.46 89.81 97.16
1995-96 57.59 69.46 79.60 86.58 93.24
1996-97 32.93 48.02 65.65 78.32 90.17
1997-98 30.65 46.92 71.25 85.00 92.15
1998-99 26.81 41.89 64.30 78.24 86.66
1999-00 37.11 55.57 82.12 90.73 95.28
2000-01 42.20 58.30 80.73 89.97 95.13
2001-02 51.61 68.50 88.73 94.32 97.19
2002-03 43.10 65.15 86.91 92.74 96.13
2003-04 37.06 54.43 81.58 90.66 95.14
2004-05 43.70 57.51 71.72 80.59 89.55
2005-06 47.42 59.78 72.02 81.04 89.36
2006-07 40.90 51.29 65.82 77.15 86.91
2007-08 39.65 53.31 68.35 79.64 49.55
2008-09 31.31 43.05 60.42 72.45 83.87
April-June 09 23.80 36.52 56.63 71.36 84.24
Trading Members
1994-95 51.99 73.05 95.37 100.00 --
1995-96 44.36 68.58 96.10 100.00 --
1996-97 30.02 51.27 91.57 99.96 100.00
1997-98 27.17 47.85 83.38 99.82 100.00
1998-99 29.87 50.45 86.55 99.98 100.00
1999-00 32.38 53.41 84.46 100.00 --
2000-01 35.17 54.25 86.82 100.00 --
2001-02 35.18 58.68 88.36 100.00 --
2002-03 31.77 53.71 85.49 100.00 --
2003-04 30.72 53.01 86.71 100.00 --
2004-05 35.75 56.84 86.74 100.00 --
2005-06 39.68 60.63 89.38 100.00 --
2006-07 57.75 78.01 96.43 100.00 --
2007-08 65.32 80.24 97.60 100.00 --
2008-09 69.92 82.89 98.38 100.00 --
April-June 09 74.78 87.35 99.06 100.00 --
Participants
1994-95 18.37 27.38 38.40 42.20 --
1995-96 29.66 47.15 70.49 76.32 76.58
1996-97 25.27 44.92 67.00 76.33 77.10
1997-98 23.60 38.96 65.59 77.96 80.22
1998-99 22.47 37.39 62.79 79.27 84.51
1999-00 15.54 27.87 52.51 74.76 81.32
Contd.
www.nseindia.com
Debt MarketISMR 148
Year In Percent
Top 5 Top 10 Top 25 Top 50 Top 100
2000-01 17.51 28.85 50.64 69.72 76.78
2001-02 17.49 29.25 50.19 69.16 76.49
2002-03 17.27 28.29 49.22 68.14 75.20
2003-04 16.66 25.69 44.25 59.87 65.17
2004-05 16.82 28.64 47.24 61.71 66.00
2005-06 17.50 30.53 53.61 65.84 67.97
2006-07 25.85 40.65 59.99 68.17 69.09
2007-08 28.36 40.64 55.58 61.77 61.84
2008-09 24.08 38.24 51.19 55.34 55.38
April-June 09 23.38 36.15 49.05 52.17 -
Market Capitalisation
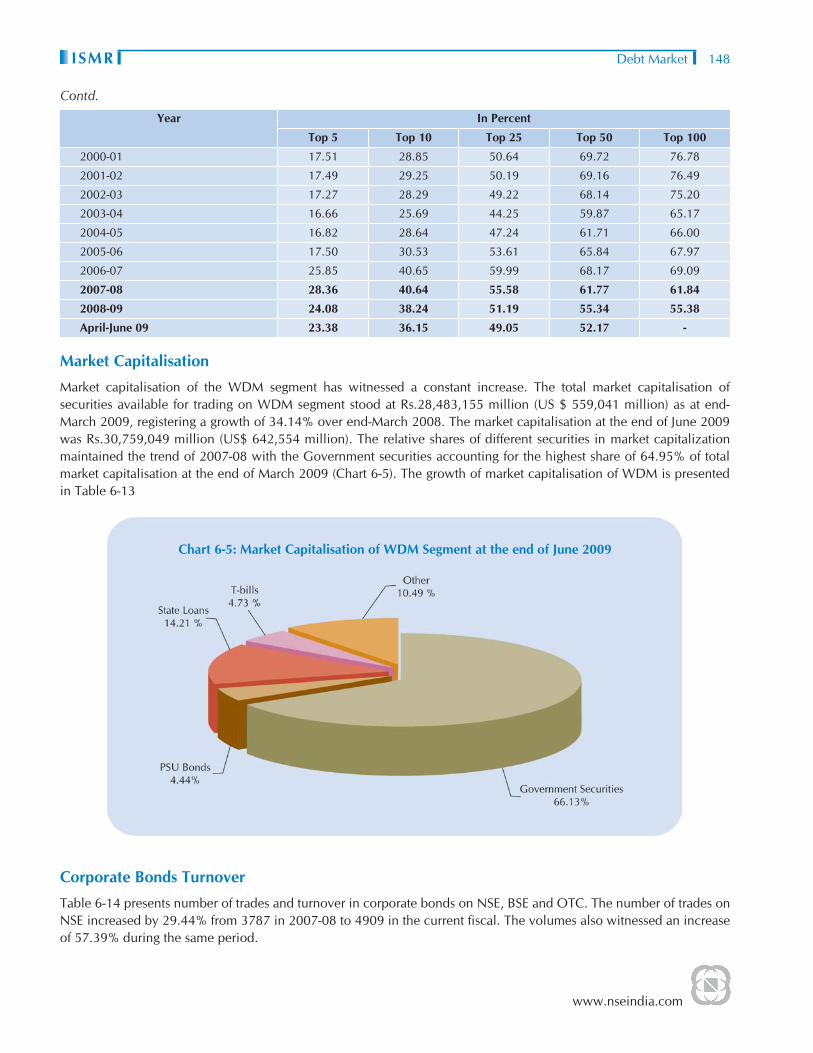
Market capitalisation of the WDM segment has witnessed a constant increase. The total market capitalisation of securities available for trading on WDM segment stood at Rs.28,483,155 million (US $ 559,041 million) as at end- March 2009, registering a growth of 34.14% over end-March 2008. The market capitalisation at the end of June 2009 was Rs.30,759,049 million (US$ 642,554 million). The relative shares of different securities in market capitalization maintained the trend of 2007-08 with the Government securities accounting for the highest share of 64.95% of total market capitalisation at the end of March 2009 (Chart 6-5). The growth of market capitalisation of WDM is presented in Table 6-13
Chart 6-5: Market Capitalisation of WDM Segment at the end of June 2009
Corporate Bonds Turnover
Table 6-14 presents number of trades and turnover in corporate bonds on NSE, BSE and OTC. The number of trades on NSE increased by 29.44% from 3787 in 2007-08 to 4909 in the current fi scal. The volumes also witnessed an increase of 57.39% during the same period.
Contd.

www.nseindia.com
Debt Market ISMR149
Tabl
e 6-
13: M
arke
t Cap
italis
atio
n of
WD
M S
ecur
ities
Mon
th/Y
ear
(end
of
peri
od)
Mar
ket C
apita
lisat
ion
(In R
s. m
n.)
(In p
er c
ent)
Gov
t. Se
curi
ties
PSU
bon
dsSt
ate
loan
sT-
bills
Oth
ers
Tota
lTo
tal (
US
$ m
n.)
Gov
t. se
curi
ties
PSU
bo
nds
Stat
e lo
ans
T-bi
lls
Oth
ers
Mar
-00
3,19
8,65
039
3,57
039
4,77
015
3,45
079
9,89
04,
940,
330
113,
257
64.7
57.
977.
993.
1116
.19
Mar
-01
3,97
2,28
036
3,65
044
6,24
017
7,25
084
8,94
05,
808,
360
124,
536
68.3
96.
267.
683.
0514
.62
Mar
-02
5,42
6,01
039
9,44
061
3,85
023
8,49
089
0,16
07,
567,
950
155,
081
71.7
05.
288.
113.
1511
.76
Mar
-03
6,58
0,01
738
3,82
872
0,94
034
9,18
861
0,83
98,
644,
812
181,
996
76.1
24.
448.
344.
047.
06
Mar
-04
9,59
3,01
756
8,31
979
3,40
332
6,92
087
6,97
912
,158
,638
280,
218
78.9
04.
676.
532.
697.
21
Mar
-05
10,0
61,0
7068
3,98
12,
232,
082
735,
018
905,
193
14,6
17,3
4433
4,11
168
.83
4.68
15.2
75.
036.
19
Mar
-06
10,5
97,8
9088
7,16
02,
419,
270
701,
860
1,06
9,56
015
,675
,740
351,
395
67.6
15.
6615
.43
4.48
6.82
Mar
-07
11,
822,
777
896
,275
2
,498
,474
1
,151
,827
1
,478
,652
1
7,84
8,00
6 40
9,45
266
.24
5.02
14.0
06.
458.
28
Mar
-08
13,
922,
192
962
,685
3
,156
,607
1
,115
,621
2
,076
,357
2
1,23
3,46
3 53
1,23
565
.57
4.53
14.8
75.
259.
77
Apr
-08
14,
376,
427
985
,243
3
,147
,158
1
,102
,799
2
,074
,881
2
1,68
6,50
8 42
5,64
366
.29
4.54
14.5
15.
099.
57
May
-08
14,
387,
430
988
,451
3
,179
,717
1
,264
,692
2
,101
,541
2
1,92
1,83
1 43
0,26
265
.63
4.51
14.5
05.
779.
59
Jun-
08 1
4,34
0,71
6 1
,010
,848
3
,170
,955
1
,330
,607
2
,096
,483
2
1,94
9,60
9 43
0,80
765
.33
4.61
14.4
56.
069.
55
Jul-0
8 1
4,24
3,69
0 1
,012
,002
3
,198
,269
1
,334
,877
2
,078
,429
2
1,86
7,26
7 42
9,19
165
.14
4.63
14.6
36.
109.
50
Aug
-08
14,
553,
971
1,0
38,6
58
3,2
24,4
69
1,3
37,6
84
2,1
01,1
67
22,
255,
949
436,
819
65.3
94.
6714
.49
6.01
9.44
Sep-
08 1
4,71
5,64
9 1
,083
,301
3
,254
,749
1
,351
,873
2
,137
,082
2
2,54
2,65
5 44
2,44
765
.28
4.81
14.4
46.
009.
48
Oct
-08
15,
358,
258
1,0
89,2
16
3,2
42,1
75
1,4
16,8
01
2,1
89,5
93
23,
296,
043
457,
233
65.9
34.
6813
.92
6.08
9.40
Nov
-08
16,
219,
418
1,1
11,7
80
3,3
29,2
32
1,4
61,5
41
2,3
03,7
20
24,
425,
692
479,
405
66.4
04.
5513
.63
5.98
9.43
Dec
-08
18,
082,
701
1,1
91,6
53
3,4
47,2
10
1,4
18,8
78
2,5
48,7
18
26,
689,
159
523,
830
67.7
54.
4612
.92
5.32
9.55
Jan-
09 1
8,48
1,28
1 1
,290
,699
3
,642
,041
1
,451
,215
2
,653
,641
2
7,51
8,87
6 54
0,11
567
.16
4.69
13.2
35.
279.
64
Feb-
09 1
8,68
6,84
1 1
,296
,090
3
,768
,197
1
,443
,362
2
,905
,377
2
8,09
9,86
7 55
1,51
866
.50
4.61
13.4
15.
1410
.34
Mar
-09
18,
499,
710
1,2
94,9
88
4,2
23,6
16
1,4
76,1
71
2,9
88,6
70
28,
483,
155
559,
041
64.9
54.
5514
.83
5.18
10.4
9
Apr
-09
19,
595,
344
1,3
19,9
30
4,2
36,8
84
1,6
15,9
08
3,1
15,2
58
29,
883,
325
624,
260
65.5
74.
4214
.18
5.41
10.4
2
May
-09
19,
837,
401
1,3
51,3
86
4,3
13,7
08
1,4
65,3
11
3,1
16,2
63
30,
084,
069
628,
453
65.9
44.
4914
.34
4.87
10.3
6
Jun-
09 2
0,34
1,62
7 1
,365
,869
4
,369
,455
1
,453
,911
3
,228
,187
3
0,75
9,04
9 64
2,55
466
.13
4.44
14.2
14.
7310
.50

www.nseindia.com
Debt MarketISMR 150
Table 6-14: Secondary Market Corporate Bond Trades at the Exchanges and OTC
Month/ Year BSE NSE FIMMDA
No. of trades Amount (Rs. Mn) No. of trades Amount (Rs. Mn) No. of trades Amount (Rs. Mn)
2007-08 27,697 411,870 3,787 314,530 4,089 234,790
2008-09 417,376 380,580 4,902 495,050 9,585 615,350
Apr-08 1,912 26,900 213 27,680 714 46,150
May-08 1,804 42,070 256 21,340 780 37,150
Jun-08 2,067 35,870 397 32,770 884 32,990
Jul-08 1,462 14,010 181 22,260 638 29,100
Aug-08 3,012 12,110 73 8,650 590 21,740
Sep-08 42,243 26,520 187 25,520 738 43,730
Oct-08 75,925 25,170 244 25,540 741 27,310
Nov-08 70,671 16,110 147 18,590 508 20,660
Dec-08 73,310 57,870 889 78,120 1,096 115,040
Jan-09 58,507 65,050 757 78,980 1,111 122,060
Feb-09 41,225 27,420 753 81,190 749 55,360
Mar-09 45,238 31,480 805 74,410 1,036 64,070
Note : The data on corporate bonds at NSE and BSE includes the trades on the respective trading systems as well as the reporting of trades carried out at OTC
Yields
The yields (yield-to-maturity) on government and corporate securities of different maturities of 0-1 year, 5-6 years, 9-10 years and above 10 years are presented in (Table 6-15). The yields on government and corporate securities showed a downward trend towards the end of 2008-09.
Table 6-15: Yields on Government and Corporate Securities(In per cent)
Month/ Year Government Securities Corporate Securities
0-1 year 5-6 years 9-10 years Above 10 years
0-1 year 5-6 years 9-10 years Above 10 years
Apr-07 7.34 8.14 8.14 8.45 9.60 10.53 10.04 10.12
May-07 7.30 8.02 8.17 8.39 9.72 10.30 10.00 10.04
Jun-07 7.02 7.90 8.23 8.49 8.63 10.11 10.08 10.30
Jul-07 5.24 7.26 7.86 8.17 7.46 8.78 9.65 9.52
Aug-07 6.73 7.69 7.90 8.30 8.78 9.42 9.57 9.69
Sep-07 7.10 7.68 7.83 8.34 8.74 9.36 9.97 9.91
Oct-07 6.97 7.72 7.87 8.40 8.42 9.17 9.58 9.62
Nov-07 7.47 7.77 7.90 8.28 0.00 9.09 9.45 9.58
Dec-07 7.58 7.79 7.87 8.16 8.69 9.04 9.39 9.45
Jan-08 7.11 7.48 7.60 7.88 8.94 8.98 9.06 9.22
Contd.

www.nseindia.com
Debt Market ISMR151
Month/ Year Government Securities Corporate Securities
0-1 year 5-6 years 9-10 years Above 10 years
0-1 year 5-6 years 9-10 years Above 10 years
Feb-08 7.15 7.45 7.53 7.78 9.71 9.17 9.24 9.37
Mar-08 7.24 7.55 7.69 8.20 8.54 9.45 9.38 9.47
Apr-08 7.10 7.85 8.00 8.46 8.82 9.53 9.49 9.65
May-08 7.31 7.83 7.97 8.54 8.75 9.40 9.64 9.62
Jun-08 8.30 8.58 8.40 9.15 9.81 10.02 9.88 9.97
Jul-08 9.08 9.29 9.24 9.58 10.38 10.85 10.81 10.52
Aug-08 9.23 9.21 9.04 9.70 0.00 10.37 11.14 10.92
Sep-08 8.91 8.80 8.43 9.01 11.25 11.25 10.92 10.88
Oct-08 7.53 7.72 7.88 8.39 13.38 11.67 11.49 10.98
Nov-08 7.08 7.25 7.39 8.02 11.71 12.17 11.23 10.96
Dec-08 5.83 6.02 6.29 7.18 11.06 9.81 9.24 9.44
Jan-09 4.59 5.41 5.78 6.91 7.95 8.57 8.93 8.81
Feb-09 4.59 5.39 6.46 7.18 8.71 8.67 9.30 9.09
Mar-09 5.00 5.76 6.85 7.72 8.29 8.35 9.37 9.15
Apr-09 3.68 5.49 6.45 7.24 6.51 7.52 8.49 8.86
May-09 3.28 5.12 6.49 7.32 6.00 7.15 8.53 8.36
Jun-09 3.69 5.74 6.81 7.49 5.45 7.59 8.69 8.82
Source: NSE.
WDM Products And Services
Zero Coupon Yield Curve
Keeping in mind the requirements of the banking industry, fi nancial institutions, mutual funds, insurance companies, that have substantial investment in sovereign papers, NSE disseminates a ‘Zero Coupon Yield Curve’ (NSE Zero Curve) to help in valuation of securities across all maturities irrespective of its liquidity in the market. This product has been developed by using Nelson-Siegel model to estimate the term structure of interest rate at any given point of time and been successfully tested by using daily WDM trades data. This is being disseminated daily.
The ZCYC depicts the relationship between interest rates in the economy and the associated terms to maturity. It provides daily estimates of the term structure of interest rates using information on secondary market trades in government securities from the WDM segment. The term structure forms the basis for the valuation of all fi xed income instruments. Modeled as a series of cash fl ows due at different points of time in the future, the underlying price of such an instrument is calculated as the net present value of the stream of cash fl ows. Each cash fl ow, in such a formulation, is discounted using the interest rate for the associated term to maturity; the appropriate rates are read off the estimated ZCYC. Once estimated, the interest rate-maturity mapping is used to compute underlying valuations even for securities that do not trade on a given day. The daily ZCYC captures the changes in term structure, and is used to track the value of portfolios of government securities on a day-to-day basis. The estimates of daily ZCYC are available from February 1998.(Chart 6-6) plots the spot interest rates at different maturities for the period April 2008 till June 2009.
Contd.

www.nseindia.com
Debt MarketISMR 152
Chart 6-6: Zero Coupon Yield Curve, April 2008 - June 2009
FIMMDA-NSE MIBID /MIBOR
A reference rate is an accurate measure of the market price. In the fi xed income market, it is an interest rate that the market respects and closely matches. On these lines, NSE has been computing and disseminating the NSE Mumbai Inter-bank Bid Rate (MIBID) and NSE Mumbai Inter-bank Offer Rate (MIBOR) for the overnight money market from June 15, 1998, the 14-day MIBID/MIBOR from November 10, 1998, the 1 month and 3 month MIBID/MIBOR from December 1, 1998 and the 3 day MIBID/MIBOR from, June 06,2008 which is calculated and disseminated on every last working day of the week. In view of the robust methodology of computation of these rates and their extensive use by market participants, these have been co-branded with Fixed Income and Money Market Dealers Association (FIMMDA) from March 4, 2002. These are now known as FIMMDA-NSE MIBID/MIBOR.
FIMMDA-NSE MIBID/MIBOR are based on rates polled by NSE from a representative panel of 33 banks/institutions/ primary dealers. Currently, quotes are polled and processed daily by the Exchange at 0940 (IST) for overnight rate, at 1130 (IST) for the 14 day, 1 month and 3 month rates and 0940 (IST) for 3 Day rate as on the last working day of the week. The rates polled are then processed using the bootstrap method to arrive at an effi cient estimate of the reference rates. The overnight rates are disseminated daily and 3 Day rate are disseminated on the last working day of the week to the market at about 0955 (IST). The 14 day, 1 month and 3 month rates at about 1145 (IST).Overnight Rates for Saturdays is calculated and disseminated at 1030Hrs.
The FIMMDA-NSE MIBID/MIBOR rates for month ends are presented in (Annexure 6-2). The daily FIMMDA-NSE MIBID/MIBOR rates are available at www.nseindia.com. (Chart 6-7) presents overnight FIMMDA-NSE MIBID/MIBOR from April 2008 to June 2009. These rates touched the peak of 19.14% and 20.30%, respectively, on October 31, 2008 and the low of 3.03 and 3.16%, respectively, on May 06, 2009.

www.nseindia.com
Debt Market ISMR153
Chart 6-7: Overnight NSE-FIMMDA MIBID/MIBOR Rates, April 2008 - June 2009
NSE-VaR System
NSE has developed a VaR system for measuring the market risk inherent in Government of India (GOI) securities. NSEVaR system builds on the NSE database of daily yield curves (ZCYC) and provides measures of VaR using 5 alternative methods (variance-covariance, historical simulation method, weighted normal, weighted historical simulation and extreme value method). Together, these 5 methods provide a range of options for market participants to choose from. NSE-VaR system releases daily estimates of security-wise VaR at 1-day and multi-day horizons for securities traded on WDM segment of NSE and all outstanding GoI securities with effect from January 1, 2002. Participants can compute their portfolio risk as weighted average of security-wise VaRs, the weights being proportionate to the market value of a given security in their portfolio. 1-day VaR (99%) measure for GoI Securities traded on NSE-WDM on June 30, 2009 is presented in (Table 6-16). The VaR for other GOI securities are available at www.nseindia.com.
Table 6-16: 1-day VaR (99%) for GoI Securities Traded on NSE-WDM as on June 30, 2009
Security Type
Security Name
Issue Name VaR (%) Clean Price (off
NSE-ZCYC) Normal Weighted Normal
Historical Simulation
Weighted Historical Simulation
EVT
GS CG2010 5.87% 0.46 0.90 0.56 0.67 0.50 99.98
GS CG2012 7.00% 1.06 2.00 1.29 1.17 1.11 101.86
GS CG2012 7.40% 1.03 2.00 1.26 3.18 1.09 102.84
GS CG2014 6.07% 1.20 1.96 1.35 1.21 1.05 97.86
GS CG2016 7.59% 1.31 1.98 1.40 1.79 1.13 104.08
GS CG2017 7.46% 1.46 2.05 1.57 1.60 1.21 102.89
GS CG2017 8.07% 1.37 1.99 1.44 1.72 1.16 106.72
Contd.
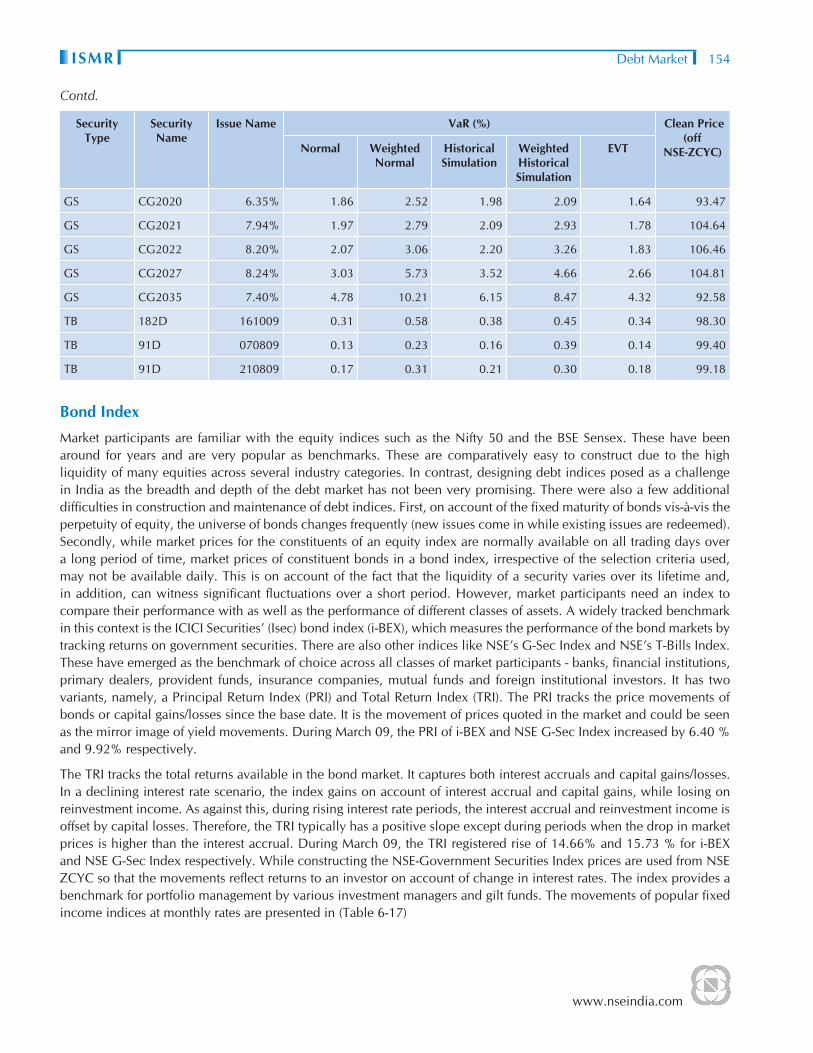
www.nseindia.com
Debt MarketISMR 154
Security Type
Security Name
Issue Name VaR (%) Clean Price (off
NSE-ZCYC) Normal Weighted Normal
Historical Simulation
Weighted Historical Simulation
EVT
GS CG2020 6.35% 1.86 2.52 1.98 2.09 1.64 93.47
GS CG2021 7.94% 1.97 2.79 2.09 2.93 1.78 104.64
GS CG2022 8.20% 2.07 3.06 2.20 3.26 1.83 106.46
GS CG2027 8.24% 3.03 5.73 3.52 4.66 2.66 104.81
GS CG2035 7.40% 4.78 10.21 6.15 8.47 4.32 92.58
TB 182D 161009 0.31 0.58 0.38 0.45 0.34 98.30
TB 91D 070809 0.13 0.23 0.16 0.39 0.14 99.40
TB 91D 210809 0.17 0.31 0.21 0.30 0.18 99.18
Bond Index
Market participants are familiar with the equity indices such as the Nifty 50 and the BSE Sensex. These have been around for years and are very popular as benchmarks. These are comparatively easy to construct due to the high liquidity of many equities across several industry categories. In contrast, designing debt indices posed as a challenge in India as the breadth and depth of the debt market has not been very promising. There were also a few additional diffi culties in construction and maintenance of debt indices. First, on account of the fi xed maturity of bonds vis-à-vis the perpetuity of equity, the universe of bonds changes frequently (new issues come in while existing issues are redeemed). Secondly, while market prices for the constituents of an equity index are normally available on all trading days over a long period of time, market prices of constituent bonds in a bond index, irrespective of the selection criteria used, may not be available daily. This is on account of the fact that the liquidity of a security varies over its lifetime and, in addition, can witness signifi cant fl uctuations over a short period. However, market participants need an index to compare their performance with as well as the performance of different classes of assets. A widely tracked benchmark in this context is the ICICI Securities’ (Isec) bond index (i-BEX), which measures the performance of the bond markets by tracking returns on government securities. There are also other indices like NSE’s G-Sec Index and NSE’s T-Bills Index. These have emerged as the benchmark of choice across all classes of market participants - banks, fi nancial institutions, primary dealers, provident funds, insurance companies, mutual funds and foreign institutional investors. It has two variants, namely, a Principal Return Index (PRI) and Total Return Index (TRI). The PRI tracks the price movements of bonds or capital gains/losses since the base date. It is the movement of prices quoted in the market and could be seen as the mirror image of yield movements. During March 09, the PRI of i-BEX and NSE G-Sec Index increased by 6.40 % and 9.92% respectively.
The TRI tracks the total returns available in the bond market. It captures both interest accruals and capital gains/losses. In a declining interest rate scenario, the index gains on account of interest accrual and capital gains, while losing on reinvestment income. As against this, during rising interest rate periods, the interest accrual and reinvestment income is offset by capital losses. Therefore, the TRI typically has a positive slope except during periods when the drop in market prices is higher than the interest accrual. During March 09, the TRI registered rise of 14.66% and 15.73 % for i-BEX and NSE G-Sec Index respectively. While constructing the NSE-Government Securities Index prices are used from NSE ZCYC so that the movements refl ect returns to an investor on account of change in interest rates. The index provides a benchmark for portfolio management by various investment managers and gilt funds. The movements of popular fi xed income indices at monthly rates are presented in (Table 6-17)
Contd.

www.nseindia.com
Debt Market ISMR155
Table 6-17: Debt Market Indices
At the end of the month
I Sec I-BEX (Base August 1, 1994=1000)
NSE-T-Bills Index NSE-G Sec Index
TRI PRI TRI PRI TRI PRI
Apr-08 4411.69 1247.01 241.18 241.18 265.37 109.66
May-08 4412.02 1239.23 242.83 242.83 265.93 109.32
Jun-08 4289.21 1196.03 243.85 243.85 249.21 101.85
Jul-08 4218.50 1167.81 245.13 245.13 248.93 100.96
Aug-08 4319.70 1187.82 246.86 246.86 255.48 103.34
Sep-08 4419.90 1207.19 248.75 248.75 258.78 104.24
Oct-08 4797.75 1304.81 251.79 251.79 280.59 112.71
Nov-08 4941.12 1336.11 253.03 253.03 288.74 115.41
Dec-08 5515.46 1485.83 253.79 253.79 319.99 127.75
Jan-09 5289.97 1415.41 257.56 257.56 306.33 121.54
Feb-09 5193.69 1381.12 258.36 258.36 304.14 120.26
Mar-09 5096.95 1345.71 259.88 259.88 305.55 120.42
Apr-09 5314.32 1395.98 260.57 260.57 305.83 120.04
May-09 5220.20 1362.53 261.14 261.14 299.23 117.15
Jun-09 5204.11 1349.98 261.74 261.74 297.20 115.92
Source : ICICI Securities and NSE
Policy Debates
Developing the corporate bond market2
A well developed corporate bond market is essential for fi nancial system effi ciency, stability and overall economic growth. It provides fi nancial diversifi cation and facilitates necessary fi nancing for corporates and infrastructure developers. However, this market remains practically non-existent in India imposing a constraint on India’s ability to fi nance its growing needs of debt particularly for infrastructure development.
While globally bond markets are many more time the size of equity market, in India the size of corporate debt market has remained insignifi cant in comparison to that of equity. According to ADB Working Paper (2008), corporate debt market accounts for 3.9% of GDP in India, while the same accounts for 61% in Korea and 37.5% in Malaysia. The outstanding corporate debt composition is also skewed towards private placement (92%). The ratio of equity market capitalization to GDP increased from 32.1% in 1996 to 108% in March 2008. Over the same period, the bond market grew to 40 % of GDP from 21.3%. Out of that Government bond market represented 36.1% of GDP while the corporate bond accounted for a meager 3.9%. In absolute terms, India’s corporate bond market is miniscule at USD 45 billion in March 2008 compared to USD 570 billion for Republic of Korea and USD 175 billion for China in the same period.
The reasons for the near-absence of a corporate bond market can be divided into constraints that limit the demand for the bonds, and constraints that limit the issuance of the bonds.
2 The arguments presented here have been largely drawn from an article by Anupam Mitra, titled “Why Corporate bond market in India is in Nelson’s low level equilibrium trap for so long?”, which appeared in the March 2009 issue of NSE NEWS. These do not necessary represent the views or suggested approach of NSE.

www.nseindia.com
Debt MarketISMR 156
On the demand side, pension funds, who could be large buyers of corporate debt, are constrained by their prudential norms and conservative investment policies. They are regulated to invest under 10% of the funds collected in corporate bonds that are investment grade. In addition, regulations require that once subscribed to they have to be held to maturity. Similarly, the provident funds for the Central and State Government employees, the Employees Provident Fund Organization and Public Provident Fund, have huge assets under their management. However, they too are subject to stringent regulatory restrictions. Further, banks tend to prefer loans to bonds, because loans can be carried on the books without being marked to market, thus reducing the possibility of unexpected demands on bank capital. The internal organization of the bank also inhibits demand – corporate bond portfolios are managed by the treasury, while loans are managed by credit departments, creating barriers between the two forms of lending.
Foreign investors are allowed only to a very limited extent into the market (a total of $15 billion). Given the very limited liquidity, they are not always eager to even take up the available quota. Also, a possible explanation for the general lack of interest in this asset class could be due to absence of a reliable system of resolving fi nancial distress so that investors are reluctant to buy unsecured bonds in contrast to lending secured debt, especially those of high risk fi rm.
On the supply side, most of the large issuers are quasi-government, including banks, public sector oil companies, or government sponsored fi nancial institutions. The private corporate sector prefers to go in for private placements of bonds owing to cumbersome primary issuance mechanism (to some extent addressed by recent changes in the regulations by the market regulator, SEBI); absence of sub-investment grade securities and missing derivatives markets in bonds are some of the problems confronting the bond markets. Also, until the recent credit crisis, larger corporate issuers had access to much cheaper funds in the offshore debt capital markets. Even after hedging their currency risks, the total cost of borrowing offshore is much lower than the cost of borrowing in the domestic market.
Thus, the corporate bond market is locked in a low level equilibrium trap by a vicious cycle. The existing stock of outstanding corporate bonds is not suffi cient to create a deep and liquid secondary market. Costly issuance process with rigid norms for self registration, poor price discovery etc. are deterrent for issuers to access primary market. Thus, lower outstanding stock of corporate bonds results in low liquidity in secondary market thereby preventing potential investors who are keen to invest but not hold securities till maturity. Because there is low liquidity, issuers are not sure that price discovery will be effi cient and fair. As a result issuers who are capable are more comfortable with accessing the private placement route where terms can be negotiated from a position of strength in ones’ favour.
To usher in vibrancy and liquidity in the corporate bond market would require bold reforms to be implemented in tandem since many of the problems are interlinked.
The recent Government Committee on Financial Sector Reforms, has inter-alia, made the following recommendations to help revive the corporate bond market: (i) Allow domestic fi nancial institutions greater leeway to invest in corporate bonds (ii) Steadily raise the limit on foreign investment in corporate bonds (iii) Amend the bankruptcy code so that the rights of unsecured creditors are protected (iv) Reduce the transactions costs in issuing and trading corporate bonds, including repeated onerous disclosures (move instead to a shelf-registration scheme), as well as high stamp duties (v) Reduce the artifi cial preference of banks for loans by subjecting loans and bonds to similar mark-to-market requirements, especially for aspects such as interest rate exposure that are easily measured.
Some other measures that could help vitalize the corporate bond markets are permitting Credit Default Swaps (CDSs) and repos in corporate bonds. CDSs offer insurance to the bond holder against default in interest or principal repayment. Repos allow dealers to operate with funded portfolios so as to be able to offer quotes at low spreads. These two can be important instruments that can help encourage investors in corporate bond market.

www.nseindia.com
Debt Market ISMR157
Ann
exur
e 6-
1: B
usin
ess
Gro
wth
of W
DM
Seg
men
t
Mon
th/Y
ear
All
Trad
esRe
tail
Trad
es
No.
of
Act
ive
Secu
ritie
s
Num
ber
of
Trad
esTu
rnov
er
(Rs.
mn.
)A
vera
ge
Dai
ly
Turn
over
(R
s. m
n.)
Ave
rage
Tr
ade
Size
(R
s. m
n.)
Turn
over
(U
S $
mn.
)A
vera
ge
Dai
ly
Turn
over
(U
S $
mn.
)
Num
ber
of
Trad
esTu
rnov
er
(Rs.
mn.
)Tu
rnov
er
(US
$ m
n.)
Shar
e in
Tot
al
Turn
over
(%
)
2000
-01
1,0
38
64,
470
4,28
5,81
5 1
4,83
0 66
.48
91,
891
318
498
1,31
828
.26
0.03
2001
-02
979
144,
851
9,47
1,91
232
,775
65.3
9 1
94,0
97
672
378
1,09
422
.42
0.01
2002
-03
1,12
316
7,77
810
,687
,014
35,9
8363
.70
224
,990
75
81,
252
2,99
563
.05
0.03
2003
-04
1,07
818
9,51
813
,160
,962
44,7
6569
.44
303
,318
1,
032
1,40
03,
317
76.4
50.
03
2004
-05
1,1
51
124,
308
8,87
2,93
630
,283
71.3
8 2
02,8
10
692
1,27
84,
101
93.7
40.
05
2005
-06
897
61,
891
4,7
55,2
35
17,
547
76.8
3 1
06,5
96
393
892
3
,104
69
.58
0.0
7
2006
-07
762
1
9,57
5 2
,191
,065
8
,980
11
1.93
50,
265
206
399
1
,015
23
.29
0.0
5
2007
-08
601
1
6,17
9 2
,823
,170
1
1,38
0 17
4.50
70,
632
285
211
4
90
12.2
6 0
.02
Apr
-08
122
1
,016
1
98,9
28
9,9
46
195.
80 3
,904
19
56
210.
410.
01
May
-08
137
1
,200
2
06,5
63
10,
328
172.
14 4
,054
20
33
3.50
0.07
0.00
2
Jun-
08 1
90
956
1
82,3
34
8,6
83
190.
73 3
,579
17
010
620
33.
980.
11
Jul-0
8 1
27
815
1
87,4
48
8,1
50
230.
00 3
,679
16
010
340.
670.
02
Aug
-08
75
594
1
15,0
17
6,0
54
193.
63 2
,257
11
916
500.
980.
04
Sep-
08 1
24
783
1
97,7
94
9,8
90
252.
61 3
,882
19
412
340.
670.
02
Oct
-08
126
9
22
199
,662
1
1,09
2 21
6.55
3,9
19
218
1024
0.48
0.01
Nov
-08
140
1
,093
2
31,4
31
12,
857
211.
74 4
,542
25
27
280.
550.
01
Dec
-08
218
2
,857
4
68,6
44
22,
316
164.
03 9
,198
43
811
601.
180.
01
Jan-
09 2
32
2,2
18
450
,152
2
2,50
8 20
3.00
8,8
35
442
1548
0.94
0.01
Feb-
09 2
21
1,8
91
429
,487
2
2,60
5 22
7.10
8,4
30
444
2858
1.13
0.01
Mar
-09
265
1
,784
4
92,0
55
25,
898
275.
80 9
,658
50
833
721.
410.
01
2008
-09
711
1
6,12
9 3
,359
,515
1
4,11
6 20
8.3
65,
937
277
257
635
12.4
70.
02
Apr
-09
313
2
,408
4
56,5
29
28,
533
189.
6 9
,537
59
6 1
4 5
4 1.
130.
01
May
-09
270
2
,089
4
02,6
58
20,
133
192.
8 8
,411
42
1 8
3
6 0.
750.
01
Jun-
09 2
43
1,9
48
445
,679
2
0,25
8 22
8.8
9,3
10
423
26
75
1.57
0.02
Apr
il-Ju
ne 2
009
501
6
,445
1
,304
,865
2
2,49
8 20
2.46
27,
259
470
48
165
3.
450.
01
Sour
ce :
NSE

www.nseindia.com
Debt MarketISMR 158
Annexure 6-2: FIMMDA NSE MIBID/MIBOR Rates
Month/Date Overnight at9.40 A.M.
3 Day at 9.40 A.M. 14 Day at 11.30 A.M.
1 Month rate at 11.30 A.M.
3 Month rate at 11.30 A.M.
MIBID MIBOR MIBID MIBOR MIBID MIBOR MIBID MIBOR MIBID MIBOR
30-Apr-08 7.79 8.77 6.28 7.41 6.73 7.87 7.79 8.77
31-May-08 7.53 7.93 6.51 7.53 6.88 8.07 7.89 8.87
30-Jun-08 8.69 8.77 8.65 8.76 8.59 9.13 8.90 9.56 9.39 9.94
31-Jul-08 8.37 8.51 9.04 9.14 8.58 9.28 9.07 9.89 9.62 10.39
30-Aug-08 9.38 9.49 6.16 6.26 9.53 10.12 9.98 10.55 10.44 11.22
29-Sep-08 13.87 14.57 11.11 11.50 10.75 11.84 10.78 11.77 10.97 11.86
31-Oct-08 19.14 20.30 19.48 20.73 10.24 10.63 10.13 11.08 10.84 11.73
29-Nov-08 6.48 6.82 6.44 6.54 9.25 8.10 9.88 8.97 10.63 10.43
31-Dec-08 5.17 5.27 5.74 5.85 6.27 7.19 7.58 8.04 8.45 8.89
31-Jan-09 4.17 4.23 4.15 4.25 5.30 5.68 6.00 6.44 7.05 7.83
28-Feb-09 4.10 4.16 4.03 4.10 5.04 5.37 5.72 6.18 6.99 7.64
31-Mar-09 4.78 5.02 4.70 4.84 5.04 5.61 5.68 6.26 7.07 7.64
29-Apr-09 3.24 3.31 3.25 3.31 3.43 3.87 4.06 4.42 5.18 5.64
30-May-09 3.22 3.30 3.21 3.27 3.31 3.74 3.81 4.16 4.84 5.29
30-Jun-09 3.22 3.30 3.22 3.28 3.10 3.46 3.48 3.82 4.35 4.72
Overnight : Disseminated since June 15, 1998.3 day :disseminated since June 06, 2008 is calculated and disseminated on every last working day of the week14 Day : Disseminated since November 10, 1998. 1 month : Disseminated since December 1, 1998.3 month : Disseminated Since December 1, 1998.